Outlook for the U.S. Livestock and Poultry Sectors in 2011 Presented By Shayle D. Shagam World...
47
Outlook for the U.S. Livestock and Poultry Sectors in 2011 Presented By Shayle D. Shagam World Agricultural Outlook Board, USDA USDA Outlook Forum Washington, D.C. February 25, 2011
-
Upload
maryann-oconnor -
Category
Documents
-
view
218 -
download
1
Transcript of Outlook for the U.S. Livestock and Poultry Sectors in 2011 Presented By Shayle D. Shagam World...
Outlook for the U.S. Livestock and Poultry
Sectors in 2011
Presented By
Shayle D. Shagam
World Agricultural Outlook Board, USDA
USDA Outlook Forum
Washington, D.C.
February 25, 2011
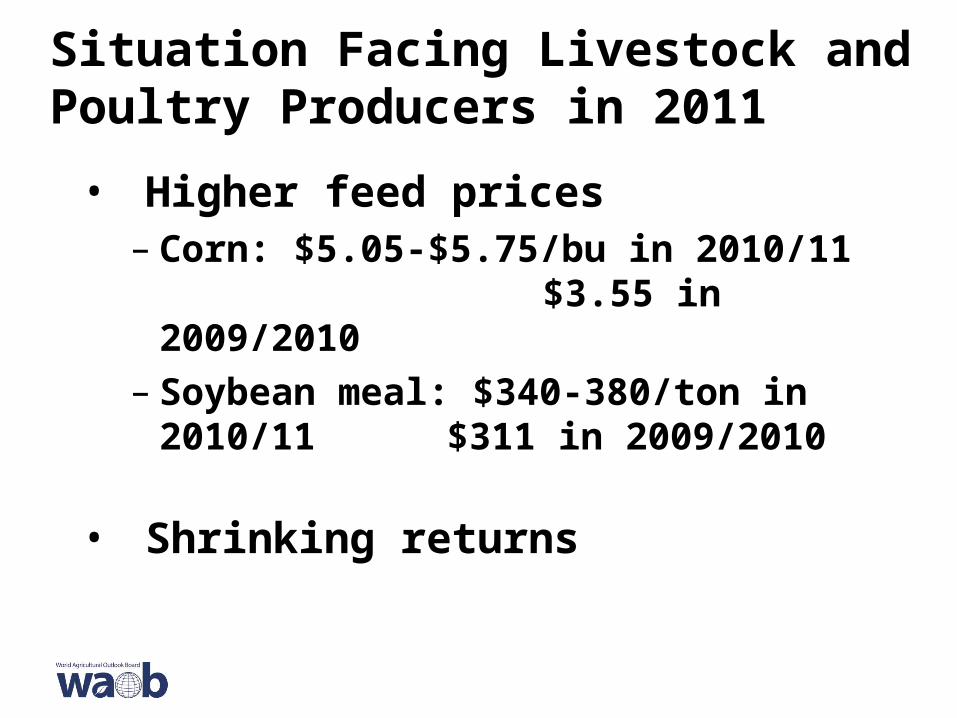
Situation Facing Livestock and Poultry Producers in 2011
• Higher feed prices– Corn: $5.05-$5.75/bu in 2010/11
$3.55 in 2009/2010 – Soybean meal: $340-380/ton in 2010/11
$311 in 2009/2010
• Shrinking returns

Higher Feed Bites into Gains from Livestock and Poultry Prices
0
10
20
30
40
50
60
2001 2003 2005 2007 2009 2011*
Rat
io
Cattle/Corn Hog/Corn Broiler/Feed* Forecast
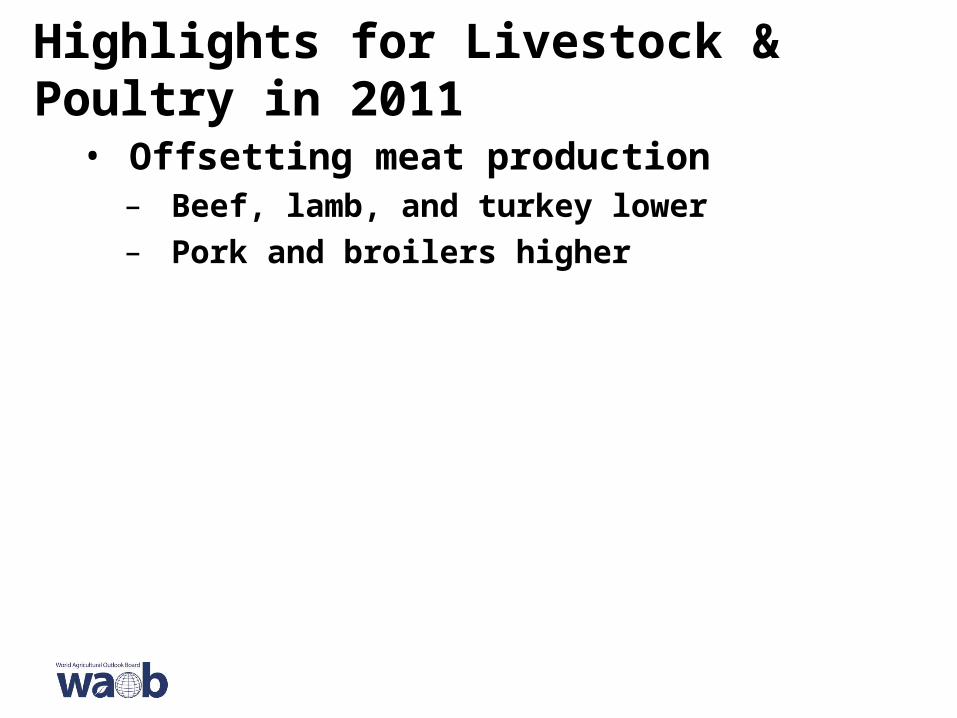
Highlights for Livestock & Poultry in 2011
• Offsetting meat production– Beef, lamb, and turkey lower– Pork and broilers higher
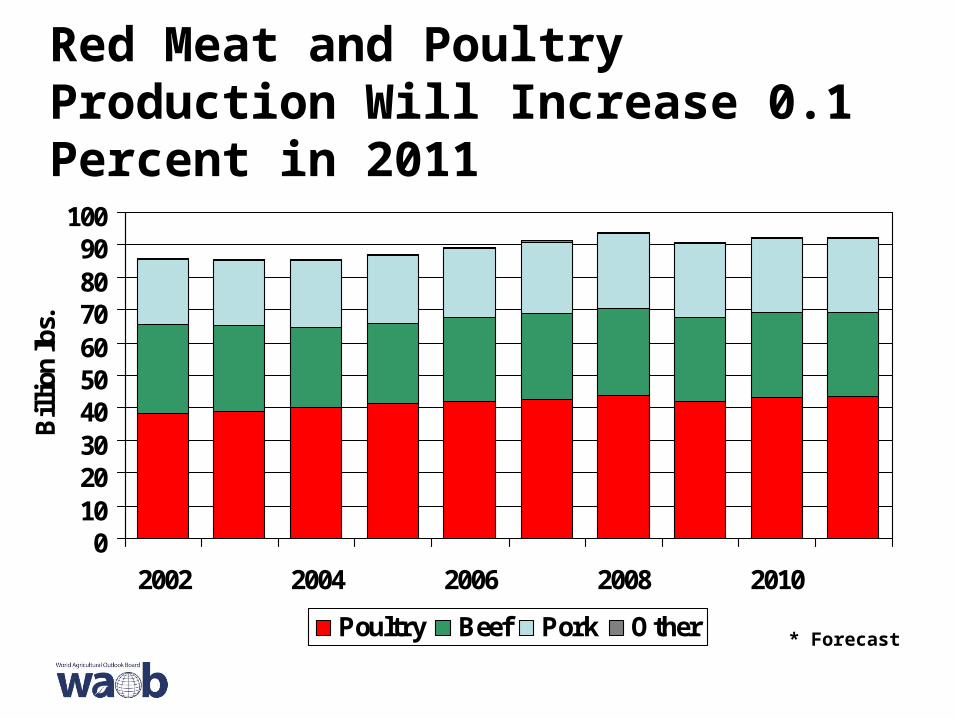
Red Meat and Poultry Production Will Increase 0.1 Percent in 2011
0102030405060708090
100
2002 2004 2006 2008 2010
Bil
lion
lbs.
Poultry Beef Pork Other * Forecast

Highlights for Livestock & Poultry in 2011
• Offsetting meat production
• Stronger red meat exports but weaker broiler exports
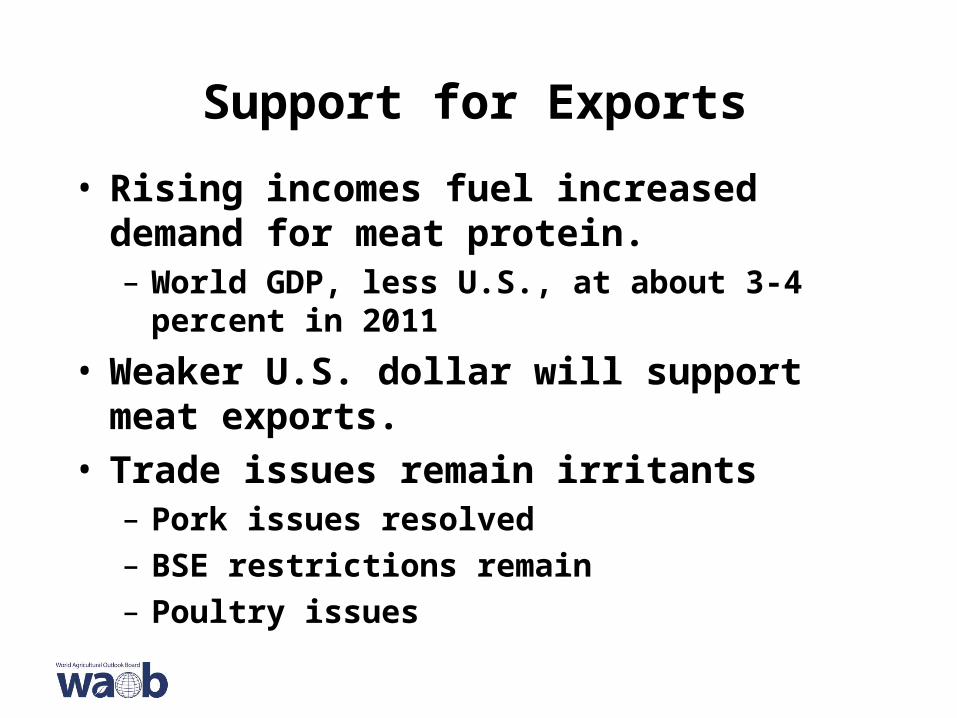
Support for Exports
• Rising incomes fuel increased demand for meat protein. – World GDP, less U.S., at about 3-4 percent in
2011
• Weaker U.S. dollar will support meat exports.
• Trade issues remain irritants– Pork issues resolved– BSE restrictions remain– Poultry issues
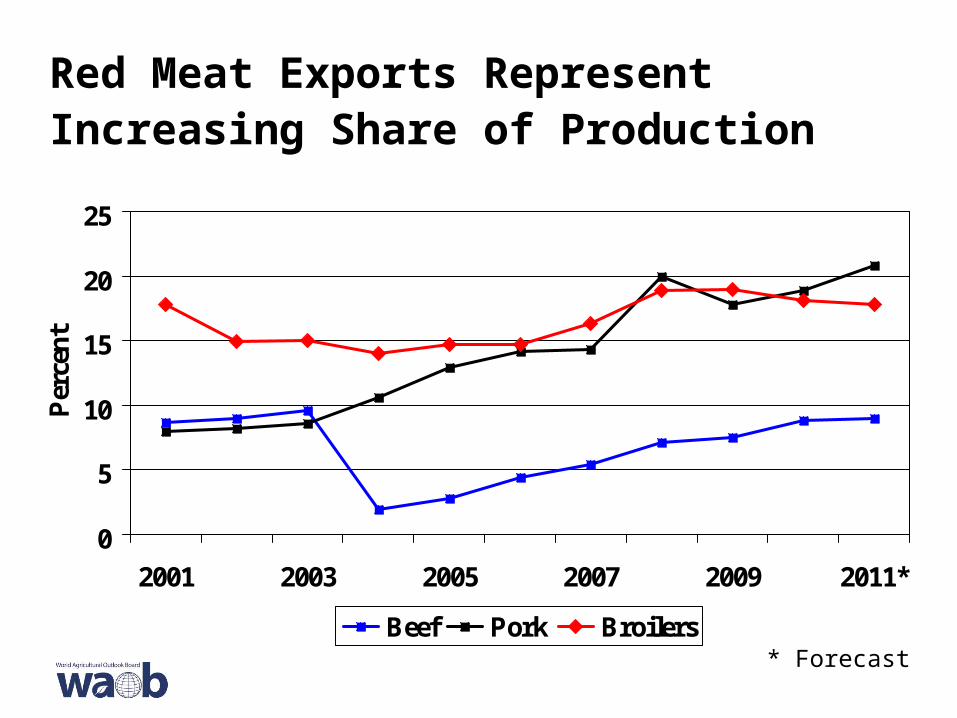
Red Meat Exports Represent Increasing Share of Production
0
5
10
15
20
25
2001 2003 2005 2007 2009 2011*
Per
cen
t
Beef Pork Broilers* Forecast
Highlights for Livestock & Poultry in 2011
• Offsetting meat production
• Stronger red meat exports but weaker broiler exports
• Domestic supply impacts mixed– Larger broiler meat net supplies– Smaller beef, pork, and turkey net supplies
• Gradual economic improvement– U.S. GDP growth about 3 percent– Unemployment gradually declining

Total Per Capita Retail Basis Meat Disappearance in 2011 at 207 Pounds
40
50
60
70
80
90
Pou
nds
per
capi
ta
Beef Pork Broilers* Forecast
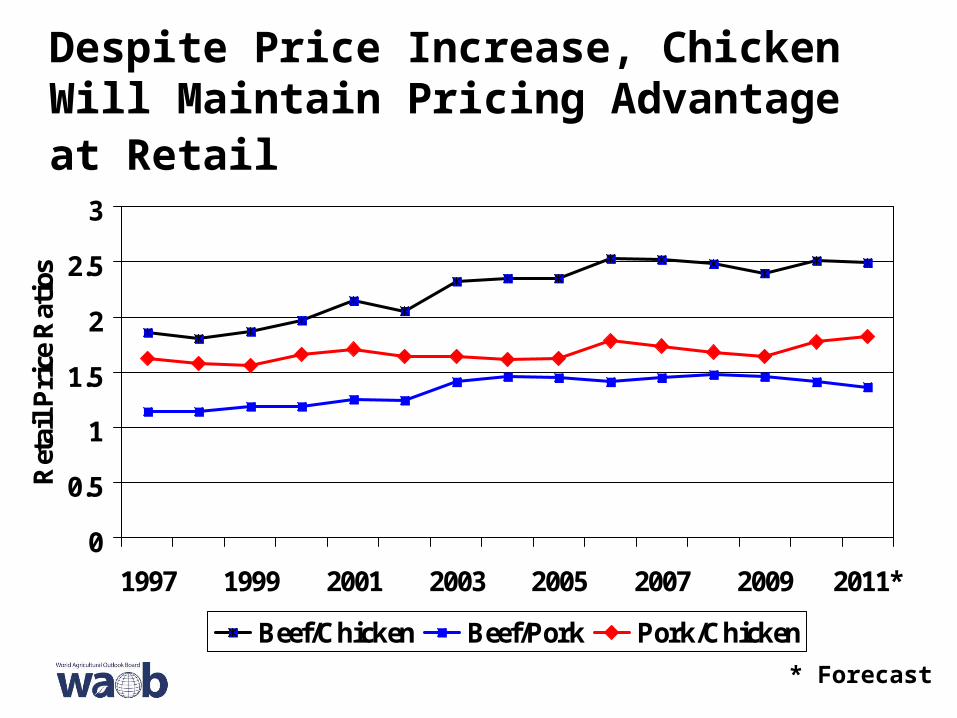
Despite Price Increase, Chicken Will Maintain Pricing Advantage at Retail
0
0.5
1
1.5
2
2.5
3
1997 1999 2001 2003 2005 2007 2009 2011*
Ret
ail P
rice
Rat
ios
Beef/Chicken Beef/Pork Pork/Chicken
* Forecast
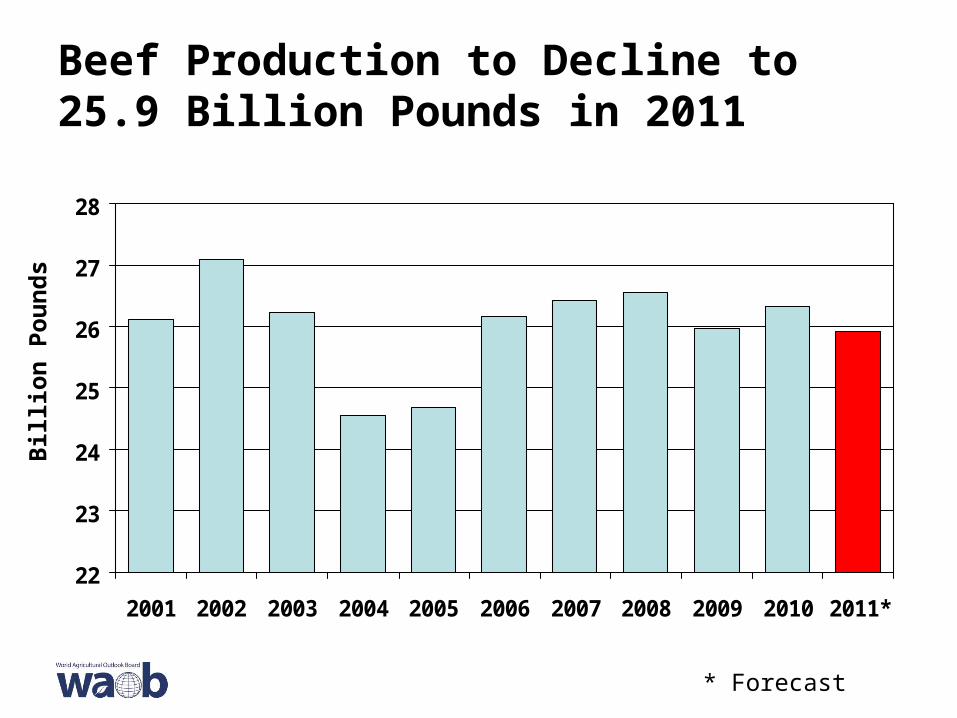
Beef Production to Decline to 25.9 Billion Pounds in 2011
22
23
24
25
26
27
28
2001 2002 2003 2004 2005 2006 2007 2008 2009 2010 2011*
Bil
lio
n P
ou
nd
s
* Forecast
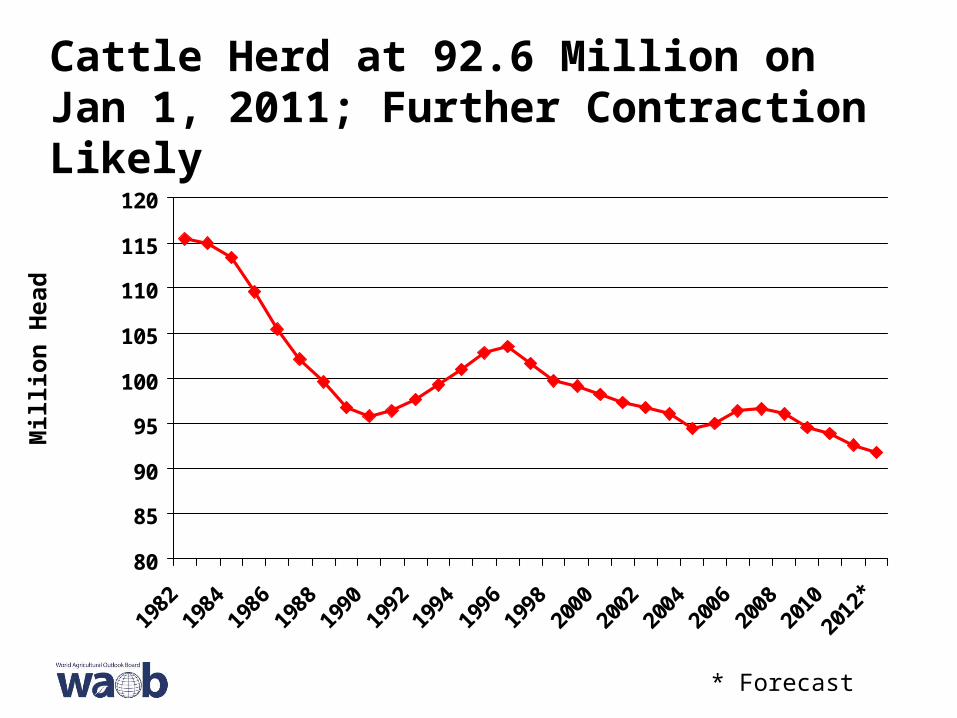
Cattle Herd at 92.6 Million on Jan 1, 2011; Further Contraction Likely
80
85
90
95
100
105
110
115
120
1982
1984
1986
1988
1990
1992
1994
1996
1998
2000
2002
2004
2006
2008
2010
2012
*
Mil
lio
n H
ead
* Forecast
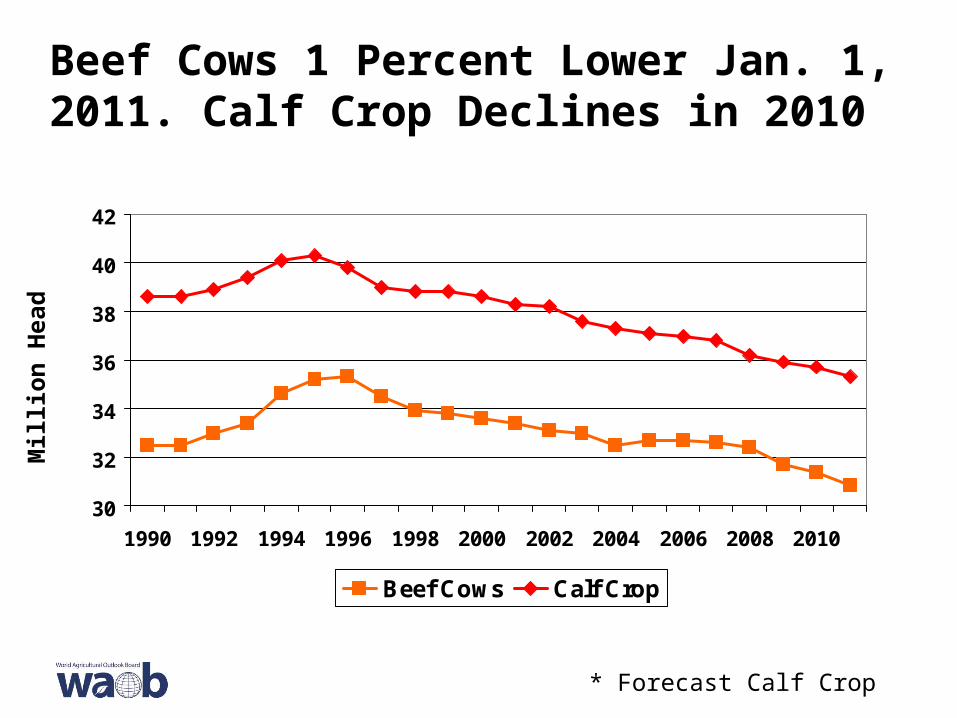
Beef Cows 1 Percent Lower Jan. 1, 2011. Calf Crop Declines in 2010
30
32
34
36
38
40
42
1990 1992 1994 1996 1998 2000 2002 2004 2006 2008 2010
Beef Cows Calf Crop
Mil
lio
n H
ead
* Forecast Calf Crop
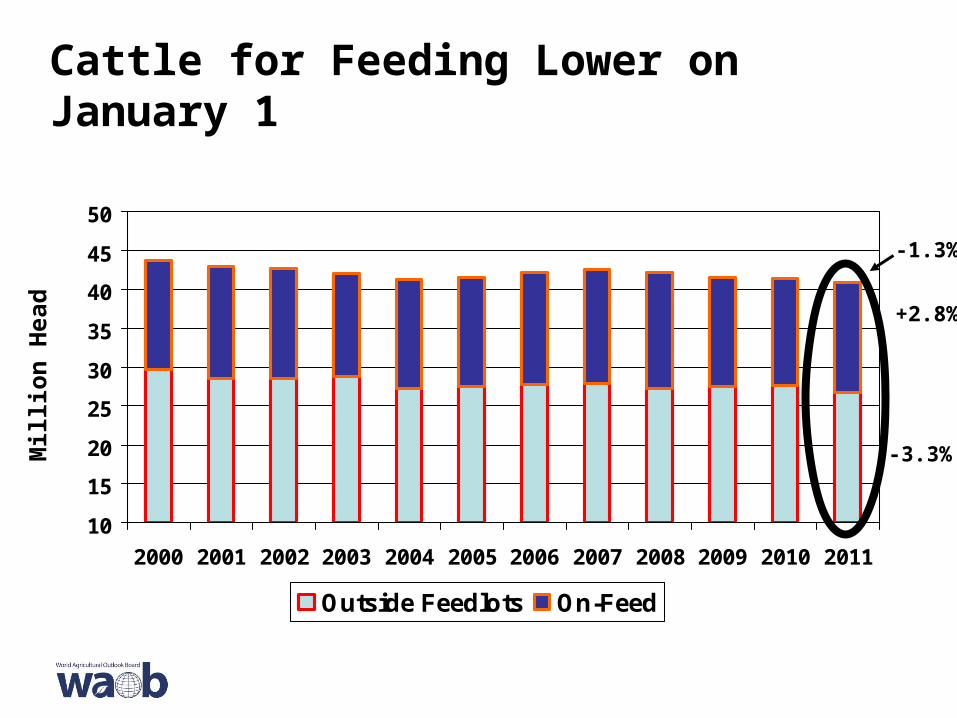
10
15
20
25
30
35
40
45
50
2000 2001 2002 2003 2004 2005 2006 2007 2008 2009 2010 2011
Outside Feedlots On-Feed
Cattle for Feeding Lower on January 1M
illi
on
Hea
d
-3.3%
+2.8%
-1.3%
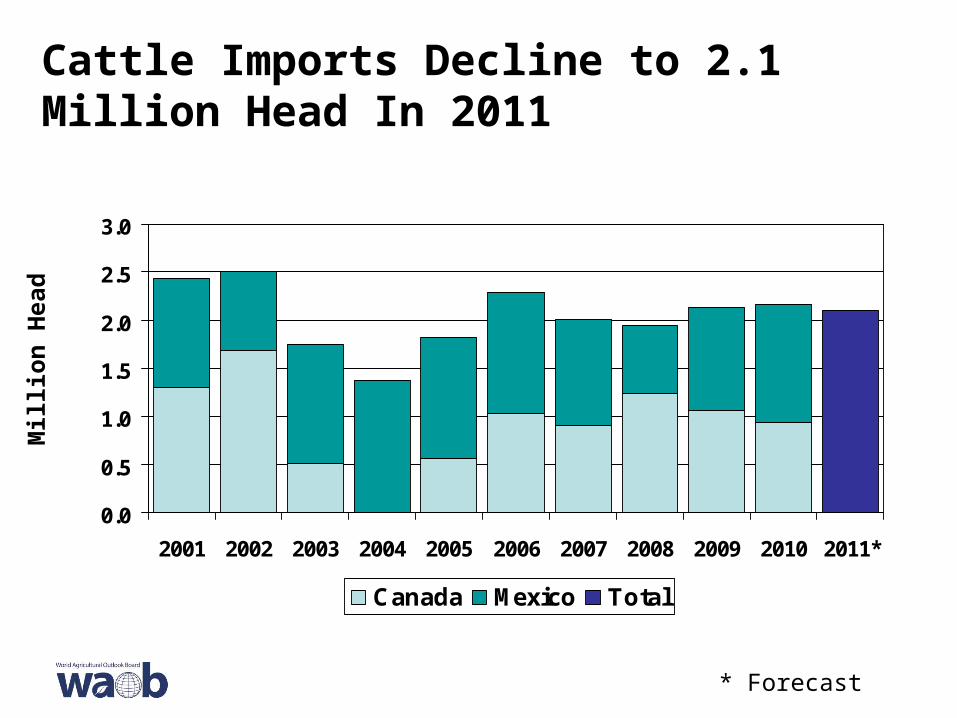
Cattle Imports Decline to 2.1 Million Head In 2011
0.0
0.5
1.0
1.5
2.0
2.5
3.0
2001 2002 2003 2004 2005 2006 2007 2008 2009 2010 2011*
Canada Mexico Total
* Forecast
Mil
lio
n H
ead
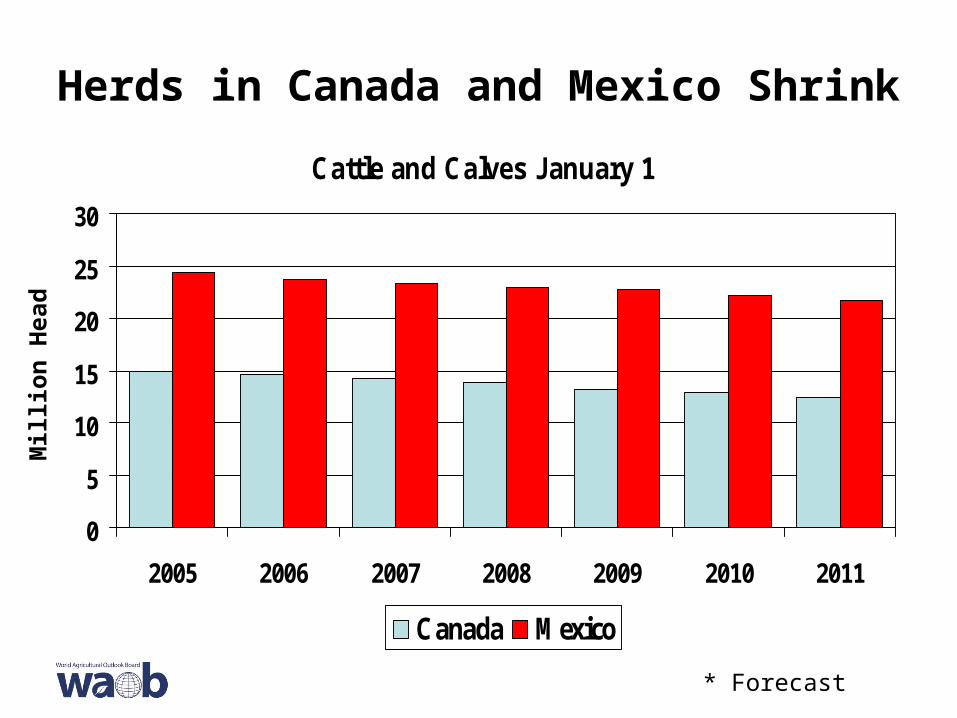
Herds in Canada and Mexico Shrink
Cattle and Calves January 1
0
5
10
15
20
25
30
2005 2006 2007 2008 2009 2010 2011
Canada Mexico
Mil
lio
n H
ead
* Forecast

Average Cattle Carcass Weights Recover to Near Record in 2011
720
730
740
750
760
770
780
790
2001 2002 2003 2004 2005 2006 2007 2008 2009 2010 2011*
* Forecast
Po
un
ds

Beef Exports Increase 2 Percent to 2.4 Billion Pounds
0.0
0.5
1.0
1.5
2.0
2.5
3.0
3.5
4.0
2001 2002 2003 2004 2005 2006 2007 2008 2009 2010 2011*
Exports
* Forecast
Bil
lio
n P
ou
nd
s

2011 Exports Remain Below 2003
0.0
0.5
1.0
1.5
2.0
2.5
2005 2006 2007 2008 2009 2010 2011*
Bil
lio
n p
ou
nd
s
Mexico Canada Japan South Korea Vietnam Other
* Forecast
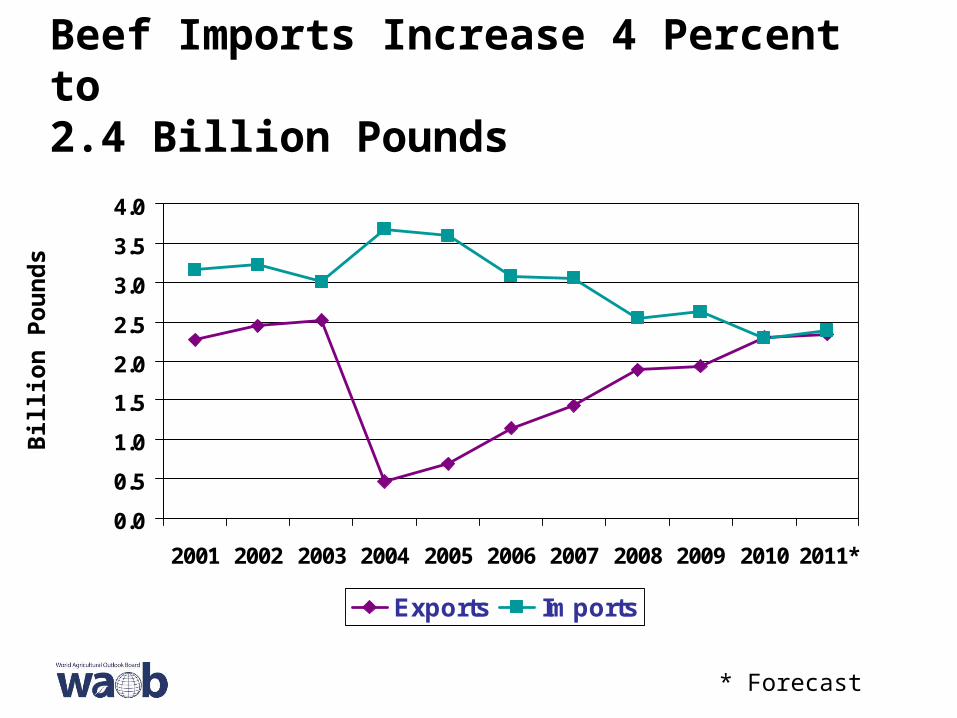
Beef Imports Increase 4 Percent to 2.4 Billion Pounds
0.0
0.5
1.0
1.5
2.0
2.5
3.0
3.5
4.0
2001 2002 2003 2004 2005 2006 2007 2008 2009 2010 2011*
Exports Imports
* Forecast
Bil
lio
n P
ou
nd
s
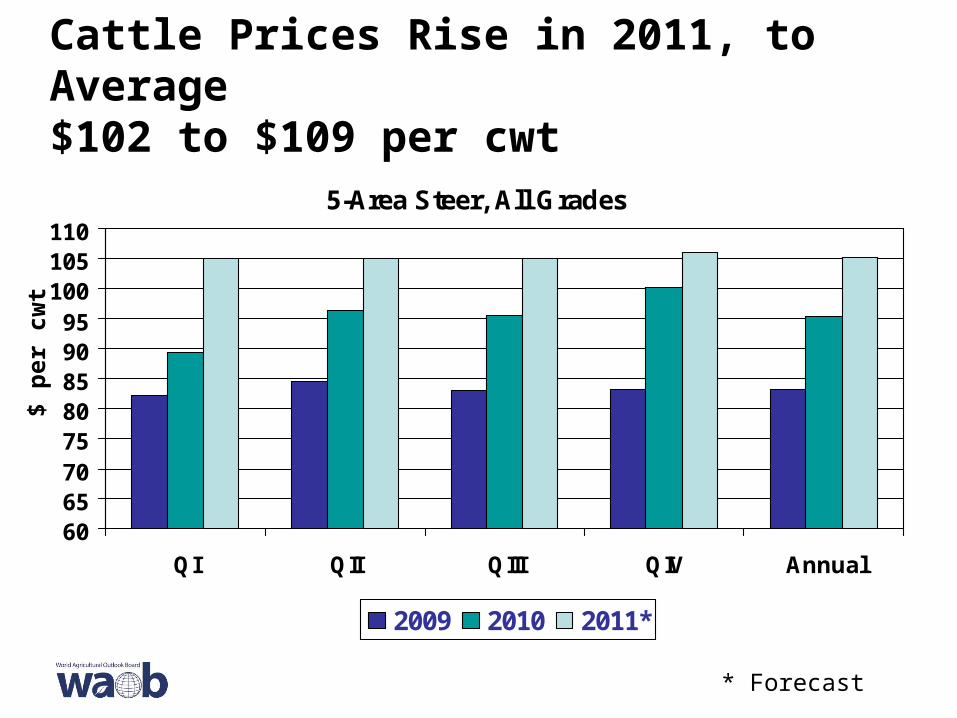
Cattle Prices Rise in 2011, to Average$102 to $109 per cwt
5-Area Steer, All Grades
6065707580859095
100105110
QI QII QIII QIV Annual
2009 2010 2011*
* Forecast
$ p
er c
wt
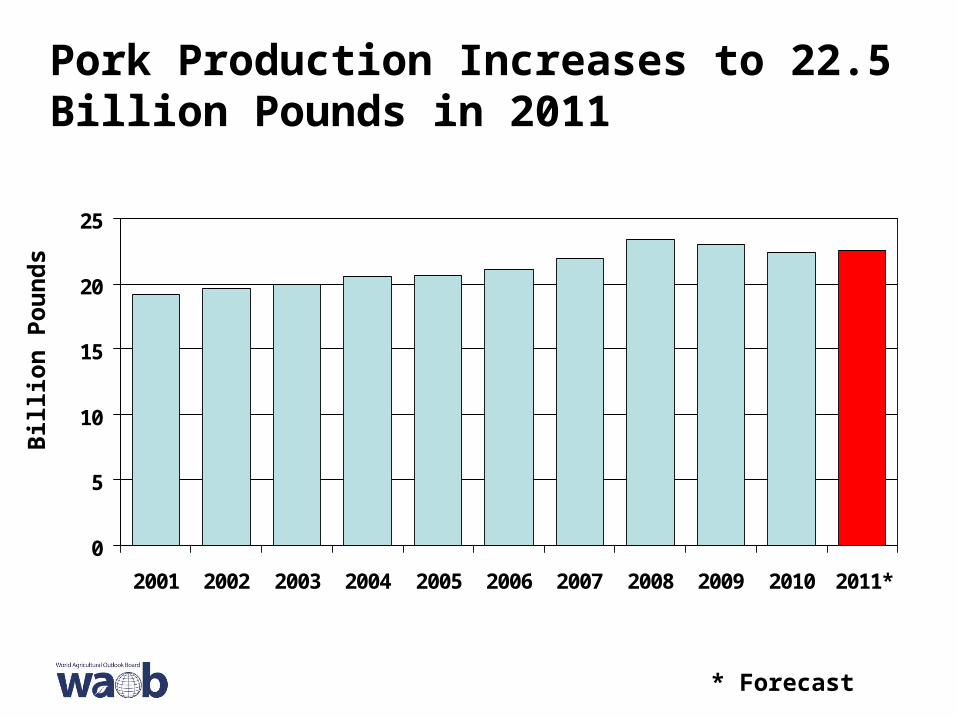
Pork Production Increases to 22.5 Billion Pounds in 2011
0
5
10
15
20
25
2001 2002 2003 2004 2005 2006 2007 2008 2009 2010 2011*
* Forecast
Bil
lio
n P
ou
nd
s
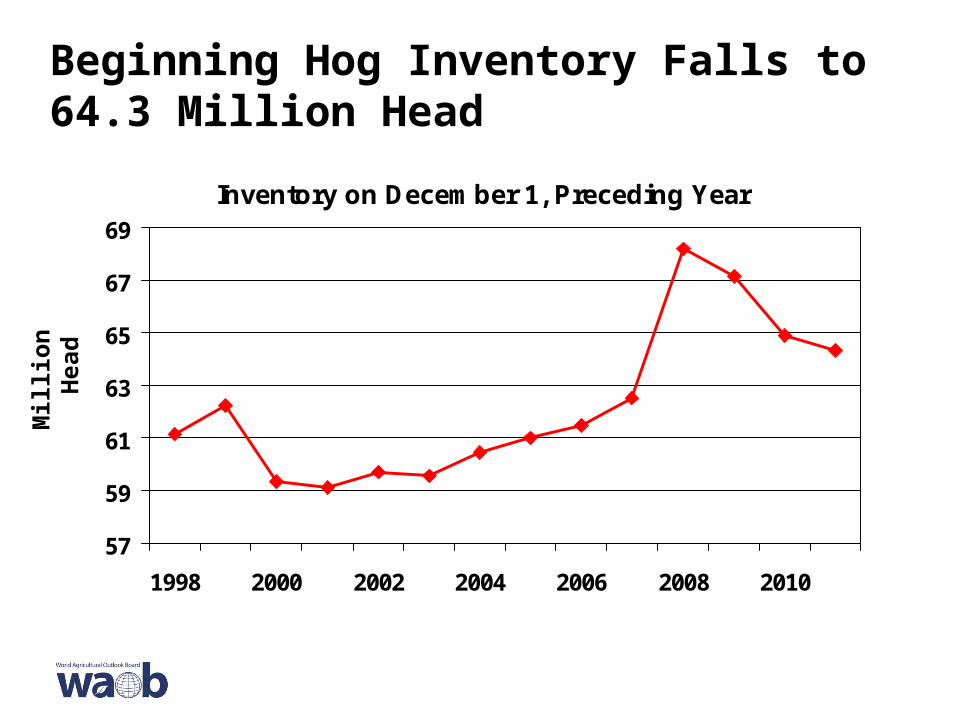
Beginning Hog Inventory Falls to 64.3 Million Head
Inventory on December 1, Preceding Year
57
59
61
63
65
67
69
1998 2000 2002 2004 2006 2008 2010
Mil
lio
n H
ead

Sows Farrowing Expected to Stabilize in Late 2011
2.5
2.6
2.7
2.8
2.9
3.0
3.1
QI QII QIII QIV
2009 2010 2011*
* Quarters 1-2 NASS Reported , Quarters 3-4 Forecast
Mil
lio
n H
ead
-0.6%-2.3% -0.6%
+0.1%
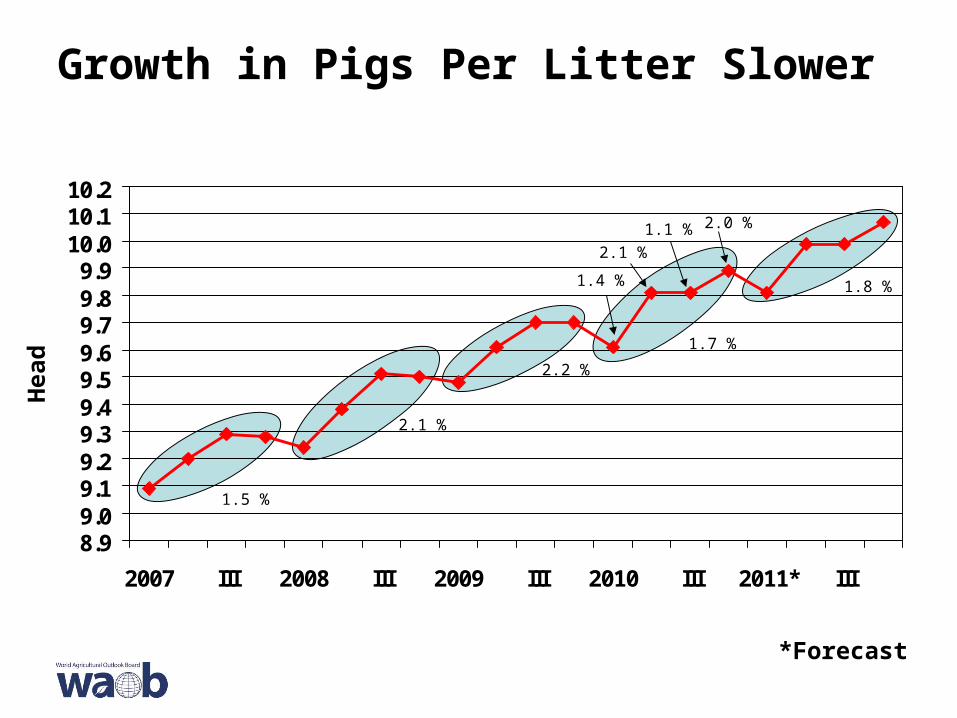
8.99.09.19.29.39.49.59.69.79.89.9
10.010.110.2
2007 III 2008 III 2009 III 2010 III 2011* III
Growth in Pigs Per Litter Slower
*Forecast
Hea
d
2.2 %
1.7 %
1.5 %
2.1 %
1.8 %
2.1 %
1.1 % 2.0 %
1.4 %

Hog Imports at 5.8 Million Head in 2011
0
2
4
6
8
10
12
2001 2002 2003 2004 2005 2006 2007 2008 2009 2010 2011*
Feeders Other Total
* Forecast
Mil
lio
n H
ead
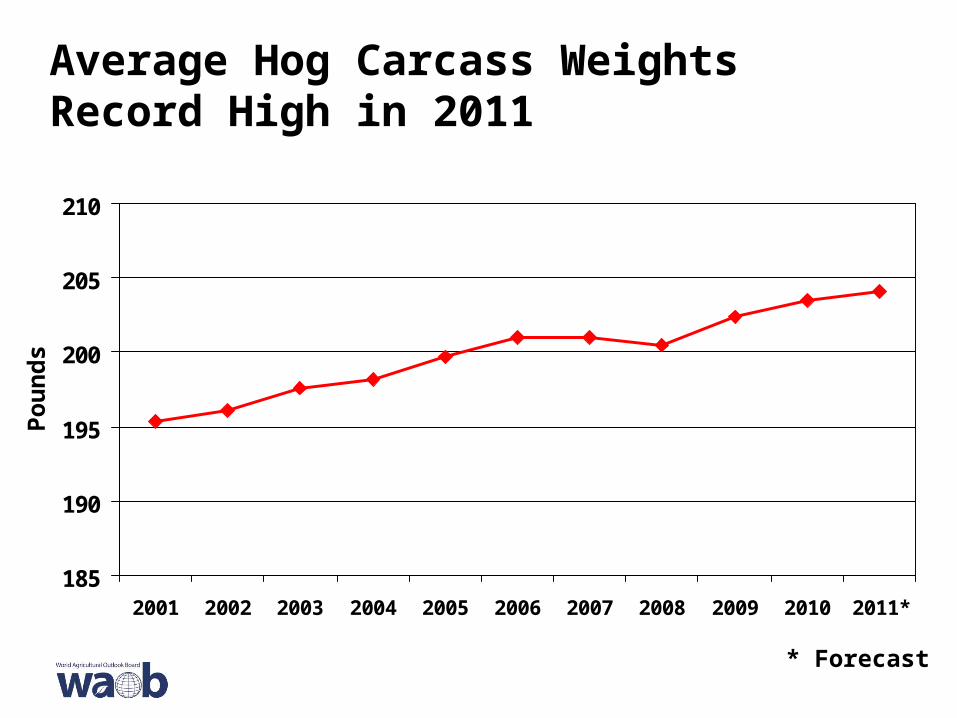
Average Hog Carcass Weights Record High in 2011
185
190
195
200
205
210
2001 2002 2003 2004 2005 2006 2007 2008 2009 2010 2011*
* Forecast
Po
un
ds
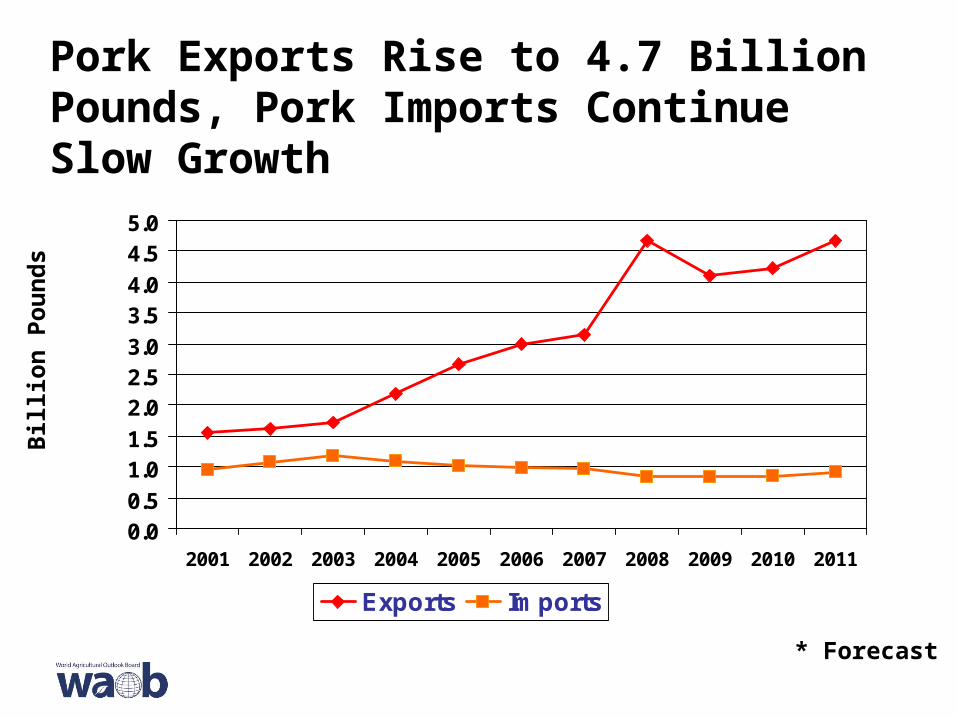
Pork Exports Rise to 4.7 Billion Pounds, Pork Imports Continue Slow Growth
0.00.5
1.01.5
2.02.53.0
3.54.0
4.55.0
2001 2002 2003 2004 2005 2006 2007 2008 2009 2010 2011
Exports Imports
* Forecast
Bil
lio
n P
ou
nd
s

2011 Pork Exports Record High
00.5
11.5
22.5
33.5
44.5
5
2005 2006 2007 2008 2009 2010 2011*
Bil
lio
n l
bs.
Japan Mexico Canada South Korea China/H.K. Other
* Forecast
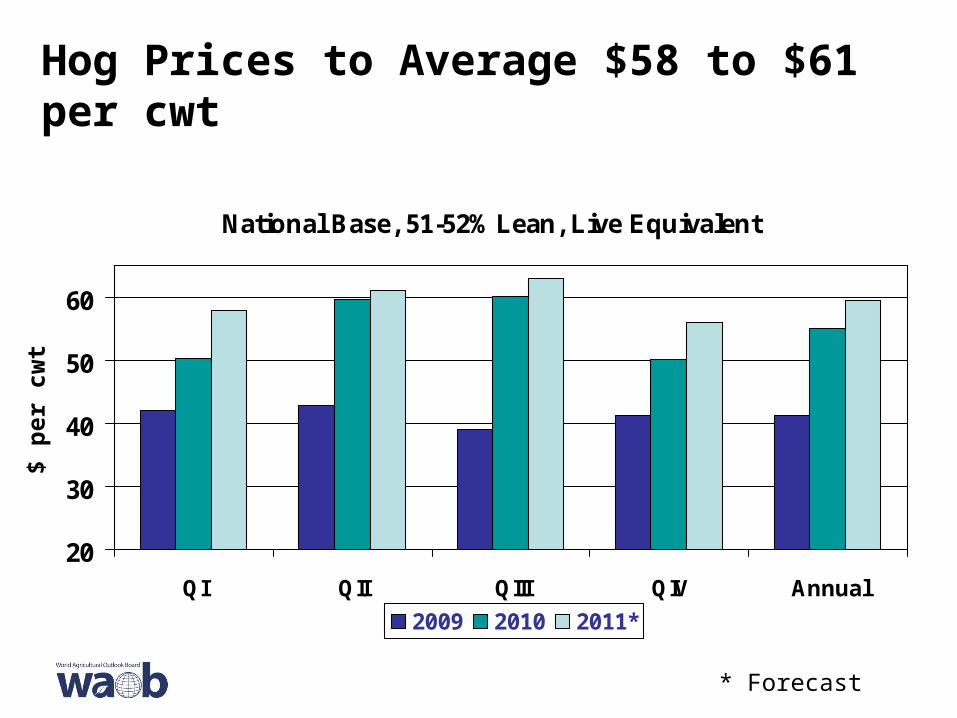
Hog Prices to Average $58 to $61 per cwt
National Base, 51-52% Lean, Live Equivalent
20
30
40
50
60
QI QII QIII QIV Annual
2009 2010 2011*
* Forecast
$ p
er c
wt

Broiler Meat Production Record High in 2011
15
20
25
30
35
40
2001
2002
2003
2004
2005
2006
2007
2008
2009
2010
2011
*
Bil
lio
n l
bs.
* Forecast
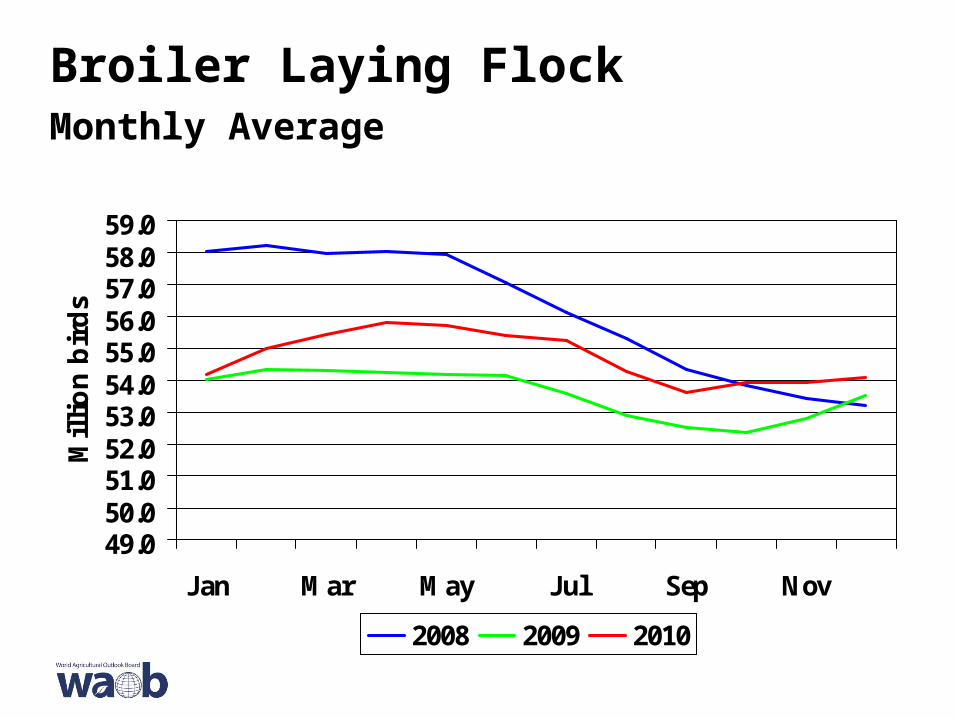
Broiler Laying FlockMonthly Average
49.050.051.052.053.054.055.056.057.058.059.0
Jan Mar May Jul Sep Nov
Mil
lio
n b
ird
s
2008 2009 2010
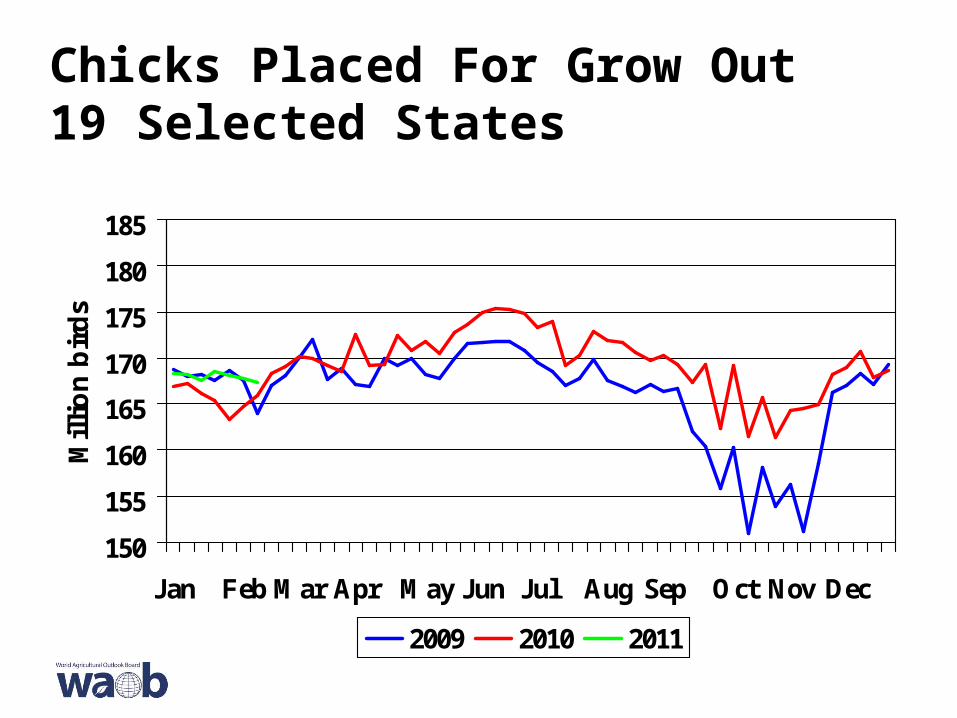
Chicks Placed For Grow Out19 Selected States
150
155
160
165
170
175
180
185
Jan Feb Mar Apr May Jun Jul Aug Sep Oct Nov Dec
Mil
lio
n b
ird
s
2009 2010 2011
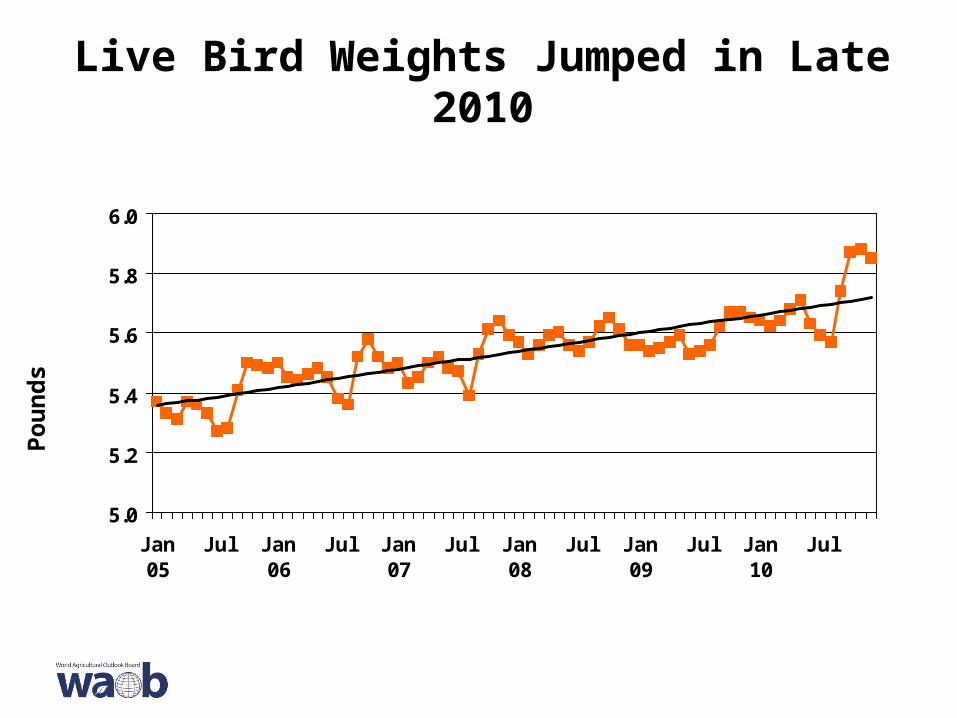
Live Bird Weights Jumped in Late 2010
5.0
5.2
5.4
5.6
5.8
6.0
Jan05
Jul Jan06
Jul Jan07
Jul Jan08
Jul Jan09
Jul Jan10
Jul
Po
un
ds
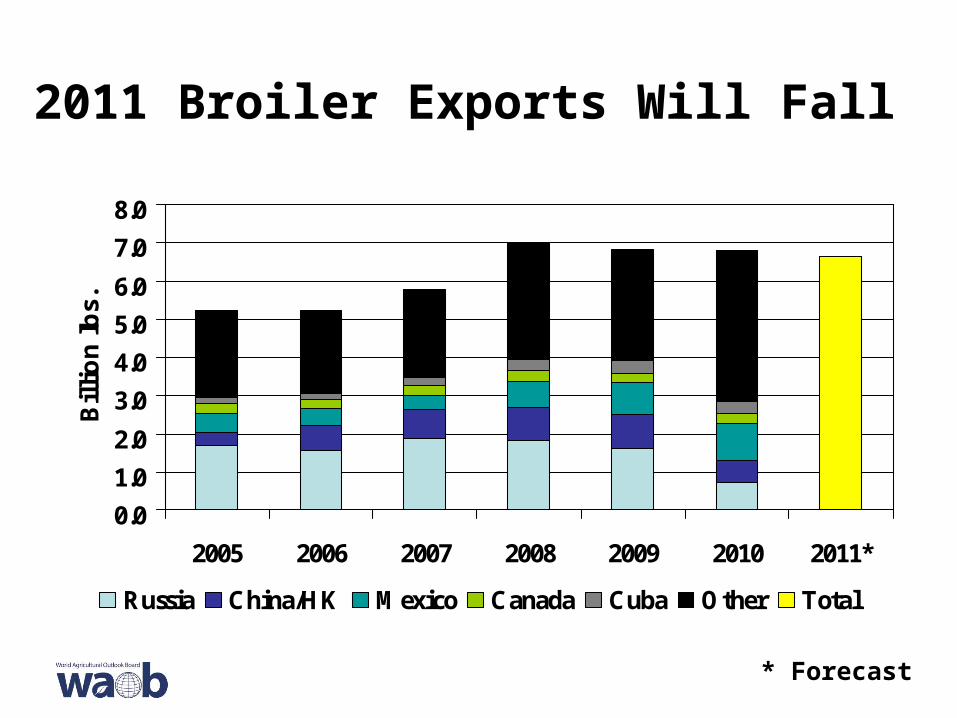
2011 Broiler Exports Will Fall
0.0
1.0
2.0
3.0
4.0
5.0
6.0
7.0
8.0
2005 2006 2007 2008 2009 2010 2011*
Bil
lio
n l
bs.
Russia China/HK Mexico Canada Cuba Other Total
* Forecast
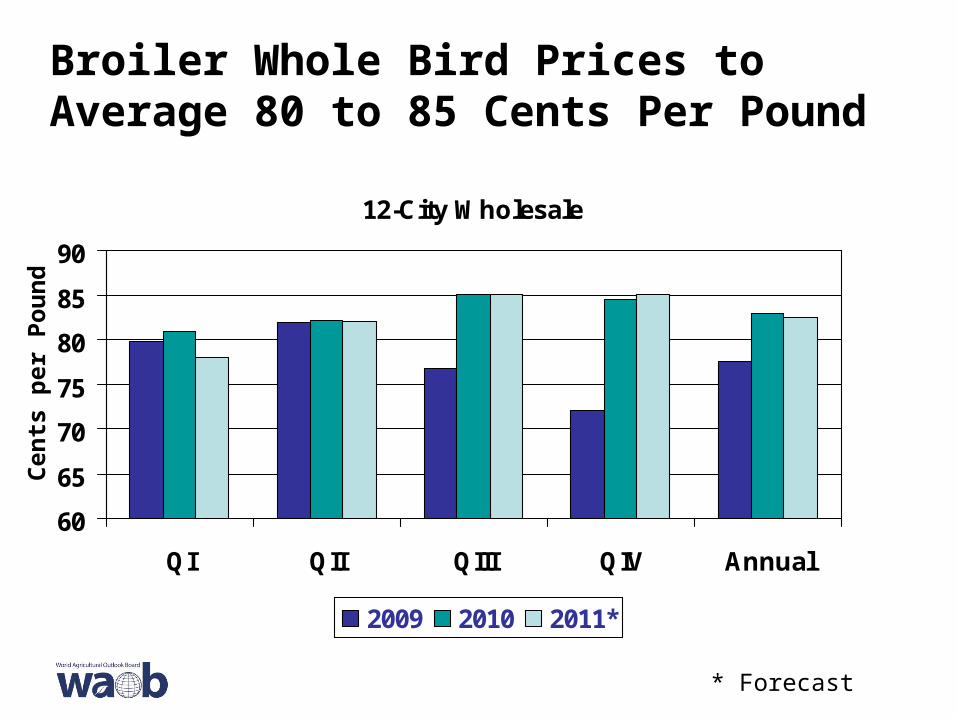
Broiler Whole Bird Prices to Average 80 to 85 Cents Per Pound
12-City Wholesale
60
65
70
75
80
85
90
QI QII QIII QIV Annual
2009 2010 2011*
* Forecast
Cen
ts p
er P
ou
nd
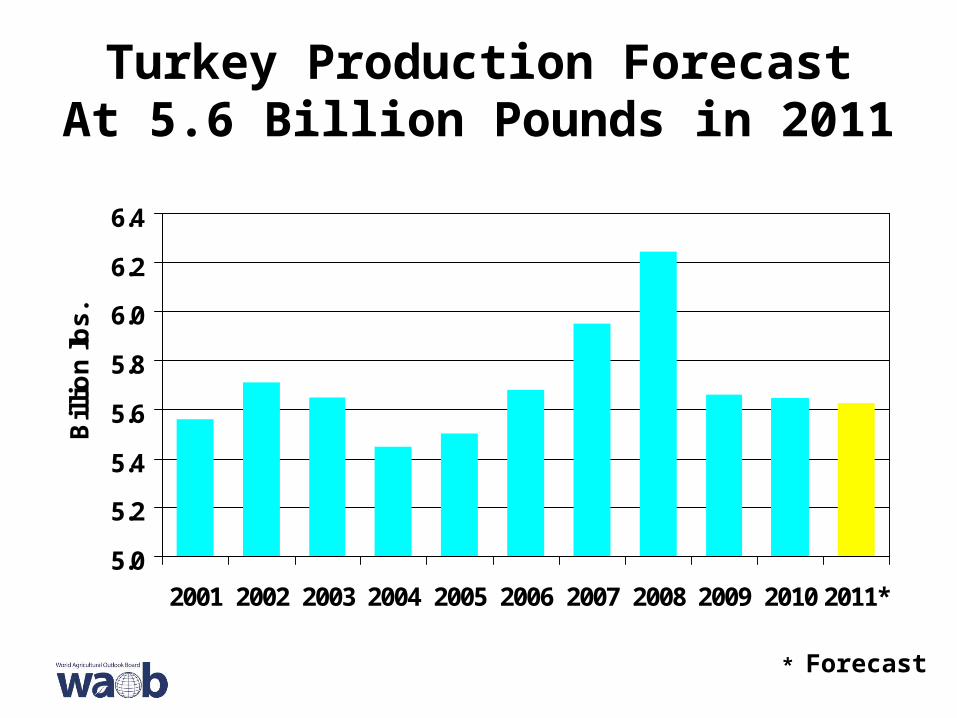
Turkey Production ForecastAt 5.6 Billion Pounds in 2011
5.0
5.2
5.4
5.6
5.8
6.0
6.2
6.4
2001 2002 2003 2004 2005 2006 2007 2008 2009 2010 2011*
Bil
lio
n l
bs.
* Forecast
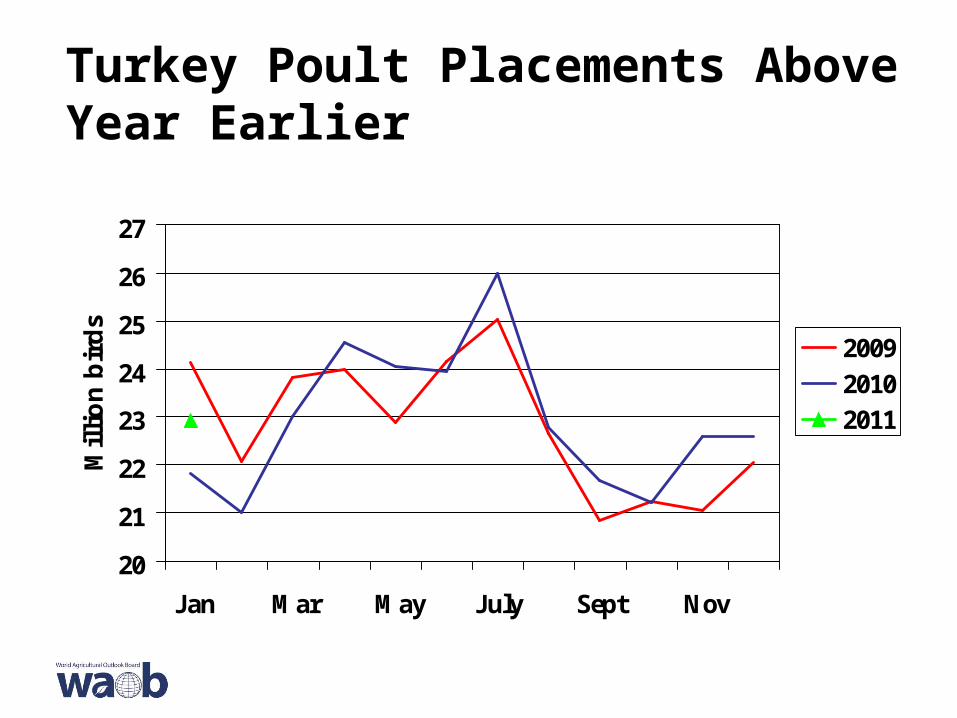
Turkey Poult Placements AboveYear Earlier
20
21
22
23
24
25
26
27
Jan Mar May July Sept Nov
Mil
lio
n b
ird
s
2009
2010
2011
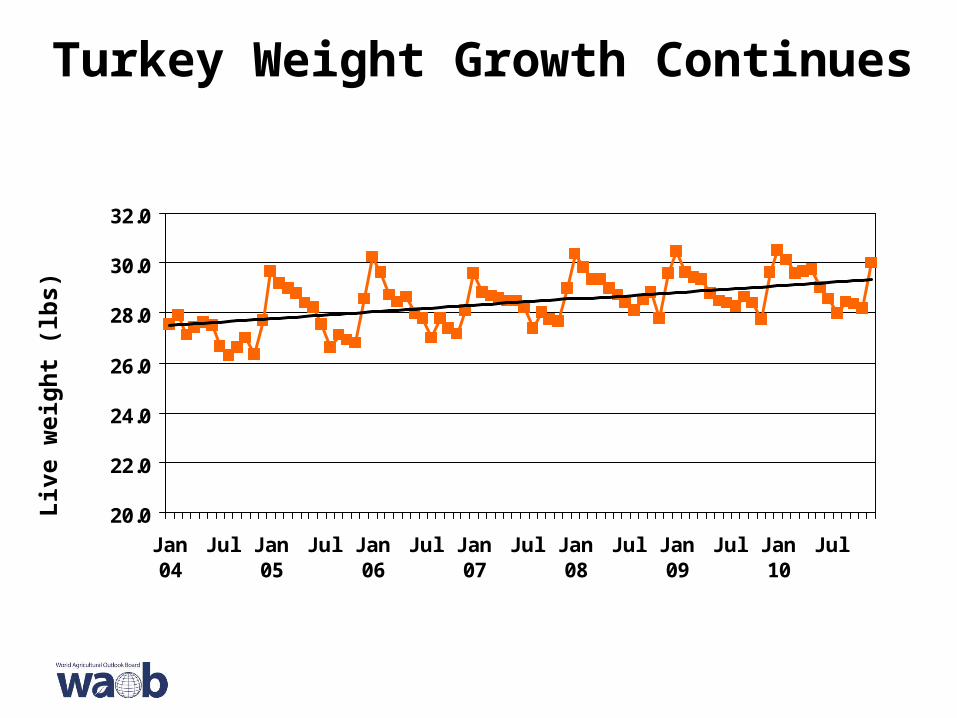
Turkey Weight Growth Continues
20.0
22.0
24.0
26.0
28.0
30.0
32.0
Jan04
Jul Jan05
Jul Jan06
Jul Jan07
Jul Jan08
Jul Jan09
Jul Jan10
Jul
Liv
e w
eig
ht
(lb
s)
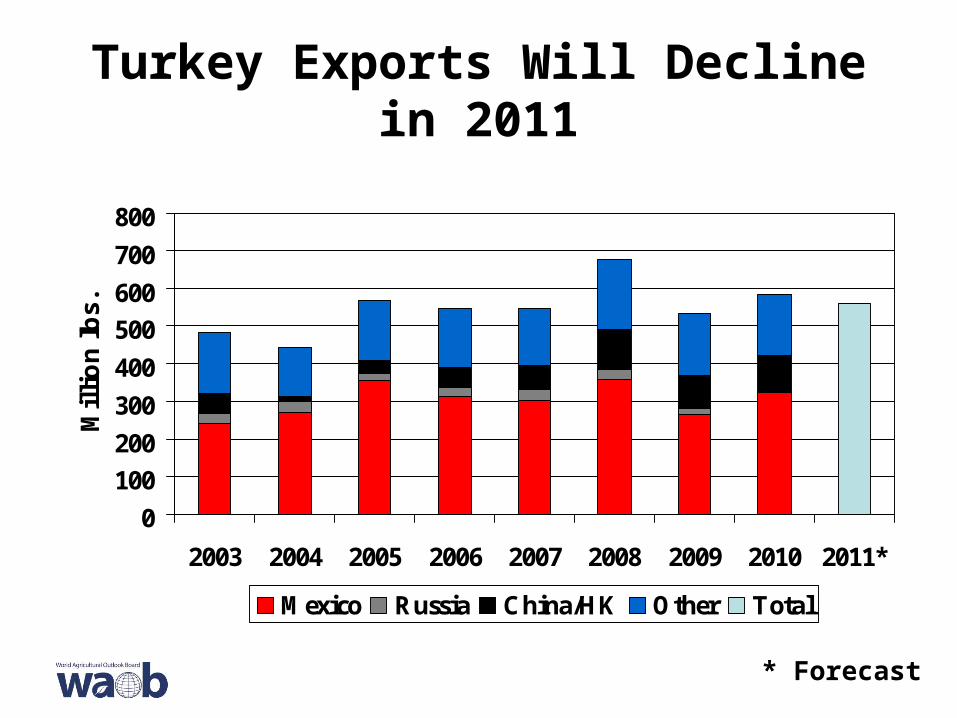
Turkey Exports Will Decline in 2011
0
100
200
300
400
500
600
700
800
2003 2004 2005 2006 2007 2008 2009 2010 2011*
Mil
lio
n l
bs.
Mexico Russia China/HK Other Total
* Forecast
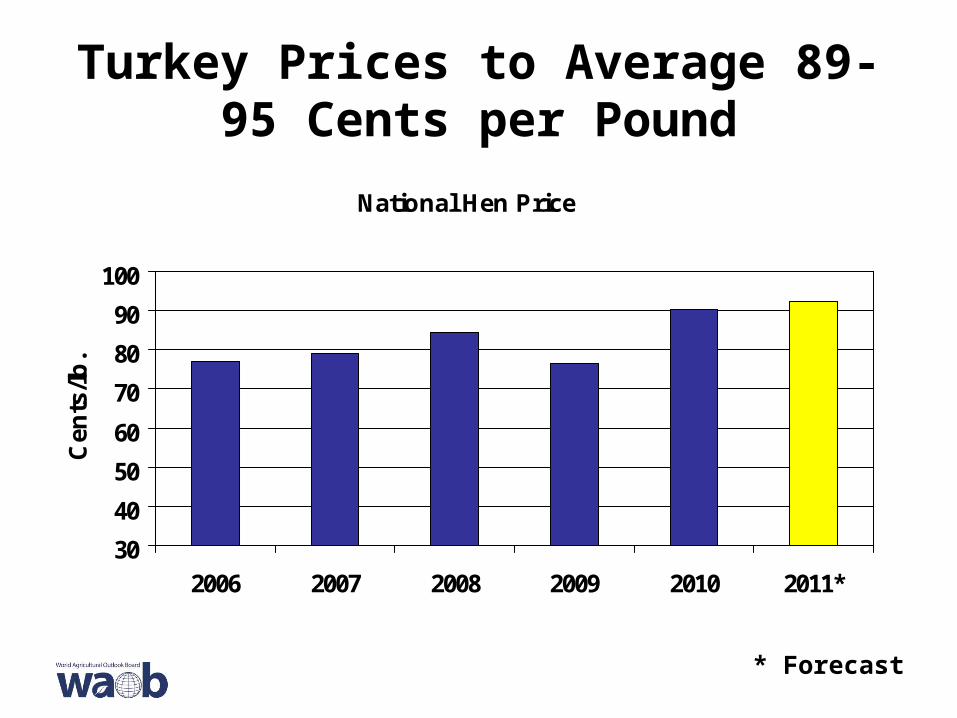
Turkey Prices to Average 89-95 Cents per Pound
National Hen Price
30
40
50
60
70
80
90
100
2006 2007 2008 2009 2010 2011*
Cen
ts/l
b.
* Forecast
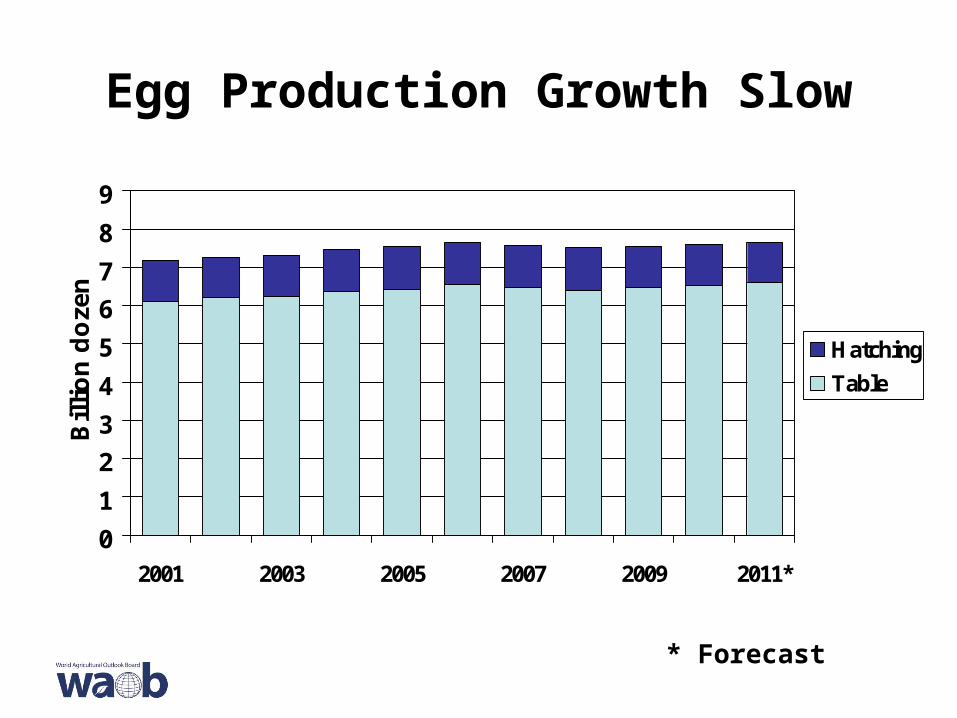
Egg Production Growth Slow
0
1
2
3
4
5
6
7
8
9
2001 2003 2005 2007 2009 2011*
Bil
lio
n d
oze
n
Hatching
Table
* Forecast
Table Egg Laying FlockMonthly Average
272.0
274.0
276.0
278.0
280.0
282.0
284.0
286.0
Jan Mar May Jul Sep Nov
Mil
lio
n b
ird
s
2008 2009 2010

Egg Prices Will Decline
N.Y. Wholesale Price - Large Eggs
30405060708090
100110120130140
2003 2004 2005 2006 2007 2008 2009 2010 2011*
Cen
ts/l
b.
* Forecast
Additional information about the 2011 outlook is available at the following websites:
• World Agricultural Outlook Board (WAOB)World Agricultural Supply and Demand Estimates– www.usda.gov/oce/commodity/wasde/index.htm
• Economic Research Service (ERS)Livestock, Dairy, and Poultry Situation and Outlook– www.ers.usda.gov/publications/ldp/
• Foreign Agricultural Service (FAS)Livestock and Poultry: World Markets and Trade– www.fas.usda.gov/dlp/livestock_poultry.asp