Outlook 022210 FINAL - corporate-ir. · PDF fileMaterial in this presentation contains...
158
Cooper Industries 2010 Outlook Meeting New York City February 23, 2010
Transcript of Outlook 022210 FINAL - corporate-ir. · PDF fileMaterial in this presentation contains...

Cooper Industries2010 Outlook Meeting
New York CityFebruary 23, 2010

Material in this presentation contains "forward-looking statements" within the meaning of the safe harbor provisions of the Private Securities Litigation Reform Act of 1995. These statements are not historical facts but instead represent only our beliefs regarding future events, many of which, by their nature, are inherently uncertain and outside of our control. It is possible that our actual results and financial condition may differ, possibly materially, from the anticipated results and the financial condition indicated in these forward-looking statements. For us, particular uncertainties that couldcause our actual results to be materially different than those expressed in our forward-looking statements include: market and economic conditions, competitive pressures, volatility of raw material, transportation and energy costs, our ability to develop and introduce new products, our ability to implement revenue growth plans and cost-reduction programs, mergers and acquisitions and their integration, implementation of manufacturing rationalization programs, changes in mix of products sold, changes in financial markets including currency exchange rate fluctuations, changes in legislation and regulations (including changes in tax laws), and the resolution of potential liabilities and insurance recoveries resulting from Pneumo-Abex related asbestos claims. A discussion of these factors may be found in the Company’s Annual Report on Form 10-K and other recent SEC filings.
A reconciliation of any non-GAAP financial measure included in this presentation to the most directly comparable GAAP measure can be accessed in the “Investors” section of the Cooper Industries website, www.cooperindustries.com.
This is a copyrighted presentation of Cooper Industries plc and is intended for the exclusive use of the participating audience. No other use of this presentation may be made without the express written consent of Cooper Industries.

Cooper Industries2010 Outlook Meeting
Kirk HachigianChairman & Chief Executive Officer
4
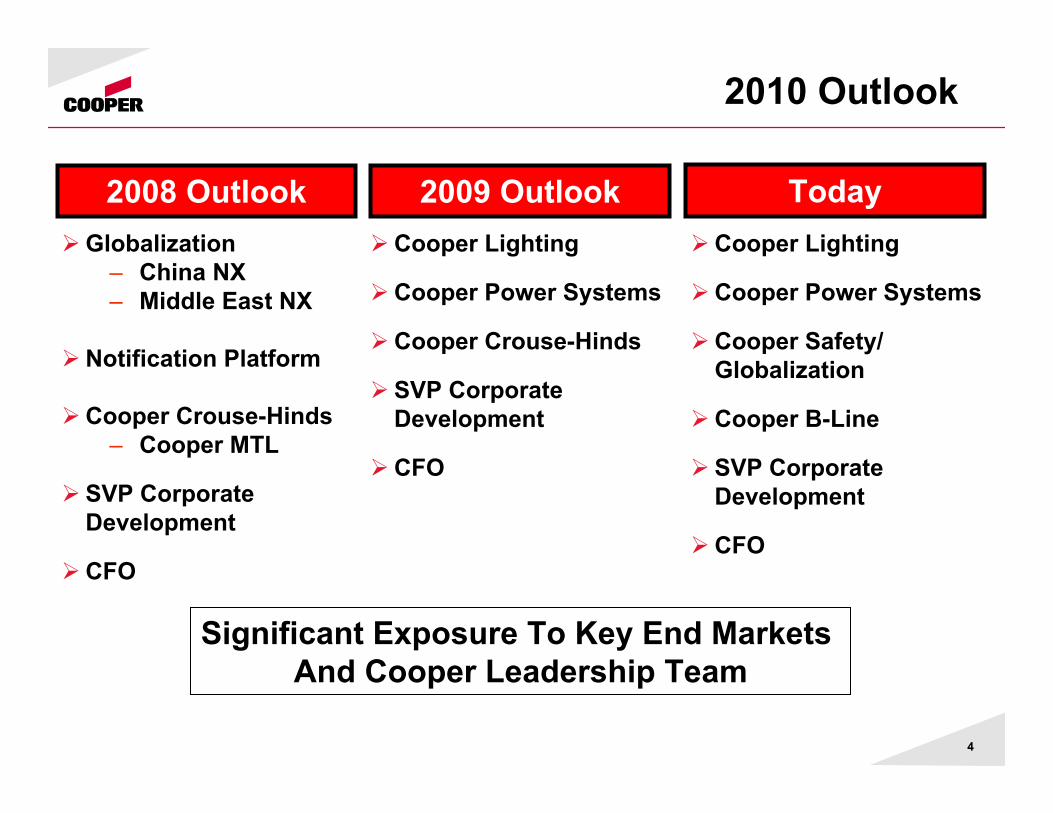
2010 Outlook
Cooper Lighting
Cooper Power Systems
Cooper Crouse-Hinds
SVP Corporate Development
CFO
Cooper Lighting
Cooper Power Systems
Cooper Safety/ Globalization
Cooper B-Line
SVP Corporate Development
CFO
Today
Significant Exposure To Key End Markets And Cooper Leadership Team
Globalization– China NX– Middle East NX
Notification Platform
Cooper Crouse-Hinds– Cooper MTL
SVP Corporate Development
CFO
2008 Outlook 2009 Outlook

5
Cooper Today Kirk Hachigian, Chairman & CEO
Cooper Lighting Neil Schrimsher, President
Cooper Power Systems Mike Stoessl, President
Cooper Safety/Globalization Grant Gawronski, VP Int’l.
Cooper B-Line Kevin Kissling, President
Innovation & M&A Tom O’Grady, SVP of Corp. Dev.
2010 Outlook Terry Klebe, SVP and CFO
Today’s Agenda
Summary Kirk Hachigian, Chairman & CEOSummary Kirk Hachigian, Chairman & CEO

Organization Update
Terry Klebe (CFO) to retire in 2010
Neil Schrimsher (Division President, Cooper Lighting) promoted to additional role of EVP Cooper Connection─ Mark Eubanks promoted to VP/GM of Cooper
Lighting
Grant Gawronski (VP International) promoted to Division President, Cooper Crouse-Hinds
Laura Ulz (VP Operations) promoted to Division President, Cooper Tools
Strong Internal Bench Allows Smooth Transition6

7
2009 HighlightsSales down 22%, adjusted EPS fell only 30%
Exited the year with Electrical margins of 15%+ and Tools’ margins of 8%+:– No cost headwinds in 2010 (pension/401K/furloughs)
Free cash flow of $633M, or 12% of sales (9th year FCF > recurring income):– Total working capital down 23% (inventory down
25%)– Net debt of $553M– Capital expenditures of $127M (vs. $137M last year)– Completed 3 acquisitions– Protected $1/share dividend
Exited 2009 with our highest new product vitality in many years with improved global platform
Exiting Toughest Economy In 50 Years Extremely Well Positioned

8
50.7%
7.1%10.8%
5.9%2.7%
40.4%
-0.9%
0.4%
26.5%
10 Years 5 Years 1 Year
8
Total Shareholder ReturnCompound Annual Return
For Annual Periods Ending December 31, 2009
Peer Group: Acuity; Danaher; Dover; Eaton; Emerson; Hubbell; Illinois Tool Works; Snap-On; Ingersoll-Rand; Newell Rubbermaid; Parker-Hannifin; Pentair; Stanley Works; SPX; Thomas & Betts
Cooper Delivers Consistent, Sustainable Long-Term Shareholder Returns
Cooper Peer GroupAvg.
S&P 500

9
Four Legs To Cooper’s Story
Core culture and values:– Who we are– How we behave– Culture of accountability
Build/acquire great businesses and brands
Execute our five business initiatives every day –process driven and sustainable performance
Maintain a conservative capital structure and invest for the long-term
Execute For Short-term ResultsWhile We Invest In Our Long-term Future
Execute For Short-term ResultsWhile We Invest In Our Long-term Future

10
CULTURE/VALUES
COOPER
INITIATIVES
Evolution Of Change
PEOPLE
Building A Leadership Team, Business Process AndCulture/Values To Drive Long-term Exceptional Performance
Building A Leadership Team, Business Process AndCulture/Values To Drive Long-term Exceptional Performance
GLOBAL BUSINESS PORTFOLIO
10

11
“Change” Redefines Cooper Industries
Spent $100M And Five Years Installing A Single Enterprise SystemStrengthened Our Portfolio To Sustain Higher Core Growth:– 61% Industrial/Utility – Built Strategic Growth Platforms To Penetrate New Markets– Expanded Internationally
Improved Customer Loyalty, Advanced New Product Development And Built An Industrial Training CenterLowered Our Fixed Cost Structure– LCC Sourcing − Value Engineering– Lean/Productivity − In-Sourcing
Assembled World-class Leadership TeamStrengthened Our Balance Sheet And Doubled Our Free Cash Flow…Returning More Cash To Our Owners
Our People, Processes And Culture/Values Drive Long-Term Performance
Our People, Processes And Culture/Values Drive Long-Term Performance

12
Portfolio In Great Shape
ElectricalProducts
Tools
Int’l.
U.S.Commercial
Utility
Industrial
Oth
erRes
i.
89%Electrical
61% Industrial/Utility(Was 47% 6 Yrs Ago)
39% International
(Was 26% in 2000)
Large, Global, Healthy End-Markets…That Long-term…Grow At 3%
Large, Global, Healthy End-Markets…That Long-term…Grow At 3%
Based on FY2009
~70%Early/Mid Cycle
Early
Mid
Late

13
Long-Term Global Trends
Global Infrastructure Safety / Protection /Mass Notification
Energy Demand / Utility Grid
Conservation / “Green” /Energy Efficiency & Reliability
Cooper Uniquely Positioned To Penetrate Key Global TrendsCooper Uniquely Positioned To Penetrate Key Global Trends

14
Bussmann Lighting
Wiring DevicesSafety
Electrical Electronic
Transportation
Consumer
Commercial &
Industrial
Architectural
B-Line
Support Products
Enclosures
Wire Management
Crouse-Hinds
Explosion-Proof
InterconnectCommercialProducts
Airport Lighting
ConsumerElectrical Distribution
Commercial Lighting
Fire & Mass Notification
Glands/
Boxes
Emergency Lighting
Power Systems
Platforms
Platforms For Organic And Acquired GrowthPlatforms For Organic And Acquired Growth
UtilityAutomation
Transformers
ReliabilityProducts
Line Installation &
Protection
Tools
Industrial Power Tools
Consumables
Hand Tools
Joining Tools Chain
Products
Assembly Systems
Instrumentation

15
BussmannTransportation
Power SystemsGlobal Products
Power SystemsUtility Automation
Crouse-Hinds Connectivity
Crouse-Hinds Instrumentation
Crouse-Hinds Industrial EX
LightingControls
Cooper SafetyFire/Mass Notif.
LightingLED
Cooper Architectural & Safety Lighting
BussmannElectronics
BussmannElectrical
Acquisition Priorities
Highest Impact, Largest Market Opportunities; Focus Primarily On Industrial / Utility
Highest Impact, Largest Market Opportunities; Focus Primarily On Industrial / Utility

Access To New Markets
Filtronic$2.2BJoining ToolsGS Metals$1.3BB-Line Support Sys.
HyundaiMTLPauluhnIluram
$1.5B CCH Industrial EX
WPIG&H
$6.0BSpecialty Connectors
Transtech$.3BAirport Lighting
Nature$18.0BCPS Global Standards
Save Fuse$3.3BBussmann Electronics
Xian$6.6BBussmann Electrical
Sure PowerOmnex
$2.9BBussmann Transportation
RSAIo LightingClarityIMS
$1.5BLEDMEDCWheelockMadahcomRoam Secure
$2.0BNotification
NovitasPolaronPCITranspower
$2.7BLighting Controls
CannonCybectecCyme
$1.9BUtility Automation
AcquisitionsMarket SizePlatformAcquisitionsMarket SizePlatform
Platforms Provide Access To $50B+ Of Higher Growth, More Profitable, Less Cyclical, More Global Markets
Platforms Provide Access To $50B+ Of Higher Growth, More Profitable, Less Cyclical, More Global Markets 16

17
Cooper’s Business Initiatives
Driving Continuous Improvement – Order To Cash
Ease of Doing Business / Quality / Delivery
Leveraging Technology To Drive Customer Value
Competing And Winning Everywhere In The World
Acquire, Assess, Develop, Deploy
CustomerLoyalty
Innovation
Globalization
OperationalExcellence
TalentDevelopment
Clear, Measurable Initiatives To Drive Growth And Our Global Competitive Position
Clear, Measurable Initiatives To Drive Growth And Our Global Competitive Position

1818
Strategic Pricing
Technology Center
Marketing Communication
Loyalty Initiatives
Strategic Marketing
Cooper Connection
Customer Loyalty
Sales Force Excellence
Product Mgmt. Leadership
+
Building Upon A Legacy Of Innovation, Service & ExpertiseBuilding Upon A Legacy Of Innovation, Service & Expertise

19
7%
25%
15%
19%
2003 2008 2009 RevisedTarget
New Product % of Sales
Innovation - Product Vitality
New Product Leadership DrivesOrganic Growth And Margin Expansion
New Product Leadership DrivesOrganic Growth And Margin Expansion
LED Innovation Center Opened July 2009 (Peachtree City, GA)
– Reduced New Product Time To Market
– Leverage Across Cooper Businesses
Cooper Ranked #9 Industrial Innovator, Up 20 Places From 2008*
* From The Patent Board’s Dec 09 Industrial Component Supplier Patent Scorecard

20
Significant Change In Global Exposure….39% Of Sales in 2009 Outside The U.S.
Significant Change In Global Exposure….39% Of Sales in 2009 Outside The U.S.
Globalization – Building Global Presence
2000 - 2006 2007 2008 2009
26%
32%34%
37%39%
% of Sales Outside of U.S.
Revs $1.2B $1.6B $2.0B $2.4B $2.0B

21
Talent Development
Building A “Talent Academy”Building A “Talent Academy”
Talent Acquisition
Talent Deployment
Talent Assessment & Development
• University Recruiting• Recruiter Strategy• Networking
• Assessment & Potential
• Robust MD&P• Global Leaders
• Development Programs
• Learning Curriculum• Cooper University• Performance Mgmt.
& Compensation
• Succession Planning
• Career Paths
Pay For Performance

22
Enhanced Competitive Position
New enterprise system
Core productivity program
Lower overall fixed cost
Less capital intensive business model
Faster, Leaner With Core Productivity Programs In PlaceFaster, Leaner With Core Productivity Programs In Place

23
OngoingProductivity FromMVP/Lean/VAVE
OngoingProductivity FromMVP/Lean/VAVE
Fully LeverageGlobal Strategic
Sourcing &Supply Chain
Fully LeverageGlobal Strategic
Sourcing &Supply Chain
SafetyDelivery & QualityInventory & PayablesDirect/Indirect Material CostsLabor CostsInfrastructure Costs
Strategic Imperative
Area Of Focus Benefit
Improve Employee Safety
Increase Customer Service & Loyalty
Ongoing Cost Out & Elimination of Waste
Reduce Working Capital
Operational Excellence
Optimize GlobalFootprint
Optimize GlobalFootprint
Strong Foundation For Continuous Improvement & GrowthStrong Foundation For Continuous Improvement & Growth

24
$175
$115
$74
$100 $103 $97$85
$116 $127
2000 2001 2002 2003 2004 2005 2006 2007 2008 2009
Capital Expenditures
3.9% 2.7% 1.9% 2.5% 2.3% 2.1% 1.6% 2.0% 2.5%% ofSales
Less Capital Intensive Business Model…While Funding Strategic Growth
Less Capital Intensive Business Model…While Funding Strategic Growth
($ In Millions)
$137
2.1%
7%

2525
RECEIVABLES
$797.7
$1,011.4
2008 2009
2009 Operating Working Capital
61 d
ays
58 d
ays
PAYABLES
$492.5$384.4
2008 2009OPERATING
WORKING CAPITAL
$1,160.7
$897.2
2008 20095.
6 tu
rns
5.4
turn
s
INVENTORY
$641.8
$483.9
2008 2009
6.8
turn
s
6.8
turn
s
Continued Exceptional Operating Working Capital Execution
25%
21%23%
22%

26
0.0
0.5
1.0
1.5
2.0
1998 1999 2000 2001 2002 2003 2004 2005 2006 2007 2008 2009
Free Cash Flow To Income*
* Recurring Income from Continuing Operations
$196 $247 $344 $314 $428 $384 $383 $490 $535 $682 $761 $633
Strong Cash Flow In Up And Down CyclesStrong Cash Flow In Up And Down Cycles
($ In Millions)
5.4%6.4%
7.7%
7.5%
10.8%
9.5%
8.6%10.4%
10.3% 11.6% 11.7%
12.5%
As a % of Sales

2727
Total Debt (Dec. 31, 2009)
Amount Rate Due Date$ 325 3.55% Nov 20121
300 5.56% Apr 2015300 5.75% Jul 2017
925 Long-Term Debt10 Short-Term & Misc. Long-Term Debt
0 Commercial Paper935 Total Debt
(382) Cash
$ 553 Net Debt ($952 at December 31, 2008)
Balance Sheet Remains A Strategic AssetBalance Sheet Remains A Strategic Asset1 Swapped to Euro Debt - 5.25% note rate at date of issuance
($ Millions)

28
2009 Summary / 2010 OutlookCost structure and balance sheet aligned for new economic reality
Continued to invest during the downturn:– Vitality Index at a record level– Expanded global footprint– Completed three acquisitions
Portfolio diversity will provide years of end-market growth especially coming off such depressed levels
Demonstrated cash generation ability in up and down economies
Remain focused on total shareholder returns (guidance/dividend/buy-backs)
Well Positioned For Another Decade OfExceptional Shareholder Returns

Cooper LightingNeil Schrimsher, President
Cooper Industries2010 Outlook Meeting

Cooper Lighting Business Portfolio
Broad Portfolio Of Industry Leading Products & BrandsBroad Portfolio Of Industry Leading Products & Brands
Leadership Brands…
30

Cooper Lighting Overview
Revenues: ~$1.1 Billion
Initiatives Provide Strong Foundation & Enable Performance
Initiatives Provide Strong Foundation & Enable Performance
Customer LoyaltyDelivering Solutions to Channel Members & End User Markets
Innovation
Extensive Product Portfolio
New Product Vitality Over 25%Globalization
Specification with Higher End Architectural Products & Controls
Operating ExcellenceProductivity Gains – $32M BenefitWorking Capital Improvements –230bps
Geographic Mix: ~80% U.S.
Market Performance
31

Cooper Lighting End MarketsCommercial & Industrial
Energy – Accelerating Results in New, Retrofit & RenovationHealthcare & Education Remain AttractiveInstitutional – Government & Public Buildings ARRA Funding
ResidentialHALO #1 Recessed BrandPackaging, Merchandising Solutions & Energy Star NPI
Roadway / HighwayBroadest LED Outdoor Offering Utility Rebate Program Expansion
Broad Market Exposure, Reaching Attractive Long-Term Markets
Broad Market Exposure, Reaching Attractive Long-Term Markets
Roadway
ResidentialCommercial
Industrial
Roadway
ResidentialCommercial
Industrial
32

33
Lighting Key Economic Indicators
Challenging Market Conditions…With OpportunitiesChallenging Market Conditions…With Opportunities
Near-Term Trend Long-Term Trend
Construction Starts
Residential
Commercial Construction
Industrial
Recovery Act / Stimulus (ARRA)
Segment
*Internal Estimates

1. Operational ExcellenceDriving Productivity & Continuous Improvement
2. Energy Efficiency Leadership
3. Innovation & TechnologyControlsLED
Business Priorities
Energy & Innovation
Executing On Fundamentals & Generating ResultsExecuting On Fundamentals & Generating Results34

Lean
Continuous Improvement …
Continuing To Drive Competitiveness And Generate FCFContinuing To Drive Competitiveness And Generate FCF
Realized Benefits
Standard Work
Value Streams
Visual Management
Engagement & Accountability
Productivity Gains – $32M Benefit
Working Capital Improvements – 230bps
Continue to Generate Cash Flow in Excess of Earnings
Service Enhancements
Emergency Exit Signage (3 Product Families)
Above the Skin• Red & Green Capability in One Unit… an Industry First!• Added Patented Technology – EZ KeyTM External Battery Disconnect• Lower Energy Usage & Industry-Leading Battery Recharge TimeBelow the Skin
• Common Components Across All Three Families• Enabled Discontinuation of Three Product Families
Realized Benefits• Differentiated Product• Component Inventory Reduction• 85% SKU Reduction• Sales Increase • Margin Expansion
Delivering Customer Facing “Above the Skin” Benefits & Manufacturing “Below the Skin” Opportunities
…Complexity Management
35

Business Priorities
1. Operational ExcellenceDriving Productivity & Continuous Improvement
2. Energy Efficiency Leadership
3. Innovation & TechnologyControlsLED
Energy & Innovation
Executing On Fundamentals & Generating ResultsExecuting On Fundamentals & Generating Results36

2006 2007 2008 2009
Energy EfficiencyInefficient Lighting Systems are Common… …Energy Codes Expanding
…Cooper Delivering Solutions & Results
50%+ CAGR Retrofit / Renovation
Source: DOE
CALIFORNIA PER CAPITA ELECTRICITY USAGEkW/h per person
Regulatory Efforts Continue to Address Projected Demands…
Energy Generates Results In All Economic CyclesEnergy Generates Results In All Economic Cycles
AHJ
1960
-
1980
-
1990
-
2000
-
1970
-
~$200M
37

Energy Strategy
Leveraging Products & Channel Position For ResultsLeveraging Products & Channel Position For Results
End Users Contractors & ESCOs Distribution SpecifiersFocused Channel
Efforts
Results
• $400K in Annual Energy Savings
• 40% Energy Savings Per Sq/Ft
• Title 24 Compliant• 8 Month Payback
Sears Warehouse
Linear / Highbay Svc/ProgramsLighting Control
Product Breadth
Control Systems
Recessed / LEDRetrofit Products
Occupancy Sensors
Goldman Sachs• 43 Story LEED Gold
Certified • Balancing Environmental
Responsibility, Resource Efficiency, & Occupant Comfort.
• 28% More Energy Efficient Than Code - Compliant Building
38

Business Priorities
1. Operational ExcellenceDriving Productivity & Continuous Improvement
2. Energy Efficiency Leadership
3. Innovation & TechnologyControlsLED
Energy & Innovation
Executing On Fundamentals & Generating ResultsExecuting On Fundamentals & Generating Results39

Controls Platform
High Performance Architectural
Performance TheatricalEnergy Management
Common Theme For Product Platforms: Strong Specification Position & Unique Technology Component
Common Theme For Product Platforms: Strong Specification Position & Unique Technology Component 40
Launched Greengate Brand Global Product DevelopmentIncorporated Integral MeteringEnergy Savings Solutions
Launched “iLumin” Brand in USDimming, AV Integration, BMS1st with Integral Metering in Dimming PlatformScene Setting Solutions
Launched “Zero88” Brand in US “Value” Theatrical TechnologyEntertainment Performance Product SolutionsGlobal Platform
Mar
ket
Coo
per A
ctio
ns
$750M, 10%+ CAGRCooper – 2x Market
$300M, 5%+ CAGRCooper – 3x Market
$300M, 5%+ CAGRCooper - 3x Market

41
Controls PositioningCooper Controls Overview:
Breadth of Offering
Acquisitions Provide Platform For Growth: Organic Innovation & Expanded Solutions To The Existing Channel
Acquisitions Provide Platform For Growth: Organic Innovation & Expanded Solutions To The Existing Channel
Investments/ Acquisitions
Organic Innovation
Global Specification
Project Successes
Energy Management
Novitas (2006)
PCI Lighting Controls (2007)
Architectural / Performance Theatrical
Polaron: (2007) iLight/zero88
EDI (2009)
New Product Introductions
Energy-Focused Applications
Metering / Consumption Awareness
Unique Technology & IP
Specification Driven Products
Relevant Product Solutions in ALL Categories
Energy Management Sensors
Low-Voltage Relay Panels
LED Controllers
Architectural Dimming Cabinet
Theatrical Desks/ Dimmers
Local People, Local Products
UL & CE Compliant Products
“On the Ground”Sales/Support Staff on 4 Continents
Specifier & End-User Focused
End-to-End Controls Solutions
Global Project Specifications
Atlantis, Dubai
1 Hyde Park, UK
Marriott Gateway, USA
ThurgoodMarshall Federal Courthouse, NYC
Nemours Children's Hospital, USA

$280M
New Construction
Retrofit
Commercial Occupancy Sensor Applications
Lighting Controls
Application
Value
Base (SF)
Market Opportunity
@ 5% Penetration
…vs. No Automatic Controls:High Acceptance Within Segments25-50% Lighting Energy Savings < 2 yr Payback
Cooper Response – Industry Leading Breadth & Performance
Significant Growth Potential For CooperSignificant Growth Potential For Cooper
Other28%
Healthcare 4%
Office17%
Education14%
Industrial14%
Hospitality7%
Retail16%
42

Business Priorities
1. Operational ExcellenceDriving Productivity & Continuous Improvement
2. Energy Efficiency Leadership
3. Innovation & TechnologyControlsLED
Energy & Innovation
Executing On Fundamentals & Generating ResultsExecuting On Fundamentals & Generating Results43

LED Dynamics
Technology Advancing – Focus Shifting To Application (Luminaires)Technology Advancing – Focus Shifting To Application (Luminaires)
Cooper Delivering Best-in-Class Capabilities…
CommercializationCommercializationTechnologyTechnology ProductsProducts Supply ChainSupply Chain
0
20
40
60
80
100
120
140
160
2007 2012 2017$0.0$2.0$4.0$6.0$8.0$10.0$12.0$14.0$16.0$18.0$20.0
White LED Components
Effic
acy
(lum
ens/
wat
t)
Cost ($/kilolum
en)
Efficiency
Cost
0
20
40
60
80
100
120
140
160
2007 2012 2017$0.0$2.0$4.0$6.0$8.0$10.0$12.0$14.0$16.0$18.0$20.0
White LED Components
Effic
acy
(lum
ens/
wat
t)
Cost ($/kilolum
en)
Efficiency
Cost
2009 2012 Est. 2015 Est.
Inc / Hal
CFLHID
Fixture Market by Source
Fluor.
LED 25%
LED 2%
All Other 88%
LED 12%
All Other 75%
2009 2012 Est. 2015 Est.
Inc / Hal
CFLHID
Fixture Market by Source
Fluor.
LED 25%
LED 2%
All Other 88%
LED 12%
All Other 75%
44

LED Innovation Center
World Class LED Capability & CapacityWorld Class LED Capability & Capacity
Advanced Research & Development
LED, Advanced Lighting TechnologiesProduct Design – Optics, Thermals, Electronics, Mechanical, Ind. DesignPerformance & Reliability TestingPrototype and Pilot ManufacturingBuild Robust IP Pipeline
45

Track & Recessed LED
Application
Value
US InstalledBase (Units)
Market Opportunity@ 5% LED Penetration
Cooper Response –Industry Leading Brands & Performance
Track & Recessed Downlighting
…vs Incandescent:Up to 85% Less Energy Eliminates Up to 40 Replacements
Significant Growth Potential For CooperSignificant Growth Potential For Cooper
4”/ 6”, 600/900/1200 Lumen, Housings, Trims
18
8
12
25
14
14
Watts
Up to 72%1200 Series
Up to 72%4” Series
Up to 81%900 Series
Up to 85%Small Track
Medium Track
600 Series
Halo LED
Up to 80%
Up to 75%
Energy Savings
New Construction
Retrofit
$550M
INC83%
CFL17%
869 Million Units
46

…vs Metal Halide:30-60% Less Energy Eliminates >7 Replacements
Street & Area Lighting
Outdoor LED
Application
Value
US InstalledBase (Units)
Market Opportunity@ 5% LED Penetration
Cooper Response – Industry Leading Breadth & Performance
Significant Growth Potential For CooperSignificant Growth Potential For Cooper
$1.6BNew Construction
Retrofit
47
Metal Halide27%
HPS39%
137 Million Units
MV 13%INC 10%
FLU 6%

North American Commercialization
Accelerating Adoption With Commercialization Tools & EducationAccelerating Adoption With Commercialization Tools & Education
Marketing Support & Tools Customer Events / Training
60 Day Blitz20 Major MarketsAgency Training2500+ Influencers & Customers
Literature, SamplesWeb & e-ToolsMarketing ProgramsEnergy Rebates, Calculators
48

Well Positioned To Outperform The Market In 2010 & Beyond
Well Positioned To Outperform The Market In 2010 & Beyond
Cooper Lighting Summary
Challenging Short-term Market Conditions…. Significant Long-term Opportunities
Driving Productivity & Continuous Improvement
Energy & Sustainability – Delivering Energy Efficient Lighting Solutions & Results
Innovation – Leadership Platforms with Technology & Specification Capability
49

Cooper Power SystemsMike Stoessl, Group President
Cooper Industries2010 Outlook Meeting

51
Cooper Power Systems Portfolio
North American Industry Leading ProductsNorth American Industry Leading Products
Reliability & Power Quality
#1 in Overhead Switchgear#1 in Capacitors#1 in Voltage Regulators
Connection& Components
#1 in HV Fuses#2 in Surge Arresters#2 Molded Rubber Accessories
Transformers #2 Distribution Transformers
Automation &CommunicationSolutions
#1 Demand Response Systems#2 AMI PLC Provider#1 Planning Software#1 Smart Sensors

5252
Power Systems Business Overview
Sales Growth
Global Growth With Strong Presence And BrandGlobal Growth With Strong Presence And Brand
Market Size: ~$45 Billion(Global T&D)
Revenues: ~$1.1 Billion
Geographic Mix: ~32% Outside U.S.
Customer Profile
Leading Brands
High Single-Digit CAGR
2003 2004 2005 2006 2007 2008 2009
Ref: ’03 -’08 CAGR of ~15%

5353
Power Systems End-Market Evolution
53Significant Exposure To Attractive, High Growth MarketsSignificant Exposure To Attractive, High Growth Markets
2004 2009US Reliability & Automation
– Power Quality, Efficiency & Productivity Solutions
US Connection & Restoration– Power Delivery Solutions For
Utilities
Commercial & Industrial– Wind & Solar, Wastewater,
Oil & Gas, Military, Hospitals
International– Large Presence In Asia, Latin
America, Australia
Note - 2004 figures do not equal 100% due to rounding

545454
Power Systems Economic Indicators
Utility Revenues
Non-Residential construction
Housing starts
Inventory Rebuild
Infrastructure/stimulus
International
Short-Term Leading IndicatorsElectricity DemandGlobal Economic DevelopmentDemand For ReliabilityAging Grid, RetirementsSmartGrid InvestmentsLegislative Trends
Long-Term Leading IndicatorsTrendTrend
Mill
ions
of u
nits

5555
Power Systems Business Priorities
Leverage 2009 Operational Improvements– Lean Culture Driving Delivery, Quality, Inventory To Best-in-class– Value Engineering Well Balanced With New Product Development– Leadtime Improvements Allowing Sales Wins
Automation and Energy Efficiency– Positioning Over Last Five Years Paying Off
Globalization– Further Expansion In Middle East, South America, Asia– +50% Increase In Asia-for-Asia New Product Releases
Increased Focus On Targeted Industrial Markets – Rapidly Expanding Renewable Energy Sector, Data Centers– “Consultant to the Consultant” Application Expertise
Well Positioned For Years Of GrowthWell Positioned For Years Of Growth

5656
END to END Efficiency
56
Growth StrategiesCPS Has Solutions That Enhance System Efficiencies:Power Quality & Optimization
Low-loss Distribution Equipment
Green Circuits Network
Improved Utilization & Automation
“Energy Efficiency And Demand Response Will Continue To Be The ‘First Fuel’ Choice For Utilities” Rick Nicholson, IDC Energy Insights
“Energy Efficiency And Demand Response Will Continue To Be The ‘First Fuel’ Choice For Utilities” Rick Nicholson, IDC Energy Insights

57
Smart Grid
57
Trend Data CPS Smart Grid Solutions
Source: Pike Research’s report, “Smart Grid Technologies” Dec 2009
Smart Grid Revenue (World Markets)
Transmission
Distribution Automation
Substation Automation
AMI
PHEV
CPS Well Positioned To Benefit From Automation Drivers2005 2006 2007 2008 2009
Significant G
rowth
AMIDemand Response
Substation AutomationDistribution Automation
Enterprise SoftwarePlanning, Modeling & Simulation
~$200M

58
Stimulus Timing
58
Smart Grid Stimulus
Allocation By Cooper Solutions
~$4B Smart Grid Stimulus Allocation
Contracting Issues Slowing Stimulus Funding
Government Contracting SlowInitial RFP Processes, Vendor Negotiations UnderwayOrder Flow Pending
Oct ‘09
Gov’t Contracting
RFP Processes
Vendor Contracting
Sales
Orders
Today
AMI$2,757 M
Substation Automation
$203 M
Other $284 M
Distribution Automation
$642M
Demand Response
$161 M

59
Renewables
59
Trend Data Summary
Growth Strategies
Renewable Portfolio Standards in 24 States
Broad ReachApplication Expertise For Complex Systems
Tailored TransformersSoftware Modeling ProductsCollection Systems
Current DriversRenewable Portfolio Standards Tax Incentives Increased Cost Competitiveness (Wind)
Long-term DriversFossil Fuel Price VolatilityIncreased Cost Competitiveness (Wind/Solar)Clean Energy ReformFederal Renewable Energy Standards
Well Positioned For Significant Renewable Sector Growth
02,0004,0006,0008,000
10,00012,00014,00016,00018,00020,000
2006 2007 2008 2009 2010 2011 20120
500
1,000
1,500
2,000
2,500
3,000
US Annual Utility Scale Capacity Additions (MW)
20% CAGR
Wind - Bars Solar - Line
97% C
AGR

60
Power Systems Globalization
Asia / LA Capacity ExpansionInnovation Pipeline ImprovingGlobal Technical TalentAmorphous TransformersExporting China Switchgear ProductsCyme Systems Analysis Capability
Power Systems Well Positioned
Drivers
Seven Factories Outside The U.S…..Local Products For Local Markets
Seven Factories Outside The U.S…..Local Products For Local Markets
Global Electricity Demand Increasing (China & India)World-wide Infrastructure Investment In Electrical GridGlobal Climate Change Response
Non-OECD countries account for 93% of the increase in global demand between 2007 – 2030, driven largely by China & India
World Energy Consumption

61Positioned For Years Of Strong RecoveryPositioned For Years Of Strong Recovery
Power Systems SummaryWorst Behind Us Investments In Last Cycle Paying Off – Operational Performance– Automation And Efficiency– Targeted Industrial Segments– Globalization
Positive Long-Term Trends, Enhanced by Global Stimulus Programs– Electricity Demand– Global Economic Development– Demand For Reliability– Aging Grid– SmartGrid Investments– Legislative Trends Towards Reliable, Efficient, Domestic
Power Sources
Broad Product Portfolio To Reliably Distribute Power To Customers Around The Globe

Cooper Industries2010 Outlook Meeting
Cooper Safety & GlobalizationGrant Gawronski

Emergency Lighting
Notification & Fire Solutions
Lighting
Cable Glands & Commercial Products
Security
Broad Offering Capitalizing On Global Infrastructure Build
Cooper Safety Product Portfolio• Technical Central Battery &
Self Contained Solutions• Market Leader – Europe &
Middle East
• Full Line UL & EN Fire Products
• Comprehensive Mass Notification Solution
• Leading LED Package• Strong UK Commercial
/Industrial Exposure
• Heavy Industrial Base For Cable Glands
• Commercial Products For Comm/Resi Construction
• UK Based Intruder Business• Great Product Technology
63

Cooper Safety Business Overview
2003 2009
Sales Growth
Strong Products…Excellent Customer FranchiseStrong Products…Excellent Customer Franchise
Market Size (served): ~$8 Billion
Revenues: ~$500 Million
Geographic Mix: ~90% Outside U.S.
Customer Profile
Leading Brands
Mid Single-Digit CAGR
WheelockRef: ’03 -’08 CAGR of ~14%
64

Cooper Safety End Markets
XXX
XXX
XXXXXX
Commercial• #1 Position In Emergency Lighting
in Europe and Middle East • Strong UK Lighting Business • Huge Project Pipeline in Mid East
+ UK Olympic Opportunity
Industrial• MEDC Strong In Industrial
Signaling• Comprehensive Industrial
Notification• Gland Business Growing . . .
Residential• Limited Exposure Through
Security and Commercial Products
Broad Market Exposure Across EMEABroad Market Exposure Across EMEA
Industrial
Commercial
Resi
66%15%
6%OEM 8%
Military 5%
65

Near-Term Trend Long-Term Trend
Industrial Production
Non-Resi Construction
Energy Standards/Stimulus
Safety/Notification
London Olympics
Segment
Cooper Safety Key Economic Indicators
GDP Recovering….Construction Levels Flatten OutGDP Recovering….Construction Levels Flatten Out
Key Eurozone GDP Projections Eurozone Non-Resi Construction
2008 to 2010….Steep Decline
2010 Flattens Out With London Olympics, Energy Efficiency Trends
Safety Well Positioned To Capitalize On Growth Trends
66
Source: IMF

Cooper Safety Business Priorities
Geographic Expansion
Technology & Alternative Energy Growth
Notification & Safety Penetration
Leverage Cooper Portfolio Across Europe- Crouse-Hinds, B-Line, Bussmann
Drive >5% Organic Long-Term Growth RateDrive >5% Organic Long-Term Growth Rate
67

Technology & Alternative Energy
Smart Systems- Networked Emergency Lighting- Wireless Addressable Fire Systems
Technical Customer Solutions- Custom LED Applications- Military/Institutional Notification
Core Product Efficiency Upgrades- Legislated Energy Savings- Long-Life Applications
Technology And Innovation Accelerate Core GrowthTechnology And Innovation Accelerate Core Growth 68

69
Notification Strategy OverviewTe
chno
logy
In
terf
ace (Electronic)(Electronic)
Access ControlAccess Control
VideoVideoSurveillanceSurveillance
Mar
ket P
artic
ipan
tExtend ReachFire Devices
MEDC
Hazardous
WAVESRSAN
Mass Notification Systems
Wheelock (UL)
Fulleon (EN)Em
erge
ncy
Com
mun
icat
ions
Sys
tem
sEm
erge
ncy
Com
mun
icat
ions
Sys
tem
s
Technology Solutions Driving GrowthTechnology Solutions Driving Growth
Capture Market Entitlement
OEM Provider For Fire Industry
Expand Range And AvailableMarket
Extend Reach Globally
Standardize NotificationTechnology

Leveraging The European Portfolio
Partnering For Growth With Global Electrical DistributorsPartnering For Growth With Global Electrical Distributors
Majority Share Held by Global Players
Breadth of Portfolio A Key For Partnership
Local Presence Across The Continent
European Electrical Distribution
Broad Line of EU/Global Products
Significant European Presence
Global Partnerships . . . Europe/US/Asia Pacific
Cooper Portfolio
Dedicated Industrial Sales Team Driving Divisional Cross Selling
Increased Selling Opportunities
Application And Technical Support Through Local Presence
Combined Product Offering
Cooper Safety
Cooper Crouse-Hinds
Cooper B-Line
Cooper Bussmann
70

Cooper Safety Summary
Safety Is A Leading European Electrical Products Platform
Technology and Alternative Energy Products Gaining Momentum
- Emergency Lighting, Mass Notification, LED Solutions
Growing In Emerging Markets…Established Player Providing A Broad Electrical Product Offering
Big European Presence…Able to Effectively Integrate Acquisitions With Synergy Upside
Well Positioned To Continue To Outperform The Market In 2010 And Beyond
Well Positioned To Continue To Outperform The Market In 2010 And Beyond
71

Cooper Industries2010 Outlook Meeting
Cooper GlobalizationGrant Gawronski

International Investments
+11%+5%
+16%
+22%
NX Mexico
NX Korea
MEDCMEDC
Save FuseSave Fuse
MX Mfg Plan
CC Europe
NX Australia
Capacitor JVCapacitor JV
China HQ
Xian FuseXian Fuse
CBE Europe
NX SE Asia
NX Russia
PolaronPolaron
NX Japan
NX India
Despite 2009 Downturn, Continued Investments To Support Global Growth Opportunity
Despite 2009 Downturn, Continued Investments To Support Global Growth Opportunity
NatureNature ClarityClarity
YOY Growth Rate
HyundaiNX China
NX Mid East N. AfricaN. Africa
CybectecCybectec
Saudi Mfg
MTL
+17%
2003 200620052004 2007 2008
Xian Mfg
Digital China
WD China
Romania Mfg
2009
-20%-16% Core
Cyme
73

2009 – Manufacturing In Saudi Arabia
74

2009 – China Bussmann Xian
7575

2009 – China CWD Dongguan
76
MANUFACTURING SALES
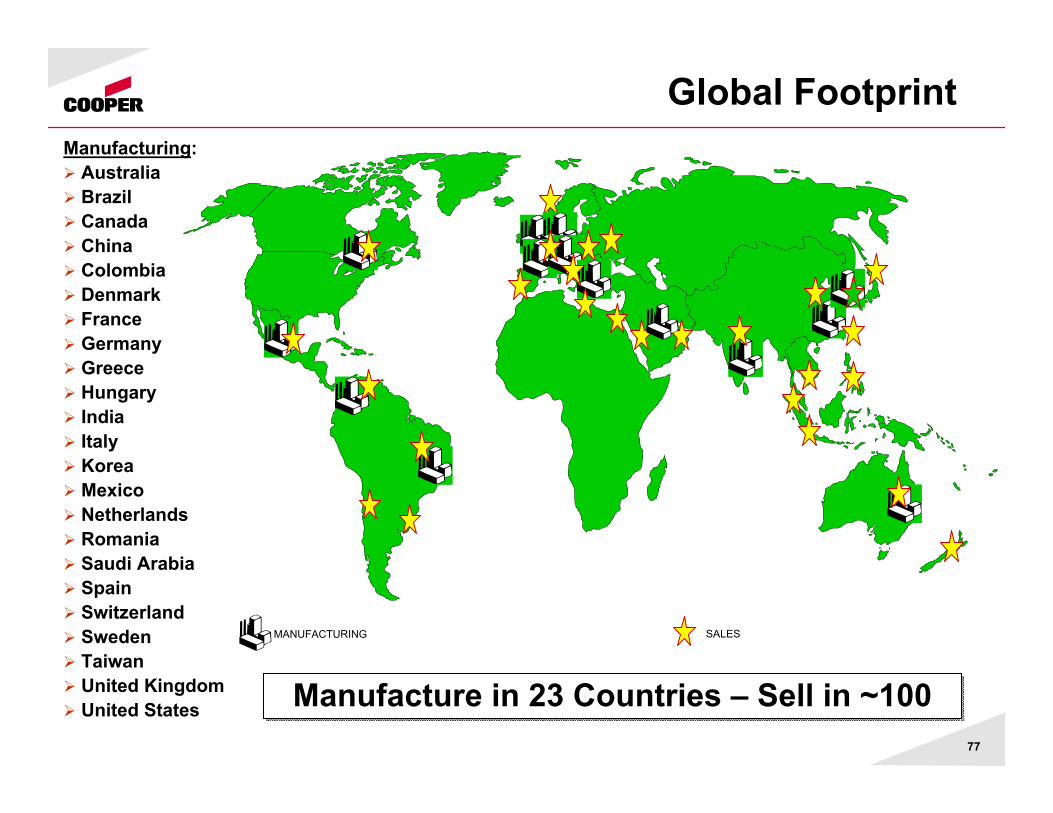
Manufacturing:AustraliaBrazilCanadaChinaColombiaDenmarkFranceGermanyGreeceHungaryIndiaItalyKoreaMexicoNetherlandsRomaniaSaudi ArabiaSpainSwitzerlandSwedenTaiwanUnited KingdomUnited States
Global Footprint
Manufacture in 23 Countries – Sell in ~100Manufacture in 23 Countries – Sell in ~10077

2004 – 2009 Summary
Significant Investments In Place To Grow International Revenues
Divisions Have Been Successful – Doubling Revenue In 5 Years
Our Foundation Is Solid . . . Continue Strategic Investments in 2010 and Beyond
Growth Model Transferrable To Other Geographies
Extremely Well Positioned To Restore Growth
Track Record Of Growth….Well PositionedFor Global Economic Recovery In 2010
Track Record Of Growth….Well PositionedFor Global Economic Recovery In 2010
78

2010 International Focus
39% Of Revenues Now Generated Outside The US – Big Targets Remain
39% Of Revenues Now Generated Outside The US – Big Targets Remain
2X
2X 2X
79

Global Growth Strategy
Local Products For Local Markets
Leverage Global Cooper Presence With Key End Users
Strengthen Operational And Commercial Footprint In South America
Global Portfolio And Expanding Global Presence Driving Growth
Global Portfolio And Expanding Global Presence Driving Growth
80

Asia – Local Products For Local Markets
2004 2009
Nearly Tripled The Business
Strong Power Systems Asia Foundation…. Positioned For Sustained Growth
Strong Power Systems Asia Foundation…. Positioned For Sustained Growth
Cooper Power Systems Asia Revenue
81

XINFA
SwitchgearMRP
ComponentsNatureVCB
Capacitor
NATURE
CSPC
Localized Products• Capacitors• Reclosers• Controls• IEC VCB• RMU• IEC MRP• ANSI MRP• Cutout • Components
PDSE
RTEFE
Strong Local Product Platform Drives Asia-For-Asia Product Offering
Strong Local Product Platform Drives Asia-For-Asia Product Offering
Asia Vitality
82

Canada38 EPCs
USA54 EPC’s
South America42 EPCs
UK14 EPCs
Middle East15 EPC’s
Western Europe30 EPCs
India12 EPCs
South Korea14 EPCs
Japan15 EPCs
Aust / SEA12 EPCs
Global Customer Opportunity
EPC: Global Engineering, Procurement and Construction Company
Cooper Focus: Oil & Gas, Industrial Processes, Mining & Power Projects
Billions Of Global Project Opportunity 83

CSACanadianCertification
ATEXCertification forthe European Union
ULCertification forUnited States
NECNorthAmericanCertification
CEPELBrazilian Certification
IEC and IECExInternational Certification
GostRussianCertification
GBCertification for China
Global Oil & Gas Product Strategy
Products For All Continents
Cooper’s Broad Offering Of Certified Global Products Critical To Continued Success 84

Expanding Global Presence
Established Cooper Relationships Create New Opportunities
Established Cooper Relationships Create New Opportunities
World-wide Relationships Span The Project Cycle
Leverage RelationshipAnd Provide
Solutions
Mid East Contractor Base Is Common For High Profile
Commercial & Utility
85

B-Line Middle East/North Africa Growth
2010 Target
B-Line Capitalizing On Global Cooper PresenceB-Line Capitalizing On Global Cooper Presence
Exponential Growth
~$100M Target
+ +
GCC Iraq North Africa
Regional Expansion
86

Cooper In Latin/South America
~$350M Annual Revenues
Solid Business For Power Systems, Crouse Hinds….Driven by Local Presence
Resources = Results - Wiring Devices – Venezuela- Crouse-Hinds – Columbia
IECNEMANEMA 40%IEC 60%
Increased Local Presence And Products Position Us For Strong Growth
Increased Local Presence And Products Position Us For Strong Growth 87

3 Pronged Approach To Growth
Latin/South America Growth Strategy
Colombia As 2nd S.A. “Base Of Operations” Pursue
Acquisition To Expand
Penetration In Brazil/S.A.
Add Sales Presence – Local
Feet On The Street
BRAZIL
VEN
PERU
BOLIVIA
PAR
URU
SUR
VEN
COLEC
BRA
CHI
VENCOL
HONGUA
CR
Recent Crouse-HindsAcquisition Excellent Presence WithDistribution Power Systems Presence
Significant ElectricalProduct OpportunitiesLeverage Existing Cooper Infrastructure
88

2010
Asia
Mid East
L. America
GPT
Driving Strong, Sustainable International Growth
Globalization Summary
+5%
+16%
+22%
MEDCMEDC
Save FuseSave Fuse
MX Mfg Plan
CC Europe
NX Australia
Capacitor JVCapacitor JV
China HQ
Xian FuseXian Fuse
CBE Europe
NX SE Asia
NX Russia
PolaronPolaron
NX Japan
NX India
NatureNature ClarityClarity
Hyundai
NX Mid East N. AfricaN. Africa
CybectecCybectec
Saudi Mfg
MTL
+17%
200620052004 2007 2008
Xian Mfg
Digital China
WD China
Romania Mfg
2009
-20%-16% Core
Cyme
89

Cooper B-LineKevin Kissling, President
Cooper Industries2010 Outlook Meeting

91
Cooper B-Line Product Portfolio
Cable Tray
Bolted Framing
Pipe Hangers
Electrical Enclosures
Spring SteelFasteners
MeterSockets
Safety Grating
Electronic Enclosures
Rack &Runway
Broad Portfolio Of Specified Products For Engineered Facility Subsystems
Broad Portfolio Of Specified Products For Engineered Facility Subsystems
Supp
ort
Syst
ems
(~80
%)
Encl
osur
es
(~20
%)
Support Structure For Electrical, Mechanical And Data Transmission Lines
Cable Management
People/Structural Support
Physical Asset Protection For Electrical And Data Systems
Cable Management
#1 in North America
91

Cooper B-Line Business Overview
2003 2009
Sales Growth
Solid Growth, Large Served Market…Big Opportunity OverseasSolid Growth, Large Served Market…Big Opportunity Overseas
Market Size: ~$3 Billion (NA)~$19 Billion (WW)
Revenues: ~$350 Million
Geographic Mix: ~90% U.S.
Customer Profile
Leading Brands
High Single-Digit CAGR B-LineFlextrayGripStrutRuff-InAccessPromise
~70% Electrical Distribution
Ref: ’03 -’08 CAGR of ~18%
92

Diverse End-Market Exposure Provides Growth Opportunities Through The CycleDiverse End-Market Exposure Provides
Growth Opportunities Through The Cycle
B-Line End Markets
Other
Industrial
Commercial
IndustrialManufacturingPetro ChemPharmaceuticalsFood & Beverage
CommercialGovernmentHealthcareEducationOfficeHospitality
OtherUtilityData CentersTelecommOEM
Oil & GasMiningPower GenerationAlternatives
93

Global Fixed Investment Globalization, Middle East
E&P Investment EPC relationships, Drive Spec
Non-Resi Construction/ABI Lowest Total Cost Innovation
Stimulus (Gov’t Bldg) ARRA Compliant, Vertical Focus
Alternative Energy Solar Racking, Nuclear
B-Line Economic Drivers
Commercial Construction Challenging In Short-Term….Favorable Long-Term Dynamics
Commercial Construction Challenging In Short-Term….Favorable Long-Term Dynamics
LT TrendST Trend Opportunities
$0.0
$2.0
$4.0
$6.0
$8.0
$10.0
$12.0
$14.0
2008 2009 2010 2011 2012 2013
Trillions World Fixed Investment*
’09 –’13 CAGR ~ 6%
30.0
35.0
40.0
45.0
50.0
55.0
60.0
65.0
70.0
1999
2000
2001
2002
2003
2004
2005
2006
2007
2008
2009
Quarterly ABI
-40.0%
-30.0%
-20.0%
-10.0%
0.0%
10.0%
20.0%
30.0%
40.0%
50.0%
Sales Growth
ABI QuarterlyYoY Growth (3Q Lag)
AIA Billing Index*
Dot-Com
AcquisitionO&G
*Source: IHS Global Insight, AIA
94

Long-Term Global Trends
Global Infrastructure Safety / Protection /Mass Notification
Energy Demand / Utility Grid
Conservation / “Green” /Energy Efficiency & Reliability
Cooper Uniquely Positioned To Penetrate Key Global TrendsCooper Uniquely Positioned To Penetrate Key Global Trends95

96
B-Line Business Priorities
Continue Relentless Pursuit Of Specification, Innovation And Service Leadership
Expand Pursuit To Faster Growing Global And Emerging Vertical Markets…Leveraging The Cooper Portfolio And Localizing Manufacturing
Global Oil And GasAlternative Energy – Solar And Nuclear
Continue To Provide Labor Saving Products And Superior Service To Support Core North American Business Growth
Win in Attractive Verticals Through Innovation, Driving Specification And Superior Service
Win in Attractive Verticals Through Innovation, Driving Specification And Superior Service

Global Infrastructure/Oil & Gas
Production facilities
Offshore PlatformsDrilling Rigs LNG Plants
UpstreamProduction facilities
Offshore PlatformsDrilling Rigs LNG Plants
Upstream
Transportation
PipelinesTerminals
MidstreamTransportation
PipelinesTerminals
Midstream
Refining
FuelsLubricantsChemicals
DownstreamRefining
FuelsLubricantsChemicals
Downstream
Cable Tray Portfolio
Significant Global Opportunities
Global O&G Investment By Year/Region
Building Out Global Specification Team
Driving Cooper B-Line’s Global Expansion…. Leveraging Crouse-Hinds And Safety Portfolios
Driving Cooper B-Line’s Global Expansion…. Leveraging Crouse-Hinds And Safety Portfolios
$0$100$200$300$400$500$600$700
2010 2011 2012 2013
North America Europe (Inc. Russia)Middle East Asia Pacific
*Source: IIR, EIC and B-Line Estimates
$Bils
Saudi Arabia And GCCCanada – Tar SandsKorean Contractors And EPCsAustralian LNG Investments
97

98
Saudi Arabia – Middle East Growth
Positioned To Win In A Growing RegionPositioned To Win In A Growing Region
Middle East Operations:Wholly-Owned Cooper Entity –Operational in ~12 MonthsExceed Saudi Content Within Work Force
– Recognized By End UsersLeveraged Cooper Ops Excellence Platform
– ARAMCO Vendor Approval In 4 MonthsStrong Engagement In Oil & Gas And Commercial Mega Projects Throughout The Region
98

Alternative Energy/SolarPV Specific Racking And Cable Management Product Solutions
Roof Top
Cable Mgmt
Electrical Distribution Channel Strength To Serve The Market
Emerging Market, Utilizing Adjacent Products…Migrating Towards Electrical Distribution
Emerging Market, Utilizing Adjacent Products…Migrating Towards Electrical Distribution
Ground Mount
Cumulative Solar Megawatt Growth*
0500
1,0001,5002,0002,5003,000
2010 2011 2012 2013
Roof Mount (Non Resi)
Ground Mount
MWs
*Source: SEPA, NREL, B-Line Estimates 99

Driving Loyalty Through Superior Service Distributors ContractorsSpecifiers/Engineers
Industry Leading Service Guarantee Program
– Across All Channel of Distribution
Customer Benefits:– Lower Inventory – Service to Their
Customers
Providing Lowest Total Installed Cost Throughout The Value Chain
Providing Lowest Total Installed Cost Throughout The Value Chain
Leading Design Tools and Support
– Sales Engineering– Design Tools (Ex:
BIM)
Customer Benefits:– Reduced Design
Time– Optimized Design for
Material Cost
Labor Savings Product Solutions
– Innovative Customer Driven Solutions
– Lowest Installed Cost
Customer Benefits:– Speed of Installation– Lower Labor Cost
100

Driving To Double The Business Again Through Globalization And InnovationDriving To Double The Business Again Through Globalization And Innovation
Cooper B-Line Summary
Broadly Specified With Leading Position And Brand Preference
Reputation For Customer Focus And Service
Globalizing The Business To Participate In Faster Growing Markets
Developing Innovative New Products To Get In Front Of Emerging Verticals
101

Cooper Industries2010 Outlook Meeting
Cooper Growth StrategyTom O’Grady, Sr. VP Business Development

Large, Global,Healthy & Diverse
End-Markets
End-Market Growth
Established Brands,Leading Market
Positions…Cooper Connection
Customer Loyalty
Introduce New Products With Focus On
Technology Solutions
Innovation
International Opportunity Offers Substantial Upside
Globalization
Disciplined Strategy…Build Key Platforms, Increase Technology,
Accelerate Globalization
Acquisitions
Sustainable Growth StrategyMarket Growth Initiatives Acquisitions
3% 2% 5%+ +
Growth Through All Economic CyclesGrowth Through All Economic Cycles103

Innovation And M&A
Innovation Drives Profitable Core Growth– Access To / Leverages New Technologies Across Businesses
– Creates Value-Added Solutions
– Extends Technical Leadership
– Ability To Participate In High-Growth Market Opportunities
M&A Facilitates Growth And New Technologies– Builds Platforms
– Accelerates Globalization
– Access To New Markets
Balance Between Core Growth Initiatives And Acquisitions Positions Cooper For Sustainable Long-Term Growth
Balance Between Core Growth Initiatives And Acquisitions Positions Cooper For Sustainable Long-Term Growth
104

InnovationTom O’Grady, Sr. VP Business Development
Cooper Industries2010 Outlook Meeting

7%
25%
15%
19%
2003 2008 2009 RevisedTarget
New Product % of Sales
Innovation - Product Vitality
Cooper Ranked In Top 10 By The Patent Board For Strength Of Patent Portfolio Measured By Technology Strength
Cooper Ranked In Top 10 By The Patent Board For Strength Of Patent Portfolio Measured By Technology Strength
106

Value-Added Solutions
LED Industrial Wireless UtilityAutomation
Value-Added Solutions Driven By Acquisitions And Internal Development
Value-Added Solutions Driven By Acquisitions And Internal Development
FRO
MTO
107

LED Outdoor
Lighting
Wireless Tool Tether
Tools
LED Down-Light
Lighting & Safety
Industrial WiFi
Bussmann, Crouse & Power Sys.
EVLED
Crouse-Hinds
Transportation Radio Control
Bussmann
LED Vapor Tight Utility Light
Crouse-Hinds
Wireless Sensor Networks
Bussmann & Crouse-Hinds
LED Healthcare
Lighting
Wireless Wide –Area Notification
Safety
LED Exit Sign
Lighting, Safety & Crouse-Hinds
LED
Outage Advisor
Power Systems
RF / Wireless
Extend Technical Leadership
Higher Specification – Higher Technology –Greater Global Growth Opportunities
Higher Specification – Higher Technology –Greater Global Growth Opportunities
108

Solar
Innovation Initiatives Across Divisions Have Positioned Cooper To Grow In Key High Growth End Markets
Innovation Initiatives Across Divisions Have Positioned Cooper To Grow In Key High Growth End Markets
High-Growth Markets
Transformer
Combiner
Solar Rack AC/DC Disconnect
String Combiner
Array Combiner
109

Wind
Significant Opportunity Across Cooper Businesses To Drive Growth
Significant Opportunity Across Cooper Businesses To Drive Growth
3
2
1
2
3
Nacelle
Tower
Transformer
1
High-Growth Markets
110

M&ATom O’Grady, Sr. VP Business Development
Cooper Industries2010 Outlook Meeting

Acquisition Core Strategy
Strengthen The “Core”
Specification/Technology Driven Businesses
Enhance Global Footprint
Strong Balance Sheet
Talented Management
Platforms Technology
Globalization
Acquisition Focus Areas
Executing A Consistent And Disciplined StrategyExecuting A Consistent And Disciplined Strategy
112

Bussmann Lighting
Wiring DevicesSafety
Electrical Electronic
Transportation
Consumer
Commercial &
Industrial
Architectural
B-Line
Support Products
Enclosures
Wire Management
Crouse-Hinds
Explosion-Proof
InterconnectCommercialProducts
Airport Lighting
ConsumerElectrical Distribution
Commercial Lighting
Fire & Mass Notification
Glands/
Boxes
Emergency Lighting
Power Systems
Platforms
Platforms For Organic And Acquired GrowthPlatforms For Organic And Acquired Growth
UtilityAutomation
Transformers
ReliabilityProducts
Line Installation &
Protection
Tools
Industrial Power Tools
Consumables
Hand Tools
Joining Tools Chain
Products
Assembly Systems
Instrumentation
113

BussmannTransportation
Power SystemsGlobal Products
Power SystemsUtility Automation
Crouse-Hinds Connectivity
Crouse-Hinds Instrumentation
Crouse-Hinds Industrial EX
LightingControls
Cooper SafetyFire/Mass Notif.
LightingLED
Cooper Architectural & Safety Lighting
BussmannElectronics
BussmannElectrical
Platform Priorities
Highest Impact, Largest Market Opportunities; Focus Primarily On Industrial / Utility
Highest Impact, Largest Market Opportunities; Focus Primarily On Industrial / Utility
114

GPS Personal Navigation
Capacitor
Capacitor Bank
Power InductorFlood LightCombo LightSwitchgear
Solutions
Olympic Swimming Centre
Chongqing GreenGarden Bridge
Applications
Accelerates Globalization
Global Infrastructure Investments Driving Growth In Key Local Markets
Global Infrastructure Investments Driving Growth In Key Local Markets
115

Local Presence Driving Long-Term Growth In Key Global Markets
Local Presence Driving Long-Term Growth In Key Global Markets
Bussmann
Access To Local Markets
Local Products
Local Sales & Engineering Teams
Accelerate Growth
International Acquisitions
Accelerates Globalization
116

Access To New Markets
Filtronic$2.2BJoining ToolsGS Metals$1.3BB-Line Support Sys.
HyundaiMTLPauluhnIluram
$1.5B CCH Industrial EX
WPIG&H
$6.0BSpecialty Connectors
Transtech$.3BAirport Lighting
Nature$18.0BCPS Global Standards
Save Fuse$3.3BBussmann Electronics
Xian$6.6BBussmann Electrical
Sure PowerOmnex
$2.9BBussmann Transportation
RSAIo LightingClarityIMS
$1.5BLEDMEDCWheelockMadahcomRoam Secure
$2.0BNotification
NovitasPolaronPCITranspower
$2.7BLighting Controls
CannonCybectecCyme
$1.9BUtility Automation
AcquisitionsMarket SizePlatformAcquisitionsMarket SizePlatform
Platforms Provide Access To $50B+ Of Higher Growth, More Profitable, Less Cyclical, More Global Markets
Platforms Provide Access To $50B+ Of Higher Growth, More Profitable, Less Cyclical, More Global Markets 117

2004 - 2010 M&A Activity
Screening> 1,100 Targets
Identified in Over 50 Countries
Diligence
Execution
90+ Deals Presented > $12B in Revenue
29Closed Deals
Summary
Proven Process Capability in M&A…Stepping Up Size And Scale
Proven Process Capability in M&A…Stepping Up Size And Scale
Closed 29 Deals Across all 8 Divisions
15 International Deals in 7 Countries
Executed on 11 Strategic Growth Platforms
Strengthened the Core
Specification/Technology Driven Businesses
Enhanced Our Global Footprint
118

Innovation And M&A Summary
Growth Is A Blend Of Internal Development And M&A– Access To $50B+ Higher Growth, More Profitable And
Less Cyclical Global Markets
Past 5 Years - Cooper Invested:– ~$500M In NPD– ~1B in M&A
Today - Nearly 20% Of Cooper Revenue Is From Products Introduced In The Past 3 Years
Cooper Is In The Top 10 For Patent Portfolio & Technology Compared To Our Global Industrial Peers
Cooper Is Leveraging Its Developed & Acquired Technology Across Divisions
New Products – New Customers – New Growth OpportunitiesNew Products – New Customers – New Growth Opportunities119

2009 Financial HighlightsTerry Klebe, SVP and CFO
Cooper Industries2010 Outlook Meeting

121
Macro-Economic Environment in 2009
Every Market And Geography Impacted Deeply By Great Recession of 2008/2009
Every Market And Geography Impacted Deeply By Great Recession of 2008/2009
Deepest Global Recession Since Great Depression… Worldwide Government Intervention/Stimulus To “Save” Economy
Weakening U.S. Dollar Throughout Year, Credit Markets Froze And Thawed - Lending Standards Changed Forever?
Global Industrial Markets Depressed, MRO And Early Cycle Products Start Recovery By Year-End
Housing Markets Slowly Crawling Back In Second Half
Utility Spending Weak For Entire Year On Reduced Electricity Consumption And Tightened Credit
Commercial Construction Activity Free FallCommodity Deflation

Cooper Team Response
Began Adjusting Businesses Before The Crash In November 2008
Implemented Contingency Plans Beginning In Q4 2008
Stepped Into The Economic Reality Early In 2009 And Rapidly Adjusted Businesses For 20%+ Revenue Decline
Stabilized The Businesses By End Of Third Quarter For New Market Reality And Positioned For Return To Growth
Continued To Provide Our Best Estimates For Quarterly And Annual Results
The Cooper Team Outperforms In Good And Bad Economic Times
The Cooper Team Outperforms In Good And Bad Economic Times
122

2009 EPS Guidance
CONTINUING EARNINGS PER SHARE(diluted)
$2.52
$2.45
$2.30 $2.30 $2.35
$2.60
$2.45$2.50
$2.80
$2.00
$2.20
$2.40
$2.60
$2.80
$3.00
2009 OutlookGuidance
2009 Q1Update
2009 Q2Update
2009 Q3Update
FY 2009Results
FY 2009 EPS Of $2.52 Within Original Guidance Range Of $2.45 to $2.80
High End of Range
Low End of Range
* Excludes unusual items.
*
123

$2.52 $0.14$2.46$0.08
ExcludingUnusual Items
Restructuring Discrete Tax Items GAAP
124
Full Year 2009
Excluding Unusual Items, EPS Decreased 30% to $2.52Excluding Unusual Items, EPS Decreased 30% to $2.52
$3.59$0.13 $3.51
$0.21
ExcludingUnusual Items
Restructuring /Impairment
Discrete Tax Items GAAP
2009 2008

125
$0.77B
$0.56B
2008 2009
$5.1B
$6.5B
2008 2009
2009 Revenue Performance
$5.8B
$4.5B
2008 2009
Electrical ProductsElectrical Products
All Segments Hit Hard By Economic DownturnAll Segments Hit Hard By Economic Downturn
ToolsTools
- 22%- 22%
- 22%- 22%
- 27%- 27%
FX -2.0%Acq. .6%Core -20.9%
FX -1.8%Acq. .6%Core -20.4%
FX -2.8%Core -24.4%

2009 Revenue Growth
All Channels And All Regions Severely ImpactedAll Channels And All Regions Severely Impacted
U.S. + Canada ROW (ex Eur) W. Europe
ElectricalDistribution
Retail Utility Direct / OEM Non-Electr.Distribution
Geographic Region
CustomerChannel - 22% - 15% - 21% -17%
- 23% - 16%
(ex Utility)
- 22%
- 30%
(Core -22.8%) (Core -16.7%) (Core -16.7%)
126

2009 Operating Income*
2008 2009Operating IncomeReturn on Revenues
2008 2009
2008 2009
Cooper Industries: - 38% Electrical Products: - 31%
Tools: Tools: -- 77%77%
Significant Impact From Global Economic DownturnSignificant Impact From Global Economic Downturn
14.3%14.3% 14.1%14.1%
3.3%3.3%
11.3%11.3%
16.2%16.2%
10.6%10.6%
$930M
$574M
$930M
$638M
$81M
$19M
* Excluding unusual items 127

-0.3%
8.4% 9.4%
-15.4%-22.0% -23.1% -20.6%
-4.7% -4.6%
1.0%
10.8%7.4%
10.7%
15.4%12.7%
-17.0%
-25.1% -24.8%-18.8%
8.4% 6.3% 4.6%
-30%
-25%
-20%
-15%
-10%
-5%
0%
5%
10%
15%
20%
2001 2002 2003 2004 2005 2006 2007 2008 1Q09 2Q09 3Q09 4Q09
Core
Revenue Growth and ROS History
Year over year growth
4 Years To Recover To 15% ROS In Last Cycle…2 Quarters This Time
Electrical Products
12.0% 13.0% 13.7% 14.6% 15.9% 16.6% 16.2%ROS* 15.1%
* Excl. Restructuring
13.6%12.4%12.5% 15.5%
128

5.4% 2.5% 1.4%
-24.5%-29.5% -27.8%
-13.2%
-9.6%-12.2%
10.6%
5.4%
-1.0%
3.5% 4.8%
-3.7%
-31.5%-35.3%
-31.0%
-7.0%
-6.2%-2.4%
2.3%
-40%
-30%
-20%
-10%
0%
10%
2001 2002 2003 2004 2005 2006 2007 2008 1Q09 2Q09 3Q09 4Q09
Core
Revenue Growth and ROS History
Year over year growth
Strong Sequential Margin Improvement
Tools
4.3% 5.5% 8.5% 9.1% 11.3% 11.8% 10.6%ROS* 4.9%
*Excl. Restructuring
2.1%-3.1%9.5% 8.3%
129

130
$0
$50
$100
$150
2003 2004 2005 2006 2007 2008 2009
Depreciation Capital Spending
OWC Turns
3.0
4.0
5.0
6.0
7.0
2003 2004 2005 2006 2007 2008 2009
Capital Utilization Improvement
55
60
65
70
2003 2004 2005 2006 2007 2008 2009
Receivable DSOInventory Turns
Capital Expenditures
2.0
3.0
4.0
5.0
6.0
7.0
2003 2004 2005 2006 2007 2008 2009
($millions)

131
0.0
0.5
1.0
1.5
2.0
2.5
1998 1999 2000 2001 2002 2003 2004 2005 2006 2007 2008 2009
Free Cash Flow To Recurring Income*
* Recurring Income from Continuing Operations, excluding unusual items
Nine Consecutive Years Of >1x ConversionNine Consecutive Years Of >1x Conversion

132132
Total Debt (Dec. 31, 2009)
Amount Rate Due Date$ 325 3.55% Nov 20121
300 5.56% Apr 2015300 5.75% Jul 2017
925 Long-Term Debt10 Short-Term & Misc. Long-Term Debt
0 Commercial Paper935 Total Debt
(382) Cash
$ 553 Net Debt ($952 at December 31, 2008)
Balance Sheet Remains A Strategic AssetBalance Sheet Remains A Strategic Asset1 Swapped to Euro Debt - 5.25% note rate at date of issuance
($ Millions)

133
38.8%
36.2%
29.3%
26.1%
20.5%
15.7%
24.8%
26.8%
19.1%
10%
20%
30%
40%
50%
2001 2002 2003 2004 2005 2006 2007 2008 2009
Net-Debt To Total Capitalization*
* Net Debt: Total Debt less Cash and Investments
Continue To Invest In Long-Term Growth While Maintaining A Conservative Capital Structure
Continue To Invest In Long-Term Growth While Maintaining A Conservative Capital Structure

134
Return on Invested Capital
Disciplined Capital ManagementContinues To Drive Returns
Disciplined Capital ManagementContinues To Drive Returns
8.2%
9.7%10.8%
13.5%14.3% 14.7%
10.7%
2003 2004 2005 2006 2007 2008 2009

135
2009 Summary
Cost Structure And Balance Sheet Adjusted Rapidly And Efficiently
Sequential Margin ImprovementsNinth Consecutive Year Free Cash Flow Exceeds Recurring IncomeContinued Strategic Investments In Downturn– New Products, Global Expansion, Acquisitions
Maintained Conservative Capital Structure
Positioned Cooper For The Future
Well Positioned To Leverage Growth OpportunitiesWell Positioned To Leverage Growth Opportunities

2010 OutlookTerry Klebe, SVP and CFO
Cooper Industries2010 Outlook Meeting

137
End Markets
Resi10%
Commercial24%
Utility22%
Industrial39%
Other5%
Diversified End-Market Exposure…Strong Penetration In International Markets
Diversified End-Market Exposure…Strong Penetration In International Markets
2009 Revenues 2010 Revenue Forecast
Resi11%
Commercial21%
Utility22%
Industrial41%
Other5%

138
2010 Forecast: Industrial Market
Cooper Revenue Grows 3% to 7% (0% to 4% Core) On Improving International Markets And MRO SpendCooper Revenue Grows 3% to 7% (0% to 4% Core)
On Improving International Markets And MRO Spend
Industrial Production– U.S. markets flat to up– International markets grow
(especially developing markets)
Factory Utilization– Capacity utilization shows modest
improvement
Capital Spending– MRO orders improve, improved
credit markets help CapEx– Energy efficiency spend continues
Energy– Worldwide infrastructure projects
activity increasing
Canada5%
Europe,M.E., Africa
(EMEA)24%
AsiaPac. 10%
U.S.53%
LatinAmer.
8%
2009 Revenue $2.0 Billion

139
2010 Forecast: Commercial Market
Energy efficiency / LED adoption continues to grow
U.S. non-residential down 15% to 20%
International markets mixed• Europe flat to down• Developing markets grow
Economic stimulus package a wild card
U.S. commercial construction recovery not foreseen until 2011
Canada6%
EMEA26%
AsiaPac.
3%
U.S.62%
LatinAmer.3%
Cooper Revenue Declines 7% to 12% (-9% to -15% Core) On Commercial Construction Continued Weakness
Cooper Revenue Declines 7% to 12% (-9% to -15% Core) On Commercial Construction Continued Weakness
2009 Revenue $1.2 Billion

140
2010 Forecast: Utility Market
Smart grid / utility automation continues to grow
International growth
U.S utility modest spending increase in late 2010
Aging grid continues to need upgrade with long-term outlook positive
Stimulus package opportunities…Smart Grid and T&D investments
Canada6%
EMEA4%
AsiaPac. 13%U.S.
68%
LatinAmer.
9%
Cooper Revenue -2% to +2% As U.S Utility Spending Does Not Improve Until Late 2010Cooper Revenue -2% to +2% As U.S Utility
Spending Does Not Improve Until Late 2010
2009 Revenue $1.1 Billion
141
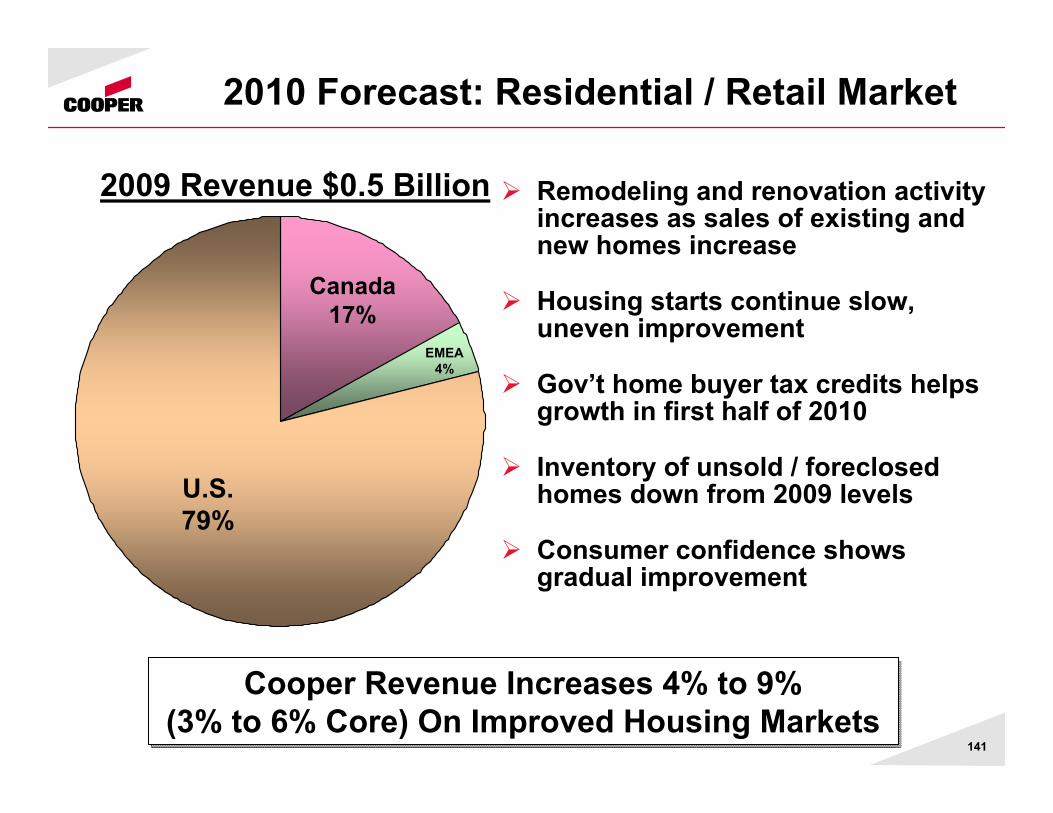
2010 Forecast: Residential / Retail Market
Remodeling and renovation activity increases as sales of existing and new homes increase
Housing starts continue slow, uneven improvement
Gov’t home buyer tax credits helps growth in first half of 2010
Inventory of unsold / foreclosed homes down from 2009 levels
Consumer confidence shows gradual improvement
Canada17%
EMEA4%
U.S.79%
Cooper Revenue Increases 4% to 9% (3% to 6% Core) On Improved Housing Markets
Cooper Revenue Increases 4% to 9% (3% to 6% Core) On Improved Housing Markets
2009 Revenue $0.5 Billion

142
2009
End Markets: Today vs. Past
Expanding Industrial And Utility ExposureExpanding Industrial And Utility Exposure
2003
Utility + Industrial = 47%Commercial + Resi = 51%
Utility + Industrial = 61%Commercial + Resi = 34%
Resi10%
Commercial24%
Utility22%
Industrial39%
Other5%
Resi18%
Commercial33%Utility
18%
Industrial29%
Other2%

143
RevenuesRevenues (w/FX a 2% tailwind)(w/FX a 2% tailwind) --1% to +4%1% to +4%-- Electrical ProductsElectrical Products --2% to +3%2% to +3%-- ToolsTools +7% to +12%+7% to +12%
Recovery In Most Markets Offset By Contraction In Non-Residential Construction
Recovery In Most Markets Offset By Contraction In Non-Residential Construction
2010 Revenue Growth Forecast

144
E.P.S.
Major Items Impacting 2010 Forecast
Overall Markets + / – + / –Sales Mix +Currency Translation (+2% revenue tailwind) + +Price / Material Economics + / – + / –Restructuring Benefits (+$.11 E.P.S. carryover) +Restructuring Expense (-$.06 to -$.08) +Pension and OPEB Cost (+$.03 E.P.S.) +Interest Cost (+$.04 E.P.S.) +Income Tax Rate (19% to 21% for 2010) – –Strategic Initiatives +Fully Diluted Shares Flat
Positioned Very Well For Strong E.P.S. Growth On Flattish Revenues w/ Strong E.P.S. Growth If Core Revenues Exceed Forecast
Positioned Very Well For Strong E.P.S. Growth On Flattish Revenues w/ Strong E.P.S. Growth If Core Revenues Exceed Forecast
Revenue

145
$0
$50
$100
$15020
0320
0420
0520
0620
0720
0820
0920
10E
Depreciation Capital Spending
OWC Turns
3.0
4.0
5.0
6.0
7.0
2003
2004
2005
2006
2007
2008
2009
2010
E
Capital Utilization Improvement
55
60
65
70
2003
2004
2005
2006
2007
2008
2009
2010
E
Receivable DSOInventory Turns
Capital Expenditures
2.0
3.0
4.0
5.0
6.0
7.0
2003
2004
2005
2006
2007
2008
2009
2010
E
($millions)

146
2.0
1.41.1 1.3 1.1 1.2 >1.0 1.2
1.5 1.2
2001
2002
2003
2004
2005
2006
2007
2008
2009
2010
E
Free Cash Flow to Recurring Income
Expect Free Cash Flow In Excess Of Recurring Income For 10th Year In A Row
Expect Free Cash Flow In Excess Of Recurring Income For 10th Year In A Row
1.0

147
RevenuesRevenues $1.26B $1.22 to $1.29B $1.26B $1.22 to $1.29B --3% to +2% 3% to +2% ElectricalElectrical 1.13B 1.13B --4% to +1%4% to +1%ToolsTools .13B .13B +10% to +15%+10% to +15%
Earnings per Share*Earnings per Share* $.47 $.65 to $.70 +38% to +49%$.47 $.65 to $.70 +38% to +49%
Currency Translation In Forecast Adds 4% To Q1 ‘10 Revenues…. Significant Earnings Leverage On Core Revenue Decline
Currency Translation In Forecast Adds 4% To Q1 ‘10 Revenues…. Significant Earnings Leverage On Core Revenue Decline
Outlook 1Q‘10
1Q1Q’’0909 1Q1Q’’1010 V%V%
* Excluding unusual items
148
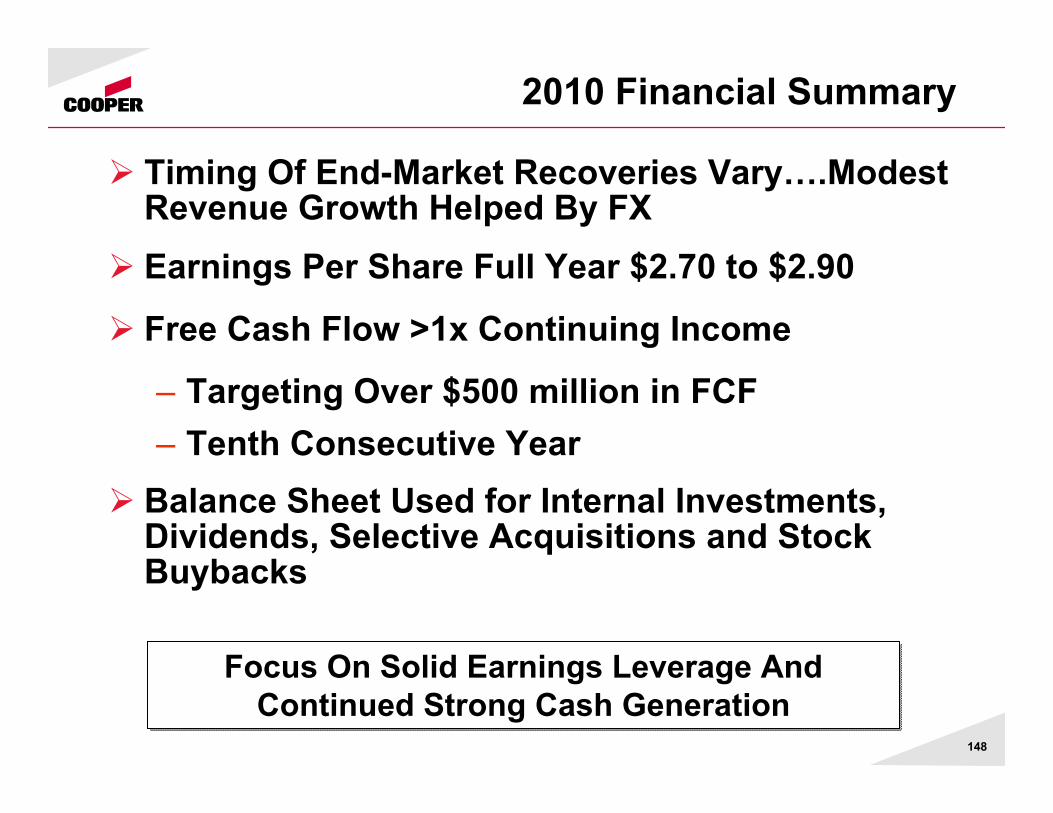
2010 Financial Summary
Timing Of End-Market Recoveries Vary….Modest Revenue Growth Helped By FXEarnings Per Share Full Year $2.70 to $2.90
Free Cash Flow >1x Continuing Income
– Targeting Over $500 million in FCF– Tenth Consecutive Year
Balance Sheet Used for Internal Investments, Dividends, Selective Acquisitions and Stock Buybacks
Focus On Solid Earnings Leverage And Continued Strong Cash Generation
Focus On Solid Earnings Leverage And Continued Strong Cash Generation

Cooper Industries2010 Outlook Meeting
SummaryKirk Hachigian, Chairman & CEO

150
Cooper In 2006 (Slide from Feb 2009 Outlook)
Revenue - $5.2B (Down 20% From 2008)
Margins:– Electrical 14-16%– Tools 10-11%
Free Cash Flow (After Cap Ex) - $500M
EPS - $2.58*
Well Positioned Heading Out Of TheStorm…With An Attractive Dividend
* 2006 Share count 187.6M vs. ~169M shares today
2010 EPS Estimate Of $2.70 to $2.90

151
2010 Outlook
+ Capital markets are dramatically improved
+ Global economies are stable/improving; emerging markets remain strong
+ Positive indicators─ Manufacturing─ Housing
+ Government stimulus…low interest rates
─ High unemployment remains
─ Record levels of excess capacity
─ Construction and commercial real estate remain weak
─ Reforms are creating uncertainty:▪ Financial ▪ Healthcare▪ Energy/Climate▪ Tax
Improving Headwinds
Growth Will Come From Customer Loyalty, Innovation And Globalization
Growth Will Come From Customer Loyalty, Innovation And Globalization

152
Portfolio Diversity
2010 Revenue Neutral…Next Four Years Look Strong2010 Revenue Neutral…Next Four Years Look Strong
End Market % of Sales 2010 2011 2012 2013 2014
Industrial 39%
Commercial 24%
Utility 22%
Resi/Other 15%
International 39%
Market Outlook
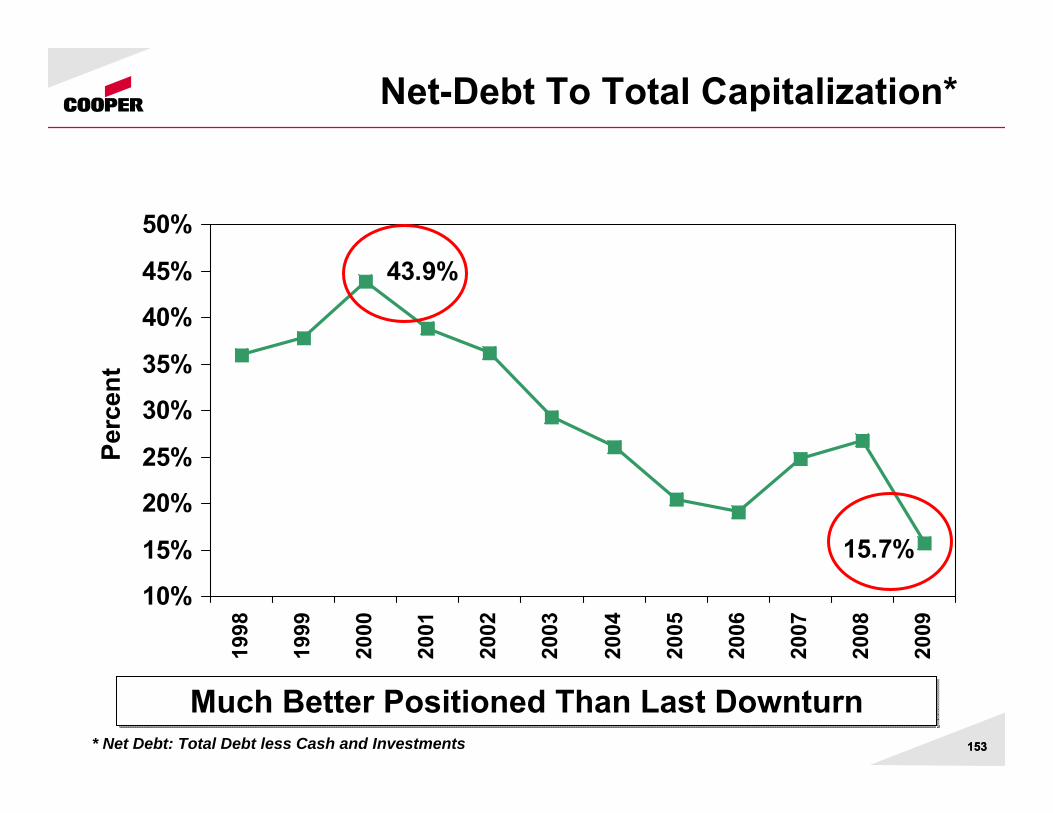
153153
43.9%
15.7%
10%
15%
20%
25%
30%
35%
40%
45%
50%19
98
1999
2000
2001
2002
2003
2004
2005
2006
2007
2008
2009
Perc
ent
Much Better Positioned Than Last DownturnMuch Better Positioned Than Last Downturn* Net Debt: Total Debt less Cash and Investments
Net-Debt To Total Capitalization*

154
Capital Allocation 2010
Debt
Dividend
Acquisitions
StockBuy-Back
No Debt Due In 2010 And No Commercial Paper Outstanding
~$180M in 2010 – 8% Increase From 2009
Bolt-ons – Drive More Size & Scale
Cheap/Low Risk/No Market Premium (~12M Share Authorization)
Balanced Approach To Maximize Shareholder ValueBalanced Approach To Maximize Shareholder Value

155
Cooper Business Model
Cooper GrowthMandate
Customer Loyalty Innovation Globalization
Talent Development Op. Excellence M&A
Focused And Proven Business ModelFocused And Proven Business Model

156
2003-2008 Cycle Results
2003-2008 Electrical Sales Up 11.4% (7.4% Core) On Average
2003-2008 EPS Total Cooper Grew 20% Per Year
Free Cash Flow Averaged $560M Per Year…Always Greater Than Recurring Income
Exceptional Growth/Earnings And Cash Leverage On An Up Cycle
Exceptional Growth/Earnings And Cash Leverage On An Up Cycle

157
Shareholder Value Creation
All The Pieces Are In Place For Continued Exceptional Returns
All The Pieces Are In Place For Continued Exceptional Returns
DiverseGlobalTechnology
Great Portfolio
Disciplined M&ADividendsBuybacks
Cash Deployment
Business Model/ExecutionStrong Cash FlowRapidly ScalablePerformance-Based Culture

Cooper Industries2010 Outlook
Questions & Answers