Outline · production volume) and adoption of pro-market FX reforms by the Central Bank of Nigeria...
67
Transcript of Outline · production volume) and adoption of pro-market FX reforms by the Central Bank of Nigeria...


Afrinvest West Africa Page 2
Outline
Section 1 Executive Summary 04
Section 2 Global Economy and Financial Markets Review and Outlook 14
• Synchronised Global Growth Expansion to Continue Despite Policy Stability Risks 15
• Policy Normalization by Systemic Central Banks Remains Downside Risk to EMs &
DEs Growth 16
• Global Markets: Consensus Opinion Points to Further Gains against Strong Macro
Backdrop 16
Section 3 Domestic Macroeconomic Review and Outlook 17
• The Recession and its Aftermath 18
• Business Cycle Turnaround: Cyclical Oil Earnings Upswing Masks Structural
Reform Inertia 19
• 2018 Macroeconomic Prognoses…Consolidating the Recovery 22
Section 4 Equities Market Review and Outlook 29
• Equites Market Performance and Outlook – A possible Game of Two Halves? 30
• Sector Performance…Broad Based Rally Recorded across Sectors 31
• Our Scenario Analysis in 2018 32
• Equities Market Prognoses for 2018…The Era of “Happy-go-lucky Trading” to Fizzle Out 35
Section 5 Fixed Income Market Review and Outlook 37
• Sustained Tight Monetary Policy Bolstered Activity in Fixed Income Market 38
• Fixed Income Market Prognoses in 2018… Overall Activity Should Favour Optimal Return 41
Section 6 Alternative Asset Classes 43
• Real Estate Market Review and Outlook 44
• Derivatives Market Review and Outlook 46
• Global Commodities Review and Outlook 49
Section 7 Investment Strategy for 2018 53
• Consumer Goods Portfolio 55
• Banking Quality Portfolio 56
• Short-Term Dividend Income Portfolio 56
• Long-Term Dividend Portfolio 57
• Sentiment Portfolio 57
• Smart Eurobond Portfolio 57

Afrinvest West Africa Page 3
Outline
• Low Risk Aggressive Portfolio 58
• High Return Long-Bond Portfolio 58
• Passive Bond Portfolio 59
Section 8 List of Charts, Tables and Figures 60
Section 9 Afrinvest (West Africa) Limited 63
• Contact 64
• Disclaimer 65

Nigerian Economic & Financial Market Outlook 2018 Page 4
Executive Summary
Section One

Afrinvest West Africa Page 5
Executive Summary
Global Macroeconomic Highlights
The global economy continued to record synchronised expansion across regions
in 2017. This has been supported by sustained momentum in Advanced
Economies (AEs), brought about by favourable financial conditions and cyclical
recovery in the Euro Area, resilient growth in China and rebound in frontier
markets propped by increase in commodity prices. The strong and synchronised
global growth upswing is expected to continue into 2018, with the IMF revising
2018 forecast upward by 0.1% to 3.7% in October 2017 and 0.2% to 3.9% in
January 2018. Nevertheless, while near term global growth prospects remains
broadly positive, increasing geo-political risk, trade protectionism and policy
normalization by systemic central banks are downside risks to forecasts.
Likewise, as the move towards normalization strengthens in 2018, supported by
favourable labour market conditions and increased momentum in global
growth, systemic central banks in developed markets would be more willing to
begin monetary policy tightening despite sticky inflation. As central banks
gradually normalize monetary policy from the extraordinary measures taken at
the peak of the global economic and financial crisis, associated downside risks of
tightening global liquidity and capital flow reversals from emerging & frontier
markets and currency volatility will become more prominent headwinds to near
term growth and financial market stability.
Domestic Macroeconomic Highlights
The year 2017, in many respects, was a year of recovery for the Nigerian
economy and financial market compared to the sharp business cycle contraction
witnessed in 2016 alongside weak market returns. Consequent on the upturn in
commodity prices, cessation of attacks on oil & gas infrastructure in the Niger
Delta region (which had a positive knock-on impact on domestic crude oil
production volume) and adoption of pro-market FX reforms by the Central Bank
of Nigeria (CBN), economic activity rebounded while investor and consumer
confidence as well as business sentiments strengthened.
The Nigerian economy returned to growth in Q2:2017, exiting a 4-Quarter long
recession - its first in 25 years – which lasted between Q2:2016 and Q1:2017.
Propped by higher oil exports and administrative flexibility in FX management
structure, reflected in increased CBN FX Interventions and opening of the
Investors’ and Exporters’ (I&E) FX Window in April 2017, external sector
indicators also turned positive with the Current Account Surplus jumping nearly
four times from US$2.5bn in 2016 to US$9.5bn in 2017 while cumulative Capital
Importation as of 9M:2017 rose 91.5% Y-o-Y to a 2-year high of US$6.8bn. The
favourable Balance of Payment dynamics led to accumulation in External
Reserves which climbed to a 3-year high of US$38.7bn (29/12/2017) and
stabilized the Naira at the official window with a consequential impact on the
parallel market which gained 35.0% Y-o-Y against the greenback to close at
N363.00/US$1.00 by yearend. Supported by improved growth prospects and FX
liquidity, business sentiment, gauged by the CBN’s Manufacturing and Non-
Manufacturing Purchasing Managers’ Indices (PMI), indicated expansion in
activity from April 2017 till date. Consumer Confidence has also been on the rise,
with the NOI (Ngozi Okonjo Iweala) Polls survey showing a 4.8 points increase in
its Consumer Confidence Index from 62.7 points in Q1:2017 to 67.5 points in
Q3:2017.
The strong and
synchronised global
growth upswing is
expected to continue
into 2018, with the IMF
revising 2018 forecast
upward by 0.1% to 3.7%
in October 2017 and
0.2% to 3.9% in January
2018.
Although price level
growth disappointed for
much of the year,
persistently falling
below Analysts’
estimates, due to
pressures on food prices,
Headline Inflation
measured Year-on-Year
(Y-o-Y), moderated
3.2ppts to 15.4% in
December 2017 while
the Core measure of
prices fell 6.0ppts within
the same period to
12.1%.

Page 6 Nigerian Economy & Financial Market Outlook 2018
Executive Summary
Although price level growth disappointed for much of the year, persistently
falling below Analysts’ estimates, due to pressure on food prices, Y-o-Y Headline
Inflation moderated 3.2ppts to 15.4% in December 2017 while the Core Inflation
fell 6.0ppts within the same period to 12.1%. Labour market slack was the only
blot on the strong improvement in core macro variables as the economy
struggled to create jobs for the expanding labour force, forcing Unemployment
and Underemployment rates to rise 4.6ppts and 0.2ppts to 18.8% and 21.2%
respectively in Q3:2017. On the back of the strong oil price tailwind, our near
term prognoses for macroeconomic indicators are broadly positive as we expect
the economy to consolidate on recent recovery.
Price Level… Benign Outlook as Policy Makers Hold-off on Supply Side
Reforms
Unlike 2016 when the spike in food prices pressured the Consumer Price Index
(CPI), the major risk-factor for Consumer Prices in 2018 will be coming from the
Core Index where delayed supply-side reforms in regulated markets for Power
and Fuel could destabilize prices. The Power sector is currently facing a liquidity
crunch due to non-cost reflective tariffs and lack of investment in the value chain
to ease high Aggregate Technical, Commercial and Collection (ATC&C) losses,
resulting in demand for increase in tariff by value chain operators. Furthermore,
the “Price-Modulation” template for pricing of PMS (Petroleum Motor Spirit)
introduced by the Petroleum Products Pricing Regulatory Agency (PPPRA) in May
2016, in retrospect, is akin to putting Band-Aid on a bleeding artery rather than
a landmark reform to liberalise the downstream industry as earlier guided.
Already, assumptions included in the template are urgently due for upward
review on the back of the increase in the landing cost of PMS – following the oil
price rally and the June-2016 Naira devaluation.
Despite these risk factors, our near-term inflation outlook remains benign due to
constrained political will to implement supply side reforms ahead of the 2019
elections. Supportive oil earnings tailwind will also buy the federal government
more time to contemplate the reforms. Hence, our base-case scenario projects
Headline Inflation moderating further to 12.3% by yearend 2018.
Near Term Growth Outlook … Oil Sector Low Base Effect Will Remain
Key Driver
The economy’s return to growth in Q2:2017 and acceleration in momentum in
Q3 were largely driven by Oil sector GDP which grew 3.5% and 25.9% Y-o-Y in
Q2:2017 and Q3:2017 respectively. The sizeable expansion in the Oil sector,
particularly in Q3:2017, was due to the low base effect of oil sector production
which reached a 6-Quarter high of 2.0mb/d during the period. The Non-Oil
sector however remains a pressure point, as it relapsed to negative growth in Q3
after showing positive signs in Q1 and Q2. The disappointing performance of the
Non-Oil sector - which was unexpected given the positive readings from leading
variables such as the PMI - is evident in virtually all the main Non-Oil categories
including Services and Manufacturing which contracted 2.7% and 2.9% Y-o-Y
respectively in Q3:2017. The slow recovery of the Non-Oil sector has both cyclical
and structural explanations. Cyclical factors include tight monetary policy,
subsisting weak fiscal spending – particularly at sub-national level - low real
household consumption growth (due to high inflation rate) and benign
corporate investment spending consequent on the damaging impact of large FX
rate movements in the last 3 years on corporates’ balance sheet.
Already, assumptions
included in the template
are urgently due for
upward review on the
back of the increase in
the landing cost of PMS
– following the oil price
rally and the June-2016
naira devaluation.

Afrinvest West Africa Page 7
Executive Summary
Whilst the structural issues remain headwinds, we note that the cyclical
challenges should start to abate from 2018 and buoy Non-Oil sector growth
against the backdrop of 1) anticipated expansion in fiscal spending as fiscal
balance stabilizes and political parties spend ahead of the election, 2) further
deceleration of inflation rate which will directly affect GDP price deflator and
support real growth, and 3) Increase in private investments due to favourable
aggregate demand outlook and stable FX rate. Similar to 2017, we also expect
Oil sector low-base push to remain a key driver of growth until Q2:2018 before
the effect wears off as base normalizes. The expected take-off of oil production
from Total’s offshore Egina field project in Q4:2018 will possibly add
approximately 200,000 barrels to daily crude production, but with oil production
capped by OPEC at 1.8mb/d (ex- condensates), we do not foresee aggregate oil
production (including condensate) breaking its peak of 2.2mb/d.
Thus, against the backdrop of expected rebound in Non-Oil sector and Oil sector
low base push, we forecast GDP growth to accelerate to 2.1% in 2018 from our
full year estimate of 0.7% for 2017. Major downside risks to our forecast include
OPEC/Non-OPEC decision on Nigeria’s production cap, development in the oil
market and stability in the Niger-Delta.
Monetary Policy Outlook… Easing Cycle to Enter Full Gear despite Stable
Benchmark Rate
As we projected in our 2017 Outlook, the CBN successfully guided short and long-
term rates downward in the fixed income market despite retaining benchmark
policy rate at 14.0%. Although price level growth disappointed in 2017, with
Inflation rate still above MPR, the CBN began an easing cycle with the use of
clearing rates at OMO auctions and frequency of auctions as policy instruments
to achieve its easing objective. Typically, what should follow the moderation in
market rates and signify the full take-off of the easing cycle is a benchmark
interest rate cut. However, we believe the CBN would stick to utilizing its recently
favoured OMO strategy – which is more flexible - to achieve the same easing
objective without tweaking the MPR. Despite our conviction, we do not rule out
the possibility of a politically induced benchmark rate reduction in the second
half of 2018, in order to make credit available to the real sector. If economic
conditions improve further, this could potentially be done in order to score
political points with the populace ahead of the 2019 election.
Our forecast is based on downside risks considerations relating to 1) anticipated
fiscal spending in the run up to the general elections and expected volatility in
domestic assets market in H2:2018 which will pose a threat to price and exchange
rate stability; 2) expected monetary policy tightening by systemic central banks in
Europe and North America which could spur capital outflows from emerging and
frontier markets and constitute downside risk to domestic exchange rate
stability; and 3) benign but double-digit inflation rate which may not necessarily
go below MPR but would support a hold on the rate as the CBN tries to
consolidate gains on price levels. Hence, our monetary policy outlook favours
continued downward repricing of fixed income yields, albeit with a stable MPR.
Fiscal Policy Outlook… Focus on Reducing Debt Service Obligations
amidst Rising Expenditure Pattern
Nigeria’s increasing debt burden and rising servicing cost have come under focus
in recent times for justifiable reasons. Whilst current debt to GDP ratio (18.2% )
appears non-threatening, rising servicing cost relative to revenue (47.0% in
Thus, against the
backdrop of expected
rebound in Non-Oil
sector and Oil sector low
base push, we forecast
GDP growth to
accelerate to 2.1% in
2018 from our full year
estimate of 0.7% for
2017.
Although price level
growth disappointed in
2017, with Inflation rate
still above MPR, the CBN
began an easing cycle
with the use of clearing
rates at OMO auctions
and frequency of
auctions as policy
instruments to achieve
its easing objective.

Page 8 Nigerian Economy & Financial Market Outlook 2018
Executive Summary
FY:2016) and slow growth of non-oil revenue post-crisis have increased debt
sustainability risk – a key consideration of Moody’s in recent sovereign
downgrade. The FGN responded by changing its 10-year long conservative debt
strategy of relying more on domestic market for debt to tilting towards cheaper
external sources in the global market to reduce servicing costs. Thus, the FGN
returned to the Eurobond market after a 4-year hiatus in 2017, raising US$1.5bn
in Q1:2017 and US$3.0bn out of a US$5.5bn approved Medium Term Note
Project in Q4:2017. Despite the steep decline in domestic market rates, we expect
the FGN to stick to the new strategy in the near term due to the favourable
global market environment and its ambitious expenditure plan.
As with prior years, the 2018 Budget projects a reflationary spending of N8.6tn, a
16.2% increase relative to the N7.4tn of 2017, with a focus on consolidating on
gains recorded in the previous year whilst also prioritizing the need to bridge
the investment deficits in the Infrastructure, Agriculture and Health sectors
amongst others. While the budget’s macroeconomic variables assumptions are
not far off from current realities, perhaps even prudent with regards to crude oil
prices, we are of the view that achieving >70.0% implementation of capital
component will be difficult due to the ambitious non-oil and independent
revenue assumptions. As of 9M:2017, performance of the “Budget of Recovery
and Growth” had been rather underwhelming with fiscal authorities falling
short of revenue targets, especially Non-oil revenue (N0.7tn actual vs. N1.0tn pro
-rated projection) and Independent Revenue (N155.1bn vs. N605.9bn pro-rated
projection). Thus, the Non-core revenue lines which contain non-recurring items
such as Exchange Rate difference and Paris Club over-deduction refund were
leveraged to finance the budget. While the Presidency hopes to improve on
existing tax reforms to boost income from the Non-oil sector as well as enhance
activities in other sectors of the economy, the odds of a significant increase in tax
revenue in the short term remains low as Non-oil sector growth remains below
historical trend.
Polity Stability: Security Concerns and Ethnic Divide Setting Stage for
Volatile Election Cycle
One of the major downside risks to asset prices or capital markets and polity
stability in 2018 is politicking ahead of the General Elections holding in February
2019. President Muhammadu Buhari of the All Progressives Congress (APC) is
widely expected to seek re-election in what would potentially be a keenly
contested poll due to the waning popularity of the incumbent in Southern
Nigeria (see NOI polls) and divisions in the ruling party which has already led to
the defection of Former Vice-President Atiku Abubabar to the opposition
People’s Democratic Party (PDP).
Typical of election cycles in frontier markets, we expect to see some volatility in
financial assets in the period leading up to the polls whilst policymaking will
take a shorter-term perspective. Key issues we expect to dominate debates
include Job Creation, Security and Political Restructuring. Slacking labour force
despite improving growth profile has led to an increase in Unemployment and
Underemployment rate with 34.0m people either without jobs or
underemployed. Whilst secession agitation in the South East appears to have lost
momentum and government’s efforts to placate Niger Delta militants has largely
succeeded, the impact of climate change – which has ravaged grazing fields in
Northern Nigeria – has increased incidences of trespassing in farmlands in North
Whilst current debt to
GDP ratio (18.2% )
appears non-
threatening, rising
servicing cost relative to
revenue (47.0% in
FY:2016) and slow
growth of non-oil
revenue post-crisis have
increased debt
sustainability risk – a key
consideration of
Moody’s in recent
sovereign downgrade.
President Muhammadu
Buhari of the All
Progressives Congress
(APC) is widely expected
to seek re-election in
what would potentially
be a keenly contested
poll due to the waning
popularity of the
incumbent in Southern
Nigeria (see NOI polls)
and divisions in the
ruling party which has
already led to the
defection of Former Vice
-President Atiku
Abubabar to the
opposition People’s
Democratic Party (PDP).
Afrinvest West Africa Page 9
Executive Summary
Nigerian Financial Markets
The Nigerian equities market posted its first positive annual return in four years
(+42.3%) in 2017, ranking the benchmark All Share Index (ASI) as the 11th best
performer in the world and 2nd in Africa. The launch of the Investors’ and
Exporters’ FX window in April,2017, was a turning point for the market during
the year while a rebound in economic activities, supported by rising oil prices
above US$60.0/b and improvements in company earnings kept investors vested in
the market all through the year.
With the market now at an all-time high in terms of market capitalisation and
the NSE All Share Index at a 9-year high, there are justifiable fears of
overvaluation of the market which raises concerns with regards to a near term
correction. Our approach is to diagnose and probe the fundamental as well as
technical merits and demerits of the overvaluation hypothesis.
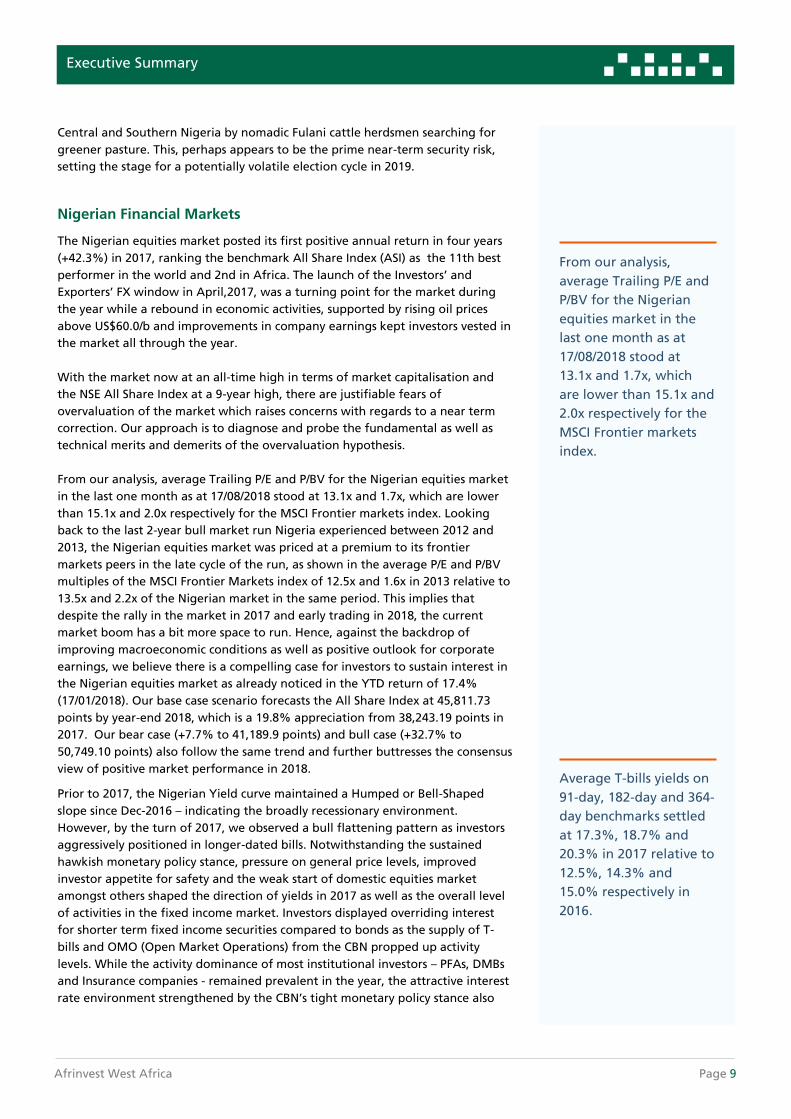
From our analysis, average Trailing P/E and P/BV for the Nigerian equities market
in the last one month as at 17/08/2018 stood at 13.1x and 1.7x, which are lower
than 15.1x and 2.0x respectively for the MSCI Frontier markets index. Looking
back to the last 2-year bull market run Nigeria experienced between 2012 and
2013, the Nigerian equities market was priced at a premium to its frontier
markets peers in the late cycle of the run, as shown in the average P/E and P/BV
multiples of the MSCI Frontier Markets index of 12.5x and 1.6x in 2013 relative to
13.5x and 2.2x of the Nigerian market in the same period. This implies that
despite the rally in the market in 2017 and early trading in 2018, the current
market boom has a bit more space to run. Hence, against the backdrop of
improving macroeconomic conditions as well as positive outlook for corporate
earnings, we believe there is a compelling case for investors to sustain interest in
the Nigerian equities market as already noticed in the YTD return of 17.4%
(17/01/2018). Our base case scenario forecasts the All Share Index at 45,811.73
points by year-end 2018, which is a 19.8% appreciation from 38,243.19 points in
2017. Our bear case (+7.7% to 41,189.9 points) and bull case (+32.7% to
50,749.10 points) also follow the same trend and further buttresses the consensus
view of positive market performance in 2018.
Prior to 2017, the Nigerian Yield curve maintained a Humped or Bell-Shaped
slope since Dec-2016 – indicating the broadly recessionary environment.
However, by the turn of 2017, we observed a bull flattening pattern as investors
aggressively positioned in longer-dated bills. Notwithstanding the sustained
hawkish monetary policy stance, pressure on general price levels, improved
investor appetite for safety and the weak start of domestic equities market
amongst others shaped the direction of yields in 2017 as well as the overall level
of activities in the fixed income market. Investors displayed overriding interest
for shorter term fixed income securities compared to bonds as the supply of T-
bills and OMO (Open Market Operations) from the CBN propped up activity
levels. While the activity dominance of most institutional investors – PFAs, DMBs
and Insurance companies - remained prevalent in the year, the attractive interest
rate environment strengthened by the CBN’s tight monetary policy stance also
Central and Southern Nigeria by nomadic Fulani cattle herdsmen searching for
greener pasture. This, perhaps appears to be the prime near-term security risk,
setting the stage for a potentially volatile election cycle in 2019.
From our analysis,
average Trailing P/E and
P/BV for the Nigerian
equities market in the
last one month as at
17/08/2018 stood at
13.1x and 1.7x, which
are lower than 15.1x and
2.0x respectively for the
MSCI Frontier markets
index.
Average T-bills yields on
91-day, 182-day and 364-
day benchmarks settled
at 17.3%, 18.7% and
20.3% in 2017 relative to
12.5%, 14.3% and
15.0% respectively in
2016.

Page 10 Nigerian Economy & Financial Market Outlook 2018
Executive Summary
attracted retail and HNI investors to the market. Average T-bills yields on 91-day,
182-day and 364-day benchmarks settled at 17.3%, 18.7% and 20.3% in 2017
relative to 12.5%, 14.3% and 15.0% respectively in 2016.
On the medium to long term end of the market, the dominance of the Federal
Government of Nigeria as the largest supplier of fixed income became
entrenched in 2017 with a total sovereign bond issuance value of N1.5tn
compared to N1.3tn in 2016. In addition, the FGN explored alternative long term
borrowing windows within the domestic market including the launch of the
Quarterly Coupon Paying Savings Bonds (N7.0bn, 13.5%), N100.0bn Sukuk bond
issued at 16.5% rental yield and the Green Bond worth N10.7bn issued in
December 2017 at 13.5% yield. Also, the Debt Management Office (DMO)
successfully raised a total of US$4.5bn (in four tranches) from the Eurobond
market at an average marginal coupon rate of 7.3% while also successfully
completing a US$300.0m Diaspora bond at 5.6%.
We believe the yield environment in 2018 will be largely determined by market
activities as already being noticed since the last quarter of 2017. Nevertheless, we
do discountenance the possibility of a benchmark rate reduction in H2:2018 to
align with market movement. We are of the view that the demand for safer
sovereign instruments by Institutional Fund Managers (notably PFAs, Insurance
Companies, DMBs as well as HNIs will propel market activities towards yield
moderation. We highlight some of the revelations from gazing at our crystal ball
to include:
• Yield Moderation on Long Term Instruments
• Undissipated Inflationary Pressures may Keep Short Term Rates Upbeat
• Flurry of Commercial Paper Issuance as Government Participation Reduces
• Higher Modified Duration Bonds will Support Long Term Fixed Income
Strategy
• Eurobonds Market will Favour Active Fixed Income Strategy
• Corporates will Explore Domestic Market Options for Long Term Financing
Our optimism for the Nigerian markets in 2018 hinges on the slow but steady
recovery in the general macroeconomic conditions following the upturn in
global oil prices. Stable oil price outlook puts less strain on monetary and fiscal
policies given the significant dependence of government revenue on oil exports
as well as the umbilical reliance of the CBN on the sector’s foreign exchange
earnings in optimizing FX allocation. As the economy gradually regains its
growth momentum, we are confident that improved fundamentals, coupled
with enhanced investor sentiment – currently at all-time highs, will continue to
drive equity asset prices. Correspondingly, our prognosis on interest rate
proposes a market driven moderation in 2018 as the government shifts its focus
from short term domestic borrowing to long term foreign debt while investors
explore alternative high yielding domestic short/long term securities.

Afrinvest West Africa Page 11
Executive Summary
Recovery Driven Fundamentals to Shape Investment Strategy
Against the backdrop of macroeconomic headwinds, our investment strategy in
2017 had advised a cautious strategy focused on capital preservation whilst
recommending investors stay overweight on fixed income securities over equities
with an advised mix of 80:20 allocation. Looking back, all our crafted portfolios
outperformed market benchmarks by significant margins with our equity
dividend portfolio returning 77.8% (vs. NSE ASI 42.3%) and the worst performing
bond portfolio gaining 16.6% (vs. market benchmark of 11.6%).
Having survived the policy misalignment that enveloped and weakened equities
market return in 2016, we are of the view that the recent recovery momentum,
which began in 2017, will be sustained in the near term. On the back of a 42.3%
return in 2017, the NSE All Share Index is set for another bullish year, in what
looks like a repeat of 2013, having gained 17.9% as at 19/01/2018. Similarly, the
bull run in the fixed income market in Q4:2017 resulted in a 10.5% return in the
Access Bank Bond index in 2017 relative to a 4.5% loss in 2016; yet, expectation
of lower yields in 2018 will shape performance on fixed income securities.
Consequently, we reason that for the investment strategy in 2018 to be optimal,
it will necessarily have to hinge on fundamentals of investible asset classes.
However, contrary to our 2016 and 2017 investment strategy that suggested
overweight on fixed income securities over equities, we believe 2018 will be
more skewed towards a balance of play between the two traditional asset
classes.
Whilst we are more cautious about equity market valuations inching beyond its
fundamental value threshold, we are also assured that, barring a dysfunctional
foreign exchange market, equities are possibly set for appropriately timed entry
and exit opportunities in 2018. Fundamentally backed sentiments will
conceivably propel the equities market on a volatile but upward trending
trajectory which informs our Equity Strategy that is skewed towards five (5)
major portfolios. Contrariwise, Long Term play defines our overall strategy in the
fixed income market for 2018. We expect the easing of the crowding out effect
of the federal government in the domestic debt market to create incentives for
sub-national and corporate debt issuances as rates on sovereign instruments
moderate towards long term average levels. Importantly, our four (4) portfolios
for smart fixed income investing in 2018 is themed: “Active “and “Liquid”.
We expect the easing of
the crowding out effect
of the federal
government in the
domestic debt market to
create incentives for sub-
national and corporate
debt issuances as rates
on sovereign
instruments moderate
towards long term
average levels.
The Virtuous Cycle… Again!
To investors familiar with frontier markets, the almost 360-degree turnaround in
Nigeria’s economic fundamentals and investor sentiment is not surprising, given
the strong correlation of the business cycle and capital market with foreign
currency earnings for commodity exporting countries. In our 2017 outlook titled
“Reform or Be Relegated”, we had reflected that;
“A return to 2015 level of crude oil production (2.1mb/d) would comfortably lift
oil sector GDP (which accounts for c.9.0% of aggregate real GDP) by an
estimated 15.0% Y-o-Y in 2017 and may pull the economy out of recession… On
this basis, Nigeria’s business cycle would be highly dependent on the ability of
policy makers to deliver incremental oil output in 2017, restore macroeconomic
stability by rebuilding confidence in monetary policy and the administrative side
of the FX market structure as well as showing commitments to structural reforms.
Page 12 Nigerian Economy & Financial Market Outlook 2018
Executive Summary
These would be necessary to stabilize external account, rebuild external reserves,
improve liquidity in the FX market and achieve lower inflation as well as lower
long term interest rates.”
Events in the last 12 months have justified our prognoses as policymakers were
able to deliver on:
1. Increase in domestic crude oil production from a low of 1.6mb/d in Q3:2016
to 2.0mb/d in Q3:2017.
2. Restoration of FX market stability following the increased volume of FX
interventions, particularly to BDCs, and eventual opening of a market-
oriented FX segment (the I&E FX window), which allowed for flexibility in
pricing of FX as well as efficiency and transparency in allocation. The CBN
spent US$15.4bn in the first nine months of 2017 intervening in the FX
market via Spot and Forward Interbank FX auctions and spot sales to BDCs,
relative to US$9.6bn spent in the same period of 2016, while the I&E window
recorded US$27.8bn in turnover in 2017.
3. Release of the Economic Recovery and Growth Plan (ERGP) in Feb-2017 -
arguably the most ambitious development plan by the FGN since the
National Economic Empowerment and Development Strategy (NEEDS)
document published in 2004. The ERGP is a medium-term plan (2017-2020)
which focuses on five key priority areas: 1) Stabilizing the macroeconomic
environment, 2) Ensuring energy sufficiency (power & petroleum products),
3) Achieving agriculture and food security, 4) Improving transportation, and
5) Driving industrialization by focusing on small and medium scale
enterprises. An implementation and performance measurement
management process was set up to drive execution of the plan.
4. Tackling some of Nigeria’s deep-seated structural constraints by surpassing
Ease of Doing Business reform target of moving up 20 places in World Bank’s
Ease of Doing Business ranking in 2018. Nigeria moved up 24 places to 145th
and ranked in the top 10 most improved countries.
Fate also smiled on Nigeria as faster than expected rebalancing in the oil market
buoyed oil prices and complemented the reform by policymakers to restore
macroeconomic stability. Due to the high level of compliance of OPEC/Non-OPEC
countries to the deal reached in November 2016 (extended for six months in
December 2017) to cut oil production by 1.8mb/d and supply disruptions in the
US, UK, Nigeria and Libya, Brent Crude averaged US$54.74/b in 2017 compared to
US$45.13/b in 2016.
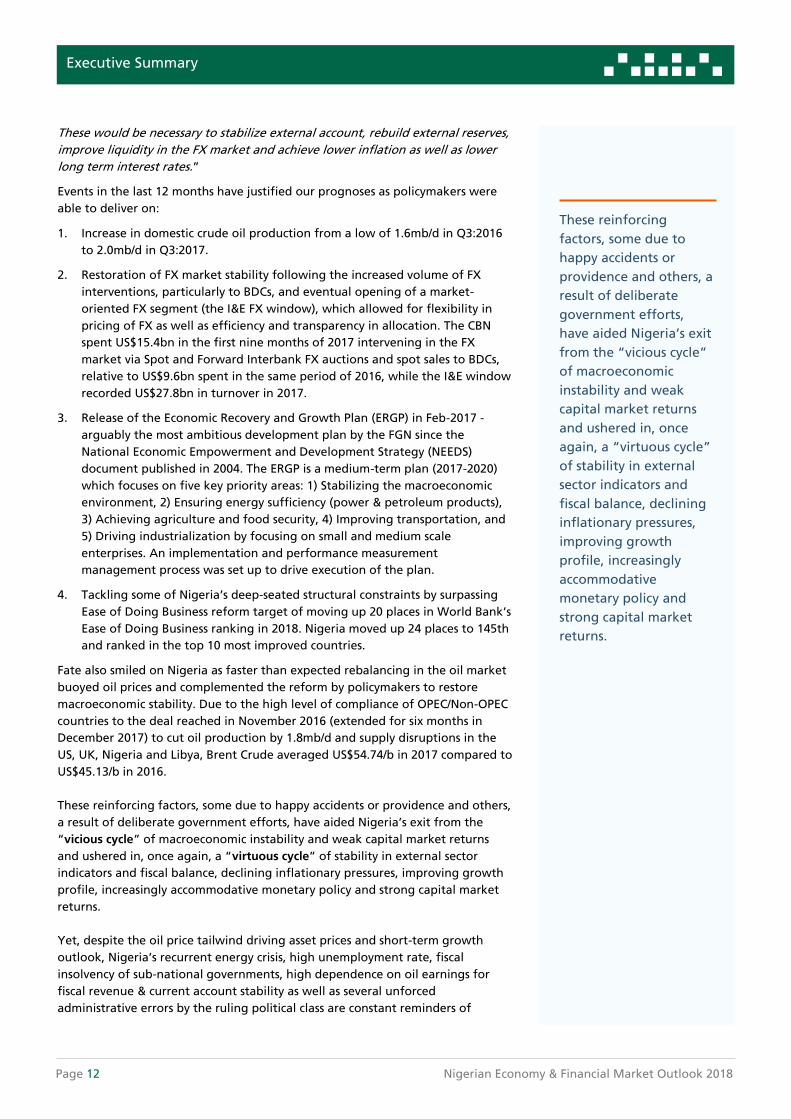
These reinforcing factors, some due to happy accidents or providence and others,
a result of deliberate government efforts, have aided Nigeria’s exit from the
“vicious cycle” of macroeconomic instability and weak capital market returns
and ushered in, once again, a “virtuous cycle” of stability in external sector
indicators and fiscal balance, declining inflationary pressures, improving growth
profile, increasingly accommodative monetary policy and strong capital market
returns.
Yet, despite the oil price tailwind driving asset prices and short-term growth
outlook, Nigeria’s recurrent energy crisis, high unemployment rate, fiscal
insolvency of sub-national governments, high dependence on oil earnings for
fiscal revenue & current account stability as well as several unforced
administrative errors by the ruling political class are constant reminders of
These reinforcing
factors, some due to
happy accidents or
providence and others, a
result of deliberate
government efforts,
have aided Nigeria’s exit
from the “vicious cycle”
of macroeconomic
instability and weak
capital market returns
and ushered in, once
again, a “virtuous cycle”
of stability in external
sector indicators and
fiscal balance, declining
inflationary pressures,
improving growth
profile, increasingly
accommodative
monetary policy and
strong capital market
returns.

Afrinvest West Africa Page 13
Executive Summary
unresolved structural fault lines. Thus, even as we are positive on short term
growth prospect as revealed in our report title “The Virtuous Cycle… Again!”,
we continue to emphasize on our 2-year long theme calling for structural
reforms from policymakers to build long term macroeconomic resilience. As the
country nears two decades of uninterrupted democracy, by far its longest run
post-independence in 1960, we believe issues to top the reform agenda over the
next year should include: the liberalisation of the downstream petroleum sector,
total deregulation of the power sector to enthrone a more cost reflective
electricity tariff, Governance Reforms echoing some of the major themes of much
talked about restructuring, Infrastructure Investing, Economic Restructuring to
aid Fiscal Viability of Sub-Nationals and Creation of Job Opportunities for the
galloping population.

Nigerian Economic & Financial Market Outlook 2018 Page 14
Section Two
Global Economic and Financial
Markets Review and Outlook

Afrinvest West Africa Page 15
Synchronised Global Growth Expansion to
Continue Despite Policy Stability Risks
Despite heightened geopolitical and policy uncertainties
at the start of the year, ranging from the rise of political
populism in advanced economies to fears of hard landing
in China and policy normalization by the US Fed, the
global economy recorded strong and synchronised
growth across regions in 2017. The broad-based
expansion in economic activities was supported by
sustained momentum in Advanced Economies (AEs) –
brought about by favourable financial conditions and
cyclical recovery in the Euro Area – resilient growth in
China and rebound in frontier markets, propped by
increase in commodity prices. As a result, the IMF’s initial
global growth forecast of 3.5% for 2017 was revised
northwards to 3.6% – the fastest pace of growth since
2011 – in its October World Economic Outlook report.
Notwithstanding downside risks associated with
anticipated monetary policy normalization in AEs –
against the backdrop of rising inflation expectation and
tighter labour market – fears of slower growth in China,
US policy uncertainties and geopolitical tensions, the
strong and synchronised global growth upswing is
expected to continue into 2018, with the IMF revising
2018 forecast upwards by 0.1% to 3.7% in October 2017
and 0.2% to 3.9% in January 2018.
Although growth for AEs is expected to slow to 2.0% in
2018 from estimated 2.2% in 2017, due to shrinking
excess capacity and demographic trend, the IMF projects
the US economy to expand 2.3%, anchored by strong
consumer and business confidence combined with
supportive financial conditions and positive knock-on
impact of the recently signed Tax cut bill. The Tax Bill was
signed into law in Dec-2017 and encompasses a tax
overhaul – a slash in corporate, household and small
business tax. Meanwhile, UK’s economy is expected to
grow 1.5% in 2018, lesser than estimated 1.7% in 2017,
against the backdrop of disappointing quarterly growth
figures in 2017 as well as the effect of currency
depreciation on consumer spending. Since the Brexit
referendum in June-2016, concerns have continued to
weigh heavily on economic activities with impact seen to
affect near-term growth outlook.
Buoyed by an accommodative monetary policy and
supply side reforms, the Chinese economy is projected as
the major driver of growth in Emerging and Developing
economies (EMs & DEs). The IMF projects a 6.8%
expansion in 2017 (from an initial forecast of 6.6%) but
however expects growth to slow 6.5% by 2018.
Notwithstanding, growth for EMs & DCs is expected to
rise from 4.6% in 2017 to 4.9% in 2018, supported by
improved growth outlook for India (7.4% in 2018 from
6.7% in 2017) as well as commodity-dependent MENA
(3.5% vs. 2.6% in 2017) and SSA (3.4% in 2018 vs. 2.6% in
2017) regions.
Driven by expansions in its 3 largest economies - Nigeria,
South Africa and Angola, growth in the Sub-Saharan
region is estimated to rise from 1.4% in 2016 to 2.6% in
2017, and forecast to accelerate further to 3.4% by 2018.
Nigeria is expected to exit recession in 2017 (+0.8%) and
sustain growth pattern in 2018 (+1.9%), buoyed by
increased oil production volume and improvements in
external and fiscal balance. Likewise, the Angolan
economy is expected to exit recession and grow 1.5% and
1.6% in 2017 and 2018 respectively. Near term growth
outlook for South Africa remains weak despite
improvements in commodity prices and agricultural
produces, with the economy projected to grow 0.7% in
2017 and 1.1% in 2018. This modest projection is on the
back of heightened political uncertainties which have
weighed on investment spending.
While near term global growth prospect remains broadly
positive, increasing geopolitical risk, trade protectionism
and policy normalization by systemic central banks are
downside risks to forecasts.
Global Economic and Financial Markets Review and Outlook
Chart 1: Global and Regional Growth Estimates and Forecasts (2016 – 2018F)
3.2
1.7 1.51.0
1.8 1.8
4.3
-0.2
6.7
1.4
-1.6
0.3
3.6
2.2 2.21.5 1.7
2.1
4.6
1.8
6.8
2.6
0.8 0.7
3.8
2.0 2.3
0.71.5
1.9
4.9
1.6
6.5
3.4
1.91.1
-4.0
-2.0
0.0
2.0
4.0
6.0
8.0
World AEs United States Japan UnitedKingdom
Euro Area EMs & DEs Russia China SSA Nigeria South Africa
2016 2017E 2018E
Source: IMF, Afrinvest Research

Page 16 Nigerian Economy & Financial Market Outlook 2018
100.0%
105.0%
110.0%
115.0%
120.0%
125.0%
130.0%
135.0%
140.0%
Dec 1
6
Feb
17
Apr 1
7
Jun 1
7
Aug
17
Oct 1
7
Dec 1
7
MSCI World MSCI Emerging MSCI Frontier
Policy Normalization by Systemic Central
Banks Remains Downside Risk to EMs & DEs
Growth
As the move towards normalization strengthens in 2018,
supported by favourable labour market conditions and a
synchronisation in global growth, systemic central banks
in developed markets would be more willing to begin
monetary policy tightening cycle despite sticky inflation.
The US Fed is ahead of other major developed market
central banks, expectedly raising its benchmark interest
rate three times in 2017, taking it to 1.25% -1.50%
despite inflation persistently below the Fed’s 2.0% target.
With impending impact of the tax cut bill expected to
further boost growth and tighten the labour market, the
“continuity candidate” – Jerome Powell, selected to
succeed current Fed Chair Janet Yellen, is expected to
support further hikes in interest rate and plans to begin
winding down the Fed’s Balance sheet. The market is
already pricing in expectation of further monetary policy
tightening, with the 1-Year LIBOR currently at a 7-Year
high, although bond yields remain surprisingly low.
Meanwhile, after mulling over its base rate, the Bank of
England (BoE), raised its Benchmark interest rate (from
0.25% to 0.5%) for the first time in a decade in Dec-2017,
and is expected to tighten further in 2018 in order to
support its dwindling currency. In the interim, strong
growth in the Euro zone continues to validate a cut back
on the European Central Bank’s (ECB) quantitative easing
scheme from € 60.0m of monthly bond purchase to €
30.0m.
As Central Banks gradually normalize monetary policy
from the extraordinary measures taken at the peak of the
global economic and financial crisis, associated downside
risks of tightening global liquidity and capital flow
reversals from emerging and frontier markets and
currency volatility will become more prominent
headwinds to near term growth and financial market
stability.
Global Markets: Consensus Opinion Points to
Further Gains against Strong Macro Backdrop
Against the strong macro backdrop, improvement in
corporate earnings and slow pace of policy tightening by
the US Fed, equity markets globally outperformed in
2017, with MSCI World, Emerging and Frontier markets
indices recording double-digit growths after shrugging
off a modest start to the year. For the second year
running, Emerging Markets came out top as the MSCI
Emerging Markets Index (MSCI EM) outperformed both
the MSCI Frontier (MSCI FM) and MSCI World (MSCI WO)
indices. The MSCI EM returned 34.3% in 2017, driven by
strong economic growth, supportive global financial
condition and higher commodity prices. Likewise,
Frontier markets recovered from a 1.3% loss in 2016 as
the MSCI FM index gained 27.7%, driven by stellar
performance of equity markets in Argentina and Nigeria
which benefitted from pro-market reforms and
commodity price upswing. MSCI WO – which tracks stocks
in developed markets – also sustained its multi-year
expansion as it gained 20.1% in 2017, buoyed by
continued bullish sentiment in US markets - fueled by
anticipated tax cuts, strong earnings and economic
growth – as well as rebound in European markets.
Chart 2: MSCI Indices Performance (Dec-2016 – Dec-2017)
Source: Bloomberg, Afrinvest Research
Global Economic and Financial Markets Review and Outlook
After a remarkable 2017, consensus opinion points to
further gains in equity markets in 2018 on the back of
expectation of sustained global growth and bullish outlook
for commodities key to several EMs & DEs. Yet, downside
risks relating to a move towards monetary policy
normalisation in advanced economies, geopolitical tensions
and developments in China could spur correction in risk
asset markets globally, particularly in Emerging and
Frontier markets highly dependent on portfolio flows.

Nigerian Economic & Financial Market Outlook 2018 Page 17
Section Three
Domestic Macroeconomic Review and Outlook

Page 18 Nigerian Economy & Financial Market Outlook 2018
100.0%
105.0%
110.0%
115.0%
120.0%
125.0%
130.0%
135.0%
140.0%
Dec 1
6
Feb
17
Apr 1
7
Jun 1
7
Aug
17
Oct 1
7
Dec 1
7
MSCI World MSCI Emerging MSCI Frontier
The Recession and its Aftermath
The year 2017, in many respects, was a year of recovery
for the Nigerian economy and financial market compared
to the sharp business cycle contraction witnessed in 2016
alongside weak market returns. Consequent on the
upturn in commodity prices, cessation of attacks on oil &
gas infrastructure in the Niger Delta region (which had a
positive knock-on impact on domestic crude oil
production volume) and adoption of pro-market FX
reforms by the Central Bank of Nigeria (CBN), economic
activity rebounded while investor & consumer confidence
as well as business sentiment strengthened.
The Nigerian economy returned to growth in Q2:2017,
exiting a 4-Quarter long recession - its first in 25 years –
which lasted between Q2:2016 and Q1:2017. Propped by
higher oil exports and administrative flexibility in FX
management structure, reflected in increased CBN FX
Interventions and opening of the Investors’ and
Exporters’ (I&E) FX Window in April 2017, external sector
indicators also turned positive with Current Account
Balance rising from a surplus of US$2.5bn in 2016 to
US$9.5bn in 2017 while cumulative Capital Importation as
of 9M:2017 rose 91.5% Y-o-Y to a 2-year high of
US$6.8bn. The favourable Balance of Payment dynamics
led to accumulation in External Reserves which climbed
to a 3-year high of US$38.7bn (29/12/2017) and stabilized
the Naira at the official window with multiplier impact
on the parallel market – gaining 35.0% Y-o-Y against the
greenback to close at N363.00/US$1.00 by year-end.
Supported by improved growth prospect and FX liquidity,
business sentiment, gauged by the CBN’s Manufacturing
and Non-Manufacturing Purchasing Managers’ Indices
(PMI), has indicated expansion in activity from April 2017
till date. Consumer Confidence has also been on the rise,
with NOI (Ngozi Okonjo Iweala) Polls survey showing a
4.8 points increase in its Consumer Confidence Index from
62.7 points in Q1:2017 to 67.5 points in Q3:2017.
Although price level growth disappointed for much of
the year, persistently falling below Analysts’ estimates,
due to pressures on food prices, Headline Inflation
measured Year-on-Year (Y-o-Y), moderated 318bps to
15.4% in December 2017 while the Core measure of
prices fell 596bps within the same period to 12.1%.
Labour market slack was the only blot on the
overwhelming improvement in core macro variables as
the economy struggled to create enough jobs for the
expanding labour force; thus Unemployment and
Underemployment rates rose 4.6ppts and 0.2ppts to
18.8% and 21.2% respectively in Q3:2017.
Domestic Macroeconomic Review and Outlook
18.6%18.7%
17.8%
17.3% 17.2%
16.3%16.1% 16.1% 16.0% 16.0% 15.9% 15.9%
15.4%
15.0%
16.0%
17.0%
18.0%
19.0%
2.3
1.9
1.4
1.8
2.3
3.0 3.0 3.1
3.6
1.7 1.6
1.7
2.4 2.5
2.3 2.3
2.6
2.3
-1.0
-0.5
-
0.5
1.0
1.5
2.0
2.5
3.0
3.5
4.0
Q3:2
015
Q4:2
015
Q1:2
016
Q2:2
016
Q3:2
016
Q4:2
016
Q1:2
017
Q2:2
017
Q3:2
017
Tri
llio
ns
Exports(NGN) Imports (NGN) Trade Balance (NGN)
(4.0)
(3.0)
(2.0)
(1.0)
-
1.0
2.0
3.0
4.0
-6.0
-4.0
-2.0
0.0
2.0
4.0
Q3:2
015
Q4:2
015
Q1:2
016
Q2:2
016
Q3:2
016
Q4:2
016
Q1:2
017
Q2:2
017
Q3:2
017
Current Account Balance(US'bn)
Current AccountBalance/GDP (%)
Chart 3: Nigeria’s Macroeconomic Fundamentals - Activity, Prices and External Sector Balance

Afrinvest West Africa Page 19
Business Cycle Turnaround: Cyclical Oil
Earnings Upswing Masks Structural Reform
Inertia
To investors familiar with frontier markets, the almost
360-degree turnaround in Nigeria’s economic
fundamentals and investor sentiment is not surprising,
given the strong correlation of the business cycle and
capital market with earnings from commodity exports. In
our 2017 outlook titled “Reform or Be Relegated”, we
had reflected that;
“A return to 2015 level of crude oil production (2.1mb/d)
would comfortably lift oil sector GDP (which accounts for
c.9.0% of aggregate real GDP) by an estimated 15.0% Y-o
-Y in 2017 and may pull the economy out of recession…
On this basis, Nigeria’s business cycle would be highly
dependent on the ability of policy makers to deliver
incremental oil output in 2017, restore macroeconomic
stability by rebuilding confidence in monetary policy and
the administrative side of the FX market structure as well
as showing commitments to structural reforms. These
would be necessary to stabilize external account, rebuild
external reserves, improve liquidity in the FX market and
achieve lower inflation as well as lower long term
interest rates.”
Events in the last 12 months have justified our prognoses
as policymakers were able to deliver on:
1. Increase in domestic crude oil production from a low
of 1.6mb/d in Q3:2016 to 2.0mb/d in Q3:2017.
2. Restoration of FX market stability following the
increased volume of FX interventions, particularly to
BDCs, and eventual opening of a market-oriented FX
segment (the I&E FX window), which allowed for
flexibility in pricing of FX as well as efficiency and
transparency in allocation. The CBN spent US$15.4bn
in 9M:2017 intervening in the FX market via Spot and
Forward Interbank FX auctions and spot sales to
BDCs, relative to US$9.6bn spent in the same period
of 2016, while the I&E window recorded US$27.8bn
in turnover in 2017.
3. Release of the Economic Recovery and Growth Plan
(ERGP) in Feb-2017 - arguably the most ambitious
development plan by the FGN since the National
Economic Empowerment and Development Strategy
(NEEDS) document published in 2004. The ERGP is a
medium-term plan (2017-2020) which focuses on five
key priority areas: 1) Stabilizing the macroeconomic
environment, 2) Ensuring energy sufficiency (power
& petroleum products), 3) Achieving agriculture and
food security, 4) Improving transportation, and 5)
Driving industrialization by focusing on small and
medium scale enterprises. An implementation and
performance measurement management process was
set up to drive execution of the plan.
Domestic Macroeconomic Review and Outlook
Source: CBN, NBS, Afrinvest Research
Against the improved macro backdrop, corporate profits
have also rebounded while all major asset classes
recorded expansion in valuation as foreign investors
increased holding of Nigerian assets. 12-month trailing
Earnings Per Share (EPS) of the NSE All Share Index rose
81.0% Y-o-Y as of Q3:2017, eclipsing previous earnings
record set in 2014 according to data compiled from
Bloomberg. The index also posted its first positive annual
return in four years (+42.3%) in 2017, ranking as the 11th
best performer in the world and 2nd in Africa. The CBN,
encouraged by moderating external sector pressures and
the need to boost domestic growth and lower
government borrowing cost, also guided short term
market rates downward in the fixed income market,
leading to price appreciations in the bond market
especially in the last quarter of 2017.
0.70.1 0.2 0.2 0.3 0.3 0.2 0.3 0.1
1.0
1.00.3 0.3
0.90.3 0.3
0.8
2.8
1.0
0.5
0.30.5
0.6
0.9
0.4
0.7
1.3
0.0
1.0
2.0
3.0
4.0
5.0
Q3:2
015
Q4:2
015
Q1:2
016
Q2:2
016
Q3:2
016
Q4:2
016
Q1:2
017
Q2:2
017
Q3:2
017
Billio
ns
Foreign Direct Investment (FDI) Foreign Portfolio Investment (FPI) Others
6.4 7.5 8.2 9.9 10.4 12.1 13.3 13.9 14.2 14.4 16.218.8
17.9 16.618.3
17.418.7
19.119.3 19.7 21.0 20.4
21.121.2
0.0
10.0
20.0
30.0
40.0
50.0
Q4
:20
14
Q1
:20
15
Q2
:20
15
Q3
:20
15
Q4
:20
15
Q1
:20
16
Q2
:20
16
Q3
:20
16
Q4
:20
16
Q1
:20
17
Q2
:20
17
Q3
:20
17
Unemployment Rate Under employment Rate

Page 20 Nigerian Economy & Financial Market Outlook 2018
0.9
0.5 0.4 1.2
- -
3.4
0.8 1.6
2.8 3.3
0.9
1.0 1.2 0.9
0.0 -
-
0.0
0.2
1.0
1.8
5.0
4.7 4.9 3.8
2.8 2.8
0.6
0.1
0.4
3.6 0.7
-
2.0
4.0
6.0
8.0
10.0
Q1:2
015
Q2:2
015
Q3:2
015
Q4:2
015
Q1:2
016
Q2:2
016
Q3:2
016
Q4:2
016
Q1:2
017
Q2:2
017
Q3:2
017
WDAS/RDAS Spot Sales Wholesale Forward Sales
BDC sales Interbank Spot Sales2.17 2.16
2.05
1.81
1.61
1.76
1.69
1.84
2.03
30.0
40.0
50.0
60.0
1.50
1.70
1.90
2.10
2.30
Q3:2
015
Q4:2
015
Q1:2
016
Q2:2
016
Q3:2
016
Q4:2
016
Q1:2
017
Q2:2
017
Q3:2
017
Oil Production Volume LHS (mb/d) Average Oil Prices RHS (US$/b)
4. Tackling some of Nigeria’s deep-seated structural
constraints by surpassing Ease of Doing Business
reform target of moving up 20 places in World
Bank’s Ease of Doing Business ranking in 2018.
Nigeria moved up 24 places to 145th and ranked in
the top 10 most improved countries.
Fate also smiled on Nigeria as faster than expected
rebalancing in the Oil market buoyed oil prices and
complemented the reform by policymakers to restore
macroeconomic stability. Due to high level of compliance
of OPEC/Non-OPEC countries to the deal reached in
November 2016 (extended for six months in December
2017) to cut oil production by 1.8mb/d and supply
disruptions in the US, UK, Nigeria and Libya, Brent Crude
averaged US$54.74/b in 2017 compared to US$45.13/b in
2016.
Domestic Macroeconomic Review and Outlook
Chart 4: Oil Price vs Oil Production (Q3;2015 -Q3:2017) and CBN FX Interventions US$'bn (Q3:2015 - Q3:2017)
Source: NBS, CBN, Afrinvest Research
Chart 5: Nigeria’s Foreign Exchange Market Development
Source: CBN, FMDQ, Afrinvest Research
169.68
100.00
200.00
300.00
400.00
500.00
600.00Ju
n-1
4
Aug
-14
Oct-1
4
Dec-1
4
Feb
-15
Apr-1
5
Jun-1
5
Aug
-15
Oct-1
5
Dec-1
5
Feb
-16
Apr-1
6
Jun-1
6
Aug
-16
Oct-1
6
Dec-1
6
Feb
-17
Apr-1
7
Jun-1
7
Aug
-17
Oct-1
7
Dec-1
7
WDAS/RDAS Inter-Bank BDC NAFEX
Administrative measures ensured contrived stability
A "floating exchangerate regime" was
partially implemented
Delay in cabinet appointment and continousslide in oil prices
Return to Hard Peg FX Policy and Capital Controls
Naira Bounce on improved USD supply by CBN and
Introduction of I & E Window

Afrinvest West Africa Page 21
Domestic Macroeconomic Review and Outlook
Table 1: Ease of Doing Business Ranking
Source: World Bank Ease of Doing Business Report, Afrinvest Research
Yet, despite the oil price tailwind driving asset prices and
short-term growth outlook, Nigeria’s recurrent energy
crisis, high unemployment rate, fiscal insolvency of sub-
national governments, high dependence on oil earnings for
fiscal revenue & current account stability as well as several
unforced administrative errors by the ruling political class
are constant reminders of unresolved structural fault lines.
Thus, even as we are positive on short term growth
prospect as revealed in our prognoses outlined in the next
section, we continue to emphasize on our 2-year long
theme calling for structural reforms from policymakers to
build long term macroeconomic resilience. As the country
nears 2 decades of uninterrupted democracy, by far its
longest post-independence in 1960, we believe issues
itemised below should top reform agenda over the next
decade.
Table 2: Four Key Reform Agenda
Source: ECN, FMPWH, World Bank, WEF, BUDGIT, Afrinvest Research

Page 22 Nigerian Economy & Financial Market Outlook 2018
2018 Macroeconomic Prognoses…
Consolidating the Recovery
Price Level… Benign Outlook as Policy Makers Hold
-off on Supply Side Reforms
Against the backdrop of high base effect on Core CPI,
Headline Inflation consistently decelerated from 18.7% in
January to 15.4% in December despite pressures on Fuel
and Transport prices which can be attributed to PMS
supply crisis witnessed in Q4:2017. However, prior to the
observed pressures on energy prices in December, the
pace of moderation of the Headline Index had been
underwhelming relative to consensus forecasts on the
back of pressures on food prices and gradual wearing off
of high-base effect in H2:2017. Food Inflation rose 203bps
Y-o-Y to 19.4% in December 2017 to partially offset
moderation in Core Inflation from 17.9% in January to
12.1% in December.
Several theories, ranging from higher demand for
domestic farm produce from neighbouring countries
following steep Naira depreciation to CBN’s FX
restrictions on imported food items, have been attributed
to the unprecedented Food price pressure. Regardless,
some respite has been gained in recent months as M-o-M
Food CPI growth fell below 1.0% in September – the first
time in 9 months – attributable to seasonal factors.
According to Famine Early Warning Systems Network
(FEWSNET), the USAID funded provider of early warning
and analysis on food insecurity, favourable main season
harvest which is underway has improved food access and
led to decline in some staple food prices, though higher
relative to previous year.
We expect the positive-knock-on impact of harvest to
continue to subdue Food Inflation in Q1:2018 while
improved FX access, combined with already high-base of
the Food Index, should place near term downward
pressure on Y-o-Y Food Inflation. However, the major risk
-factor for Consumer Prices in 2018 will be coming from
the Core Index where delayed supply-side reforms in
regulated markets for Power and Fuel could destabilize
prices.
The Power sector is currently facing a liquidity crunch due
to non-cost reflective tariff and lack of investment in the
value chain to ebb high Aggregate Technical, Commercial
and Collection (ATC&C) losses. ATC&C losses averaged
57.4% across the 11 Discos in December 2016 with none
close to achieving set performance target. Multi-Year
Tariff Order 2 (MYTO 2) assumptions implemented in
February 2016 have been rendered ineffective as a result
of macroeconomic instability in the last two years,
resulting in demand for increase in tariff by value chain
operators. The MYTO 2 tariff is due to be reviewed in
December 2018 but we anticipate implementation would
likely be delayed till after 2019 elections.
Domestic Macroeconomic Review and Outlook
Chart 6: Inflation Indices Development (2016 – 2017)
Source: NBS, Bloomberg, Afrinvest Research
15.4%
12.1%
12.6%
19.4%
7.0%
10.0%
13.0%
16.0%
19.0%
22.0%
Jan
-16
Feb
-16
Mar-
16
Apr-
16
May-
16
Jun-1
6
Jul-16
Aug
-16
Sep
-16
Oct
-16
Nov-1
6
Dec-
16
Jan
-17
Feb
-17
Mar-
17
Apr-
17
May-
17
Jun-1
7
Jul-17
Aug
-17
Sep
-17
Oct
-17
Nov-1
7
Dec-
17
Headline Inflation Core CPI (ex Farm Produce)
Core CPI (ex Farm Produce & Energy) Food CPI
15.0
16.0
17.0
18.0
19.0
Actual Headline Inflation Bloomberg Survey Median

Afrinvest West Africa Page 23
72.0 71.0
66.064.0 63.0
61.0
52.0 51.049.0 48.0
34.031.9
20.8
45.0
32.8
38.4 38.2 38.6
20.8
30.4 31.5
19.4
0.0
10.0
20.0
30.0
40.0
50.0
60.0
70.0
80.0
Kaduna DisCo Jos DisCo Port HarcourtDisCo
Yola DisCo Enugu DisCo Kano DisCo Benin DisCo Ikeja DisCo Ibadan DisCo Abuja DisCo Eko DisCo
ATC&C Losses (%) Performance Target (%)
Furthermore, the “Price-Modulation” template for
pricing of PMS introduced by the PPPRA in May 2016, in
retrospect, is akin to putting a Band-Aid on fiscal
bleeding rather than a landmark reform to liberalise the
downstream industry as earlier guided. Already,
assumptions included in the template are due for upward
review on the back of increase in landing cost of PMS –
following rally in oil prices and June-2016 naira
devaluation.
Despite the aforementioned considerations, our near-
term inflation outlook remains benign due to limited
political will to implement supply side reforms ahead of
the elections. Supportive oil earnings tailwind will also
buy regulators more time in implementing the reforms.
Hence, our base-case scenario projects Headline Inflation
moderating further to 12.3% by yearend 2018.
Domestic Macroeconomic Review and Outlook
Chart 7: ATC&C Losses vs. Performance Target (Dec-2016) and MYTO 2.1 Tariff Assumptions vs. Current Realities
Source: NERC, Afrinvest Research
Chart 8: 2018 Headline Inflation Forecast
Source: NBS, Afrinvest Research
9.6%
18.5%
15.4%15.0%
14.8%
13.7%
13.1%
12.1%
11.5%11.2% 11.1% 11.3%
11.5%11.7%
12.3%
8.0%
10.0%
12.0%
14.0%
16.0%
18.0%
20.0%
8.0%
10.0%
12.0%
14.0%
16.0%
18.0%
20.0%
Dec'15 Dec'16 Dec'17 Jan'18 Feb'18 Mar'18 Apr'18 May'18 Jun'18 Jul'18 Aug'18 Sept'18 Oct'18 Nov'18 Dec'18
Headline Inflation (%) 2018 Average

Page 24 Nigerian Economy & Financial Market Outlook 2018
Near Term Growth Outlook … Oil Sector Low Base
Will Remain Key Driver
The economy’s return to growth in Q2:2017 and
acceleration in momentum in Q3 were largely driven by
Oil sector GDP which grew 3.5% and 25.9% Y-o-Y in
Q2:2017 and Q3:2017 respectively. The sizeable expansion
in Oil sector, particularly in Q3:2017, was due to low base
effect of oil sector production which reached a 6-Quarter
high of 2.0mb/d in the quarter. Non-Oil sector however
remains a pressure point, as it relapsed to negative
growth in Q3 after showing positive signs in Q1 and Q2.
The disappointing performance of the Non-Oil sector -
which was unexpected given positive readings from
leading variables such as the PMI - is evident in virtually
all the main Non-Oil categories including Services and
Manufacturing which contracted 2.7% and 2.9% Y-o-Y
respectively in Q3:2017.
The slow recovery of the Non-Oil sector has both cyclical
and structural explanations. Cyclical factors include tight
monetary policy, subsisting weak fiscal spending –
particularly at sub-national level - low real household
consumption growth (due to high inflation rate) and
benign corporate investment spending consequent on
the damaging impact of large FX rate movements in the
last 3 years on corporates’ balance sheet. Our analyses of
leverage ratios of listed companies show debt/equity of
NSE ASI constituents jumped 37.1ppt to 121.6% in 2016
while companies used a significant chunk of capital raised
in 2017 to restructure their balance sheet, rather than
expand capacity, leading to a 12.0ppt decline to 109.6%
in 2017. Hence, Capital Expenditure per share of NSE ASI
constituents fell 3.9% Y-o-Y in 2017 and currently at a 4-
year low.
Whilst the structural issues remain headwinds, we note
that the cyclical challenges will start to abate from 2018
and buoy Non-Oil growth against the backdrop of 1)
anticipated expansion in fiscal spending as fiscal balance
stabilizes and political parties spend ahead of the
election, 2) further deceleration of inflation rate which
will directly affect GDP price deflator and support real
growth, and 3) Increase in private investments due to
favourable aggregate demand outlook and stable FX
rate. Similar to 2017, we also expect oil sector low-base
push to remain a key driver of growth till Q2:2018 before
the effect wears off as base normalizes. The expected
take-off of oil production from Total’s offshore Egina
field project in Q4:2018 will possibly add c.0.2mb to daily
crude production, but with oil production capped by
OPEC at 1.8mb/d (ex- condensate), we do not foresee
aggregate oil production (including condensate)
breaking its peak of 2.2mb/d.
Thus, against the backdrop of expected rebound in Non-
Oil sector and Oil sector low base push, we forecast GDP
growth to accelerate to 2.1% in 2018 from estimated
0.7% in 2017. Major downside risks to our forecast
include OPEC/Non-OPEC decision on Nigeria’s production
cap, development in the oil market and stability in the
Niger-Delta.
Domestic Macroeconomic Review and Outlook
Chart 9: GDP Performance by Sector (Q2:2016-Q3:2017)
Source: CBN, Afrinvest Research
-30.0%
-20.0%
-10.0%
0.0%
10.0%
20.0%
30.0%
Q1
:20
16
Q2
:20
16
Q3
:20
16
Q4
:20
16
Q1
:20
17
Q2
:20
17
Q3
:20
17
Oil GDP Growth Y-o-Y Non-Oil GDP Growth Y-o-Y
-15.0%
-11.0%
-7.0%
-3.0%
1.0%
5.0%
9.0%
Q1:2
016
Q2:2
016
Q3:2
016
Q4:2
016
Q1:2
017
Q2:2
017
Q3:2
017
Agriculture Industry Services

Afrinvest West Africa Page 25
Monetary Policy Outlook… Easing Cycle to Enter
Full Gear despite Stable Benchmark Rate
As we projected in our 2017 Outlook, the CBN
successfully guided short and long-term rates downward
in the fixed income market despite retaining benchmark
policy rate at 14.0%. Although price level growth
disappointed in 2017, with Inflation rate still above MPR,
the CBN began an easing cycle with the use of clearing
rates at OMO auctions and frequency of auctions as
policy instruments to achieve its easing objective. The
CBN temporarily suspended OMO auctions for two weeks
in December, resulting in a build-up in financial liquidity
as well as a further moderation in short term rates and
outperformance of long duration bond - signified in
294bps Y-o-Y decline in MAR 2036 20-year benchmark
bond compared to 148bps Y-o-Y decline of the FEB 2020
2-year benchmark.
Slowing inflation rate, albeit at an underwhelming pace,
favourable balance of payment dynamics, fiscal strategy
to reduce borrowing cost and the need to boost non-oil
sector growth were major factors we believe contributed
to the CBN’s decision to begin easing cycle. Typically,
what should follow the moderation in market rates and
signify the full take-off of the easing cycle is a benchmark
interest rate cut. However, we believe the CBN would
stick to utilizing its recently favoured OMO strategy –
which is more flexible - to achieve the same easing
objective without tweaking the MPR. Despite our
conviction, we do not rule out the possibility of a
politically induced benchmark rate reduction in the
second half of 2018, in order to make credit available to
the real sector. If economic conditions improve further,
this could potentially be done in order to score political
points with the populace ahead of the 2019 election. Our
forecast is based on three considerations:
1. Anticipated fiscal spending in the run up to the
general elections and expected volatility in domestic
assets market in H2:2018 will pose a threat to price
and exchange rate stability;
2. Expected Monetary policy tightening by systemic
central banks in Europe and North America, against
the backdrop of strong synchronised global growth
expansion and improving inflation expectation, could
spur capital outflows from emerging and frontier
markets and pose a risk to domestic exchange rate
stability;
3. Benign but double-digit inflation rate which may not
necessarily go below MPR may support a hold on rate
as the CBN tries to consolidate gains on price level
although core inflation continues to moderate.
Hence, our monetary policy outlook favours continued
downward repricing of fixed income yields, albeit with
stable MPR.
Fiscal Policy Outlook… Focus on Reducing Debt
Service Obligations amidst Rising Expenditure
Nigeria’s increasing debt burden and rising servicing cost
have come under focus in recent times for justifiable
reason. Since the onset of the oil shock in Q3:2014, public
debt stock has almost doubled to N20.4tn as at Q3:2017.
The surge in public debt was partly driven by the effect
of large FX rate depreciation on external debt as well as
an increase in deficit financed expenditure by Sovereign
and Sub-national entities due to revenue shortages
associated with oil production and price shocks
experienced in the last three years. Whilst the equivalent
18.2% debt to GDP ratio appears non-threatening, rising
servicing cost relative to revenue (47.0% in FY:2016) and
slow growth of non-oil revenue post-crisis have increased
debt sustainability risk – a key consideration of Moody’s
Rating Agency in recent Sovereign Downgrade.
The FGN has responded by changing its 10-year long
conservative debt strategy of relying more on domestic
market for debt to tilting towards cheaper external
sources in the global market to reduce servicing cost.
Thus, the FGN returned to the Eurobond market after a 4
-year hiatus in 2017, raising US$1.5bn in Q1:2017 and
US$3.0bn out of a US$5.5bn approved Medium Term
Note Project in Q4:2017. Another US$300.0m was raised
in Q3:2017 via a debut Diaspora bond issuance, taking
total external debt issuance to US$4.8bn. US$650.0m of
the US$3.0bn bond raised in December was used to
redeem domestic maturing T-bills worth N198.0bn,
leading to further decline in fixed income yields. Despite
the steep decline in domestic market rates, we expect the
Chart 10: GDP Growth Outlook
Source: NBS, Afrinvest Research
Domestic Macroeconomic Review and Outlook
6.2%
2.8%
-1.5%
0.7%
2.1%
-2.0%
0.0%
2.0%
4.0%
6.0%
8.0%
2014 2015 2016 2017E 2018F

Page 26 Nigerian Economy & Financial Market Outlook 2018
FGN to stick to the new strategy in the near term due to
favourable global market environment and ambitious
expenditure plan.
Domestic Macroeconomic Review and Outlook
Chart 11: Policy and Market Interest Rates in 2017
Source: CBN, FMDQ, Afrinvest Research
As with prior years, the 2018 Budget projects a
reflationary spending of N8.6tn (16.2% increase relative
to N7.4tn in 2017) with a focus on consolidating on gains
recorded in the previous year whilst also prioritizing the
need to bridge the investment deficits in Infrastructure,
Agriculture and Health sectors amongst others. On the
basis of the revenue projection, FGN’s share of oil & gas
revenue is estimated at N2.4tn while non-oil revenue -
including Company Income Tax (CIT), VAT, Customs &
Excise Receipts, Independent Revenues and income from
other sources as well as proceeds from the restructuring
of FGN’s equity in JVs – is projected to account for N4.2tn.
On the expenditure side, recurrent debt and non-debt
are proposed to make up N5.5tn (63.9%) of the total
spending while capital expenditure is planned to
contribute N2.4tn (28.2%) and statutory transfer
N451.5bn (5.3%). Fiscal deficit is also expected at N2.0tn
implying a 1.8% debt to GDP although debt service to
revenue ratio is estimated at 30.5%.
While the budget’s macroeconomic variables assumptions
are not far off from current realities, perhaps even
prudent with regards to crude oil prices, we are of the
view that achieving >70.0% implementation of capital
component will be difficult due to overstretched non-oil
and independent revenue assumptions. As of 9M:2017,
performance of the “Budget of Recovery and Growth”
has been rather underwhelming with fiscal authorities
falling short of revenue target, especially Non-oil revenue
(N0.7tn actual vs. N1.0tn projection) and Independent
Revenue (N155.1bn vs. N605.9bn projected in the period),
despite recent drive to increase tax revenue via reforms
such as the Voluntary Assets and Income Declaration
Scheme (VAIDS). Thus, Non-core revenue lines which are
non-recurring such as Exchange Rate difference and Paris
Club over-deduction refund were leveraged to finance
the budget. While the Presidency hopes to improve on
existing tax reforms to boost income from the Non-oil
sector as well as enhance activities in other sectors of the
economy, the odds of a significant increase in tax
revenue in the short term remains low as Non-oil sector
growth remains below long-term trend.
0.0
10.0
20.0
30.0
40.0
50.0
60.0
8.0
10.0
12.0
14.0
16.0
Jan
-17
Feb
-17
Mar-1
7
Apr-1
7
May-1
7
Jun-1
7
Jul-1
7
Aug
-17
Sep
-17
Oct-1
7
Nov-1
7
Dec-1
7
MPR (%) ) - LHS SLF Rate (%) - LHS SDF Rate (%) - LHS 91 Day T-Bill Rate (%) -LHS OBB Rate (%) - RHS
Table 3: Current and previous Sovereign Credit Rating
Source: Bloomberg, Afrinvest Research
Table 4: External Debt Issuances
Source: Bloomberg, Afrinvest Research

Afrinvest West Africa Page 27
14% 15%21% 26%
5% 5% 3%
31% 29%
36% 31%
35%
20%38%
12%7%
16% 11%
14%
13%
13%
20%25%
15%14%
20%
8%
39%
23% 24%12%
18%26%
54%
7%
0%
20%
40%
60%
80%
100%
I s trongly approve I approve
I neither approve nor dissaprove I disapprove
I strongly dissaprove
Domestic Macroeconomic Review and Outlook
Table 5: 2018 Budget
Source: CBN, Afrinvest Research
Polity Stability: Security Concerns and Ethnic Divide
Setting Stage for Volatile Election Cycle
One of the major downside risks to asset markets and
polity stability in 2018 is politicking ahead of the General
Elections holding in February 2019. President
Muhammadu Buhari of the All Progressives Congress
(APC) is widely expected to seek re-election in what
would potentially be a keenly contested poll due to
waning popularity of the incumbent in Southern Nigeria
(see NOI polls) and divisions in the ruling party which has
already led to the defection of Former Vice-President
Atiku Abubabar to the opposition People’s Democratic
Party (PDP).
10%
30%
50%
70%
90%
Chart 12: President Buhari’s Approval Rating by Regions
Source: NOIPolls, Afrinvest Research
Chart 13: President Buhari’s Approval Rating Trend
Source: NOIPolls, Afrinvest Research
Items 2016 Budget FY: 2016 Actual 2017 BudgetPro-Rated 9M:2017
Budget
FY:2017 Actual
(9M:2017)
Variance from
ActualFY: 2018 Budget
GDP Grow th (%) 4.4% -1.6% 1.5% 1.5% 0.4% 3.5%
Oil Production Volume (m/bpd) 2.20 1.82 2.20 2.20 1.85 2.30
Average Budget price per Barrel (US $) 38.00 42.09 44.50 44.50 51.30 45.00
Average Exchange Rate (N/US$) 197.00 305.00 305.00 305.00 305.70 305.00
Oil & Gas Revenue 717.6 697.8 2,122.2 1,591.6 749.9 -52.9% 2,441.6
Non-oil revenue 1,567.9 818.5 1,379.8 1,034.9 710.1 -31.4% 1,385.3
Independent revenue 1,505.9 237.9 807.8 605.9 155.1 -74.4% 847.9
Others 64.8 1,193.3 774.6 580.9 990.0 70.4% 1,932.2
Total FGN Retained revenue 3,856.2 2,947.5 5,084.4 3,813.3 2,605.2 -31.7% 6,607.0
Statutory Transfer 351.4 344.0 434.4 325.8 288.4 -11.5% 456.5
Debt Service 1,475.3 1,384.9 1,663.9 1,247.9 1,541.0 23.5% 2,014.0
Sinking Fund 113.4 71.4 177.5 133.1 N/A N/A 220.0
Recurrent (Non-debt) 2,646.4 2,411.6 2,990.9 2,243.2 1,939.2 -13.6% 3,494.0
Capital Expenditure 1,587.4 1,219.5 2,174.5 1,630.9 377.0 -76.9% 2,652.0
Total Expenditure 6,173.9 5,431.4 7,441.2 5,580.9 4,145.5 -25.7% 8,612.0
Fiscal Deficit (N'tn) 2317.7 2483.9 2356.8 1767.6 1540.3 -12.9% 2005.0
Domestic Borrow ing 984.0 N/A 1,254.3 940.7 1,180.0 25.4% N/A
Foreign Borrow ing 900.0 N/A 1,067.5 800.6 722.0 -9.8% N/A
Others 433.7 N/A 35.0 26.3 9.9 -62.3% N/A
Debt Service/Revenue Ratio 38.3% 47.0% 32.7% 32.7% 59.1% 30.5%
Deficit/GDP Ratio -2.1% -2.3% -2.2% -2.2% N/A -1.8%

Page 28 Nigerian Economy & Financial Market Outlook 2018
Domestic Macroeconomic Review and Outlook
Former Vice President Atiku, who has contested for the
Presidency in the past, will likely be vying for the fourth
time on the platform of the PDP. Having consolidated his
leadership of the APC in Northern Nigeria and enjoying
backing of the South-East and South-South caucuses,
President Buhari looks set to blitz through his party’s
presidential primaries. Yet, securing the backing of the
South West coalition will be key to his success at the
general elections.
Typical of election cycles in frontier markets, we expect to
see some volatility in assets market in the period leading
up to the polls whilst policymaking will take a shorter-
term perspective, leaving urgent long term structural
reforms to take the back seat. Key issues we expect to
dominate debates include Job Creation, Security and
Political restructuring.
Slacking labour force despite improving growth profile
has led to an increase in Unemployment and
Underemployment rate with 34.0m labour force
population either without jobs or underemployed. On
security, although the military has consolidated on gains
fighting insurgency in the North East region, militants’
uprising in the Niger Delta and secessionist agitations in
the South East, led by the Indigenous People of Biafra
(IPOB), destabilized the polity in 2016 and 2017. Whilst
the secession agitation appears to have lost momentum
and government’s efforts to placate militants have borne
fruits, the impact of climate change – which has ravaged
grazing fields in Northern Nigeria – has increased
incidences of trespassing in farmlands in North Central
and Southern Nigeria by nomadic cattle herdsmen
searching for greener pasture. This has heightened ethnic
tension and driven up incidences of violent clashes
between host communities and pastoralists in North
Central region with 371 deaths recorded in 2017
according to data compiled from ACLED (Armed Conflict
Figure 1: Nigerian Polity Heat map
Source: Afrinvest Research

Nigerian Economic & Financial Market Outlook 2018 Page 29
Section Four
Equities Market Review and Outlook

Page 30 Nigerian Economy & Financial Market Outlook 2018
Equites Market Performance and Outlook
– A possible Game of Two Halves?
The performance of the Nigerian equities market in 2017
was mixed as the weak sentiment which had persisted
since H2:2014 lingered into Q1:2017 before reforms in
the FX market upturned the bearish sentiment to fuel a
year-long bull run in the market.
The crash in oil prices which began in H2:2014, falling to
as low as US$27.00/b in January 2016, depressed the
performance of the broader economy, as pressures on the
domestic currency mounted while external reserves
declined with the Apex bank adopting unorthodox
measures to tackle speculative pressures against the naira
which eventually dragged the economy into recession in
2016 (first time in 25 years). All these factors culminated
in the weak sentiment noticed in the first quarter of
2017. In clear understanding of the issues and the
required solutions, our Nigerian Economic and Financial
Market Outlook Report for 2017 titled, “Reform or Be
Relegated “detailed the need for policy makers to reform
if the desired positive changes in the economy and
market sentiment should be achieved. We highlighted
that reforms targeted at the FX market structure needed
to be taken urgently. Following the launch of the
Investors’ and Exporters’ (I&E) FX window in April-2017,
sentiment began to change and buoyed positive
performance of the equities market.
The impact of the improved FX liquidity was reflected in
sentiment in the manufacturing sector as PMI readings
from April till the end of the year showed sustained
expansions in the sector - although actual GDP
performance remained below trend. Likewise, headline
inflation rate moderated from as high as 18.7% in
January to 15.4% by November. To consolidate on these
improvements, the economy finally came out of recession
in Q2:2017 recording a growth of 0.7% and this was
sustained in Q3:2017 (+1.4%).
Consequent on the weak investor sentiment at the start
of the year, investors sold off on stocks without much
regard for fundamental analysis. As a result, Nigerian
stocks were greatly undervalued in relation to peers. In
the first quarter, the only positive indicator for investors
was the resilient performance from the banks, especially
top Tier-1 Banks GUARANTY, ZENITH, ACCESS and UBA.
Hence minimal buy interest was recorded in these
counters while sell offs persisted across other sectors. The
NSE All Share Index had declined 6.2% as at April 20th,
2017 prior to the launch of the I&E FX window. However,
following the launch of the window, massive buy interest
returned to the domestic equities market to take
advantage of cheap valuation of assets.
Corporate releases for the rest of the year were reflective
of the improving conditions in the broader economy
hence the rally was sustained all year. The NSE ASI gained
42.3% in 2017, the second highest Y-o-Y index return in
10 years.
Equities Market Review and Outlook
Chart 14: Nigerian Equites Market Performance in 2017
Source: NSE, Afrinvest Research

Afrinvest West Africa Page 31
-45.8 -3
3.8
18.9
-16.3
35.4
47.2
-16.1
-17.4
-6.1
42.3
-39.2
-35.8
57.5
-21.4
38.2 4
7.4
-19.6
-27.6
-38.7
47.2
-60.0
-40.0
-20.0
0.0
20.0
40.0
60.0
80.0
2008 2009 2010 2011 2012 2013 2014 2015 2016 2017
NAIRA US$
Equities Market Review and Outlook
Chart 15: 10-Year YTD performance of the NSE ASI
Source: NSE, Afrinvest Research
Sector Performance …Broad Based Rally
Recorded across Sectors
As a result of the improved sentiment in the market, a
broad-based rally was recorded which drove all sectors to
close in the green for 2017. Given the resilience
demonstrated by the banks amidst tougher operating
conditions, the banking index was unsurprisingly the best
performing sector in 2017, up 73.3%. Performance of the
banks remained driven by resilient earnings, supported
by interest income (due to higher interest rate
environment). FIDELITY (+196.4%) received the most
buying interest. In addition, significant interest in Tier-1
banks - GUARANTY (+64.9%), ZENITH (+73.8%), ACCESS
(+78.0%) and UBA (+128.9%) was recorded.
The Consumer Goods index followed, gaining 37.0% as
increase in product prices and improvement in access to
FX as well as the relative peace in the North Eastern part
of the country, positively impacted earnings of companies
in the index. DANGSUGAR (+229.8%) was the best
performer, followed by INTBREW (+191.9%) as investors
cheered the decision of its parent company - AB Inbev -
to merge operations of all its subsidiaries in Nigeria. In
the same vein, the Industrial Goods index increased
23.8% on the back of gains in BETAGLASS (+69.2%) and
DANGCEM (+32.1%) while the Insurance index grew
10.4% as LINKASSURE (+32.0%) and MANSARD (+20.9%)
appreciated.
The Oil & Gas index gained 5.8% for the year, majorly
due to performance of Upstream players – SEPLAT
(+56.9%) and OANDO (+27.4%) - which was bolstered by
the cessation of attacks on oil installations in the Niger
Delta as well as improved global oil prices. Sentiment
towards the downstream players remained soft during
the year, due to absence of reforms needed to revitalize
the sector.
Chart 16: Nigerian Equities Market Sector Performance in 2017
Source: NSE, Afrinvest Research
0.8
1.0
1.2
1.4
1.6
1.8
2.0
Jan
-17
Jan
-17
Jan
-17
Jan
-17
Jan
-17
Fe
b-1
7
Fe
b-1
7
Fe
b-1
7
Fe
b-1
7
Ma
r-17
Ma
r-17
Ma
r-17
Ma
r-17
Ap
r-17
Ap
r-17
Ap
r-17
Ap
r-17
Ma
y-1
7
Ma
y-1
7
Ma
y-1
7
Ma
y-1
7
Ma
y-1
7
Jun
-17
Jun
-17
Jun
-17
Jun
-17
Jul-
17
Jul-
17
Jul-
17
Jul-
17
Au
g-1
7
Au
g-1
7
Au
g-1
7
Au
g-1
7
Au
g-1
7
Se
p-1
7
Se
p-1
7
Se
p-1
7
Se
p-1
7
Oct-
17
Oct-
17
Oct-
17
Oct-
17
Oct-
17
No
v-1
7
No
v-1
7
No
v-1
7
No
v-1
7
Dec-1
7
Dec-1
7
Dec-1
7
Dec-1
7
Jan
-18
Banking Insurance Consumer Oil & Gas Industrial

Page 32 Nigerian Economy & Financial Market Outlook 2018
Equities Market Review and Outlook
Table 6: Performance of NSE Sector Indices in 2017
Source: NSE, Afrinvest Research
Is the Equities Market Overvalued?
Given the challenges faced between H2:2014 and
Q1:2017, investors constantly punished Nigerian equities,
with sell-offs recorded across various sectors of the
market. Consequently, Nigerian equities were
undervalued, in comparison to peers, presenting ample
opportunities for investors to take advantage of some of
the companies, which turned out impressive results
despite the economic challenges.
Following the reforms in the FX market which resulted in
increased FX liquidity and a restoration of investor
confidence, massive gains were recorded in the market in
2017 and this has been sustained into 2018, up 12.2%
(12/01/2018). With the market now at an all-time high in
terms of market capitalisation and the NSE All Share
Index at a 9-year high, there are justifiable fears of
overvaluation of the market which raises concerns with
regards to a near term correction. Our approach is to
diagnose and probe into the fundamentals as well as
technical merit of the overvaluation hypothesis.
From our analysis, average Trailing P/E and P/BV for the
Nigerian equities market in the last one month as at at
17/08/2018 stood at 13.1x and 1.7x, which are lower than
15.1x and 2.0x respectively for the MSCI Frontier markets
index. Looking back to the last 2-year bull market run
Nigeria experienced between 2012 and 2013, the
Nigerian equities market was priced at a premium to
frontier markets peers in the late cycle of the run, as
shown in the average P/E and P/BV multiples of the MSCI
Frontier Markets index of 12.5x and 1.6x in 2013 relative
to 13.5x and 2.2x of the Nigerian market in the same
period. This implies that despite the rally in the market in
2017 and early trading in 2018, current undervaluation of
the Nigerian market by valuation multiples and the
proven historical valuation premium Nigerian market
enjoys in period of boom suggest there are more miles to
clock in the market rally. Hence, against the backdrop of
improving macroeconomic conditions as well as positive
outlook for corporate earnings, we believe there is a
compelling case for investors to sustain interest in the
Nigerian equities market as already noticed in the YTD
return of 17.4% (17/01/2018).
Our Scenario Analysis in 2018
A review of our market forecast for 2017, shows that
actual performance outperformed our bull case scenario,
in which we projected that a contraction in the spread
between the official and parallel market rates, an
increase in oil production to about 2.2mb/d, oil prices
between US$55.00/b to US$60.00/b and MPR at 14.0%
will result in a 15.6% appreciation in the benchmark
index. Actual performance for 2017 (+42.3%) surpassed
our forecast as investor confidence was reinvigorated
following the reforms in the FX market and resilient
earnings.
In 2018, we envisage that market performance will be
largely determined by the following factors:
1. Earnings fundamental of Corporates;
2. Stability in the FX market and other macro indicators;
and
3. Funds flow dynamics to emerging and frontier
markets.
Our analysis of market trend over the past 10 years,
makes a case for a possible repetition of history. As
noticed in 2012 and 2013, the periods following the
global economic crisis, sentiment in the local bourse
strengthened which drove the ASI 35.4% and 47.2%
northwards in the respective years. In a similar situation,
as the economy rebounded from the slump - 2014 to
2016 - in 2017, we expect market sentiment to wax
42.3%
73.3%
37.0%
23.8%
10.4%
5.8%

Afrinvest West Africa Page 33
Equities Market Review and Outlook
stronger in 2018. In our scenario analysis for the market
performance in 2018, we employed a blend of relative
valuation in which we benchmarked our market
valuation against multiples for peers in the MSCI Frontier
market index and absolute valuation based on price
forecasts for our coverage universe which is about 86.0%
of the entire market.
From our analysis, the Nigerian market has outperformed
the MSCI index on the basis of EPS, growing at a CAGR of
12.2% between 2010 and 2017 vs. a 2.1% decline for the
MSCI index in the same period. Similarly, on a P/E basis,
the Nigerian market has commanded higher pricing over
the MSCI index in 6 of the 8 years under review. Against
this backdrop, we carried out scenario analysis for the
performance of the All Share Index in 2018.
Our forecast for the performance of the benchmark index
in 2018 is largely positive as our scenarios (bear, base,
bull) all signal appreciation in the benchmark index.
On a relative valuation basis, we noted earlier that our
expectations for corporate earnings in 2018 is largely
optimistic on the back of improving conditions in the
operating environment; hence, we assumed an EPS of
N3,377.4 as our base case scenario which implies a 13.0%
increase from a trailing EPS of N2,988.8 in the prior year.
Our EPS projection was based on the 7-year EPS CAGR for
the All Share Index to arrive at the forecast. For our P/E
projection, we compared current pricing in the Nigerian
markets against peers for which the MSCI Frontier
Markets index was employed. In order to arrive at our p/e
forecast of 14.1x in the base case scenario, we analysed
historical P/E multiple of the ASI relative to the MSCI
Frontier Index P/E and assumed a 1.0x premium in line
with historical valuation spread. This methodology
yielded an All Share Index projection of 47,620.71 points
in our base case scenario, which suggests a 24.5%
appreciation in the year.
On an absolute valuation basis, we have a more
conservative forecast for market performance, albeit still
positive. Based on our 12-month target prices from our
coverage universe of stocks – about 86.0% of market cap
- relative to 2017 yearend prices, we forecast a 5.6%
jump in market capitalisation, implying ASI projection of
40,384.81 points.
Finally, to make a call on market performance for 2018,
we adopted a blend of both valuation methodologies.
Based on the foregoing, we arrived at an ASI projection
of 45,811.73 points for 2018 which is a 19.8%
appreciation from 38,243.19 points in 2017. Our bear
case (+7.7% to 41,189.9 points) and bull case (+32.7% to
50,749.10 points) also follow the same trend and further
buttress the consensus view of positive market
performance in 2018.
Whilst we note that developments in the macro space
will also determine overall market performance, we
opine that barring any major shocks in the FX market,
corporate fundamentals will be a key determinant of
overall performance as shown below.
Table 7: Market Return Assumptions and Projection
Source: Afrinvest Research

Page 34 Nigerian Economy & Financial Market Outlook 2018
What does Technical Analysis Show?
Historical analysis of the equities market shows that the
benchmark index still remains in the ascendancy despite
the rally recorded in 2017, as RSI has moved in tandem
with the benchmark index. Our analysis shows a 250-Day
RSI trend of the ASI from 1999 to 2017. In the years, prior
to 2006, market activities were minimal hence our trend
analysis is focused on 2006 to 2017. A reversal in RSI trend
Equities Market Review and Outlook
Chart 17 : Historical RSI Trend of the Nigerian Equities Market
Source: NSE, Afrinvest Research
can be noticed every two years save for the periods
between 2014 and 2016 given the peculiarity of the
situation. Following a reversal, RSI hovers around the 60
points mark for a 2-year period, hence we expect to see
the RSI around the same level in 2018 which implies
sustained buy interest and further buttresses our positive
outlook on the market.
Chart 18 : Historical performance of the NSE ASI
Source: NSE, Afrinvest Research

Afrinvest West Africa Page 35
Equities Market Prognoses for 2018… The Era
of “Happy-go-lucky Trading” to Fizzle Out
Notwithstanding the superlative market performance in
2017, we are largely optimistic on 2018 as another bullish
year. Our conviction is hinged on the fact that fiscal and
current account balances have improved against the
backdrop of sustained increase in oil prices which has had
a positive knock-on impact on FX market stability. Given
that activities in the Nigerian economy still remain
heavily dependent on foreign participation,
developments in the FX market, will be a key
determinant. On the flipside, we note that a potential
downside risk is largely hinged on the general elections
slated for 2019, which could weigh on polity stability as
well as investor sentiment. We highlight potential drivers
as well as drags for 2018 below.
Equities Market Review and Outlook
1. Corporate Earnings to Drive Sentiment
Following the improvement in investor sentiment in
2017, valuation of Nigerian equities has significantly
improved and as such we believe investors decisions
in 2018 will be largely driven by fundamental
analysis. As witnessed in 2017, given the improved
macroeconomic conditions, earnings performance of
corporates was largely impressive and this informs
our positive outlook on earnings for 2018. Hence, we
believe investment decisions will be largely swayed
by corporate scorecards during the year.
Across the sectors, we expect the banks to sustain the
current impressive trend, especially tier-1 banks, as
growth prospects could spur credit extension and
reduce credit impairment charges to offset the
impact of decline in yields on government securities
on earnings. Furthermore, the banks have taken
steps to adjust to the tougher operating
environment over the past year by taking cost
cutting measures to boost profitability. We forecast a
positive performance from companies in the
Industrial Goods space, against the backdrop of
widening margins and increased spending on capital
expenditure. Similarly, we expect the Consumer
Goods as well as Agricultural sector companies to
turn out positive results due to high product prices
and reducing cost pressures. For the Oil & Gas sector,
we are more optimistic on performance of the
upstream players, given the rally in oil prices as well
as improved oil production volumes whilst we note
that complete liberalization is what we envisage will
unlock value for investors in the downstream oil and
gas sector.
2. Sustenance of Flexibility at the FX Market
As historical analysis has shown, performance of the
Nigerian equities market is largely dependent on
activities in the FX market, given the dominance of
foreign participants over domestic investors. Hence,
investors will be keeping a keen eye on management
of the FX market during the year.
Movement in oil prices which remain the largest
source of foreign receipts into the domestic economy
will be a key determinant of the CBN’s ability to
sustain the current pace of intervention in order to
maintain stability and ensure adequate liquidity. In
2017, oil prices rallied from as low as US$44.82/b in
June to above the US$60.00/b mark; a period in
which a sustained rally was recorded in the equities
market as well. In addition to this, during this period,
production volumes also increased which resulted in
higher FX receipts following the cessation of attacks
on oil installations in the Niger Delta region,
enabling Nigeria to benefit from the rally in oil prices
and higher production volumes. As a result,
significant accretion to the external reserves was
recorded, rising from US$26.1bn in Jan-2017 to
US$38.8bn by the end of the year.
Historical analysis shows there is a positive
relationship between the trifecta of oil prices,
external reserves as well as FX market stability and
the performance of the domestic equities market as
shown in the chart below. Hence we note that
maintaining the current peace in the Niger Delta
region as well as stable oil prices is paramount to
keeping investor sentiment upbeat.
Figure 2: NSEASI vs. External reserves
Source: Afrinvest Research

Page 36 Nigerian Economy & Financial Market Outlook 2018
3. Policy Uncertainty Typically Characteristic of a Pre-
Election Year
A possible downside to market performance in 2018
is political risk. In the second half of the year, we
believe a determining factor in performance of the
market will be stability in the polity as investors
gauge the potential impact of the general elections
slated for 2019. The uncertainty surrounding the
outcome of the elections could potentially drag
market performance as the elections draw closer.
4. New Market Listings through Rights, Introduction or
IPO
In line with the drive of operators and regulators to
increase product offerings in the market, we could
potentially see more issuances of rights, IPOs from
large unlisted corporates as well as new products all
together in the market. We believe the improved
sentiment presents an opportunity for these
instruments to be launched. With regards to rights
issues, in 2017, GUINNESS, FLOURMILLS, UNION
BANK, UNILEVER as well as UACN approached the
market to issue rights which were largely successful.
With regards to IPOs, there has been a lot of
speculation as to a possible listing of MTN Nigeria’s
shares, which is one of the largest companies in
Nigeria, on the exchange. In the same vein, the NSE
has guided on launching derivative instruments on
Equities Market Review and Outlook
the exchange which will also deepen product
offerings as well as increase interest in the market.
We opine that all these factors could lead to more
inflows in to the market which will also drive
performance.
5. 2018 Budget Implementation as a Catalyst for
Growth in the Industrial sector
In anticipation of increased government spending on
capital expenditure (N2.4tn) as proposed in the 2018
budget, we believe performance of companies in the
industrial sector will be boosted. In addition to this,
effective implementation of the budget should lead
to increased spending which will stimulate business
activity in the economy via job creation and
increased funds flow.
6. Development in Unconventional Asset Classes –
Cryptocurrency
The rise of unconventional asset classes especially
Cryptocurrency, could potentially weigh on activity
level in the more conventional investment securities.
However, we do not believe this poses any
immediate threat due to the high institutional client
dominance of the Nigerian market as opposed to
retail client base of crypto assets.
.
Chart 19: NSEASI vs. External reserves and Oil Prices
Source: NSE, Afrinvest Research
0.0%
20.0%
40.0%
60.0%
80.0%
100.0%
120.0%
0.0
5.0
10.0
15.0
20.0
25.0
30.0
35.0
40.0
45.0
May
14
Jun
14
Jul 1
4
Aug
14
Sep
14
Oct
14
Nov
14
Dec
14
Jan
15
Feb
15
Mar
15
Apr
15
Ma
y 1
5
Jun
15
Jul 1
5
Aug
15
Sep
15
Oct
15
Nov
15
Dec
15
Jan
16
Feb
16
Mar
16
Apr
16
Ma
y 1
6
Jun
16
Jul 1
6
Aug
16
Sep
16
Oct
16
Nov
16
Dec
16
Jan
17
Feb
17
Mar
17
Apr
17
Ma
y 1
7
Jun
17
Jul 1
7
Aug
17
Sep
17
Oct
17
Nov
17
Dec
17
Reserve [bn US$' LHS] NSE ASI [RHS] Brent [US$' RHS]

Nigerian Economic & Financial Market Outlook 2018 Page 37
Section Five
Fixed Income Market Review and Outlook

Page 38 Nigerian Economy & Financial Market Outlook 2018
Sustained Tight Monetary Policy Bolstered
Activity in Fixed Income Market
Sustained hawkish monetary policy stance, pressure on
general price level, improved investor appetite for safety
and the weak start of domestic equities market amongst
others shaped the direction of yields in 2017 as well as
the overall level of activities in the fixed income market.
Investors displayed overriding interest for shorter term
fixed income securities compared to bonds as the influx
of T-bills and OMO (Open Market Operations) supplies
from the Central Bank of Nigeria (CBN) propped the level
of activities. Whilst the activity dominance of most
institutional investors – PFAs, DMBs and Insurance
companies - remained noticeable in the year, attractive
interest rate environment, strengthened by the CBN’s
tight monetary policy stance, also attracted retail and HNI
investors to the market. Average T-bills yield on 91-day,
182-day and 364-day benchmarks settled at 17.3%, 18.7%
and 20.3% in 2017 relative to 12.5%, 14.3% and 15.0%
respectively in 2016. At the end of 2017, total OMO and T
-bills issuance settled higher at N6.5tn and N4.4tn
compared to N4.4tn and N4.0tn respectively in 2016.
Similarly, despite the expensive short-term rates, a
handful of Corporates - including ACCESS (N88.4bn,
20.8%), FSDH (N14.4bn, 21.2%), STERLING (N2.2bn,
21.5%) and WEMA (N17.0bn, 21.9%) - successfully issued
Commercial Papers at average issue yield of 21.0%.
On the medium to long term end of the market, the
dominance of the Federal Government of Nigeria as the
largest supplier became entrenched in 2017 with a total
Sovereign bond value of N1.5tn (compared to N1.3tn in
2016) issued at the monthly auctions conducted. In
addition, the FGN explored alternative long term
borrowing windows within the domestic market
including the launch of the Quarterly Coupon Paying
Savings Bonds (N7.0bn, 13.5%), N100.0bn Sukuk bond
issued at 16.5% rental yield and the Green Bond worth
N10.7bn issued in December 2017 at 13.5% yield. Also,
the Debt Management Office (DMO) successfully raised a
total of US$4.5bn (in four tranches) through the
Eurobond market at average marginal coupon rate of
7.3% while also successfully raising US$300.0m Diaspora
bond at 5.6%.
At the Corporate end, UBA successfully raised US$500.0m
in its debut Eurobond issuance at a coupon of 7.8% while
Zenith and Fidelity re-issued US$500.0m and US$400.0m
at coupon rates of 7.4% and 10.5% respectively. Sub-
National end of the market in terms of supply had
minimal issuance levels with Lagos state successfully
issuing N85.1bn in two tranches in Aug-2017 at coupon
rates of 16.8% (N46.4bn) and 17.3% (N38.8bn). Also,
backed by the full faith of Lagos State Government,
Municipality Waste Management Contractors Limited
(MWMCL), at estimated 74.0% success rate, issued
N20.0bn as part of its N50.0bn bond programme.
Similarly, Bayelsa State restructured its N50.0bn 2019
bond while Ondo state extended its N27.0bn 2019 bond
for the next 3 years.
Fixed Income Market Review and Outlook
Table 8: Treasury Bills, OMO and Bond Auction Summary for 2017
Source: CBN, Afrinvest Research
Jan-17 441.8 636.4 441.8 16.6% 250.0 507.1 477.1 18.3% 130.0 235.1 215.0 16.96%
Feb-17 384.8 1011.7 504.8 16.5% 90.0 391.7 391.7 18.3% 110.0 337.0 160.0 16.64%
Mar-17 698.9 764.5 698.9 16.4% 400.0 342.7 342.6 18.4% 130.0 216.4 160.0 16.27%
Apr-17 402.4 417.1 324.5 16.6% 470.0 373.5 316.1 18.3% 135.0 129.4 105.3 16.16%
May-17 458.7 671.6 458.7 16.5% 420.0 256.1 250.3 18.3% 140.0 161.9 110.0 16.29%
June-17 369.9 419.4 369.9 16.5% 320.2 419.6 337.6 18.3% 140.0 158.1 99.3 16.19%
July-17 381.9 526.7 381.9 16.5% 1065.0 892.2 885.1 18.3% 135.0 129.2 106.0 16.25%
Aug-17 484.7 612 484.7 16.2% 890.00 888.5 830.8 18.2% 135.0 63.7 56.1 16.83%
Sept-17 174.1 387.2 174.1 16.1% 970.1 657.3 612.4 17.2% 135.0 394.9 243.8 15.93%
Oct-17 264.2 722.7 264.2 14.7% 1080.0 1,016.7 1012.9 16.8% 100.0 166.3 100.0 10.00%
Nov-17 322.3 438.9 337.9 14.6% 1,785.0 1, 182.2 1,055.7 16.9% 100.0 105.4 87.8 9.86%
Dec-17 2,150.0 1,432.4 1431.8 13.9% 100.0 280.1 77.6 8.80%
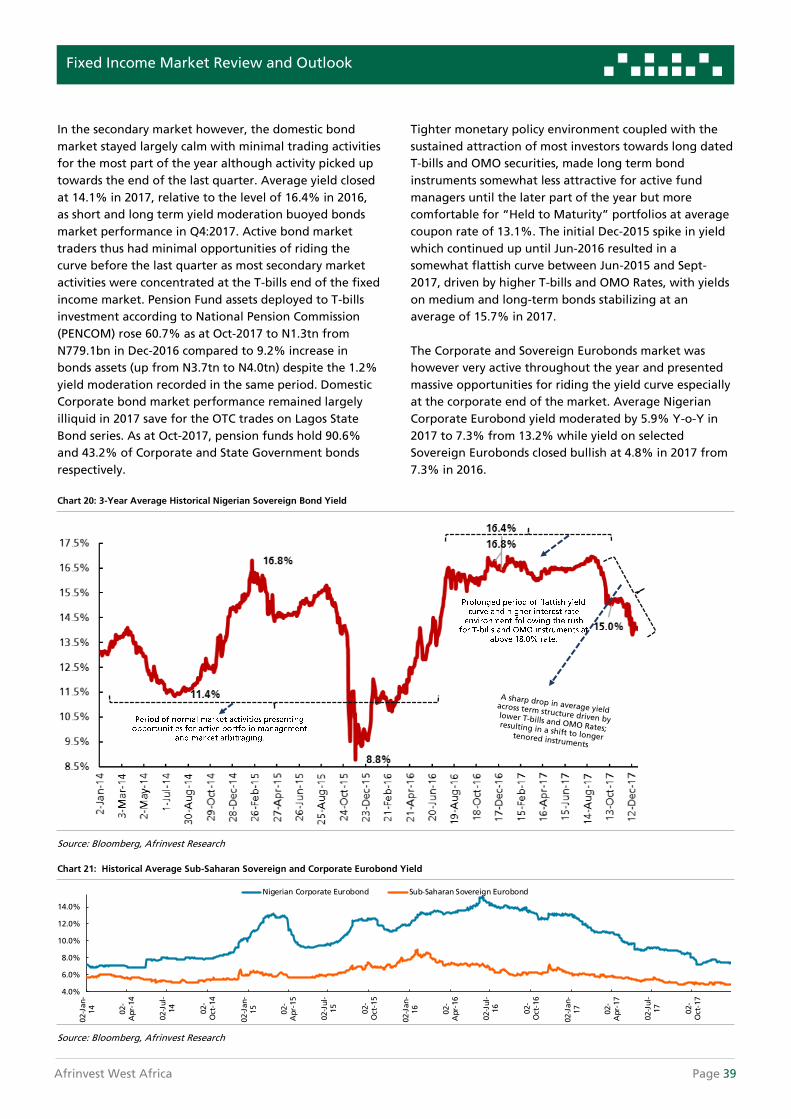
Afrinvest West Africa Page 39
In the secondary market however, the domestic bond
market stayed largely calm with minimal trading activities
for the most part of the year although activity picked up
towards the end of the last quarter. Average yield closed
at 14.1% in 2017, relative to the level of 16.4% in 2016,
as short and long term yield moderation buoyed bonds
market performance in Q4:2017. Active bond market
traders thus had minimal opportunities of riding the
curve before the last quarter as most secondary market
activities were concentrated at the T-bills end of the fixed
income market. Pension Fund assets deployed to T-bills
investment according to National Pension Commission
(PENCOM) rose 60.7% as at Oct-2017 to N1.3tn from
N779.1bn in Dec-2016 compared to 9.2% increase in
bonds assets (up from N3.7tn to N4.0tn) despite the 1.2%
yield moderation recorded in the same period. Domestic
Corporate bond market performance remained largely
illiquid in 2017 save for the OTC trades on Lagos State
Bond series. As at Oct-2017, pension funds hold 90.6%
and 43.2% of Corporate and State Government bonds
respectively.
Tighter monetary policy environment coupled with the
sustained attraction of most investors towards long dated
T-bills and OMO securities, made long term bond
instruments somewhat less attractive for active fund
managers until the later part of the year but more
comfortable for “Held to Maturity” portfolios at average
coupon rate of 13.1%. The initial Dec-2015 spike in yield
which continued up until Jun-2016 resulted in a
somewhat flattish curve between Jun-2015 and Sept-
2017, driven by higher T-bills and OMO Rates, with yields
on medium and long-term bonds stabilizing at an
average of 15.7% in 2017.
The Corporate and Sovereign Eurobonds market was
however very active throughout the year and presented
massive opportunities for riding the yield curve especially
at the corporate end of the market. Average Nigerian
Corporate Eurobond yield moderated by 5.9% Y-o-Y in
2017 to 7.3% from 13.2% while yield on selected
Sovereign Eurobonds closed bullish at 4.8% in 2017 from
7.3% in 2016.
Fixed Income Market Review and Outlook
Chart 20: 3-Year Average Historical Nigerian Sovereign Bond Yield
Source: Bloomberg, Afrinvest Research
Chart 21: Historical Average Sub-Saharan Sovereign and Corporate Eurobond Yield
Source: Bloomberg, Afrinvest Research
4.0%
6.0%
8.0%
10.0%
12.0%
14.0%
02-J
an-
14
02-
Apr-
14
02-J
ul-
14
02-
Oct
-14
02-J
an-
15
02-
Apr-
15
02-J
ul-
15
02-
Oct
-15
02-J
an-
16
02-
Apr-
16
02-J
ul-
16
02-
Oct
-16
02-J
an-
17
02-
Apr-
17
02-J
ul-
17
02-
Oct
-17
Nigerian Corporate Eurobond Sub-Saharan Sovereign Eurobond

Page 40 Nigerian Economy & Financial Market Outlook 2018
The Sovereign Eurobonds in the Sub-Saharan African
basket recorded a very bullish performance in 2017 as the
recovery in commodity prices, in addition to interest rate
normalization in the US and other Systemically Important
Economies (SIE), supported the demand for most high
yielding instruments from Emerging Markets. Average
Sovereign Eurobond yield in SSA moderated to 4.8% in
2017 relative to 6.1% in 2016. Similarly, Nigerian
Corporate Eurobonds presented the most opportunities
in 2017 as average yield crashed from 13.2% in 2016 to a
3-year low of 7.3% as the positive sentiment towards FGN
securities, following the successful issuance of the
US$4.5bn Eurobond, improved sentiment on Corporate
Eurobonds space.
Humped Sovereign Yield Curve…Optimizing Portfolio
Yield towards Going Long
The Nigerian Sovereign Yield Curve has maintained a
Humped or Bell-Shaped slope since Dec-2016. A “Humped
or Bell-Shaped” Yield Curve is the slope of the curve
achieved when the intermediate yields are higher than
the short term and long-term yields. Although a Humped
yield curve merely signifies a transactional state and not
necessarily backed by economic theories, it signifies a
slowdown in Nigeria’s economic growth momentum as
revealed by the recent recovery from the recession of
2016.
Our outlook on bond yields movement in 2018 hints of
the possible opportunities the curvature of the Sovereign
yield curve presents. Whilst we anticipate a gradual
moderation in bond yields, purely based on improved
market activities as demand for longer term fixed income
instruments softens yields to an average of 12.5% by
yearend, the transitioning path to a flattish and later a
normal yield curve is anticipated to be a downward
“Butterfly Shift” (a yield curve shift that changes the
curvedness to either a flattish, normal or inverted yield
curve) to normality. The recent moderation in market
yields hints towards a possible gradual normalization of
the yield curve than an inversion given that the economy
is on a recovery path. Hence, a shift towards a normal
yield curve is more plausible in 2018 from the current Bell
-Shaped yield curve. Intermediate term bonds may
present short term opportunities as yields normalize and
prices increase. Notwithstanding, the long-term bonds
with longer modified duration portends the most
attractive price appreciation opportunities for active
investors in 2018.
Fixed Income Market Review and Outlook
Chart 22: Nigerian Sovereign Yield Curve across Quarters (%)
Source: FMDQ, Bloomberg, Afrinvest Research
17.0
19.119.6
16.015.8
15.815.7
15.816.0
15.0
15.817.6
14.3 14.1
14.0
14.214.2
13.4
12.0
14.0
16.0
18.0
20.0
22.0
3M 6M 1Y 3Y 5Y 7Y 10Y 15Y 20Y
Dec-16 Mar-17 Jun-17 Sep-17 Dec-17

Afrinvest West Africa Page 41
Fixed Income Market Prognoses for 2018…
Overall Activity Should Favour Optimal Return
On the back of domestic economic recovery and more
accommodative monetary policy, we anticipate investors
are likely to structure their fixed income portfolios
towards bonds rather than short term treasury
instruments. Overall market yield is anticipated to
moderate 1.6% to 12.5% in 2018 as the yield curve is also
forecast to transition to normality.
We believe the yield environment in 2018 will be largely
determined by market activities as already being noticed
since the last quarter of 2017. Nevertheless, we do not
discountenance the possibility of a benchmark rate
reduction in H2:2018 to align with market movement. We
are of the view that the demand for safer sovereign
instruments by Institutional Fund Managers (notably
PFAs, Insurance Companies, Discount Houses etc.) and
Fixed Income Market Review and Outlook
Figure 3: Potential Fixed Income Market Drivers for 2018
Source: Afrinvest Research
DMBs as well as HNIs will propel market activities towards
yield moderation. We highlight some of the revelations
from our crystal ball below.
1. Anticipated Yield Moderation on Long Term
Instruments:
In line with the moderating yield environment from
2017, we anticipate that yields on long term
instruments would further decline given the Federal
Government’s plans to reduce pressures on domestic
borrowing. In Nov-2017, the issuance of a US$3.0bn
Eurobond indicated the Government’s interest to
shift its borrowing focus to the international market,
hence lowering its participation in the domestic
market. Resultantly, average yields on Government
issued long term instruments are expected to
moderate further in 2018 as investors are likely to
find hitherto unattractive longer dated bonds as
safer havens; we believe this will drive stronger
market activities.

Page 42 Nigerian Economy & Financial Market Outlook 2018
2. Undissipated Inflationary Pressures May Keep Short
Term Rates Upbeat:
Pressures on domestic price levels continue to mount
on the back of unabated elevations on food prices
throughout 2017 despite the anticipated base effect
moderation. Recent developments in the energy
market have worsened the outlook on inflationary
pressures; yet, we forecast moderation in inflation
rate to as low as 11.1% in 2018 due to high base
effect and delay in price hike in electricity tariffs and
pump price of petrol - events that could conceivably
weigh on inflationary trend. Although recent
gradual normalization of the yield curve has become
noticeable, subsisting double-digit inflation rate may
yet be reflected on the performance of short term
rates in 2018, thus stabilizing rates around the
Monetary Policy Rate (MPR).
3. Flurry of Commercial Paper Issuance as Government
Participation Reduces:
Following the plans by the Federal Government to
ease borrowing pressures on the domestic market,
we anticipate the private sector would take
advantage of the lower interest rate environment to
raise short term financing via Commercial Papers.
With probable moderation in the crowding out of
treasury short term instruments, Corporates are likely
to find the Commercial Paper window cheaper than
approaching DMBs for working capital funding at
commercial rates. We envisage that the expectation
of flurry of issuances will make the secondary market
for Commercial Papers more active for traders to
explore in 2018.
4. Higher Modified Duration Bonds Will Support Long
Term Fixed Income Strategy:
Activities in the local bonds market in 2017 remained
soft as investors concentrated on shorter term money
market securities (OMO and T-Bills). Yield curve
normalization and the overall expectation of yield
decline will anticipatorily be most optimal for long
duration bonds in 2018. Our view is that most
institutional fund managers, notably Pension Fund
Managers, will stick to their long-term horizon and
“Hold to Maturity” strategy. Hence, we foresee
improved activities in the long-dated bond
instruments in 2018.
5. Eurobonds Market Will Favour Active Fixed Income
Strategy:
The Sub-Saharan Sovereign and Corporate
Eurobonds market was very active throughout 2017
given the stability in global commodity prices;
average yield on SSA and Nigerian corporate
Fixed Income Market Review and Outlook
Eurobonds moderated 4.8% and 7.3% Y-o-Y
respectively. Although the market appears fairly
valued with most sovereign and corporate
instruments trading at premium to par values, we are
of the view that active market players in the
Eurobonds market will have opportunities to profit
from market volatility in 2018. For Nigerian
Sovereign and Corporate Eurobonds especially, given
the political risk uncertainties that have always
defined periods preceding an election year, we
expect yields to rise sharply in H2:2018, presenting
entry opportunities for later trading in 2019 post-
election cycle.
6. Corporates will Explore Domestic Market Options for
Long Term Financing:
Government borrowings in Nigeria until recently
have continued to suppress credit to the private
sector while also crowding out corporates and Sub-
Nationals from the domestic bonds market. As a
result, corporate issuance of debt securities has
continued to indicate unsustainably high yields for
most corporates with some opting for alternative
financing options - raising capital (via rights) in the
equities market. Hence, with less reliance on
domestic borrowing by the Federal government and
forecast yield moderation in 2018, we expect a
resurgence of corporate issuances in the domestic
bond market.

Nigerian Economic & Financial Market Outlook 2018 Page 43
Section Six
Alternative Asset Classes

Page 44 Nigerian Economy & Financial Market Outlook 2018
Real Estate Market Review and Outlook
Real Estate Sector Remains in Recession on the back of
High Vacancy Rate & Induced Cost Pressures
Despite the rebound in global oil prices and an improved
macroeconomic environment in 2017, the Nigerian real
estate sector remained in a recession as it contracted
5.0% Y-o-Y annualized in Q3:2017, a subtle improvement
from 6.9% Y-o-Y contraction in FY:2016. The negative
performance of the sector could be attributed to
sustained cost pressures in construction materials which
have steadily increased since Q1:2015 along with high
residential and commercial vacancy rates amongst others.
Alternative Asset Classes
ups in the real estate space have continued to expand
and consolidate operations with the largest area of tech
adoption in the sector being Property listing. In 2017,
several deals were sealed by tech start-ups, the most
significant of which was the purchase of Jumia Homes for
an undisclosed sum by “Tolet.com.ng”- an online real
estate portal which then rebranded to “propertypro.ng”.
This positioned it as a market leader in the Nigerian
online real estate market reportedly with approximately
66.0% market share. 2017 also saw the entrance of new
participants such as “muster.ng”,
“instantapartment.com” – an online luxury apartment
rental portal – “estatedesk.com” and “moovedin.com”
amongst others into the market.
Primary Mortgage Institutions Sustain Loan Growth
despite Slow Real Estate Activity
Despite the negative performance of the real estate
sector in 2017, Primary Mortgage Institutions (PMIs) have
recorded steady growth in Mortgage Loans over the past
3 years. In Q2:2017, loans increased 33.9% Q-o-Q to
N116.3bn (from N86.8bn in Q1:2017), while also rising
60.1% Y-o-Y. Similarly, mortgage loans as a percentage
of PMIs interest earning assets has also sustained an
upward trend from Q1:2015. In Q2:2017, mortgage loans
accounted for 50.6% of interest earning assets, up from
39.2% in Q1:2015. Considering the sizeable National
Housing deficit estimated at 17.5m, increasing population
and low home ownership levels in urban areas, there are
opportunities for mortgage lenders to tap into in order
to maximize profitability. In our view, the risk to creating
mortgages in a peculiar environment like Nigeria, where
assets hardly depreciate in value, is not as pronounced as
the risk to commercial bankers especially given that the
underlying assets will serve as the basis for securitizing
the loan. We believe the burgeoning middle class which
is characteristically typified in the proportion of labour
force earnings in excess of N2.0m per annum supports the
hypothesis for opportunities PMIs can tap into.
Table 9: Change in Prices of Construction Materials
Source: Northcourt, Afrinvest Research
An analysis by Northcourt real estate – a premier real
estate investment company in Nigeria – suggested that
despite the improvement in macroeconomic indicators,
residential vacancy rate in select locations, mostly high-
brow, have remained pressured whilst land prices have
soared on the back of anticipated strong demand. This
could be attributed to several factors such as house types
as well as pricing; hence, mid-market areas recorded
lower vacancy rates. FDC’s Vacancy Factor index
corroborated this narratives as it rose 7 points Y-o-Y to
172 points in January 2018 from 165 Points in January
2017.
Property Listing Technology Space Records First Major
M&A Consolidation
Tech participation in the real estate space in Nigeria has
continued to disrupt traditional methods of home
ownership, rent payments and even apartment sharing.
Sustaining the momentum from 2016, technology start-
Cost of Construction Materials
Item H1-
2016 H1-
2017 % Change Cement (50kg) 1,500 2,800 86.7% Distribution Board 40,000 45,000 12.5% Sandcrete Block (9 inch) 200 220 10.0% 13A socket 950 1,200 26.3% Aluminium Roofing Sheet (0.55mm) 1,550 2,500 61.3% Ariston water heater (Small) 28,000 28,000 0.0% Cables (6mm / Coil) 16,000 38,000 137.5% Tyford complete set WC 14,500 14,000 -3.4% Coloured Emulsion Paint 8,500 12,000 41.2% Paving stone 60mm (Local) 1,750 2,100 20.0% White Emulsion (Dulux) 26,000 28,000 7.7% Harvey roof tiles 5,700 11,000 93.0%

Afrinvest West Africa Page 45
Alternative Asset Classes
Nigerian Mortgage Refinancing Company (NMRC)
Launches Strategic Partnerships to Boost
Performance
The Nigerian Mortgage Refinancing Company (NMRC)
was established in 2013 as a vehicle to bridge the existing
gap between the capital market and mortgage lenders by
refinancing mortgage loans, as well as providing
affordability of quality housing through the provision of
increased liquidity in the mortgage market. The company
in its 2016 Annual Report cited it had refinanced
mortgage loans up to N8.1bn (up from N1.9bn in 2015)
representing 19.9% of its total assets - N40.8bn, whilst
staying heavily invested in Government securities.
However, in its bid to position as the top refinancing
company in the country, NMRC launched the Mortgage
Warehouse Funding Limited (MWFL) in October 2017.
MWFL is a Special Purpose Vehicle (SPV) company created
with the objective of providing short-term viable funding
to listed member mortgage banks using a market
30.0%
35.0%
40.0%
45.0%
50.0%
Q1 2015 Q2 2015 Q3 2015 Q4 2015 Q1 2016 Q2 2016 Q3 2016 Q4 2016 Q1 2017 Q2 2017
Mortgage Loans As % of Income Assets
Chart 23: Mortgage Loans as % of Income Assets (2015 – 2017)
Source: CBN, Afrinvest Research
Chart 24: Mortgage Loans Performance (2015-2017)
Source: CBN, Afrinvest Research
Table 10: NMRC Financial Statement Summary in FY:2016
Source: NMRC, Afrinvest Research
Statement of Comprehensive Income FY:2016 FY:2015 Y-o-Y Growth
Gross Earnings 6.0 4.1 49.0%
Interest Income 5.2 3.1 65.2%
Interest Expense (2.2) (1.1) 95.0%
Net Interest income 3.0 2.0 49.1%
Credit impairment charges (0.04) (0.04) -9.5%
Investment and Other Operating Income 0.00 0.00 -107.8%
OPEX (1.7) (1.5) 13.1%
Profit/Loss Before Tax 1.3 0.5 164.6%
Taxation (0.0) (0.0) 164.6%
Profit/Loss After Tax 1.3 0.5 164.6%
Per share data Corporate Actions
Current Price N/A Proposed Dividend N/A
Earnings Per Share 0.72
Price multiples/Ratios Payment Date N/A
RoAE (Annualised) 15.6%
RoAA (Annualised) 3.2% AGM Venue N/A
Net Interest Margin (Annualised) 7.7%
Cost of Funds (Annualised) 9.1% *nm Not Meaningful
Cost to Income 56.1% 73.9%
Cost of Risk 0.4% 0.3%
Net Margin 21.1% 11.9%
Statement of Financial Position FY 2016 FY 2015 Y-o-Y Growth
Cash and Bank Balances 1.3 7.4 -82.9%
Total Loans and advances 9.5 16.0 -40.4%
Financial Assets 29.4 15.3 91.8%
Total Assets 40.8 39.1 4.4%
Total Equity 8.6 7.8 10.9%
Total Borrowings 24.3 23.3 4.1%
Total Liabilities 32.2 31.3 2.8%
NIGERIAN MORTGAGE REFINANCING COMPANY (NMRC) FY 2016 Result - Financial Highlights (NGN Billion)
NMRC

Page 46 Nigerian Economy & Financial Market Outlook 2018
consecutive quarters. Whilst performance remained at
seemingly insignificant levels, there have been efforts by
the Nigerian Stock Exchange to shore up investor
confidence in the sector, one of which was the mandate
given to REITs operators to submit quarterly and audited
annual reports as well as frequent submission of
performance metrics.
Outlook: Government Spending to Drive Sector
Performance in 2018?
The Federal government in its proposed 2018
Appropriation Bill ramped up infrastructural spending by
about 11.7%, a move which could strengthen activity
levels in the construction and housing sectors as well as
participation of the private sector. As part of its plan to
tackle the current housing deficit, the Ministry of Power,
Works and Housing has earmarked N35.4bn for the
National Housing Program as well as setting aside
N100.0bn for the Social Housing Program. Following the
recovery in the economy and stability in the Foreign
Exchange Market, our near-term outlook for the sector is
positive while also remaining cautiously optimistic on the
vacancy rates in highbrow areas.
Alternative Asset Classes
intervention mechanism to support and improve
mortgage pre-financing on a short-term basis. The
company would provide short term financing through
the issuance of high quality investment grade and rated
Asset Backed Commercial Papers (ABCP), using the
proceeds to fund member mortgage banks’ pipeline of
prequalified NMRC conforming mortgage loans.
NMRC also developed strategic partnerships with real
estate developers such as the Ogun State Property and
Investment Corporation (OPIC) aimed at boosting
capacity of OPIC by giving more long-term mortgage
loans to potential home owners in Ogun and Lagos
environs. Similarly, in July 2017, a Memorandum of
Understanding (MoU) was signed with Echostone to
finance and deliver about 750,000 housing units over a 10
-year period.
Real Estate Investment Trusts (REITs) Activity
Remains Weak in Line with Trend
The performance of Real Estate Investment Trusts (REIT)
in 2017 was largely underwhelming as the three REITs
listed on the Nigerian Stock Exchange - Union Homes
REIT (N45.20), UPDC REIT (N10.00) and Sky Shelter Fund
(N100.00) – with a combined market capitalization of
about N40.0bn recorded no activity over eight

Afrinvest West Africa Page 47
Alternative Asset Classes
forward contract sales is unsurprising, given the drive of
the Apex Bank to clear backlog of FX obligations as well
as maintain FX rate stability. However, forward pricing of
the tenors which reflects expectation of future pricing of
the spot exchange rate suggests a possible depreciation
of the domestic currency. For instance, at the start of
2017, while the spot rate stood at N305.00/US$1.00, the 1
-year forward quote was at N378.00/US$1.00 which was
close to the prevailing NAFEX rate at the end of 2017.
Nevertheless, we note that these quotes are not
necessarily trade backed, but indicative rates quoted by
participants. In 2018, we expect the CBN to sustain its
pace of forward FX sales, hence an opportunity is
presented for individuals or corporates who have FX
obligations to fulfil.
Futures Contract Market… Declining Subscription
Level on Narrowing Arbitrage Opportunity
The adoption of a “flexible exchange rate regime” by the
CBN in June 2016 was followed by the introduction of 12
different Naira settled Non-deliverable OTC FX Futures
Contracts. This was targeted at boosting FX liquidity while
also allowing for effective pricing of the domestic currency
against the dollar as well as serve as a hedge for foreign
investors exposed to exchange rate volatility. The
introduction of these contracts was initially greeted with a
lot of optimism, as importers, especially in the agricultural
sector as well as the consumer goods sector took
advantage of this, given the massive spread between
contract prices and prevailing exchange rates at maturity.
Despite the interest, none of the 12 contracts was totally
subscribed as value of open contracts never touched the
US$12.0bn on offer. The underlying constraint was the
reduced arbitrage opportunity as the rates on the contract
were tied to the upward review of contract prices as well as
change in settlement rate from NIFEX to NAFEX.
Hence, total value of Open Contracts fell US$336.3m Y-o-Y,
declining from US$3.7bn in Dec-2016 to US$3.3bn in Dec-
2017. The April 2018 contract was the most subscribed
contract with a total subscription of US$656.9m as at Dec
2017 at a rate of US$361.64.
Derivatives Market Review and Outlook
Regulators step up Efforts to Deepen Product Offerings
The awareness of investment opportunities in the
derivatives market in Nigeria, remains sub-optimal, hence
activity level in that space in comparison to other asset
classes, remains low. Given the continuous expansion of
the Nigerian capital market product offerings as well as
the inherent macroeconomic risks, opportunities for
investors to take advantage of derivative instruments
with the aim of hedging their exposures or taking
speculative actions against price movement have arisen.
The FMDQ in partnership with the CBN has, in the past
few years, introduced several FX-based derivative
products to deepen FX market liquidity while the
Nigerian Stock Exchange (NSE) also announced plans in
2017 to introduce equity based derivative products on
the exchange. Currently, most derivative products in
Nigeria are tied to the foreign exchange market
especially on Forward, Futures and Swaps. To this end,
the NSE has organized series of trainings and seminars in
a bid to improve awareness and technical knowledge of
derivative products. We review the performance of the
Nigerian derivatives market as well as our outlook below
in light of Forward, Futures, Swaps and Options.
Forward Contract Market…Integral Tool to
Maintaining FX Stability
A forward contract is an agreement between two parties
in which one agrees to purchase an asset at a given price
and future date while the counterparty sells under the
same conditions. A tool often used by investors and
manufacturers to hedge volatility risk, forward contract
sales have been majorly utilised by Nigerian FMCGs and
Industrial manufacturers to lock in prices of raw materials
needed for production. The prominence of forward
contract sales has however grown over the past year,
especially FX forward contracts, due to increased Naira
volatility in the last 2 years and CBN FX reserves
management strategy.
In 2017, given the higher FX receipts, the CBN increased
its spate of intervention in the forex market, via weekly
Special Wholesale Intervention sales for spot and
forwards of a maximum of 60 days, in a bid to improve
liquidity within the market while also ensuring stability
of external reserves. According to data from the CBN
statistical database, total volume of FX forward sales by
the CBN as of September 2017 was US$7.7bn, an 85.7%
increase from US$4.2bn recorded in FY:2016. The jump in

Page 48 Nigerian Economy & Financial Market Outlook 2018
In 2018, we expect interest in the futures contracts to
remain sub-optimal, based on three factors:
1. Stable FX rate outlook - on the back of rising oil
prices and current account balance - which would
reduce demand for hedging products;
2. Narrowing spread between NAFEX settlement rate
and contract prices, and
3. The Naira-settled quality of the contracts which make
them less desirable for hedging than a conventional
FCY settled contracts.
Swaps… Increased FCY Borrowing by DMBs Boosts
CBN Swap Inflows
A swap agreement involves two counterparties who
agree to exchange a series of future cash flows with a
present duration, settlement date and mode of payment
as stipulated in the contract. Commodities, interest rates,
currencies, equities, fixed income instruments etc. usually
serve as underlying assets in swap agreements. In Nigeria,
currency swaps have risen to prominence, especially from
2014 to 2016, as the Apex Bank sought to shore up the
external reserves given the lingering FX liquidity crisis at
the time. Inflows from swap contracts between the CBN
Alternative Asset Classes
and Deposit Money Banks accounted for 16.1%
(US$4.2bn) of the external reserves (US$25.8bn) as at
30/12/2016.
In 2017, DMBs appetite for swaps remained upbeat as
total inflows stood at US$2.7bn in 9M:2017 as against
US$2.8bn in 9M:2016. Furthermore, the improved FX
liquidity situation which trailed the launch of the I&E FX
window increased banks’ ability to secure FCY debt and
we believe this could also have contributed to the
relatively high interest in swap agreements with the CBN.
On the informal side, 2018 appears to be a seller’s market
for interest rate swaps given our overall outlook on
moderating interest rate environment. DMBs are likely
able to take advantage of short term opportunities in
underwriting contracts on interest rate swaps.
Nevertheless, because the transactions in this market are
largely unorganized, we expect that activities will stay
calm.
Options… Fixed Income Instruments Dominate
Options, in contrast to the other derivative instruments
described earlier, offer the holder the right, but not
necessarily the obligation to execute a transaction at a
pre-stated volume of an underlying asset at a given date
Table 11: OTC Futures Contract as at December 2017
Source: FMDQ, Afrinvest Research
Contract Tenor (Month)
Contract Settlement
Date Value of Open Contracts
(US$'m) Current Rate
($/N)
1 NGUS JAN 31 2018 31-Jan-18 321.60 361.19
2 NGUS FEB 28 2018 28-Feb-18 288.27 361.34
3 NGUS MAR 28 2018 28-Mar-18 431.52 361.49
4 NGUS APR 25 2018 25-Apr-18 656.90 361.64
5 NGUS MAY 30 2018 30-May-18 161.77 361.79
6 NGUS JUN 27 2018 27-Jun-18 236.89 361.94
7 NGUS JUL 25 2018 25-Jul-18 395.57 362.09
8 NGUS AUG 29 2018 29-Aug-18 220.81 362.24
9 NGUS SEP 26 2018 26-Sep-18 325.27 362.39
10 NGUS OCT 31 2018 31-Oct-18 107.19 362.54
11 NGUS NOV 28 2018 28-Nov-18 163.08 362.69
12 NGUS DEC 26 2018 26-Dec-18 10.00 362.84
Total 3,318.87

Afrinvest West Africa Page 49
Issuer Maturity Date Coupon (%) Tenor (Years) Option Type Currency
United Bank for Africa 30-Sep-18 14.00 7 Callable Naira
United Bank for Africa 30-Dec-21 16.45 7 Callable Naira
Fidelity Bank Plc 13-May-22 16.48 7 Callable Naira
First Bank Limited 07-Aug-20 8.25 7 Callable USD
Table 12: Selected Bonds with Options
Source: FMDQ, Afrinvest Research
as well as an established rate. Similar to forwards, asset
classes including equities, bonds, interest rates,
commodities, currencies etc. often serve as underlying
assets for option contracts. In the Nigerian option
contracts market, fixed income issuances dominate as
some corporate and sub-national bonds have embedded
options, as shown below.
Alternative Asset Classes
On the equities side, the NSE is targeting to launch its
option trading platform in 2018 after having missed the
Q3:2017 deadline earlier set. We expect this to
monumentally shift the dynamics of derivatives in the
Nigerian financial market as it helps to further deepen
the market.

Page 50 Nigerian Economy & Financial Market Outlook 2018
Global Commodities Review and Outlook
Energy Commodity Prices to Outstrip Others for the Third
Year
The global commodity market was mildly bullish for most
part of 2017 with Energy commodities outperforming
Agricultural commodities, similar to the trend observed in
2016. According to the World Bank Commodity Markets
Outlook (Oct 2017), Energy commodity index gained
11.5% in 2017 after a marked increase of 42.9% in 2016
while the non-Energy index only gained 2.4% in 2017
compared to 9.7% rise in 2016. Prices of Agricultural
commodities were flattish throughout 2017 with the
index shedding 2.1% Y-o-Y on the back of declines
recorded in Beverages (-6.4%), Food (-1.3%) and Oils &
Mills (-5.3%) indices. Grains index was the only
component of the broader food index that appreciated Y
-o-Y in 2017. Falling inventories in the oil market -
against the backdrop of OPEC production restraints - and
strong global demand despite stabilizing US shale
production, strengthened oil prices above US$54.7/b for
most part of 2017. Sufficient supplies as well as stable
stocks-to-use ratios (measure of abundance of supply
relative to demand) supported stability in Agricultural
commodities.
Outlook on global commodities appears favourable as
energy prices are projected to rise 4.0% in 2018 while
non-energy prices are forecast to increase by a modest
1.0% in the same period. Stable crude oil prices are
anticipated to support the increase in energy prices as oil
prices are expected to increase to US$56.00/b in 2018 by
Alternative Asset Classes
the World Bank on strong demand as well as restraint in
OPEC and non-OPEC production offsetting anticipated
increase in shale oil outputs. Agricultural prices are
forecast to drive the performance of non-energy prices in
2018 with the World Bank forecasting the prices of
Beverages, Food and Grains to stabilize with Y-o-Y
marginal increases.
Our profiles of major global commodities focus on Energy
(Crude Oil) and Agricultural commodities (Wheat, Sugar,
Barley, Sorghum, Cocoa and Crude Palm Oil).
Crude Oil: Supply Freeze Agreement Buoyed Prices;
Stable Outlook For 2018
Crude oil prices had a positive year on the back of high
degree of compliance by OPEC and Non-OPEC countries
with the oil supply freeze agreement which was reached
in December 2016 and extended in November 2017 for 6
months. As at September 2017, the degree of compliance
to the deal was estimated by OPEC in its Monthly Oil
Market Report (MOMR) at 88.0%. The strong
performance in 2017 was also aided by natural disasters
(Hurricane Harvey and Irma) which hit US Shale oil
production in the gulf coast - notably reducing
production by 1.65mb/d in September according to data
from OPEC’s MOMR, falling production volumes in
Venezuela, declining oil inventories and increase in
global oil demand. OPEC in its MOMR estimated global
supply at an average of 97.44mb/d with 0.35mb/d
increase Y-o-Y while global aggregate demand rose by an
estimated 1.53mb/d or 1.6% Y-o-Y to 96.94mb/d; hence,
Chart 25: World Bank Monthly Energy and Non-Energy Commodity Price Indices (2014-2017)
Source: World Bank, Afrinvest Research
38.0
48.0
58.0
68.0
78.0
88.0
98.0
108.0
118.0
128.0
Jan
-14
Feb
-14
Mar-
14
Apr-
14
May-
14
Jun-1
4
Jul-14
Aug
-14
Sep
-14
Oct
-14
Nov-1
4
Dec-
14
Jan
-15
Feb
-15
Mar-
15
Apr-
15
May-
15
Jun-1
5
Jul-15
Aug
-15
Sep
-15
Oct
-15
Nov-1
5
Dec-
15
Jan
-16
Feb
-16
Mar-
16
Apr-
16
May-
16
Jun-1
6
Jul-16
Aug
-16
Sep
-16
Oct
-16
Nov-1
6
Dec-
16
Jan
-17
Feb
-17
Mar-
17
Apr-
17
May-
17
Jun-1
7
Jul-17
Aug
-17
Sep
-17
Oct
-17
Nov-1
7Energy Non-energy Agriculture Beverages Food Oils & Meals Grains Other Food
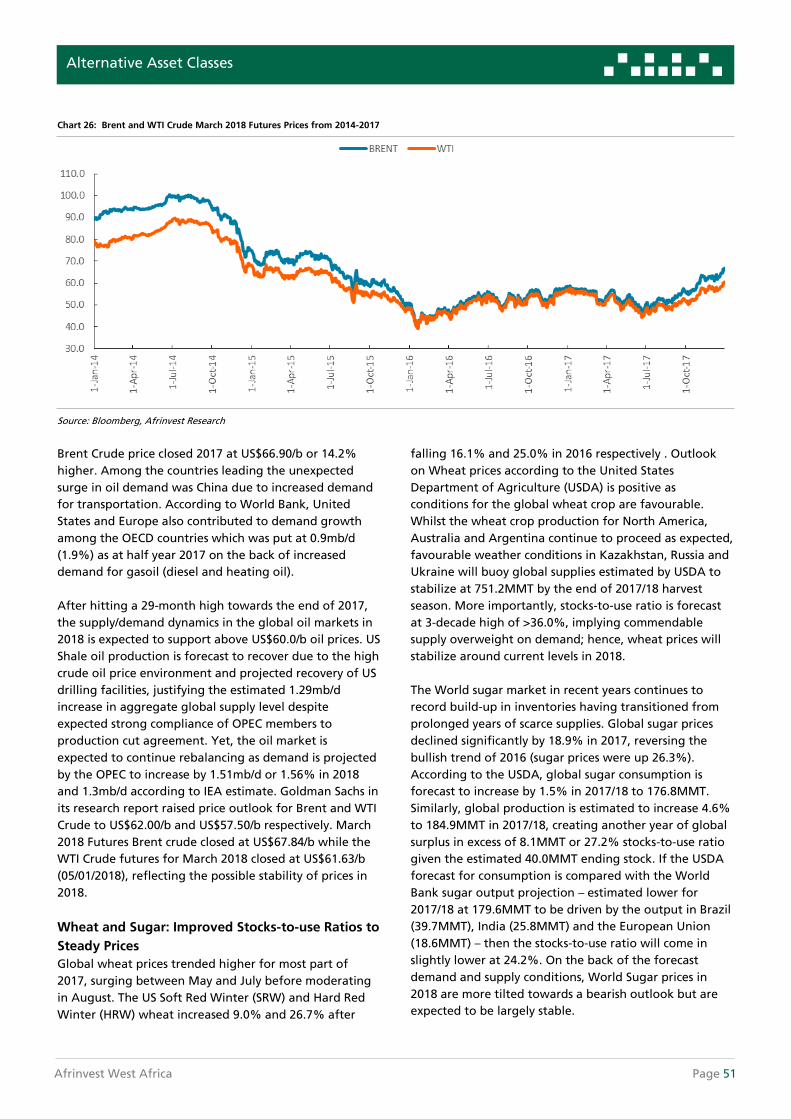
Afrinvest West Africa Page 51
Brent Crude price closed 2017 at US$66.90/b or 14.2%
higher. Among the countries leading the unexpected
surge in oil demand was China due to increased demand
for transportation. According to World Bank, United
States and Europe also contributed to demand growth
among the OECD countries which was put at 0.9mb/d
(1.9%) as at half year 2017 on the back of increased
demand for gasoil (diesel and heating oil).
After hitting a 29-month high towards the end of 2017,
the supply/demand dynamics in the global oil markets in
2018 is expected to support above US$60.0/b oil prices. US
Shale oil production is forecast to recover due to the high
crude oil price environment and projected recovery of US
drilling facilities, justifying the estimated 1.29mb/d
increase in aggregate global supply level despite
expected strong compliance of OPEC members to
production cut agreement. Yet, the oil market is
expected to continue rebalancing as demand is projected
by the OPEC to increase by 1.51mb/d or 1.56% in 2018
and 1.3mb/d according to IEA estimate. Goldman Sachs in
its research report raised price outlook for Brent and WTI
Crude to US$62.00/b and US$57.50/b respectively. March
2018 Futures Brent crude closed at US$67.84/b while the
WTI Crude futures for March 2018 closed at US$61.63/b
(05/01/2018), reflecting the possible stability of prices in
2018.
Wheat and Sugar: Improved Stocks-to-use Ratios to
Steady Prices
Global wheat prices trended higher for most part of
2017, surging between May and July before moderating
in August. The US Soft Red Winter (SRW) and Hard Red
Winter (HRW) wheat increased 9.0% and 26.7% after
Alternative Asset Classes
falling 16.1% and 25.0% in 2016 respectively . Outlook
on Wheat prices according to the United States
Department of Agriculture (USDA) is positive as
conditions for the global wheat crop are favourable.
Whilst the wheat crop production for North America,
Australia and Argentina continue to proceed as expected,
favourable weather conditions in Kazakhstan, Russia and
Ukraine will buoy global supplies estimated by USDA to
stabilize at 751.2MMT by the end of 2017/18 harvest
season. More importantly, stocks-to-use ratio is forecast
at 3-decade high of >36.0%, implying commendable
supply overweight on demand; hence, wheat prices will
stabilize around current levels in 2018.
The World sugar market in recent years continues to
record build-up in inventories having transitioned from
prolonged years of scarce supplies. Global sugar prices
declined significantly by 18.9% in 2017, reversing the
bullish trend of 2016 (sugar prices were up 26.3%).
According to the USDA, global sugar consumption is
forecast to increase by 1.5% in 2017/18 to 176.8MMT.
Similarly, global production is estimated to increase 4.6%
to 184.9MMT in 2017/18, creating another year of global
surplus in excess of 8.1MMT or 27.2% stocks-to-use ratio
given the estimated 40.0MMT ending stock. If the USDA
forecast for consumption is compared with the World
Bank sugar output projection – estimated lower for
2017/18 at 179.6MMT to be driven by the output in Brazil
(39.7MMT), India (25.8MMT) and the European Union
(18.6MMT) – then the stocks-to-use ratio will come in
slightly lower at 24.2%. On the back of the forecast
demand and supply conditions, World Sugar prices in
2018 are more tilted towards a bearish outlook but are
expected to be largely stable.
Chart 26: Brent and WTI Crude March 2018 Futures Prices from 2014-2017
Source: Bloomberg, Afrinvest Research

Page 52 Nigerian Economy & Financial Market Outlook 2018
Barley and Sorghum: Price Improvements of 2017
to be Reversed in 2018
The downtrend in Barley prices which persisted in
H2:2016 came to a halt in Mar-2017 as average price for
the month improved to US$137.00/MT from US$135.00/
MT in Feb-2017. As a result, average price for Q1:2017
marginally improved 0.7% Q-o-Q to US$137.21/MT from
US$136.19/MT in Q4:2016. The uptrend in barley prices
was sustained all through the year to eventually settle at
US$145.00/MT in Sep-2017, up 7.0% Y-o-Y. Similarly,
average Sorghum prices improved in 2017, rising 6.5%
from US$139.00/MT in Q4:2016 to US$148.00/MT in
Q2:2017 on the back of increased global demand,
especially from China.
From the USDA’s Grain: World Markets and Trade report
for December 2017, Barley output for 2017/18 is
Alternative Asset Classes
projected to reduce to 141.9MMT from 147.2MMT in
2016/2017 due to lower production across major
exporters, save for Belarus, China, Ethiopia, Iran, Morocco
and Russia. The EU remains the largest producer,
accounting for 40.7% of world output, followed by
Russia (11.9%) and Australia (9.1%). Similarly, Sorghum
production is projected to decline to 59.2MMT from
63.2MMT. In terms of consumption level, Barley and
Sorghum are expected to reduce from 149.2MMT and
63.4MMT to 147.4MMT and 59.8MMT respectively in
2017/2018. Consequently, Barley is expected to pare gains
in 2018 as the World Bank forecasts average Barley prices
to settle at US$144.00/MT while pricing of Sorghum will
be majorly dependent on production from Nigeria.
Chart 27: Historical Trajectory of US SRW and HRW Wheat and World Sugar Prices (Rebased)
Source: World Bank, Afrinvest Research
Chart 28: Barley Price Movement (Jan-16 – Sep-17)
Source: World Bank Commodity Outlook Report, Afrinvest Research

Afrinvest West Africa Page 53
0.50
0.60
0.70
0.80
0.90
1.00
1.10
1.20
1.30
Jan
-14
Feb
-14
Mar-
14
Apr-
14
May-
14
Jun-1
4
Jul-14
Aug
-14
Sep
-14
Oct
-14
Nov-1
4
Dec-
14
Jan
-15
Feb
-15
Mar-
15
Apr-
15
May-
15
Jun-1
5
Jul-15
Aug
-15
Sep
-15
Oct
-15
Nov-1
5
Dec-
15
Jan
-16
Feb
-16
Mar-
16
Apr-
16
May-
16
Jun-1
6
Jul-16
Aug
-16
Sep
-16
Oct
-16
Nov-1
6
Dec-
16
Jan
-17
Feb
-17
Mar-
17
Apr-
17
May-
17
Jun-1
7
Jul-17
Aug
-17
Sep
-17
Oct
-17
Nov-1
7
Cocoa Crude Palm Oil
Crude Palm Oil (CPO): Prices to Remain Stable on
the back of Steady Demand
As the El-Nino effect fizzled out in 2017, average palm oil
prices moderated 4.7% Y-o-Y to US$716.00/MMT in Nov-
2017 from US$722.00/MMT in Nov-2016 which was largely
expected as weather conditions improved, and
production volumes increased 5.9% from 58.8MMT in
2015/16 to 62.3MT in the 2016/17 farming season. Despite
the increasing global output, Nigeria’s output has
remained at 0.97MMT till date, far below its potential,
given the long gestation period for oil palm trees.
According to the World Bank’s Commodity Outlook for
2018, World outputs are projected to rise, buoyed by
favourable weather conditions and plans by Indonesia to
increase its total production to 42.0MMT by 2020. In line
with the World Bank’s projection, we expect the price of
CPO in 2018 to remain largely stable - inching slightly
higher by 2.0% on the back of steady demand for palm
oil.
Alternative Asset Classes
Chart 29 : 3 – Year Monthly Historical Price Movement
Source: World Bank Commodity Price Data
Cocoa: Rising Demand in Asia to Support Market
In 2017, total Cocoa production increased as farmlands
across West Africa and Latin America enjoyed favourable
weather conditions. Although positive for output, the
resultant effect was an oversupply in the market and a
subsequent decline in prices. As a result, average Cocoa
prices fell 7.3% to US$2,127.90/MT in Nov-2017 from
US$2,295.30/MT in Dec-2016, leaving the two largest
exporters - Cote d’Ivoire and Ghana - grappling with
revenue challenges. As consumers’ health consciousness
increases, the demand for Cocoa is expected to decrease
in the long term; however, it is believed this effect will be
tapered by rising demand from Asian consumers in the
near term.

Nigerian Economic & Financial Market Outlook 2018 Page 54
Section Seven
Investment Strategy for 2018

Afrinvest West Africa Page 55
Recovery Driven Fundamentals to Shape
Investment Strategy
Sequel to the rebound in global oil prices and increased
flexibility of FX policy, the domestic economy and
financial markets kick started a bullish jolly ride in 2017.
The economy continues to show signs of recovery with
prospects inclined towards a slow but steady growth.
Whilst the traditional investment asset classes, most
especially equities and fixed income, had their boom and
bust in the year, one key theme continues to define the
domestic investment landscape: “Sound Fundamentals”.
Having survived the policy misalignment that enveloped
and weakened equities market return in 2016, we are of
the view that the recent recovery momentum will be
sustained in the near term. On the back of a 42.3%
return in 2017, the NSE All Share Index is set for another
bullish year, in what looks like a repeat of 2013 history,
having gained 12.2% as at 12/01/2018. Similarly, the
bullish run in the fixed income market in Q4:2017
resulted in a 10.5% return on the Access Bank Bond index
in 2017 relative to 4.5% loss in 2016; yet, expectation of
lower yields in 2018 will shape performance on fixed
income securities. Consequently, we reason that for the
investment strategy in 2018 to be optimal, it will
necessarily have to hinge on fundamentals of investible
asset classes.
Our outlook on the market for 2018 remains largely
positive as we expect investor sentiment to remain strong
as already demonstrated in early trades. Furthermore,
barring any major negative shocks in the FX market,
fundamentals will be a key determinant of overall
Investment Strategy for 2018
performance for the year. Hence, investors will have to
adopt an active investment strategy, especially for
equities, in order to take advantage of opportunities in
the market.
Review of 2017 Strategy: “Recession Investing
amidst Policy Deficit Calls for a Cautious Strategy”
On the back of the prevailing macroeconomic realities at
the start of 2017 – contraction in GDP, high inflation
level, low oil prices as well as FX illiquidity - the view on
the equities market was a more pessimistic outlook given
weak sentiment towards the broader economy. Against
this backdrop, we advised investors to remain cautious
and adopt a strategy that is more focused on capital
preservation whilst recommending investors stay
overweight on fixed income securities over equities with
an advised mix of 80:20 allocation.
However, following the reforms implemented in the FX
market, as well as the improvement in macroeconomic
indicators, sentiment strengthened, driving the
benchmark index 42.3% northwards in 2017. Despite our
recommendation to overweight on fixed income
instruments, investors who also took advantage of our
equity recommendations recorded substantial gains as FX
policy reforms favoured equities.
Chart 30: Afrinvest Strategy Portfolio Returns and Fund Performance
Source: Afrinvest Research
77.8%
27.3%22.6%
16.6%11.6%
40.5%42.3%
10.5%
0.0%
10.0%
20.0%
30.0%
40.0%
50.0%
60.0%
70.0%
80.0%
90.0%
Dividend Portfolio Long TermDefensive Portfolio
High Modifiedduration portfolio
Eurobond Portfolio Afrinvest NIDF Afrinvest EquityFund
2017 Portfolio Return NSE ASI ACCESS Bank Bond Index
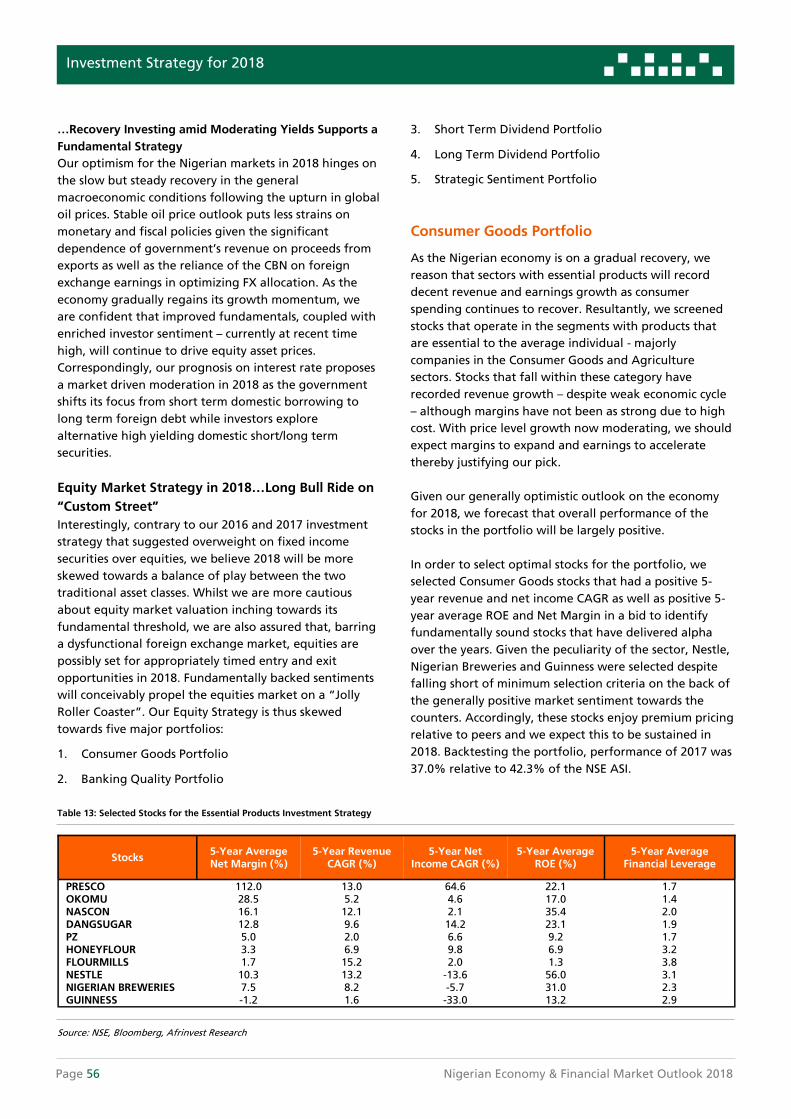
Page 56 Nigerian Economy & Financial Market Outlook 2018
…Recovery Investing amid Moderating Yields Supports a
Fundamental Strategy
Our optimism for the Nigerian markets in 2018 hinges on
the slow but steady recovery in the general
macroeconomic conditions following the upturn in global
oil prices. Stable oil price outlook puts less strains on
monetary and fiscal policies given the significant
dependence of government’s revenue on proceeds from
exports as well as the reliance of the CBN on foreign
exchange earnings in optimizing FX allocation. As the
economy gradually regains its growth momentum, we
are confident that improved fundamentals, coupled with
enriched investor sentiment – currently at recent time
high, will continue to drive equity asset prices.
Correspondingly, our prognosis on interest rate proposes
a market driven moderation in 2018 as the government
shifts its focus from short term domestic borrowing to
long term foreign debt while investors explore
alternative high yielding domestic short/long term
securities.
Equity Market Strategy in 2018…Long Bull Ride on
“Custom Street”
Interestingly, contrary to our 2016 and 2017 investment
strategy that suggested overweight on fixed income
securities over equities, we believe 2018 will be more
skewed towards a balance of play between the two
traditional asset classes. Whilst we are more cautious
about equity market valuation inching towards its
fundamental threshold, we are also assured that, barring
a dysfunctional foreign exchange market, equities are
possibly set for appropriately timed entry and exit
opportunities in 2018. Fundamentally backed sentiments
will conceivably propel the equities market on a “Jolly
Roller Coaster”. Our Equity Strategy is thus skewed
towards five major portfolios:
1. Consumer Goods Portfolio
2. Banking Quality Portfolio
Investment Strategy for 2018
3. Short Term Dividend Portfolio
4. Long Term Dividend Portfolio
5. Strategic Sentiment Portfolio
Consumer Goods Portfolio
As the Nigerian economy is on a gradual recovery, we
reason that sectors with essential products will record
decent revenue and earnings growth as consumer
spending continues to recover. Resultantly, we screened
stocks that operate in the segments with products that
are essential to the average individual - majorly
companies in the Consumer Goods and Agriculture
sectors. Stocks that fall within these category have
recorded revenue growth – despite weak economic cycle
– although margins have not been as strong due to high
cost. With price level growth now moderating, we should
expect margins to expand and earnings to accelerate
thereby justifying our pick.
Given our generally optimistic outlook on the economy
for 2018, we forecast that overall performance of the
stocks in the portfolio will be largely positive.
In order to select optimal stocks for the portfolio, we
selected Consumer Goods stocks that had a positive 5-
year revenue and net income CAGR as well as positive 5-
year average ROE and Net Margin in a bid to identify
fundamentally sound stocks that have delivered alpha
over the years. Given the peculiarity of the sector, Nestle,
Nigerian Breweries and Guinness were selected despite
falling short of minimum selection criteria on the back of
the generally positive market sentiment towards the
counters. Accordingly, these stocks enjoy premium pricing
relative to peers and we expect this to be sustained in
2018. Backtesting the portfolio, performance of 2017 was
37.0% relative to 42.3% of the NSE ASI.
Stocks 5-Year Average Net Margin (%)
5-Year Revenue CAGR (%)
5-Year Net Income CAGR (%)
5-Year Average ROE (%)
5-Year Average Financial Leverage
PRESCO 112.0 13.0 64.6 22.1 1.7 OKOMU 28.5 5.2 4.6 17.0 1.4 NASCON 16.1 12.1 2.1 35.4 2.0 DANGSUGAR 12.8 9.6 14.2 23.1 1.9 PZ 5.0 2.0 6.6 9.2 1.7 HONEYFLOUR 3.3 6.9 9.8 6.9 3.2 FLOURMILLS 1.7 15.2 2.0 1.3 3.8 NESTLE 10.3 13.2 -13.6 56.0 3.1 NIGERIAN BREWERIES 7.5 8.2 -5.7 31.0 2.3 GUINNESS -1.2 1.6 -33.0 13.2 2.9
Table 13: Selected Stocks for the Essential Products Investment Strategy
Source: NSE, Bloomberg, Afrinvest Research

Afrinvest West Africa Page 57
Banking Quality Portfolio
The banking sector has remained one of the resilient
sectors, outperforming the broader market in 2016 and
2017 in terms of earnings and returns. The sector remains
the most liquid across the Nigerian equity market and
presents substantial upside potential for discerning
investors. Given our generally positive outlook for the
market and the broader economy in 2018, we structured
an investment strategy that focuses on Quality banking
stocks based on earnings fundamental. Our screening
criteria present the banks that have historically
demonstrated impressive performance and present
upside opportunity for investors in both dividend and
capital appreciation.
Return on Equity (ROE) remains the most valuable
fundamental measure and the stocks with relatively high
ROE have historically outperformed. Hence, from the
universe of banks, we selected stocks with ROE higher
than industry average in at least 8 of the last 16 quarters.
In the same vein, stocks which simultaneously meet our
measurement of market value criteria (Earnings Yield,
Dividend Yield and Book Value to Price Yield) of higher
than industry averages in at least 4 of the last 8 quarters,
qualify for this portfolio. We also screened the stocks for
liquidity using the tradable float while also capping
exposure to a single stock at 30.0% using the free float
Investment Strategy for 2018
market capitalization. Back-testing these criteria against
banking stocks in Nigeria, the portfolio has outperformed
the NSE banking index in 3 of the last 5 years – portfolio
gained 88.2% in 2017 relative to NSE banking return of
73.3%.
Short Term Dividend Income Portfolio
Our short-term dividend income portfolio is
recommended for investors with a short term investment
horizon, especially the first three months of the year,
prior to the payment of dividend for the FY:2017 period.
Our portfolio tracks a list of fundamentally sound stocks
in our coverage universe that are expected to pay
attractive dividend for FY: 2017 relative to market price.
We selected stocks with a minimum of expected 5.0%
implied yield based on closing price as at 8/01/2018. The
stocks that qualified fall within the Insurance, Banking,
Consumer and Industrial Goods sectors. The portfolio is
structured for entry in January and should be actively
tracked in order to determine best exit time after the
rally on the stocks post dividend declaration.
Nevertheless, investors can still hold the stocks for a 12-
month holding period given the portfolio constituents
also pass our fundamental criteria. Our dividend portfolio
held throughout 2017 returned 77.8%.
Table 14: Selected Stocks for the Banking Value Strategy
Source: NSE, Bloomberg, Afrinvest Research
Stocks ROE Count BVP/P Count Earnings Yield Count Dividend Yield Count Liquidity Weighting
GUARANTY 16 - - - 10.4% 30.0% ZENITH 16 - 7 3 17.8% 30.0% ACCESS 14 7 8 5 17.7% 10.4% UBA 16 5 8 4 14.4% 10.1% STANBIC 16 8 8 - 5.9% 6.7% FBNH 8 8 - - 13.5% 12.8%
Table 15: Selected Stocks for the Long run Dividend Portfolio
Source: NSE, Bloomberg, Afrinvest Research
2017 DPS Price Trailing P/E Trailing ROE Implied Yield
CONTINSURE 0.16 1.40 8.85 9.65 11.4% WAPCO 4.41 44.89 4.88 47.14 9.8% MANSARD 0.17 1.93 12.90 11.86 8.8% UBA 0.90 10.30 5.33 17.18 8.7% ZENITHBA 2.19 25.64 6.52 21.70 8.5% DANGSUGA 1.57 20.00 8.39 23.75 7.9% CUSTODIAN 0.29 3.89 4.18 18.86 7.5% ACCESS 0.75 10.45 4.90 15.08 7.2% FCMB 0.10 1.48 7.31 3.81 6.8% GUARANTY 2.49 40.75 10.32 25.96 6.1% FIDELITY 0.15 2.46 2.79 8.00 6.1% FLOURMIL 1.53 29.00 9.07 10.40 5.3% DANGCEM 11.96 230.00 17.40 30.41 5.2%

Page 58 Nigerian Economy & Financial Market Outlook 2018
Long-Term Dividend Portfolio
Dividend payment is a major determinant of investment
decisions for Nigerian investors given the generally risk
adverse nature of the average investor. In this portfolio,
we screen stocks with a consistent dividend payment
history in at least 4 of the last 5 years and also have
positive earnings growth for the same period. These
criteria ensured that the selected stocks have historically
demonstrable sufficient level of earnings stability. In the
same vein, dividend yield for the selected stocks must
have surpassed average market dividend yield in at least
4 of the past 6 years, which will enable us determine
stocks that have consistently outperformed the market
based on dividend yield.
We also placed emphasis on liquidity, using Annualised
Traded Value Ratio (ATVR) to screen out illiquid stocks
while free-float market capitalisation methodology was
used to weigh constituents but capped exposure to a
given sector and stock at 50.0% and 20.0% respectively.
Back testing the portfolio with historical data, it has
consistently outperformed the market in the last 5 years,
returning 68.5% in 2017 relative to market return of
42.3%.
Investment Strategy for 2018
STANBIC) and Consumer Goods (NESTLE, NIGERIAN
BREWERIES, GUINNESS, PZ and UNILEVER) stocks
constitute our sentiment portfolio. Whilst we note that
this portfolio is sentiment based, selected stocks also
parenthetically passed our basic tests of sound
fundamentals. The Portfolio returned 56.8% in 2017.
Fixed Income Strategy in 2018…More than Meets
the Eye
Long term play defines our overall strategy in the fixed
income market for 2018. We expect the easing of the
crowding out effect of federal government in the
domestic debt market to create incentive for Sub-
National and Corporate debt issuances as rates on
Sovereign instruments moderate towards long term
average level. Importantly, our theme for smart fixed
income investing in 2018 is: “Active “and “Liquid”.
1. Smart Eurobond Portfolio
2. Low Risk Aggressive Portfolio
3. High Return Long-Bond Portfolio
4. Passive Bond Portfolio
Table 16: Selected Stocks for the Long-Term Dividend Portfolio
Source: NSE, Bloomberg, Afrinvest Research
Stocks Dividend Payment Count Net Income Growth Count Dividend Yield Count Liquidity Weighting
GUARANTY 5 6 5 10.4% 20.0% CAP 4 5 6 4.0% 20.0% UACN 5 4 4 6.4% 20.0% ZENITH 5 5 6 17.8% 15.4% AIRSERVICE 4 4 5 17.7% 10.0% ACCESS 5 5 6 16.1% 5.3% UBA 5 4 5 14.4% 5.2% STANBIC 5 4 4 5.9% 3.4% FCMB 4 4 6 14.1% 0.6%
Sentiment Portfolio
Due to the fact that the Nigerian equities market is
majorly dominated by foreign portfolio investors, we also
adopted a “purely sentiment based” strategy for playing
equities in 2018. Following the return of foreign players
into the Nigerian markets in 2017, against the backdrop
of improving macroeconomic conditions – especially
reforms implemented in the FX market - we forecast that
significant interest could be recorded in stocks that have
historically been the toast of FPIs either because of the
foreign parent affiliation or their inclusion in the MSCI
frontier market index. Banking (GUARANTY and
Smart Eurobond Portfolio
We are of the view that despite the normalization of
monetary policy in most systemically important
economies, emerging and frontier markets will still
present optimal return in 2018. This assumption informs
our “Smart Eurobond Portfolio” designed to be active all
year-round. The portfolio comprises of SSA Sovereign and
Corporate Eurobonds intended to take advantage of
Yield volatility across emerging and Frontier markets.
Although interest rates are normalizing across developed
markets, investors would seek more optimal returns in
emerging markets.

Afrinvest West Africa Page 59
Whilst we design the portfolio to be active all year round
in order to take advantage of market movements, we
recommend Eurobond securities trading at a minimum
yield to maturity of 4.0% and at discount or slightly
above par value with investment grade or junk rating but
not exceeding 3.6 years term to maturity. The portfolio
screening comprises of two Sub-Saharan Sovereign
Eurobonds and five Nigerian Corporate Eurobonds all
with Yields to Maturity of 4.0% and above. The portfolio
is opened to rebalancing to include other Sovereign or
Corporate Eurobonds in the course of the year as
opportunities surface.
Investment Strategy for 2018
17.5% average prime lending rate) relative to the
average issue yield of 21.0% in 2017. Consequently,
investors with short term funds can ride on the wave of
this recent market repricing to buy into attractive
investment-grade rated Commercial Papers in 2018. We
recommend maximum of 6-month tenor for any
commercial paper to be considered in this portfolio.
Similarly, the portfolio favours investment in the monthly
savings bond of the Federal Government as well as other
specialized debt issuances of the Federal Government
such as an infrastructure bond.
High Return Long-Bond Portfolio
Our High Return Aggressive Portfolio is designed to
leverage on interest rate movement during the year as
we expect the yield environment to moderate. This
technically implies that bond prices are anticipated to rise
given the inverse relationship between the two. For
portfolio optimization, we recommend long dated bonds
with >8 years term to maturity which in turn corresponds
to bond securities with minimum of 4.5 years modified
duration.
Table 17: Smart Eurobond Portfolio
Source: Bloomberg, Afrinvest Research
Low Risk Aggressive Portfolio
On the back of our overall outlook on interest rate, yields
on short term LCY sovereign instruments, particularly T-
bills, are expected to moderate considerably in 2018. This
presents an opportunity for Corporates with Prime
borrowing status to explore capital raising from the
domestic market through Commercial Paper issuances for
funding working capital needs. Furthermore, we
anticipate a moderation in issuance yield of CPs to a
range of 15.0% - 17.0% in 2018 (compared to expected
Instrument Issue Date Coupon % Maturity TTM
(Years) Modified Duration
Offer Yield
%
Offer Price (N)
Price CHG with
2.0% Drop in
Yield
Price Return
Plus Cou-pon
^12.50 22-JAN-2026 22-Jan-16 12.5 22-Jan-26 8.1 4.5 14.2 91.8 100.8 113.3 ^12.49 22-MAY-2029 22-May-09 12.5 22-May-29 11.4 5.6 14.2 90.6 101.8 114.2
^8.50 20-NOV-2029 20-Nov-09 8.5 20-Nov-29 11.9 6.2 14.2 67.8 80.2 88.7 ^10.00 23-JUL-2030 23-Jul-10 10.0 23-Jul-30 12.6 5.8 14.2 75.9 87.5 97.5
^12.1493 18-JUL-2034 18-Jul-14 12.1 18-Jul-34 16.6 6.1 14.1 87.7 99.8 112.0 ^12.40 18-MAR-2036 18-Mar-16 12.4 18-Mar-36 18.2 6.6 13.4 93.5 106.7 119.1
507.2 576.8 644.8 Expected Overall Portfolio Return 27.1%
Table 18: Movement in Bond Price Given a 2.0% change in Yield
Source: FMDQ, Bloomberg, Afrinvest Research

Page 60 Nigerian Economy & Financial Market Outlook 2018
Investment Strategy for 2018
Empirically, a 1.0% moderation in yield increases the
value of the bond by the size of the modified duration.
Hence, we expect market conditions to result in at least
2.0% drop in yield; implying total return of 27.1%
(coupon plus capital appreciation) for our modelled High
Return Long-Bond portfolio. This portfolio is designed to
be active given the medium term to long term maturity
of most instruments screened; thus, holding to maturity
may give less annualized return on the portfolio.
Passive Bond Portfolio
We are convinced that primary market for Corporate and
Sub-national debt securities will resuscitate in 2018 as the
Federal Government becomes less aggressive with
domestic debt raising and fiscal profile of sub-nationals
improve to allow for access to capital market. However,
given that most Corporate and State debt instruments
are illiquid in Nigeria, we recommend this portfolio for
passive investors with long term fund. We recommend a
maximum tenor of 5 years for any constituent of the
portfolio with an investment grade not less than a BBB.

Nigerian Economic & Financial Market Outlook 2018 Page 61
Section Eight
List of Charts

Page 62 Nigerian Economy & Financial Market Outlook 2018
List of Charts
Chart 1: Global and Regional Growth Estimates and Forecasts (2016 – 2018F)
Chart 2: MSCI Indices Performance (Dec-2016 – Dec-2017)
Chart 3: Nigeria’s Macroeconomic Fundamentals - Activity, Prices and External Sector Balance
Chart 4: Oil Price vs Oil Production (Q3:2015 – Q3:2017) Chart xx: CBN FX Interventions (Q3:2015 – Q3:2017)
Chart 5: Nigeria’s Foreign Exchange Market Development
Chart 6: Inflation Indices Development (2016 – 2017) Chart xx: Actual Inflation vs. Bloomberg Median Survey
Chart 7: ATC&C Losses vs. Performance Target (Dec-2016) Chart xx: MYTO 2.1 Tariff Assumptions vs. Current
Realities
Chart 8: 2018 Headline Inflation Forecast
Chart 9: GDP Performance by Sector (Q2:2016-Q3:2017)
Chart 10: GDP Growth Outlook
Chart 11: Policy and Market Interest Rates in 2017
Chart 12 : President Buhari’s Approval Rating by Regions
Chart 13: President Buhari’s Approval Rating Trend
Chart 14 : Nigerian Equites Market Performance in 2017
Chart 15: 10-Year YTD performance of the NSE ASI
Chart 16 : Nigerian Equities Market Sector Performance in 2017
Chart 17: Historical RSI Trend of the Nigerian Equities Market
Chart 18 : Historical performance of the NSE ASI
Chart 19 : NSEASI vs. External reserves and Oil Prices
Chart 20 : 3-Year Average Historical Nigerian Sovereign Bond Yield
Chart 21 : Historical Average Sub-Saharan Sovereign and Corporate Eurobond Yield
Chart 22: Nigerian Sovereign Yield Curve across Quarters (%)
Chart 23 : Mortgage Loans as % of Income Assets (2015 – 2017)
Chart 24 : Mortgage Loans Performance (2015-2017)
Chart 25: World Bank Monthly Energy and Non-Energy Commodity Price Indices (2014-2017)
Chart 26: Brent and WTI Crude March 2018 Futures Prices from 2014-2017
Chart 27 : Historical Trajectory of US SRW and HRW Wheat and World Sugar Prices (Rebased)
Chart 28 : Barley Price Movement (Jan-16 – Sep-17)
Chart 29 : 3 – Year Monthly Historical Price Movement
Chart 30 : Afrinvest Strategy Portfolio Returns and Fund Performance

Afrinvest West Africa Page 63
List of Tables and Figures
Table 1: Ease of Doing Business Ranking
Table 2: Four Key Reform Agenda
Table 3: Current and previous Sovereign Credit Rating
Table 4: External Debt Issuances
Table 5: 2018 Budget
Table 6: Performance of NSE Sector Indices in 2017
Table 7: Market Return Assumptions and Projection
Table 8: Treasury Bills, OMO and Bond Auction Summary for 2017
Table 9: Change in Prices of Construction Materials
Table 10: NMRC Financial Statement Summary in FY:2016
Table 11: OTC Futures Contract as at December 2017
Table 12 : Selected Bonds with Options
Table 13: Selected Stocks for the Essential Products Investment Strategy
Table 14 : Selected Stocks for the Banking Value Strategy
Table 15 : Selected Stocks for the Long run Dividend Portfolio
Table 16: Selected Stocks for the Long-Term Dividend Portfolio
Table 17 : Smart Eurobond Portfolio
Table 18 : Movement in Bond Price Given a 2.0% change in Yield
Figure 1: Nigerian Polity Heat map
Figure 2: NSEASI vs. External reserves
Figure 3: Potential Fixed Income Market Drivers for 2018

Nigerian Economic & Financial Market Outlook 2018 Page 64
Section Nine
Afrinvest (West Africa) Limited

Afrinvest West Africa Page 65
About US
Afrinvest (West Africa) Limited (“Afrinvest” or the “Company”) is a leading independent investment banking firm with a
focus on West Africa and active in four principal areas: investment banking, securities trading, asset management, and
investment research. The Company was originally founded in 1995 as Securities Transaction and Trust Company Limited
(“SecTrust”) which grew to become a respected research, brokerage and asset management firm. Afrinvest (West Africa)
Limited is licensed by the Nigerian Securities and Exchange Commission (“SEC”) as an issuing house and underwriter. We
provide financial advisory services as well as innovative capital raising solutions to High Net-worth Individuals (“HNIs”),
corporations, and governments. Afrinvest is a leading provider of research content on the Nigerian market as well as a
leading adviser to blue chip companies across West Africa on M&A and international capital market transactions. The
company maintains three offices in Lagos, Abuja and Port-Harcourt.
Afrinvest Securities Limited (“ASL”) is licensed by the Nigerian SEC as a broker dealer and is authorized by the Nigerian
Stock Exchange (“NSE”) as a dealing member. ASL acts as a distribution channel for often exclusive investment products
originated by Afrinvest and AAML as well as unique value secondary market trading opportunities in equity, debt,
money market and currency instruments.
Afrinvest Asset Management Limited (“AAML”) is licensed by the Nigerian SEC as a portfolio manager. AAML delivers
world class asset management services to a range of mass affluent and high net worth individual clients. AAML offers
investors direct professionally managed access to the Nigerian capital markets through equity focused, debt focused and
hybrid unit trust investment schemes amongst which are the Nigeria International Debt Fund (NIDF), Afrinvest Equity
Fund (AEF), Balance Growth Portfolio (BGP), Ethical Investment Portfolio (EIP) and Guaranteed Income Portfolio (GIP).
Contacts
Investment Research
Robert Omotunde [email protected] +234 1 270 1680 ext. 314
Omotola Abimbola [email protected] +234 1 270 1680 ext. 316
Eronmosele Aziba [email protected] +234 1 270 1680 ext. 319
Obianuju Nsofor [email protected] +234 1 270 1680 ext. 232
Valiance Moweta [email protected] +234 1 270 1680 ext. 318
Omoefe Eromosele [email protected] +234 1 270 1680 ext. 317
Ayorinde Akinloye [email protected] +234 1 270 1680 ext. 235
Institutional Sale and Marketing
Ayodeji Ebo [email protected] +234 1 270 1680 ext. 315
Bolaji Fajenyo [email protected] +234 1 270 1680 ext 261
Investment Banking
Jessica Essien [email protected] +234 1 270 1680 ext 171
Victor Ndukauba [email protected] +234 1 270 1680 ext 311
Asset Management
Ola Belgore [email protected] +234 1 270 1680 ext 281
Morenike Ominike [email protected] +234 1 270 1680 ext 282
For further information, please contact:
Afrinvest West Africa Limited (AWA)
27,Gerrard Road
Ikoyi, Lagos
Nigeria
Tel: +234 1270 1680 | +234 1 270 1689
www.afrinvest.com
Page 66 Nigerian Economy & Financial Market Outlook 2018
DISCLAIMER
This report has been issued and approved by Afrinvest Securities Limited (“Afrinvest”). This report is based on information
from various sources that we believe are reliable; however, no, representation is made that it is accurate or complete. While
reasonable care has been taken in preparing this document, no responsibility or liability is accepted for errors or fact or for
any opinion expressed herein. This document is for information purposes only. It does not constitute any offer or solicitation
to any person to enter into any trading transaction. Any investment discussed may not be suitable for all investors. This
report is provided solely for the information of clients of Afrinvest who are expected to make their own investment
decisions. Afrinvest conducts designated investment business with market counter parties and intermediate customers and
this document is directed only at such persons. Other persons should not rely on this document. Afrinvest accepts no liability
whatsoever for any direct or consequential loss arising from any use of this report or its contents. This report is for private
circulation only. This report may not be reproduced distributed or published by any recipient for any purpose without prior
express consent of Afrinvest. Investments can fluctuate in price and value and the investor might get back less than was
originally invested. Past performance is not necessarily a guide to future performance. It may be difficult for the investor to
realize an investment. Afrinvest and/or a connected company may have a position in any of the instruments mentioned in
this document. Afrinvest and/or a connected company may or may not have in the future a relationship with any of the
entities mentioned in this document for which it has received or may receive in the future fees or other compensation.
Afrinvest is a member of The Nigerian Stock Exchange and is regulated by the Securities and Exchange Commission to
conduct investment business in Nigeria.