Outline PET Basics - American Association of Physicists in … · · 2008-06-301 PET Basics...
24
1 PET Basics Frederic H Fahey DSc Frederic H. Fahey DSc Children’s Hospital Boston Harvard Medical School [email protected] Outline • Positron Emission • Basics of PET Scanner Design • Data Acquisition • Data Acquisition • Review of Scintillation Materials • PET/CT • Time-of-Flight (TOF) PET • Special PET devices PET Overview Slide Radionuclides Used in Nuclear Medicine Single Photon Isotope T1/2 Examples 99m Tc 6 hrs MDP, Positron Isotope T1/2 Examples 15 O 2 min H 2 O HMPAO MAA DTPA 201 Tl 72 hrs Chloride 131 I 192 hrs Thyroid (Tx, Dx) CO O 2 CO 2 13 N 10 min NH3 18 F 109.8 min FDG 11 C 20.4 min methionine 82 Rb 1.3 min cardiac 64 Cu 12.7 hrs MoAB
Transcript of Outline PET Basics - American Association of Physicists in … · · 2008-06-301 PET Basics...

1
PET Basics
Frederic H Fahey DScFrederic H. Fahey DSc
Children’s Hospital BostonHarvard Medical School
Outline
• Positron Emission• Basics of PET Scanner Design• Data Acquisition• Data Acquisition • Review of Scintillation Materials• PET/CT• Time-of-Flight (TOF) PET• Special PET devices
PET Overview SlideRadionuclides
Used in Nuclear Medicine
Single PhotonIsotope T1/2 Examples99mTc 6 hrs MDP,
PositronIsotope T1/2 Examples
15O 2 min H2OHMPAOMAADTPA
201Tl 72 hrs Chloride131I 192 hrs Thyroid
(Tx, Dx)
COO2CO2
13N 10 min NH318F 109.8 min FDG11C 20.4 min methionine82Rb 1.3 min cardiac64Cu 12.7 hrs MoAB

2
Positron Decay
• Have an excess number of protons
• Lie below the line of stability
• Require accelerator for production
Positron Decay
Note: It takes about 8 MeV for a particle to overcome the nuclear binding energy
Cyclotron
• Provides energetic charged particles (p, d, α)
• 10 – 20 MeV10 20 MeV • For example,
18O (p,n) 18F
Annihilation Reaction
Two 511 keV annihilation photons are emitted 180o + sd
3
Annihilation Reaction
Conversion of mass to energy (Einstein)E(erg) = mc2
= 9.1091e-28g x (2.997e10cm/sec)2 9.1091e 28g x (2.997e10cm/sec)= 8.18e-10 gcm2/cm2
= 8.18e-10 ergE(MeV) = 8.18e-10 gcm2/cm2 x (1 Mev/1.6e-06 erg)
= 0.511 MeV
Electron CaptureElectron Capture
For lower transition energies, electron capture is an alternative decay mode for proton-rich isotopes. p
AZ N
AZ-1 N+1X + e- Y
p + e- n + γ
Positron Decay Positron Decay• Requires 1.022 MeV transition energy (creation of β+ and difference in number of orbital electrons). Electron capture results if the transition energy is below 1.022 MeV.
• Transformations with transition energies of greater than 1.022 MeV can decay via electron capture or positron decay.
• The greater the energy over the required 1.022 MeV the more likely positron decay will occur (rather than electron capture) and higher the kinetic energy of the emitted β+.
4
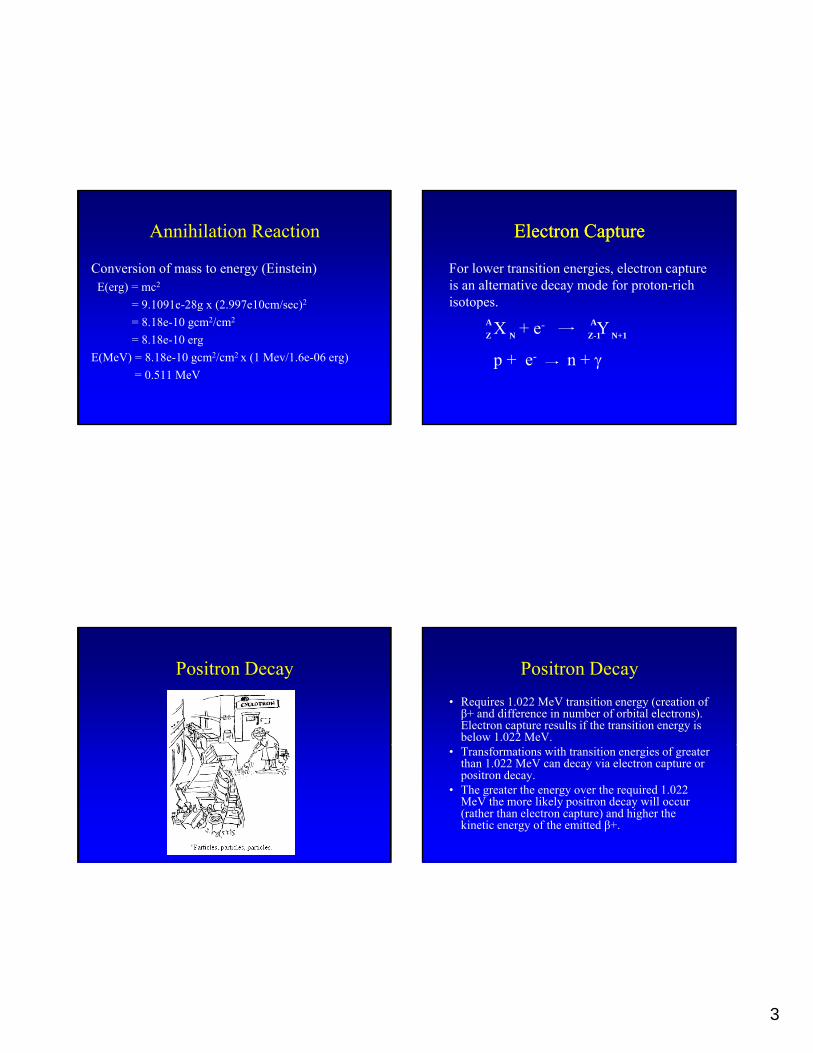
Examples
5
Energy of the Positron (β+)
• Transition energy that is used during the annihilation process is shared by the β+ and the neutrino (ν).( )
• If the β+ were to receive all of the energy it would have the maximum energy
ET – 1.022 MeV = Eβmax
• Positron shares excess energy with neutrino.
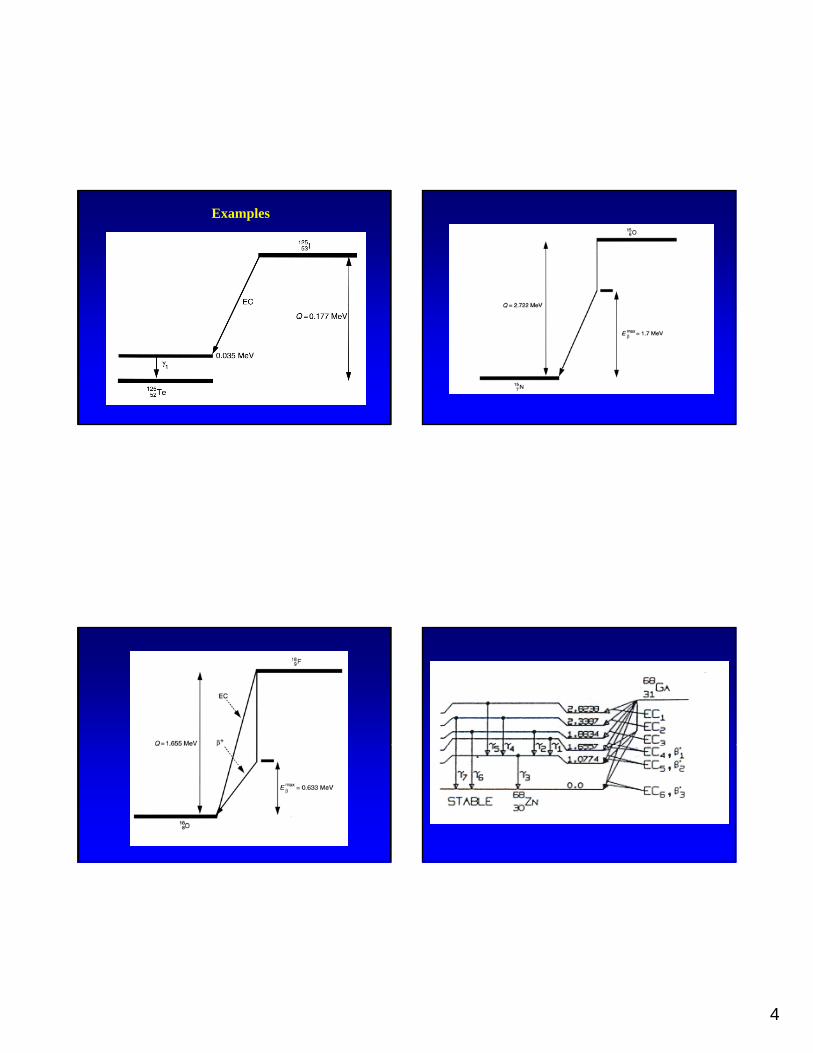
Energy of the Positron (β+)
Average energy of β+ is 1/3 Eβmax
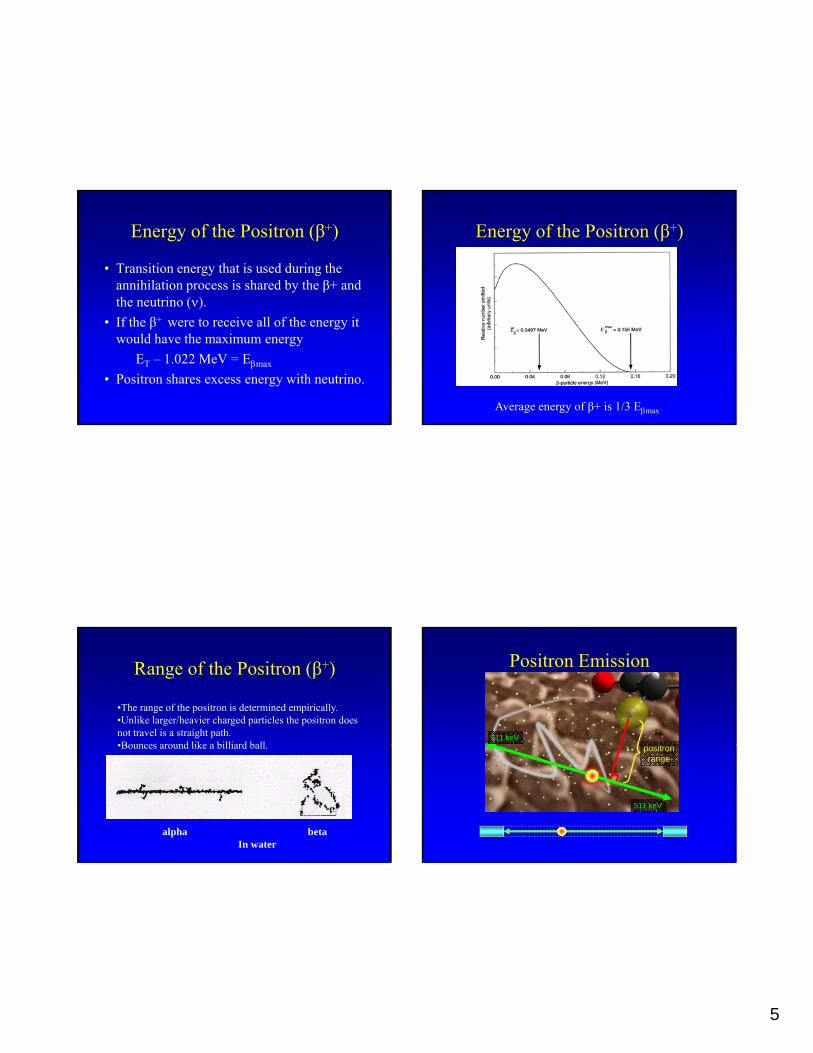
Range of the Positron (β+)
•The range of the positron is determined empirically.•Unlike larger/heavier charged particles the positron does not travel is a straight path.•Bounces around like a billiard ball•Bounces around like a billiard ball.
alpha betaIn water
Positron Emission
511 keVpositron range
511 keV
6
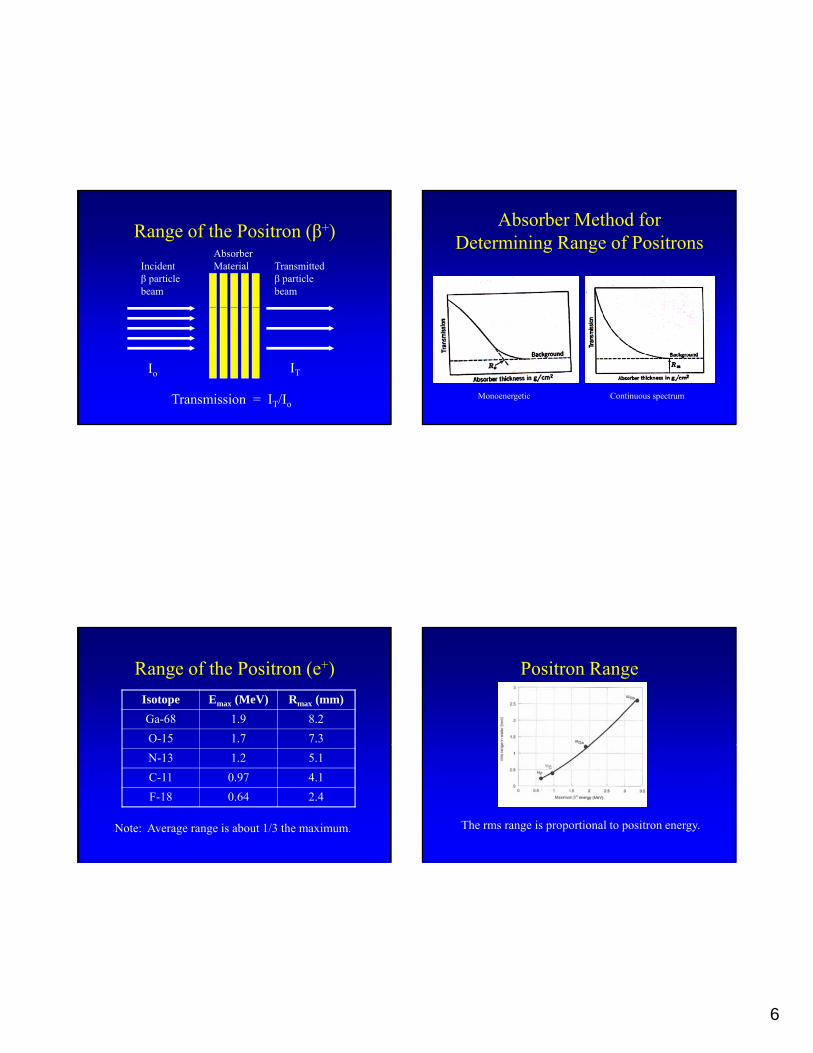
Range of the Positron (β+)
Incident β particlebeam
Transmitted β particlebeam
AbsorberMaterial
Io IT
Transmission = IT/Io
Absorber Method for Determining Range of Positrons
Monoenergetic Continuous spectrum
Range of the Positron (e+)Isotope Emax (MeV) Rmax (mm)Ga-68 1.9 8.2O-15 1.7 7.3
Note: Average range is about 1/3 the maximum.
N-13 1.2 5.1C-11 0.97 4.1F-18 0.64 2.4
Positron Range
The rms range is proportional to positron energy.
7
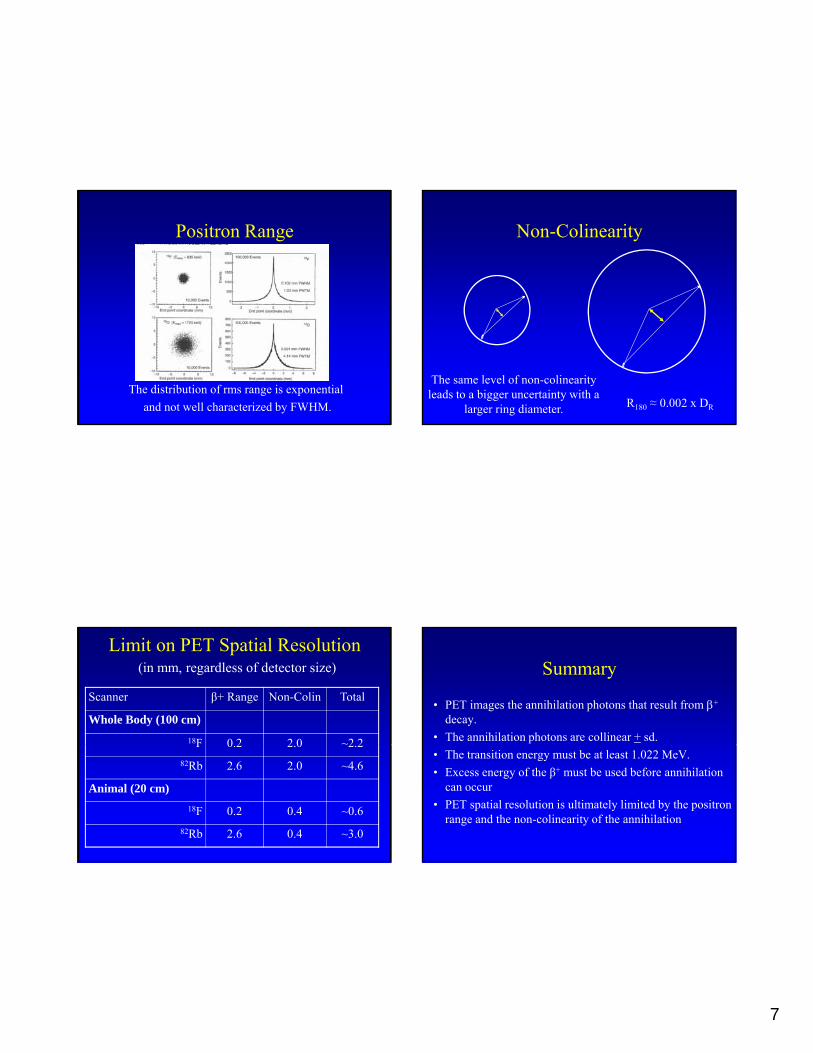
Positron Range
The distribution of rms range is exponentialand not well characterized by FWHM.
Non-Colinearity
The same level of non-colinearity leads to a bigger uncertainty with a
larger ring diameter. R180 ≈ 0.002 x DR
Limit on PET Spatial Resolution(in mm, regardless of detector size)
Scanner β+ Range Non-Colin Total
Whole Body (100 cm)18F 0 2 2 0 ~2 2F 0.2 2.0 2.2
82Rb 2.6 2.0 ~4.6
Animal (20 cm)18F 0.2 0.4 ~0.6
82Rb 2.6 0.4 ~3.0
Summary
• PET images the annihilation photons that result from β+
decay.• The annihilation photons are collinear + sd.• The transition energy must be at least 1.022 MeV.• Excess energy of the β+ must be used before annihilation
can occur• PET spatial resolution is ultimately limited by the positron
range and the non-colinearity of the annihilation
8
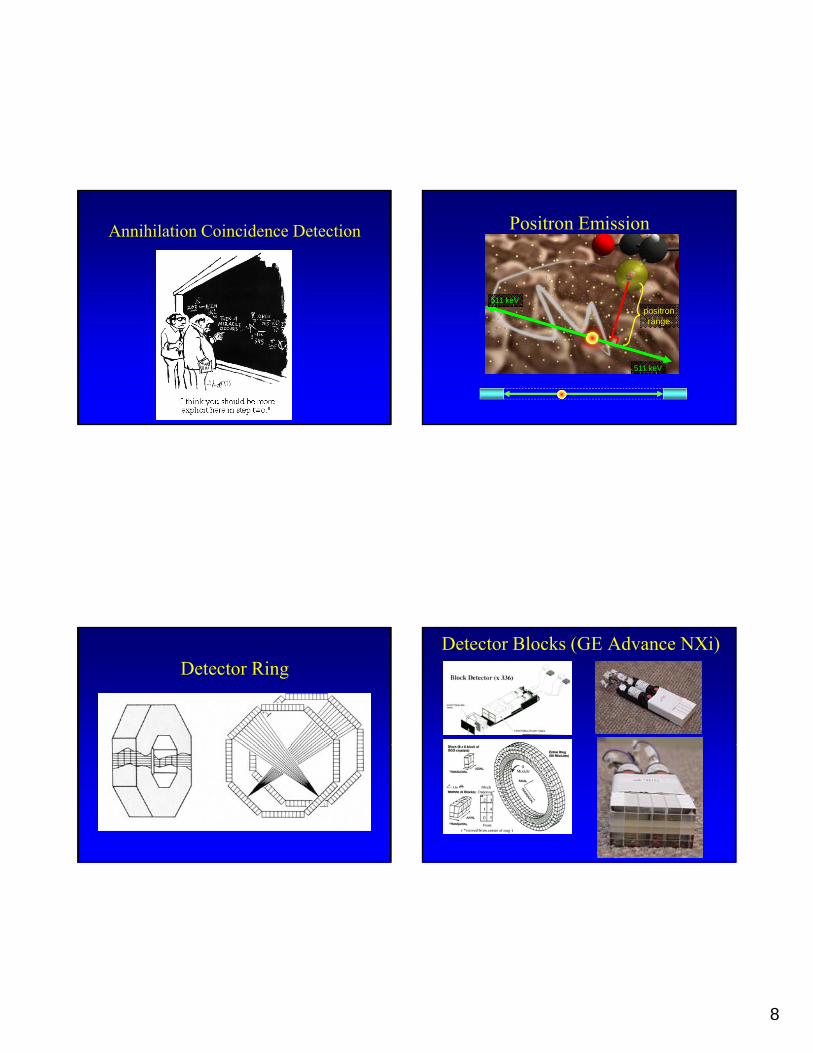
Annihilation Coincidence Detection Positron Emission
511 keVpositron range
511 keV
Detector RingDetector Blocks (GE Advance NXi)

9
PET SinogramsPoint Source Brain
PET Sinograms
45o
-5o
-90o
Sinogram
Ang
le
Projection View
Image for Each Slice
A
Image for Each Angle
Note: Sinograms and projection views are different ways or showing the same data.
10
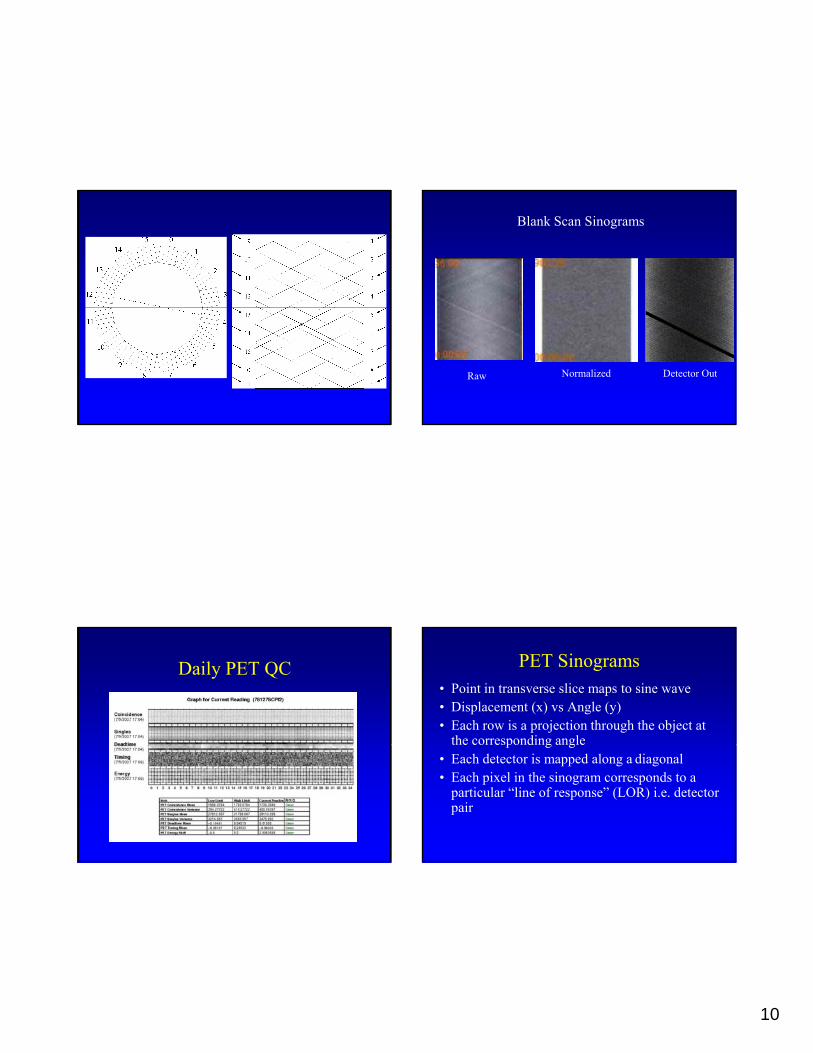
Blank Scan Sinograms
Raw Normalized Detector Out
Daily PET QC PET Sinograms• Point in transverse slice maps to sine wave• Displacement (x) vs Angle (y)• Each row is a projection through the object at
the corresponding anglet e co espo d g a g e• Each detector is mapped along a diagonal• Each pixel in the sinogram corresponds to a
particular “line of response” (LOR) i.e. detector pair
11
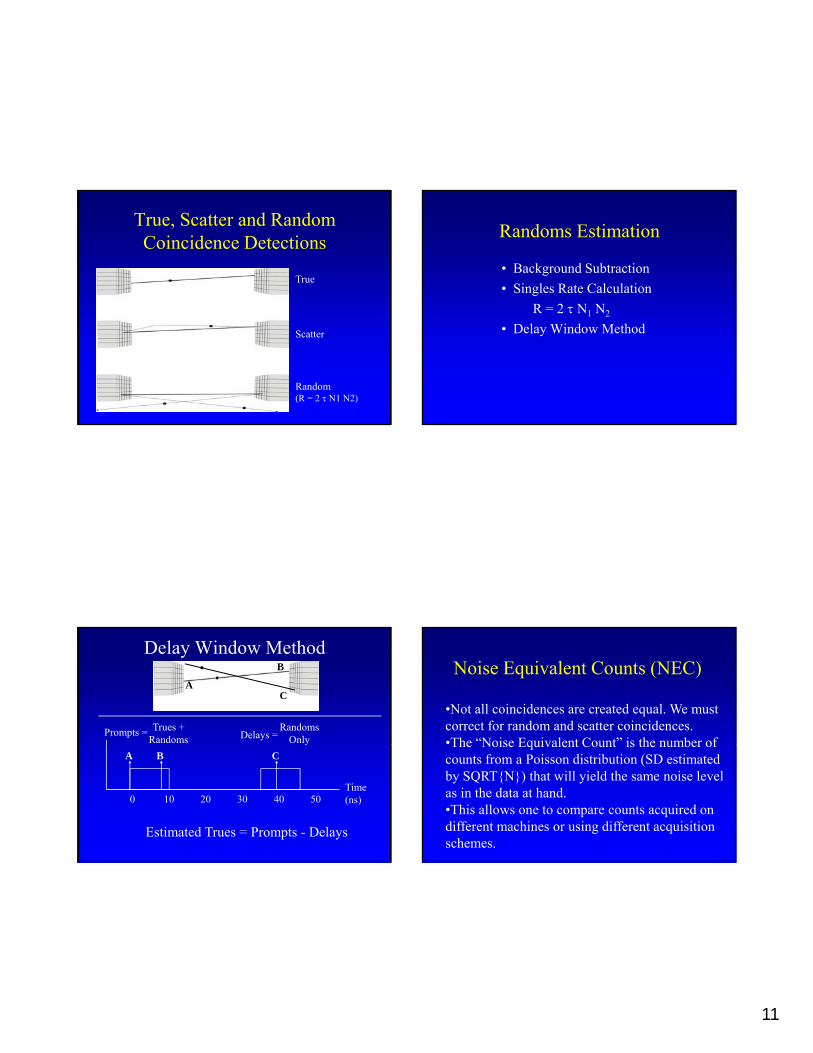
True, Scatter and Random Coincidence Detections
True
Random
Scatter
(R = 2 τ N1 N2)
Randoms Estimation
• Background Subtraction• Singles Rate Calculation
R = 2 τ N NR = 2 τ N1 N2
• Delay Window Method
Delay Window Method
A
B
C
Trues +Randoms
RandomsOnly
Prompts = Delays =
Time(ns)0 10 20 30 40 50
A B Cy
Estimated Trues = Prompts - Delays
Noise Equivalent Counts (NEC)
•Not all coincidences are created equal. We must correct for random and scatter coincidences.•The “Noise Equivalent Count” is the number ofThe Noise Equivalent Count is the number of counts from a Poisson distribution (SD estimated by SQRT{N}) that will yield the same noise level as in the data at hand.•This allows one to compare counts acquired on different machines or using different acquisition schemes.

12
Noise Equivalent Counts (NEC)
NEC = _________T_______1 + k R/T + S/T
Wh T i TWhere T is True countsR is Random countsS is Scattered counts
k = 1 if singles rates calculation and 2 if delayed subtraction method
Scatter Fraction, Count Rate and Randoms Measurement
600000 0
800000.0
1000000.0
1200000.0
s
Total
True
0.0
200000.0
400000.0
600000.0
0 5 10 15
Act Conc (uCi/mL)
cp
TrueRandom
NEC
Direct
Cross
Span of 3 Michelogram
18 * * * *17 * * * * *16 * * * * * *15 * * * * * * *14 * * * * * * *13 * * * * * * *12 * * * * * * *11 * * * * * * *10 * * * * * * *
9 * * * * * * *8 * * * * * * *8
7 * * * * * * *6 * * * * * * *5 * * * * * * *4 * * * * * * *3 * * * * * *2 * * * * *1 * * * *
1 2 3 4 5 6 7 8 9 10 11 12 13 14 15 16 17 18
Span of 7 Michelogram
13
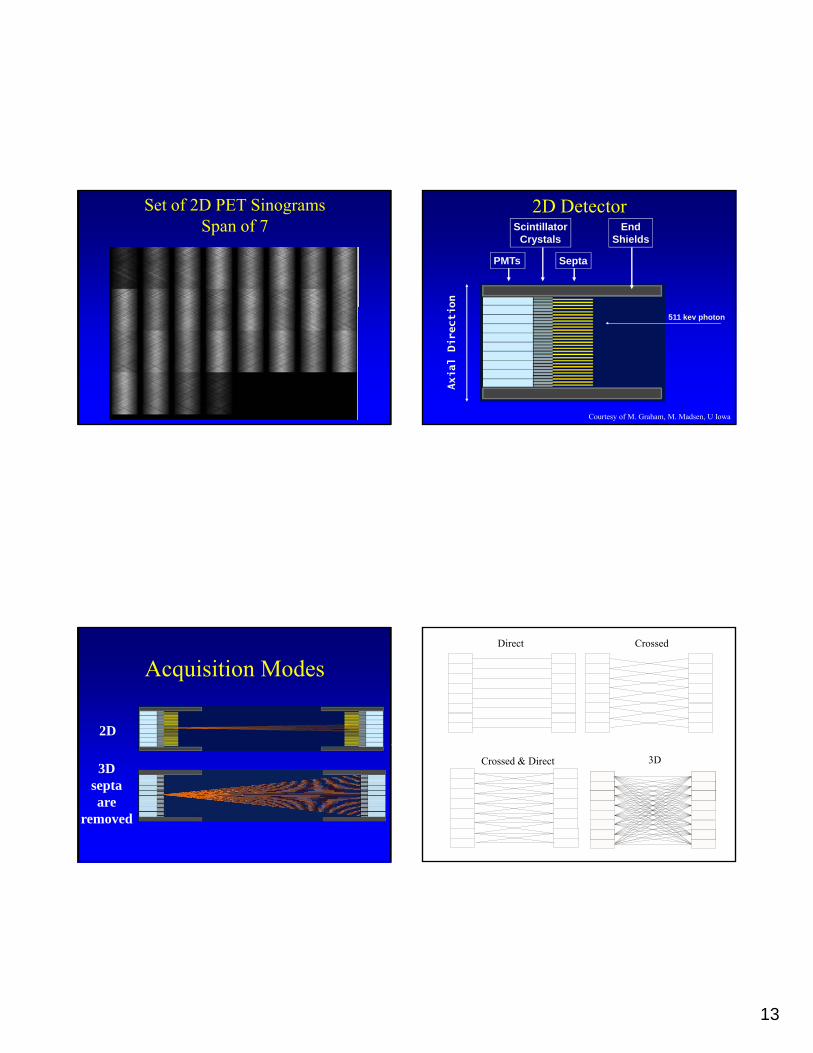
Set of 2D PET SinogramsSpan of 7
2D Detector
PMTs
ScintillatorCrystals
Septa
EndShields
on
511 kev photon
Axial Directio
Courtesy of M. Graham, M. Madsen, U Iowa
Acquisition Modes
2D
3Dseptaare
removed
Direct Crossed
Crossed & Direct 3D
14
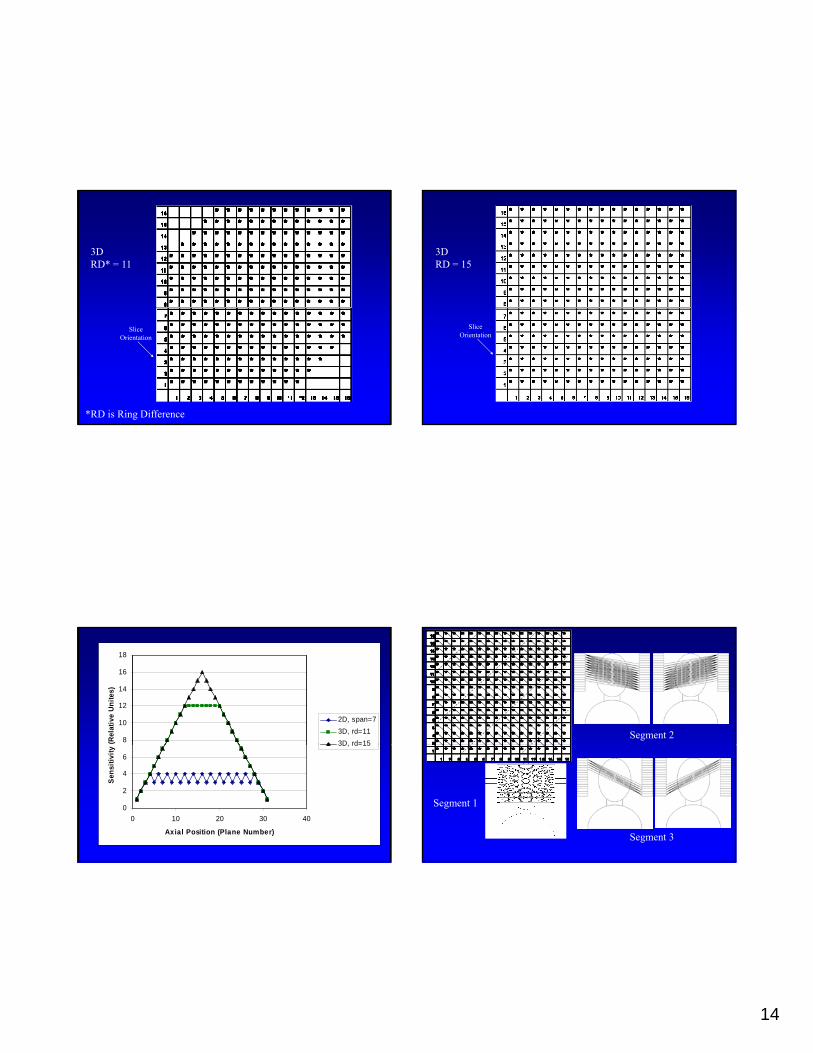
3DRD* = 11
SliceOrientation
*RD is Ring Difference
3DRD = 15
SliceOrientation
8
10
12
14
16
18
(Rel
ativ
e U
nite
s)
2D, span=73D, rd=113D rd=15
0
2
4
6
0 10 20 30 40
Axial Position (Plane Number)
Sens
itivi
ty 3D, rd 15
Segment 2
Segment 1
Segment 3
15
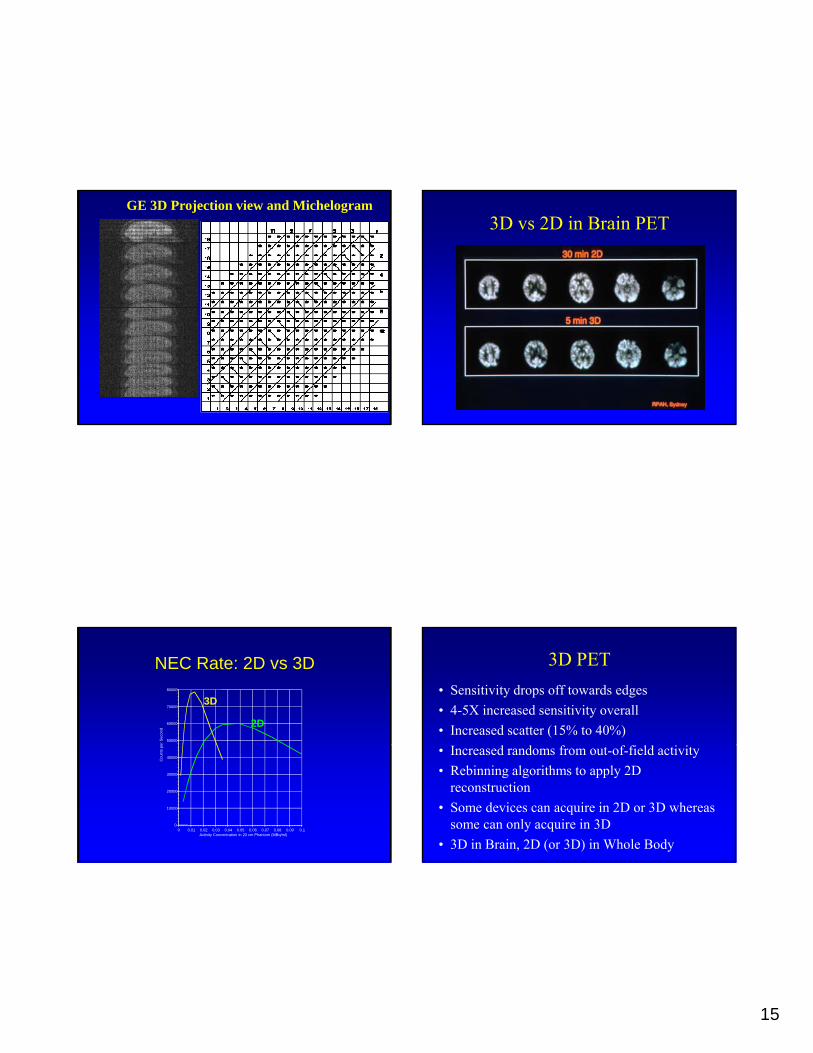
GE 3D Projection view and Michelogram3D vs 2D in Brain PET
NEC Rate: 2D vs 3D
50000
60000
70000
80000
er S
econ
d
3D
2D
0
10000
20000
30000
40000
0 0.01 0.02 0.03 0.04 0.05 0.06 0.07 0.08 0.09 0.1
Cou
nts
pe
Activity Concentration in 20 cm Phantom (MBq/ml)
3D PET• Sensitivity drops off towards edges • 4-5X increased sensitivity overall• Increased scatter (15% to 40%)• Increased randoms from out-of-field activity• Rebinning algorithms to apply 2D
reconstruction• Some devices can acquire in 2D or 3D whereas
some can only acquire in 3D• 3D in Brain, 2D (or 3D) in Whole Body
16
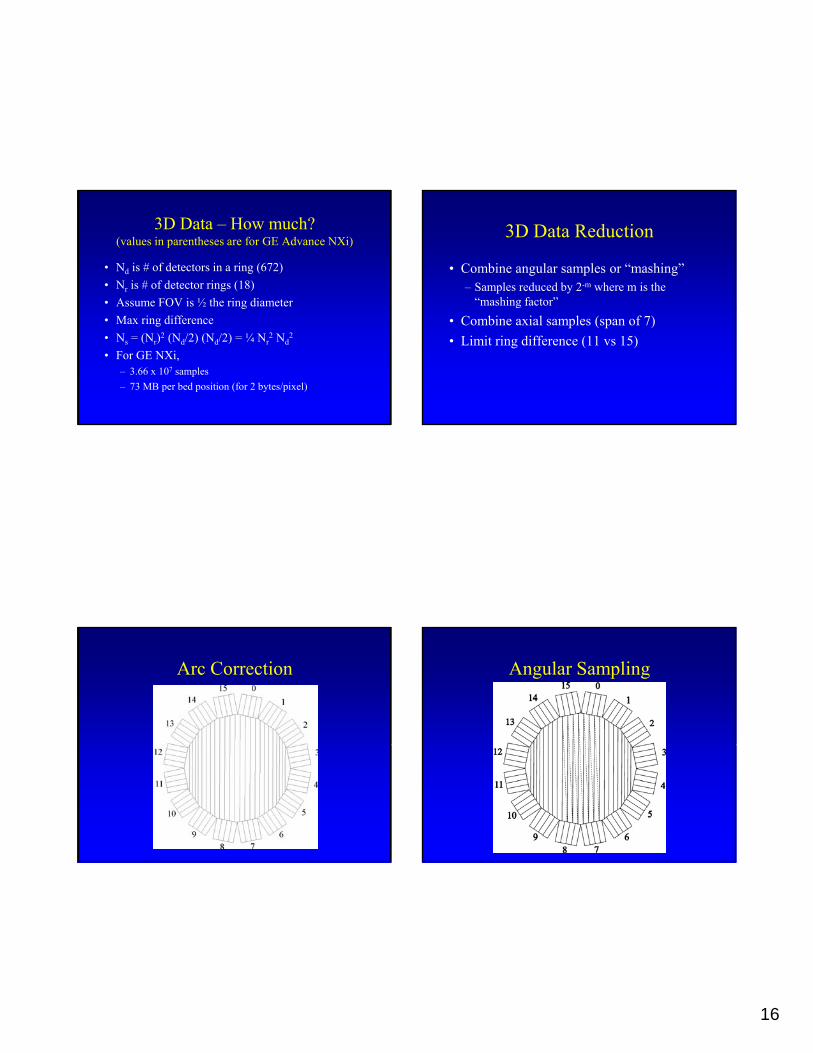
3D Data – How much?(values in parentheses are for GE Advance NXi)
• Nd is # of detectors in a ring (672)• Nr is # of detector rings (18)• Assume FOV is ½ the ring diameterg• Max ring difference• Ns = (Nr)2 (Nd/2) (Nd/2) = ¼ Nr
2 Nd2
• For GE NXi, – 3.66 x 10⁷ samples– 73 MB per bed position (for 2 bytes/pixel)
3D Data Reduction
• Combine angular samples or “mashing”– Samples reduced by 2-m where m is the
“mashing factor”g• Combine axial samples (span of 7)• Limit ring difference (11 vs 15)
Arc Correction Angular Sampling

17
Angular Sampling
• Interleaved rows combined into one rowinto one row
• Doubles transverse sampling• Halves angular sampling• Slight angular error
X X X X X X X X X X X X X X X X XX X X X X X X X X X X X X X X X
Interleaved Sinogram
Criteria for Scintillation Material• Detection Efficiency (Stopping Power)
– High Effective Z– High Density
• Light Outputg p– Good energy resolution– Good crystal identification
• Decay Time– Reduction of random coincidences– Time-of-Flight PET
Crystal IdentificationSCINTILLATOR NaI(Tl) BGO LSO GSO
Rel. Light Output 100 15-20 75 20-25
Peak Wavelength (nm) 410 480 420 440
Decay Constant (ns) 230 300 12,42 30-60
New Detector Materials
Density (g/mL) 3.67 7.13 7.40 6.71
Effective Z 51 75 66 59
Index of Refraction 1.85 2.15 1.82 1.85
Hygroscopic ? Yes No No No
18
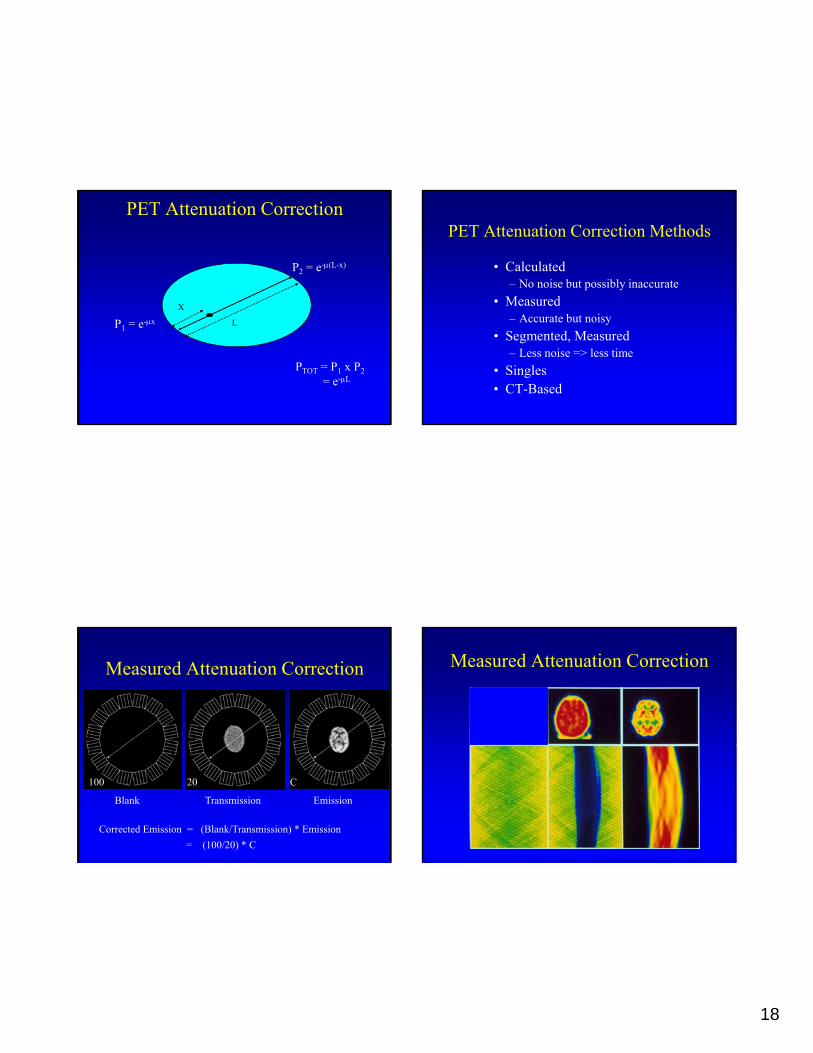
PET Attenuation Correction
X
P2 = e-μ(L-x)
L
X
P1 = e-μx
PTOT = P1 x P2= e-μL
PET Attenuation Correction Methods
• Calculated – No noise but possibly inaccurate
• Measured – Accurate but noisy
• Segmented, Measured – Less noise => less time
• Singles• CT-Based
Measured Attenuation Correction
Blank Transmission Emission
100 20 C
Corrected Emission = (Blank/Transmission) * Emission= (100/20) * C
Measured Attenuation Correction
19
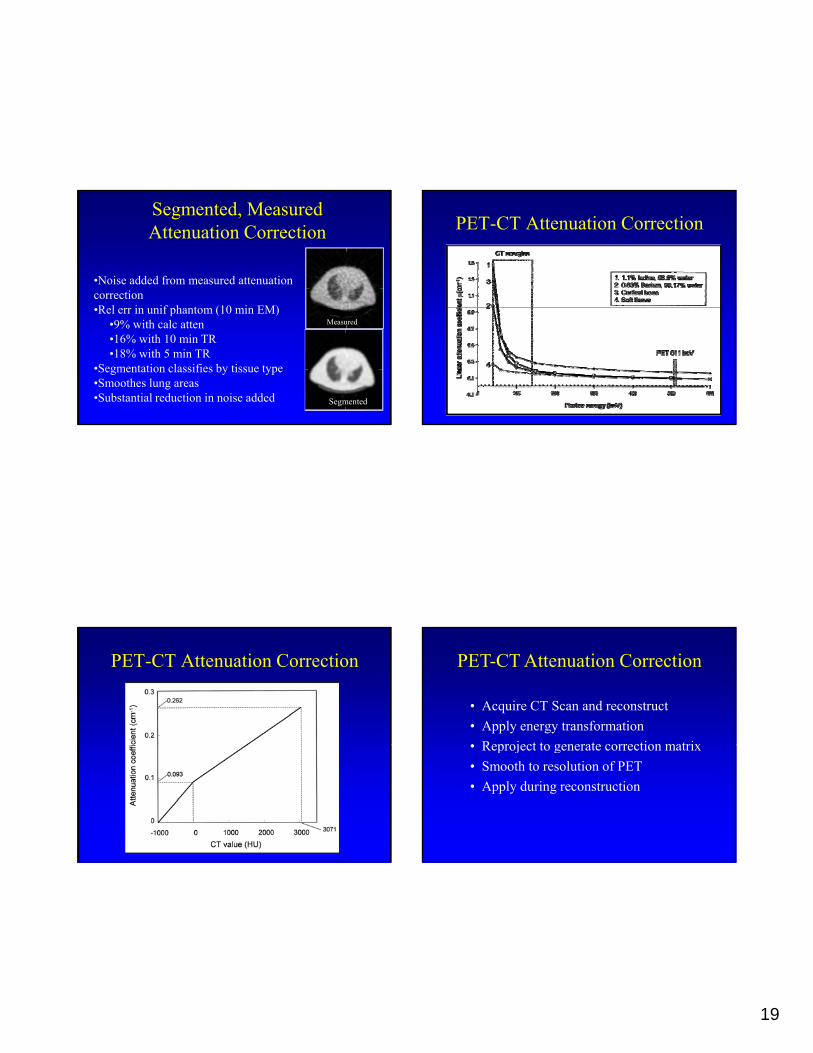
Segmented, Measured Attenuation Correction
•Noise added from measured attenuation correctionR l i if h t (10 i EM)•Rel err in unif phantom (10 min EM)
•9% with calc atten•16% with 10 min TR•18% with 5 min TR
•Segmentation classifies by tissue type•Smoothes lung areas•Substantial reduction in noise added
Measured
Segmented
PET-CT Attenuation Correction
PET-CT Attenuation Correction PET-CT Attenuation Correction
• Acquire CT Scan and reconstruct• Apply energy transformation• Reproject to generate correction matrix• Reproject to generate correction matrix• Smooth to resolution of PET• Apply during reconstruction
20
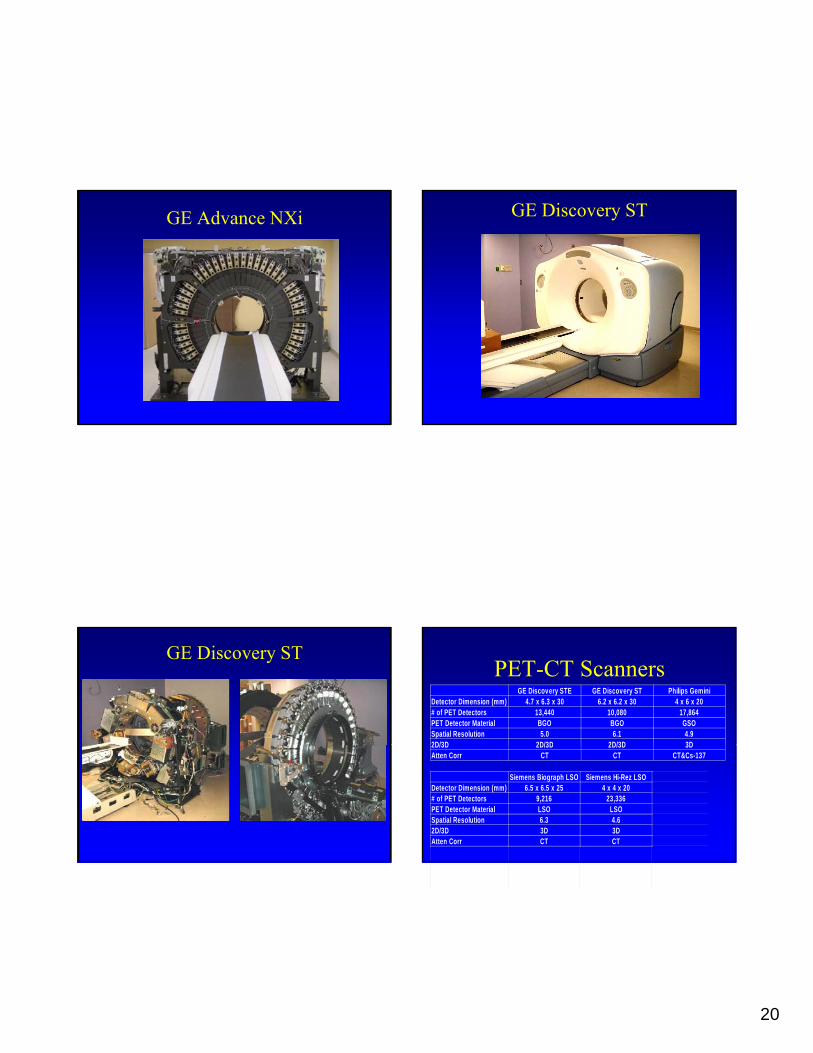
GE Advance NXi GE Discovery ST
GE Discovery ST
CT PET
PET-CT ScannersGE Discovery STE GE Discovery ST Philips Gemini
Detector Dimension (mm) 4.7 x 6.3 x 30 6.2 x 6.2 x 30 4 x 6 x 20# of PET Detectors 13,440 10,080 17,864PET Detector Material BGO BGO GSOSpatial Resolution 5.0 6.1 4.92D/3D 2D/3D 2D/3D 3D2D/3D 2D/3D 2D/3D 3DAtten Corr CT CT CT&Cs-137
Siemens Biograph LSO Siemens Hi-Rez LSODetector Dimension (mm) 6.5 x 6.5 x 25 4 x 4 x 20# of PET Detectors 9,216 23,336PET Detector Material LSO LSOSpatial Resolution 6.3 4.62D/3D 3D 3DAtten Corr CT CT
21
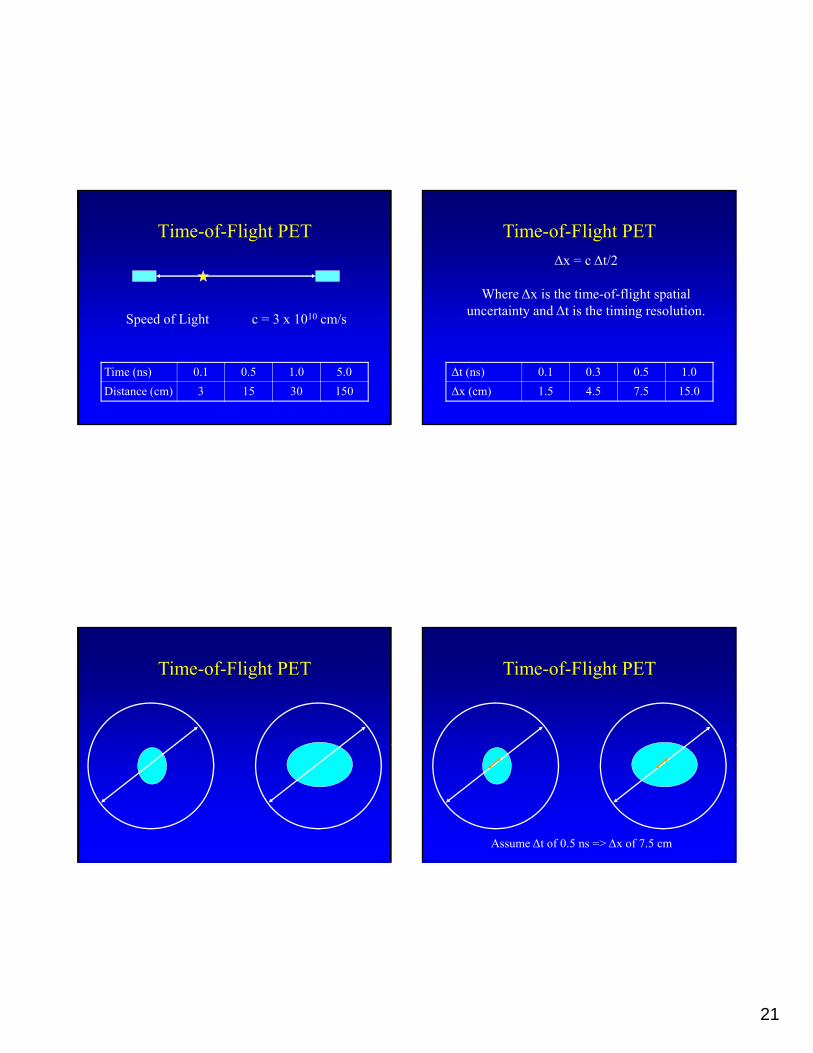
Time-of-Flight PET
Speed of Light c = 3 x 1010 cm/s
Time (ns) 0.1 0.5 1.0 5.0Distance (cm) 3 15 30 150
Time-of-Flight PETΔx = c Δt/2
Where Δx is the time-of-flight spatial t i t dΔt i th ti i l tiuncertainty and Δt is the timing resolution.
Δt (ns) 0.1 0.3 0.5 1.0Δx (cm) 1.5 4.5 7.5 15.0
Time-of-Flight PET Time-of-Flight PET
Assume Δt of 0.5 ns => Δx of 7.5 cm
22
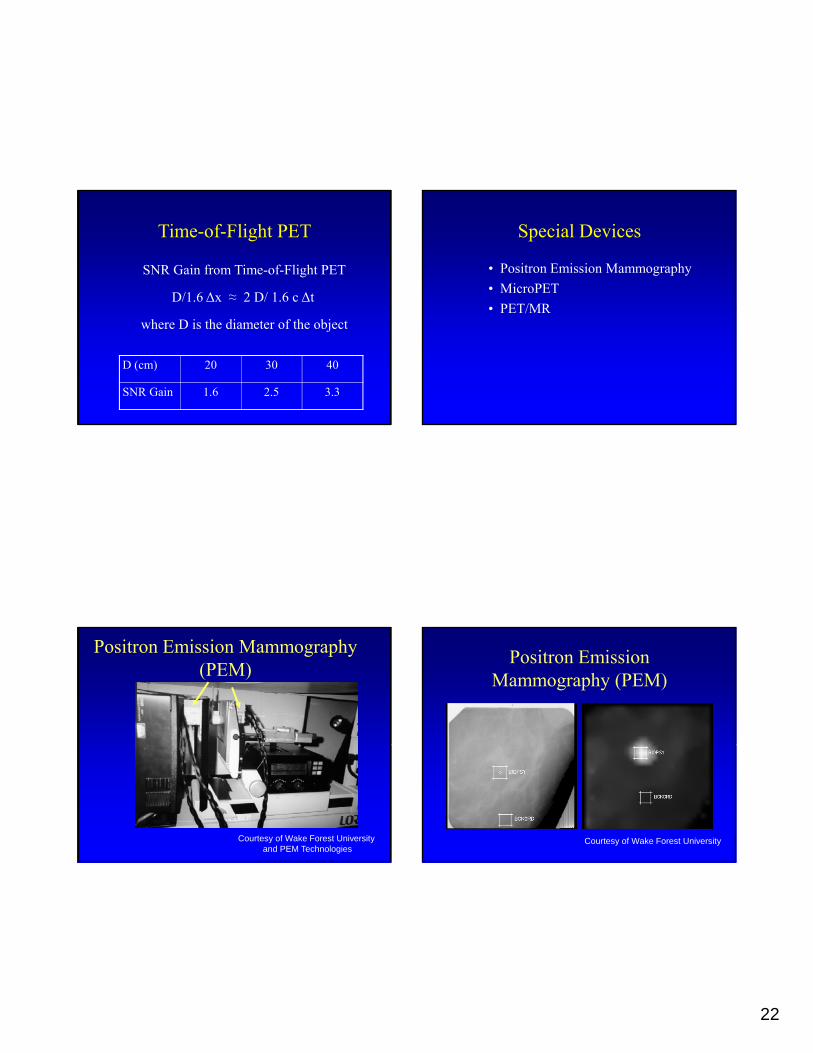
Time-of-Flight PET
SNR Gain from Time-of-Flight PET
D/1.6 Δx ≈ 2 D/ 1.6 c Δt
where D is the diameter of the object
D (cm) 20 30 40
SNR Gain 1.6 2.5 3.3
Special Devices
• Positron Emission Mammography• MicroPET• PET/MR• PET/MR
Positron Emission Mammography (PEM)
Courtesy of Wake Forest Universityand PEM Technologies
Positron Emission Mammography (PEM)
Courtesy of Wake Forest University
23
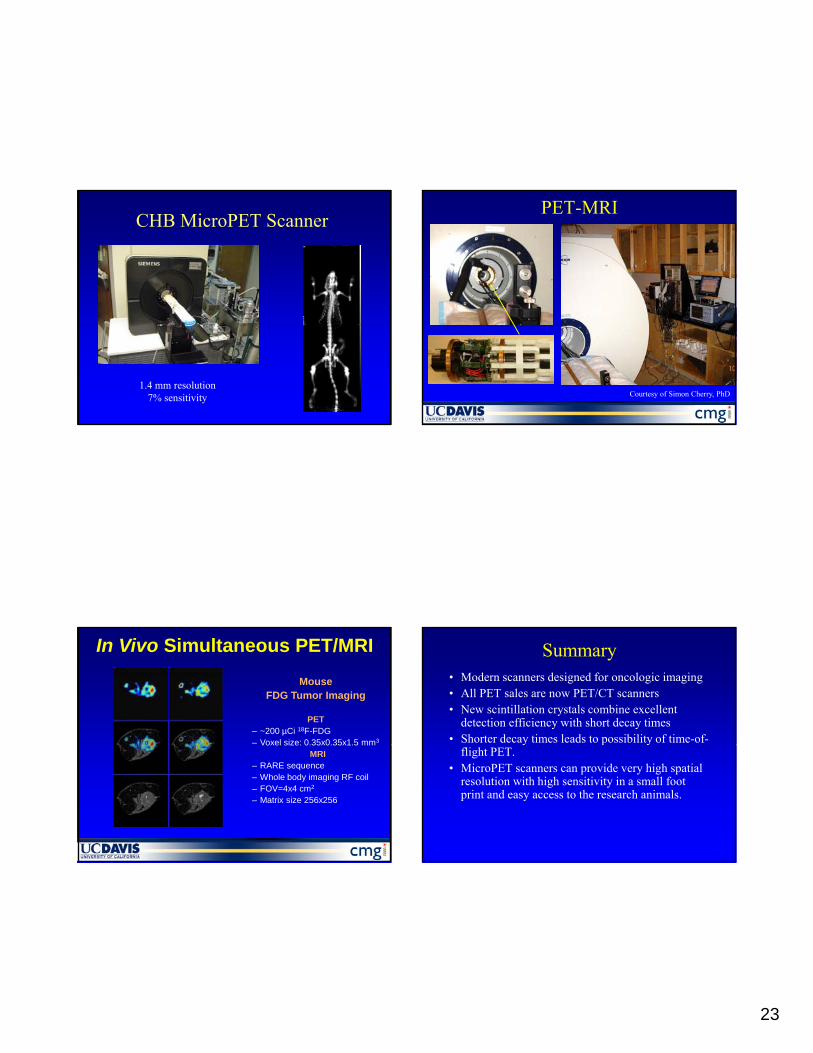
CHB MicroPET Scanner
1.4 mm resolution7% sensitivity
PET-MRI
RF coilGradient set
PET insert
Courtesy of Simon Cherry, PhD
In Vivo Simultaneous PET/MRIMouse
FDG Tumor Imaging
PET– ~200 µCi 18F-FDG– Voxel size: 0.35x0.35x1.5 mm3Voxel size: 0.35x0.35x1.5 mm
MRI– RARE sequence– Whole body imaging RF coil– FOV=4x4 cm2
– Matrix size 256x256
Summary• Modern scanners designed for oncologic imaging• All PET sales are now PET/CT scanners• New scintillation crystals combine excellent
detection efficiency with short decay times• Shorter decay times leads to possibility of time-of-y p y
flight PET.• MicroPET scanners can provide very high spatial
resolution with high sensitivity in a small foot print and easy access to the research animals.
24