Outline of Lecture Sessions Regarding Prejudice and Discrimination Definition of the concepts of...
128
Outline of Lecture Sessions Regarding Prejudice and Discrimination Definition of the concepts of prejudice and discrimination.
-
Upload
dwain-rich -
Category
Documents
-
view
215 -
download
0
Transcript of Outline of Lecture Sessions Regarding Prejudice and Discrimination Definition of the concepts of...

Outline of Lecture Sessions Regarding Prejudice and Discrimination
Definition of the concepts of prejudiceand discrimination.

Prejudice: A negative prejudgement of a group and its individual members. Prejudice is an attitude..

Prejudice: A negative prejudgement of a group and its individual members. Prejudice is an attitude..
Stereotype: A belief about the personal attributes of a group of people.

Prejudice: A negative prejudgement of a group and its individual members. Prejudice is an attitude..
Stereotype: A belief about the personal attributes of a group of people.
Discrimination: Unjustifiable negative behaviour toward a group or its members.

Attribute prejudice and discrimination to thoughts and acts of stupidity or immorality
Jackie Robinson, Branch Rickey, baseball, and the Kiwanis Music Festival in Montreal, 1946.
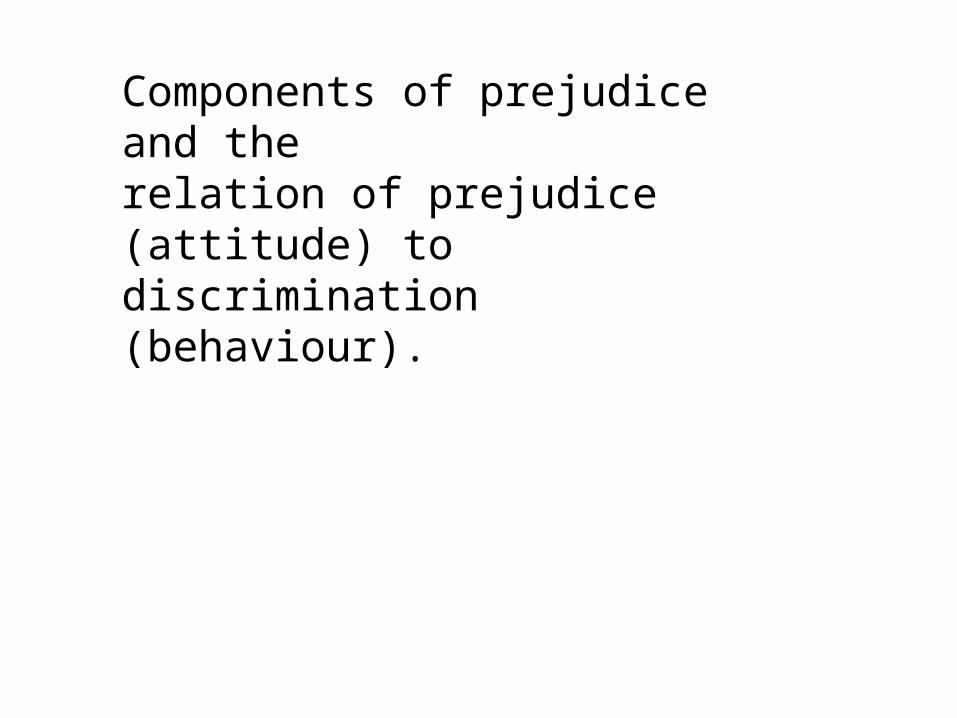
Components of prejudice and therelation of prejudice (attitude) todiscrimination (behaviour).

Prejudice as an Attitude
Components of prejudice (attitude)
1. Beliefs (may include stereotypes)
2. Emotions
3. Intended actions

The question of the relation of prejudice (as attitude) to discrimination (as behaviour)

By definition, a positive attitude toward your group is not prejudice.
Should we be concerned, nevertheless
(and the role of social identity theory).

neutral unfavourable: ____________________________________:favourable
Attitudes Towards Ingroup and Outgroup
Outgroup Ingroup

neutral unfavourable: ____________________________________:favourable
Attitudes Towards Ingroup and Outgroup
Outgroup Outgroup Ingroup

The Power of Ingroup Favouritism
Majeed(1982)
Participants: 13 to 18 years old from a rural district of India.

Trait Adjective Ratings
Ingroup OutGroup
High Caste Adolescents
Low Caste

Trait Adjective Ratings
Ingroup OutGroup
High Caste Adolescents 8.5
Low Caste 4.6

Trait Adjective Ratings
Ingroup OutGroup
High Caste Adolescents 8.5 -1.8
Low Caste 4.6

Trait Adjective Ratings
Ingroup OutGroup
High Caste Adolescents 8.5 -1.8
Low Caste 4.6 3.5
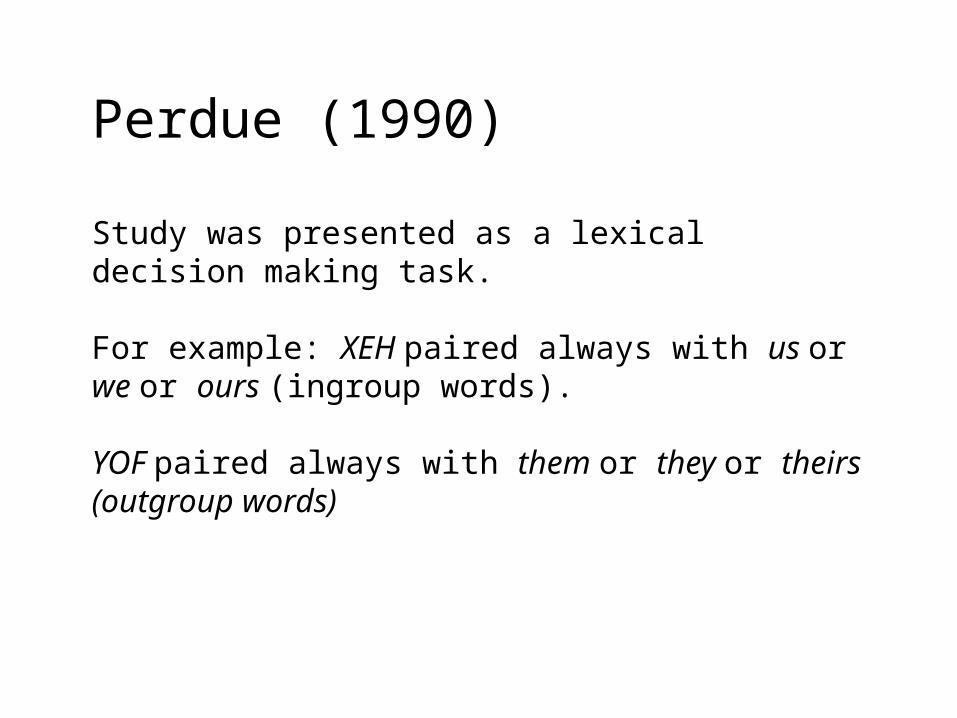
Perdue (1990)
Study was presented as a lexical decision making task.
For example: XEH paired always with us or we or ours (ingroup words).
YOF paired always with them or they or theirs (outgroup words)

Participants were asked to rate the nonsense syllables on:
Unpleasant : : : : : : : : pleasant
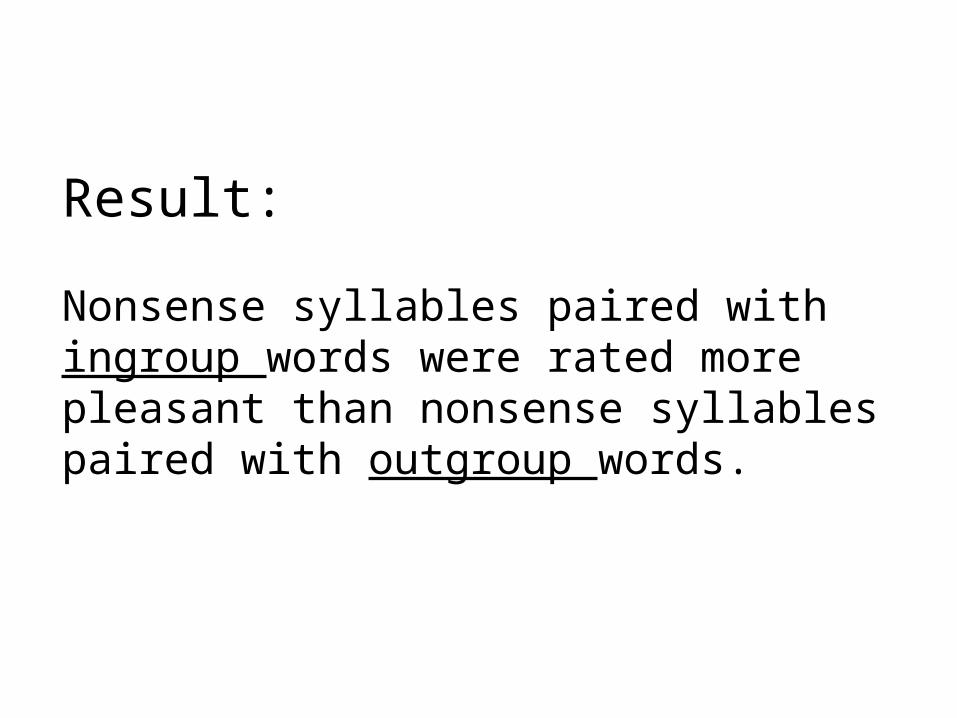
Result:
Nonsense syllables paired with ingroup words were rated more pleasant than nonsense syllables paired with outgroup words.

A study of systemic (institutional)discrimination.

Report of the Commission on Systemic Racism in the Ontario Criminal Justice System
Community Summary
(1995)
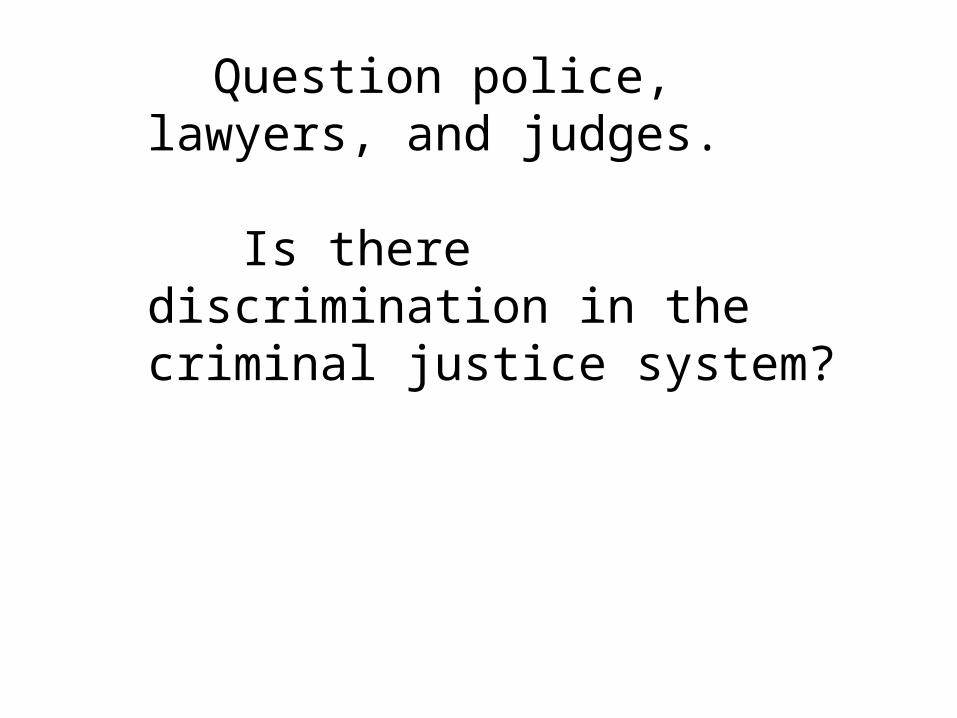
Question police, lawyers, and judges.
Is there discrimination in the criminal justice system?

General Response was No.

Archival data (public records:

a) Release and detained data for total sample
Released by police: White -- 29% Black -- 18%
Detained to trial: White -- 23% Black -- 30%

b) Release and detained data for drug charges only
Released by police: White -- 60% Black -- 30%
Detained to trial: White -- 10% Black -- 31%
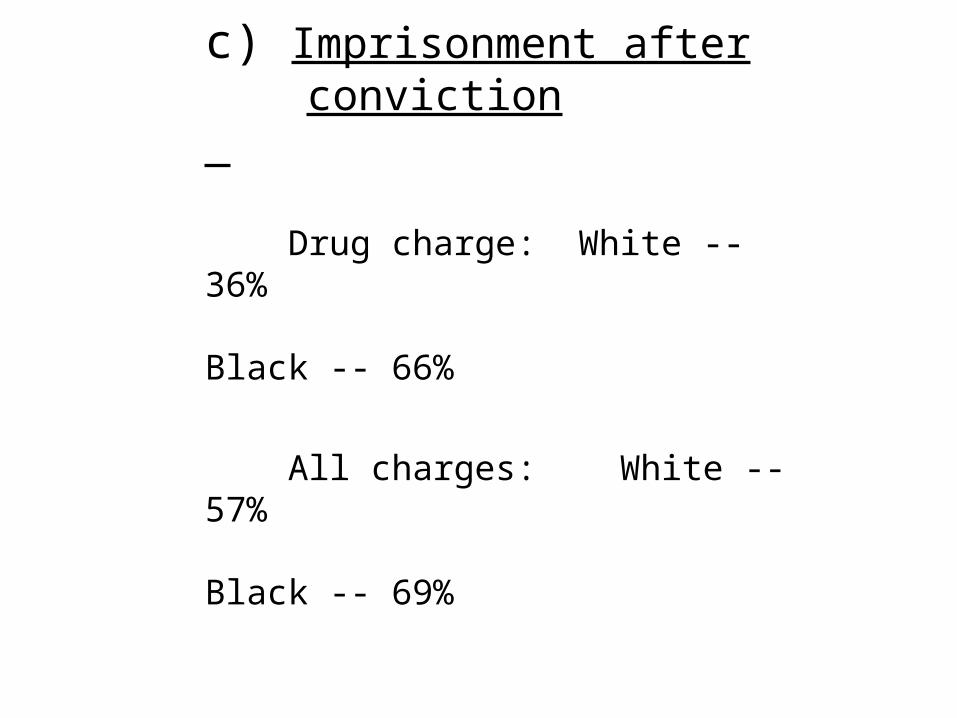
c) Imprisonment after conviction
Drug charge: White -- 36% Black -- 66%
All charges: White -- 57% Black -- 69%
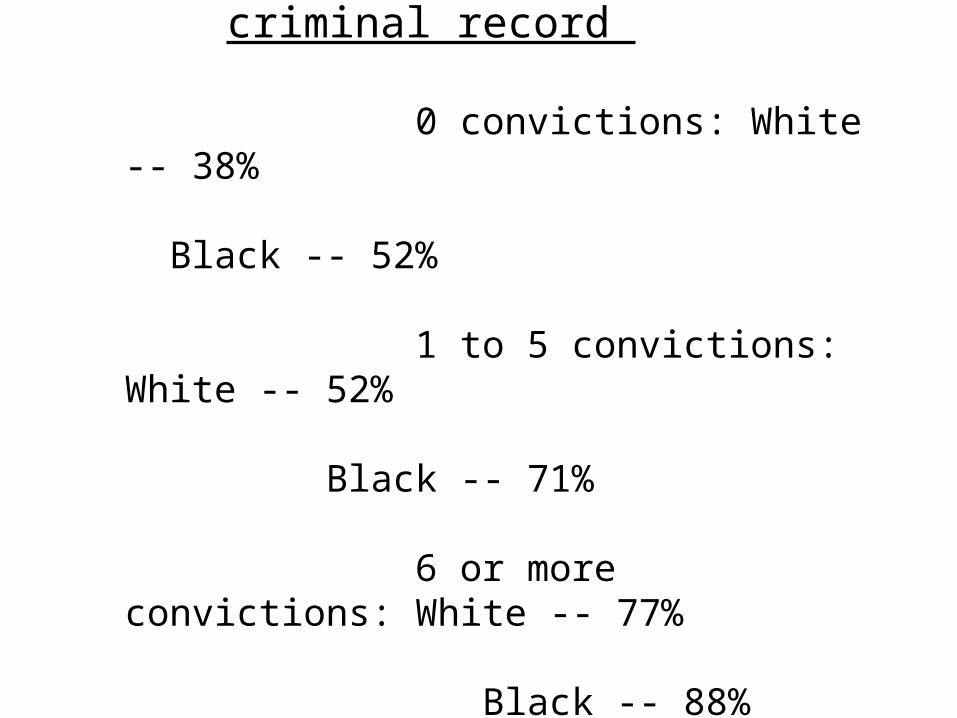
d) Imprisonment after conviction by criminal record
0 convictions: White -- 38% Black -- 52%
1 to 5 convictions: White -- 52% Black -- 71% 6 or more convictions: White -- 77% Black -- 88%
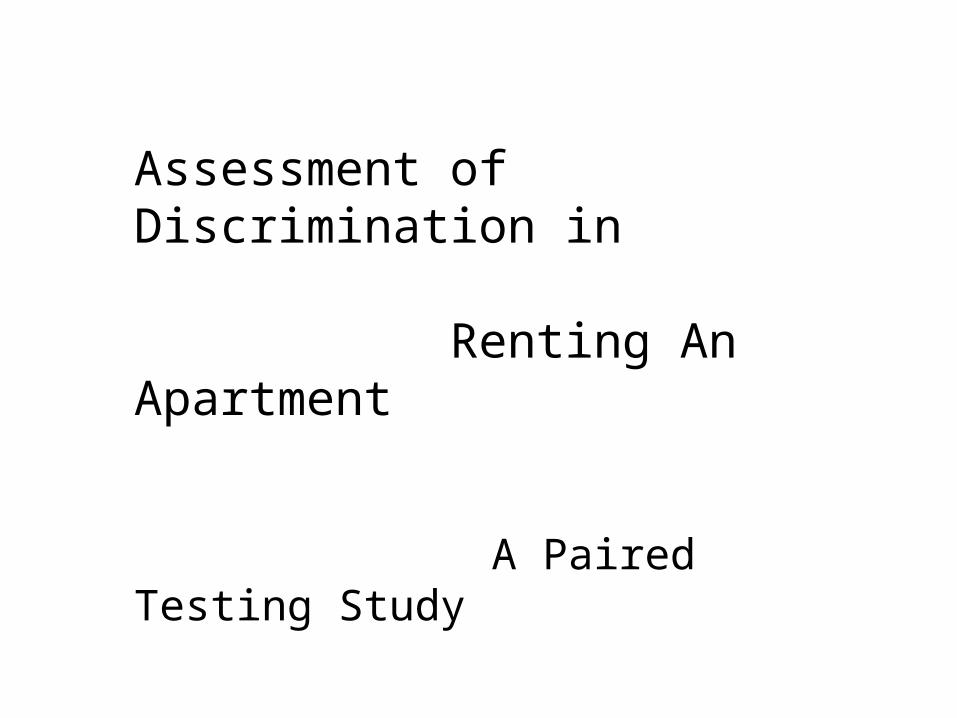
Assessment of Discrimination in
Renting An Apartment
A Paired Testing Study
Toronto, 2009

The first profile portrayed over the telephone was:
1. Female lone parent with one child
The control in all cases was a married female.
Both were applying for a one bedroom apartment.
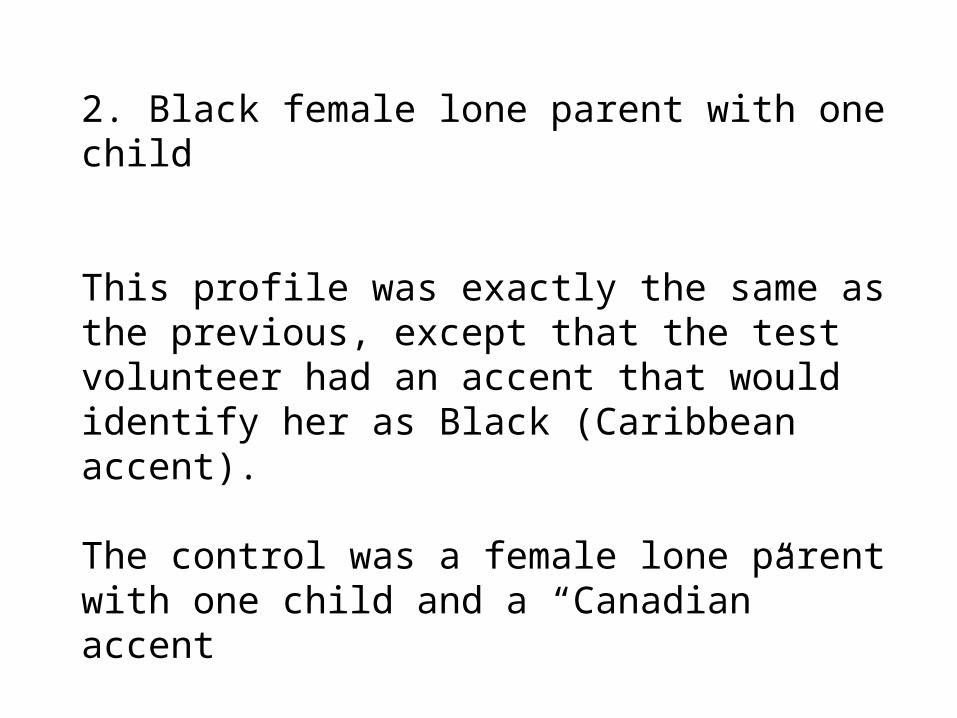
2. Black female lone parent with one child
This profile was exactly the same as the previous, except that the test volunteer had an accent that would identify her as Black (Caribbean accent).
The control was a female lone parent with one child and a “Canadian” accent

3. Single South Asian male
For this profile, the person had an identifiable South Asian accent and name.
Control was a single male with a “Canadian” accent and name.

Analysis
Once the completed scripts were collected, researchers scored the responses by the person on the other end of the phone based on whether the interaction profiles indicated positive, negative or no differential treatment.

Rate of Discrimination (Score of 2 or 3 on
Differential Treatment Scale)
Lone Parent 14%
Black Lone Parent 26%
South Asian Male 23%

Research by Esses
On the individual contribution of three components of attitude to the overall attitude we have toward some group.

The Components Studied Were:
i) stereotypes,
ii) emotions,
and an added component
iii) beliefs about the degree to which somegroup facilitates or blocks your cherishedvalues in society
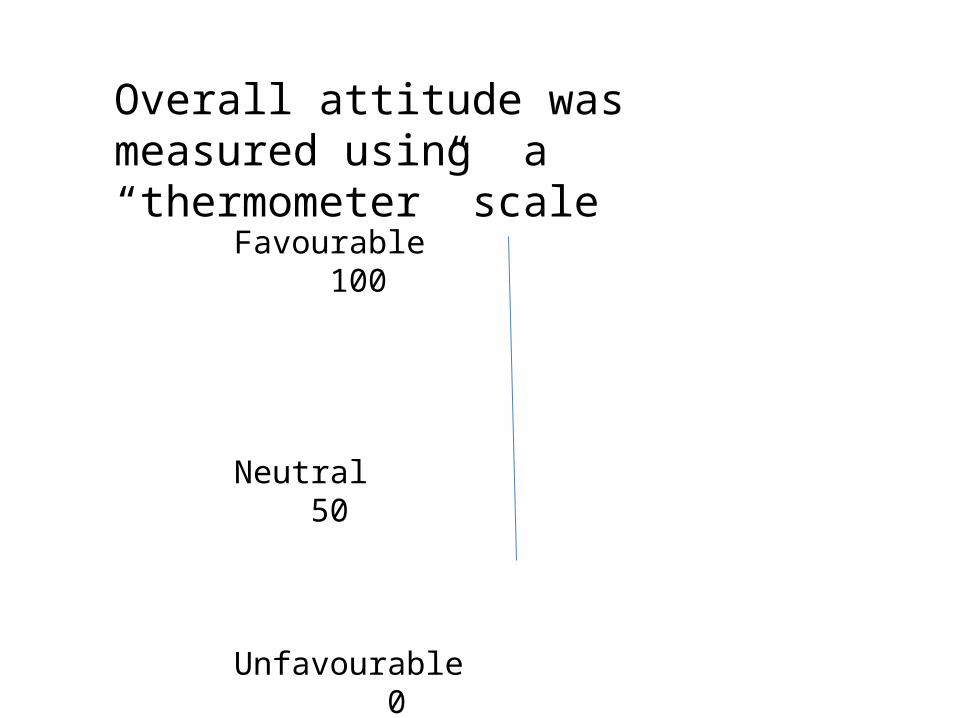
Overall attitude was measured using a “thermometer” scale
Favourable 100
Neutral 50
Unfavourable 0

Target groups studied
English CanadianFrench CanadianNative IndianPakistaniHomosexual

Components of Attitude towards Group
1. Measuring the Stereotype Component
On a blank piece of paper, list the characteristics that you would use to describe typical members of the group

Components of Attitude towards Group
1. Measuring the Stereotype Component
Indicate the value of each attribute:
if negative, indicate two minus signs or one minus sign;
if positive, indicate two plus signs or one plus sign;
if neutral indicate zero

Components of Attitude towards Group
1. Measuring the Stereotype Component
Indicate the percentage of the group to which each characteristic applies (0% to 100%)

2. Measuring the Symbolic beliefs Component
List values, customs and traditions that you believe are blocked or facilitated by the group.
Indicate the extent to which each was blocked or facilitated:
if blocked, indicate two minus signs or one minus
sign;if facilitated, indicate two plus signs or one plus sign
Indicate the percentage of the group to which this applies (0% to 100%)

3. Emotions
List emotions and feelings that you experience when you see, meet, or think about members of the group.
Indicate the valence of each emotion: if negative, indicate two minus signs or one minus sign; if positive, indicate two plus signs or one plus sign
Indicate the percentage of the group that make you feel this way (0% to 100%)

Target group Mean Attitude (as measured on the thermometer scale
English Canadian 81.4
French Canadian 69.1
Native Indian 66.2
Pakistani 58.9
Homosexual 44.1

Stereotype with Attitude
Symbolic Beliefs with Attitude
Emotions with AttitudesTarget group
English Canadian
French Canadian
.11
.49***
.09
.49**
.25*
.59**
Native Indian .24* 17 .44***
Pakistani .30* .58*** .32**
Homosexual .48*** .50*** .43***
The Relations between Individual Stereotypes, Symbolic Beliefs, and Emotions with Attitudes toward the Groups

For Judgements about the Target Group "Pakistani," the Correlation Coefficient between the Symbolic Belief Component and Overall Attitude was +.58
Overall Attitude Symbolic Belief Score Score (0-100) (Higher the score, the more the group is seen to facilitate cherished values)
Subject 1 63 12 2 42 05 3 54 07 4 82 16 5 68 12 and so on

Which Components Contributed to the Prediction of Overall Attitude?
Target Group Component
English Canadians no component was a unique predictor

Which Components Contributed to the Prediction of Overall Attitude?
Target Group Component
French Canadians a) emotions and
b) symbolic beliefs were unique predictors

Which Components Contributed to the Prediction of Overall Attitude?
Target Group Component
Native Indians a) emotions were unique predictor

Which Components Contributed to the Prediction of Overall Attitude?
Target Group Component
Pakistanis a) symbolic beliefs was unique predictor

Which Components Contributed to the Prediction of Overall Attitude?
Target Group Component
Homosexuals a) symbolic beliefs was unique predictor
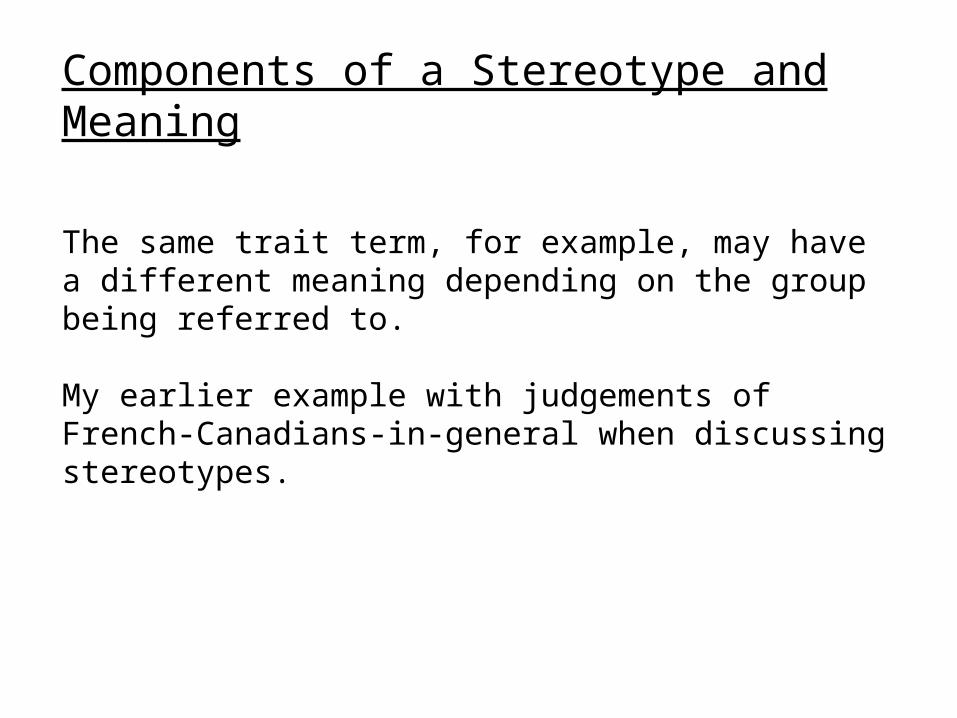
Components of a Stereotype and Meaning
The same trait term, for example, may have a different meaning depending on the group being referred to.
My earlier example with judgements of French-Canadians-in-general when discussing stereotypes.
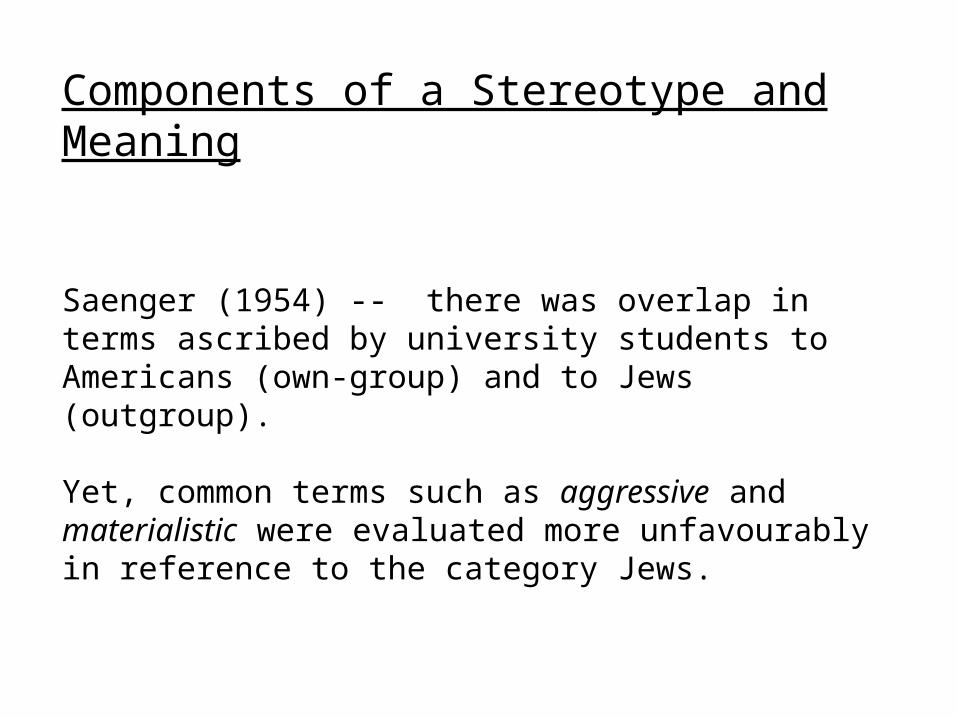
Components of a Stereotype and Meaning
Saenger (1954) -- there was overlap in terms ascribed by university students to Americans (own-group) and to Jews (outgroup).
Yet, common terms such as aggressive and materialistic were evaluated more unfavourably in reference to the category Jews.

Mood and Meaning of Components of a Stereotype
Victoria Esses (1995) found that the meaning of a term ascribed to a particular outgroup can vary with the mood of the individual making the judgements.
Mood was experimentally manipulated.
In a negative mood, the evaluations of terms associated with outgroups were more unfavourable.

The textbook considers the question do we stereotype in the context of its discussion of prejudice.
The textbook does not make any distinction between stereotypes and stereotyping.
Is stereotyping necessarily a product of prejudice and is it behaviour representing discrimination?

Page 455 of the textbook -- Do stereotypes bias judgements of individuals?
Their answer is Yes.
But, there are exceptions.

Example of An Exception
Information provided about Nancy or Paul concerning their assertive behaviour (information provided by supposed transcript of one of their telephone conversations).
Nancy or Paul speak about their recent behaviour in which they behaved assertively or non-assertively.
A day later, participants in the study predicted how Nancy or Paul would respond to other situations.
Their past behaviour influenced judgements about how they would behave, but their gender did not.

The textbook goes on to remind us of a principle discussed in Chapter 3.
Given general, base-rate information about a group and trivial, but vivid information about a particular member of the group, the vivid information is relied on more in subsequent judgements.
“People often hold expectations or stereotypes, but ignore them when given vivid information.”

On the other hand, the textbook indicates that strong stereotypes can matter.
Examples in text: regarding specific information about a group, males judged to be taller on average than females; females expected to be in nursing, males in engineering (even though specific information provided to participants did not indicate this).

Text conclusion: “When stereotypes are strong and the information about someone is ambiguous (unlike the cases of Nancy and Paul), stereotypes can subtly bias our judgements of others.”
The Textbook Also Indicates That
When we have “Little to go on but our stereotypes, we stereotype”

Bond, C.F., Jr., DiCandia, C.G., & MacKinnon, J.R. Responses to violence in a psychiatric setting: The role of patient’s race. Personality and Social Psychology Bulletin, 14, 448-458.
Using the archival method, 453 incidents of reactions by staff to violence by psychiatric adolescent patients were studied.
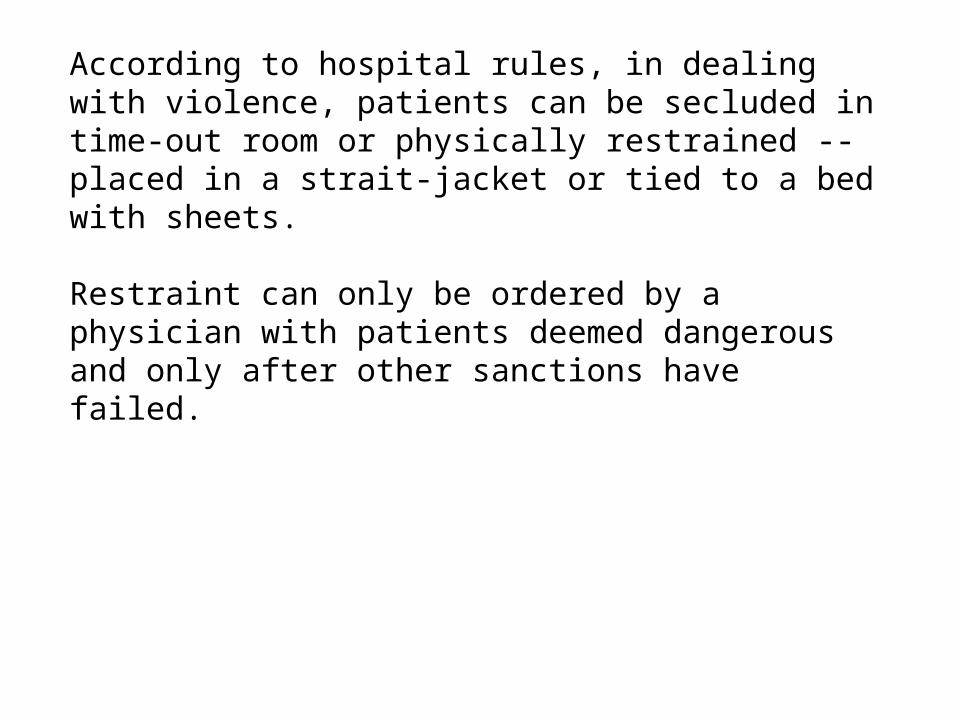
According to hospital rules, in dealing with violence, patients can be secluded in time-out room or physically restrained -- placed in a strait-jacket or tied to a bed with sheets.
Restraint can only be ordered by a physician with patients deemed dangerous and only after other sanctions have failed.

Data were based on nurses’ reports at the end of their shifts.
Concerning race, the nurses and aides were white. The patients in the analyses were white or black.
There were 83 restraint cases.

Results:
1. Although Black patients committed no greater number of violent offenses, they were nearly four times as likely to be restrained (but equally likely to be secluded).
2. On the other hand, Black patients were no more likely to have been diagnosed at the outset as violent or aggressive.
But this is not the whole story when decisions by the nurses are examined over time..
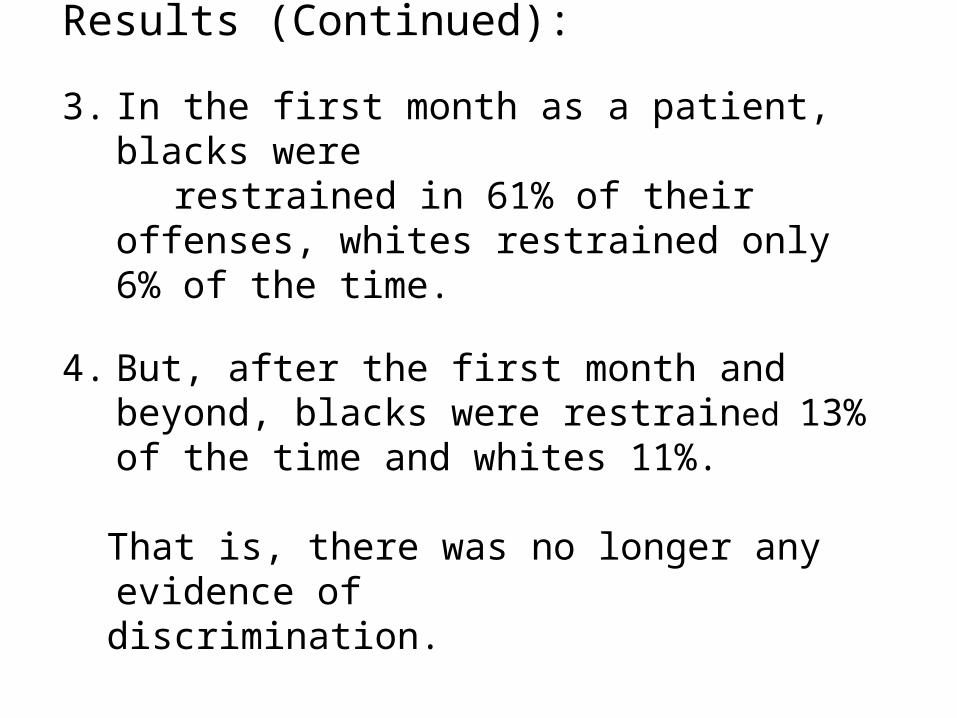
Results (Continued):
3. In the first month as a patient, blacks were restrained in 61% of their offenses, whites
restrained only 6% of the time.
4. But, after the first month and beyond, blacks were restrained 13% of the time and whites 11%.
That is, there was no longer any evidence of discrimination.

7. Various cognitive factors are related to prejudice and discrimination (see textbook).
One of these concerns the ultimate attribution error (now referred to in the textbook as the group-serving bias).

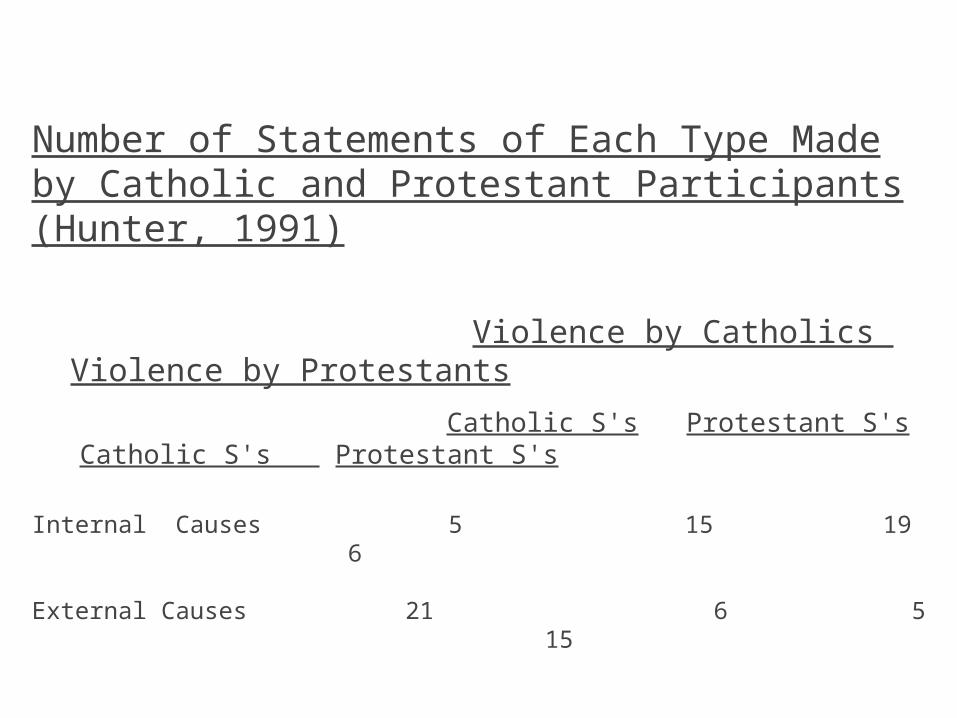
Hunter (1991)
Catholic Participants and Protestant Participants Viewed Videotapes Depicting Acts of Violence by Catholics or by Protestants

Number of Statements of Each Type Made by Catholic and Protestant Participants (Hunter, 1991)
Violence by Catholics Violence by Protestants
Catholic S's Protestant S's Catholic S's Protestant S's
Internal Causes
External Causes

Number of Statements of Each Type Made by Catholic and Protestant Participants (Hunter, 1991)
Violence by Catholics Violence by Protestants
Catholic S's Protestant S's Catholic S's Protestant S's
Internal Causes 5 15
External Causes 21 6
Number of Statements of Each Type Made by Catholic and Protestant Participants (Hunter, 1991)
Violence by Catholics Violence by Protestants
Catholic S's Protestant S's Catholic S's Protestant S's
Internal Causes 5 15 19 6
External Causes 21 6 5 15

Group Serving Bias Can Also Be Illustrated in the Language We Use to Describe Events

Study by Maasse
During a palio festival, research participants were drawn from different neighborhoods (contrada) who were competing in the horse race.
At this time, ingroup-outgroup (my neighborhood, your neighborhood) distinctions are heightened.

Participants were shown a line drawing of, for example, one man hitting another man. From the clothes worn, the man doing the hitting was either an ingroup member or an outgroup member.
Participants were asked to describe what was "going-on“
a) the person hit the other person b) the person hurt the other person, c) the person hates the other person, or d) the person is a violent person
Another Cognitive Bias Linked to Prejudice
The Question of the Perceived Homogeneity or Heterogeneity of Ingroups and Outgroups

Perceived homogeneity refers to judgements about the degree of similarity between all members of some group regarding the group’s attributes.
Perceived heterogeneity refers to judgements about the degree of diversity between all members of some group regarding the group’s attributes
Homogeneity ………………Heterogeneity
(Viewed as a continuum)

The Ingroup-Outgroup Bias
We tend to see the make-up of ingroup members as heterogenous.
We tend to see the make-up of outgroup members as homogeneous
Henderson-King, E.I., & Nisbett, R.E. (1996).
Anti-Black prejudice as a function of exposure to the negativebehavior of a single Black person.
Journal of Personality and Social Psychology, 71, 654-664.

Henderson-King & Nisbett (1996)
Will observing the negative behavour of a single Black person result in more negative attitudes towards Blacks in general?Some possible reasons for predicting"yes":
1. Law of small numbers: people rely too heavily on small samples, often failing to recognize that their observations can be attributed to sampling variability.

2. Research has shown that person-to-group generalization is more likely to occur in observing the behaviour of an outgroup member.
This is likely to occur because "people perceive outgroups as less variable and therefore see individual outgroup members as prototypical of the larger group."

In comparison, in viewing the behaviour of an ingroup member, we are less likely to make individual-to-group generalizations because:
a) Negative behaviour is likely to beattributed to situational factors.
b) The ingroup is perceived to be highlyvariable.

White participants witnessed either a white male or a black male behave in a negative way or in a positive way. In the control condition, no behaviour was observed.

Dependent variables in the Study
1. Where participant chose to sit (nextto a white or black confederate).
2. Presented with a word pair consisting of a group and a trait (e.g., Blacks-hostile). Rated the extent to which
they believed that American society believes that the group and trait are associated and also rated their own belief on this association.
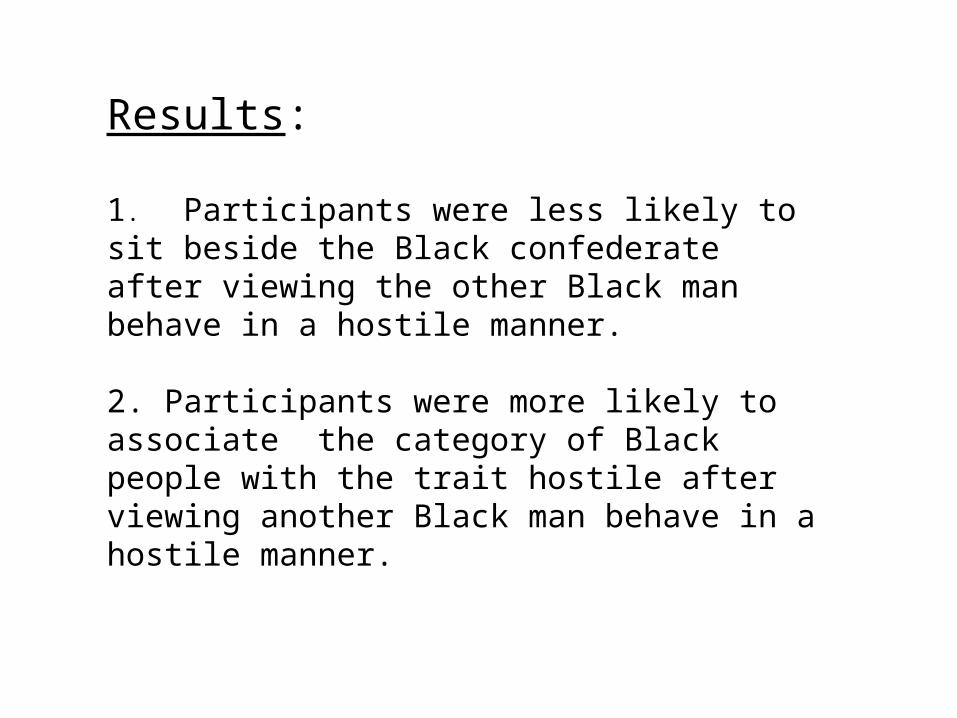
Results:
1. Participants were less likely to sit beside the Black confederate after viewing the other Black man behave in a hostile manner.
2. Participants were more likely to associate the category of Black people with the trait hostile after viewing another Black man behave in a hostile manner.

Results:
3. Witnessing the positive behaviour of the Black confederate was unrelated to where participants chose to sit or to the rated association between the category Black and the trait hostile.
4. Witnessing the White confederate behave in a positive manner or in a hostile manner was unrelated to where participants chose to sit or to their rated association between the category White and the trait hostile.
5. In other words, the only behaviour that seemed to matter was when the single Black man behaved in a hostile manner.
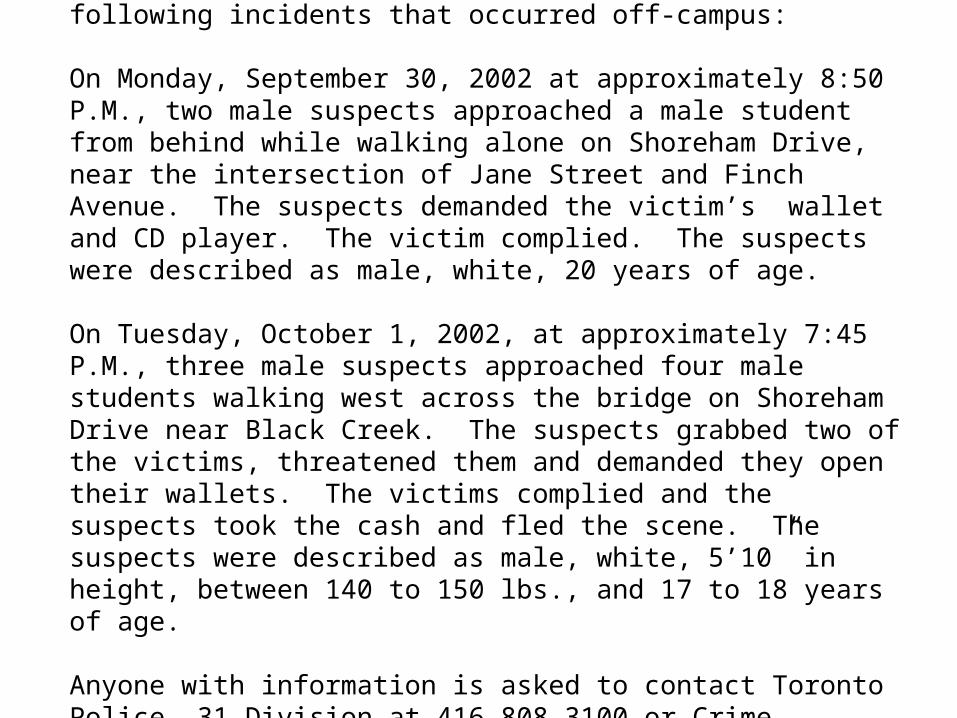
Toronto Police Service, 31 Division advises of the following incidents that occurred off-campus:
On Monday, September 30, 2002 at approximately 8:50 P.M., two male suspects approached a male student from behind while walking alone on Shoreham Drive, near the intersection of Jane Street and Finch Avenue. The suspects demanded the victim’s wallet and CD player. The victim complied. The suspects were described as male, white, 20 years of age.
On Tuesday, October 1, 2002, at approximately 7:45 P.M., three male suspects approached four male students walking west across the bridge on Shoreham Drive near Black Creek. The suspects grabbed two of the victims, threatened them and demanded they open their wallets. The victims complied and the suspects took the cash and fled the scene. The suspects were described as male, white, 5’10” in height, between 140 to 150 lbs., and 17 to 18 years of age.
Anyone with information is asked to contact Toronto Police, 31 Division at 416.808.3100 or Crime Stoppers at 416.222.TIPS.

Toronto Police Service, 31 Division advises of the following incidents that occurred off-campus:
On Monday, September 30, 2002 at approximately 8:50 P.M., two male suspects approached a male student from behind while walking alone on Shoreham Drive, near the intersection of Jane Street and Finch Avenue. The suspects demanded the victim’s wallet and CD player. The victim complied. The suspects were described as male, black, 20 years of age.
On Tuesday, October 1, 2002, at approximately 7:45 P.M., three male suspects approached four male students walking west across the bridge on Shoreham Drive near Black Creek. The suspects grabbed two of the victims, threatened them and demanded they open their wallets. The victims complied and the suspects took the cash and fled the scene. The suspects were described as male, black, 5’10” in height, between 140 to 150 lbs., and 17 to 18 years of age.
Anyone with information is asked to contact Toronto Police, 31 Division at 416.808.3100 or Crime Stoppers at 416.222.TIPS.

Vanbeselaere (1991)
Participants were 12-16 years old in groups of six.
They viewed slides of various scenes, including seashore scenes and forest scenes and made preference ratings.
Randomly, three of them are later told publicly that they prefer the seashore scenes and the other three that they prefer the forest scenes.
This was the first independent variable, in terms of promoting group membership – I am in the seashore group, or I am in the forest group.

The second independent variable was the supposed level of homogeneity of the composition of the outgroup (homogeneous or heterogeneous).
For example, information presented to the Seashore group about the composition of the Forest group in terms of the outgroup’s average liking of forest scenes would look like one of the following (randomly determined)

Homogeneous outgroup Forest Group
Very little : : : : : xxx : : very much
Heterogeneous outgroup Forest Group
Very little : : : : x : x : x : very much

Result:
Evidence for ingroup favouritism only when participants were led to believe that the outgroup was homogeneous.

Some Confirming Evidence
Simon (1990)
In manipulating information about both the supposed homogeneity (low or high) of the outgroup and supposed homogeneity of the ingroup (low or high) in the study, he found that:
1. Level of outgroup homogeneity was positively related to ingroup favouritism, that is, more ingroup favouritism was evident with high homogeneity.
2. Level of ingroup homogeneity was unrelated to ingroup favouritism

Can we alter our view of the level of homogeneity of an outgroup?
Some conclusions based on two studies (groups were construction workers and lawyers) suggest yes.
1. The presentation of stereotype-incongruent information can havean impact on perceived variability of the group ("I didn't realize that group members could be so different from one another”).
2. The presentation of highly variable stereotype-congruent information also increased perceived variability of the group.

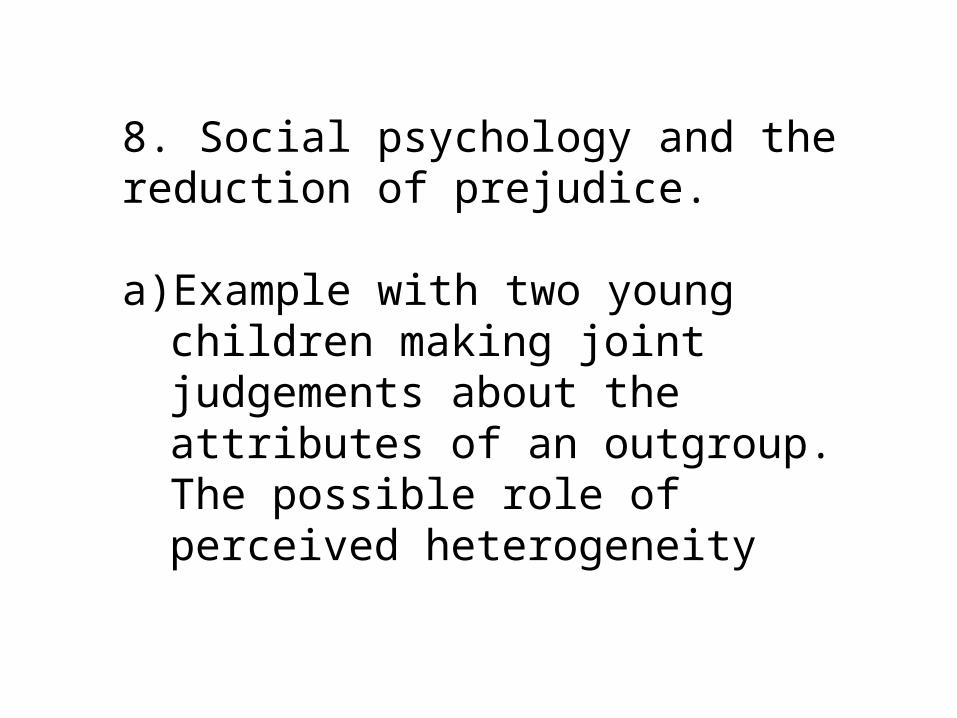
8. Social psychology and the reduction of prejudice.
a) Example with two young children making joint judgements about the attributes of an outgroup. The possible role of perceived heterogeneity
b) The contact hypothesis: To reduce prejudice, bring people into contact with members of the outgroup in
question. Do this under ideal conditions.
(c) Canada's multicultural program and the "multicultural hypothesis.”

Paluck, E.L. & Green, D.P. (2009).
Prejudice Reduction: What Works? A Review and Assessment of Researchand Practice
Annual Review of Psychology, 60, 339–67
The Annual Review of Psychology is online at psych.annualreviews.org

AbstractThis article reviews the observational, laboratory, and field experimentalliteratures on interventions for reducing prejudice. Our review placesspecial emphasis on assessing the methodological rigor of existing research,calling attention to problems of design and measurement thatthreaten both internal and external validity. Of the hundreds of studieswe examine, a small fraction speak convincingly to the questionsof whether, why, and under what conditions a given type of interventionworks. We conclude that the causal effects of many widespreadprejudice-reduction interventions, such as workplace diversity trainingand media campaigns, remain unknown. Although some intergroupcontact and cooperation interventions appear promising, a muchmore rigorous and broad-ranging empirical assessment of prejudice reductionstrategies is needed to determine what works.
8. Social psychology and the reduction of prejudice.
a) Example with two young children making joint judgements about the attributes of an outgroup. The possible role of perceived heterogeneity
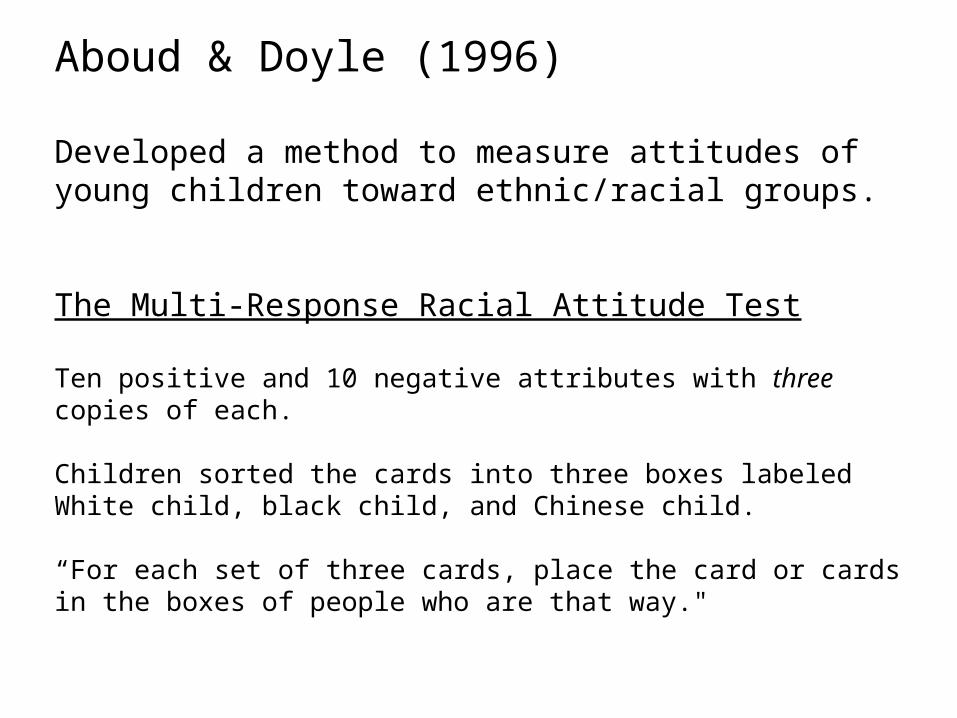
Aboud & Doyle (1996)
Developed a method to measure attitudes of young children toward ethnic/racial groups.
The Multi-Response Racial Attitude Test
Ten positive and 10 negative attributes with three copies of each.
Children sorted the cards into three boxes labeled White child, black child, and Chinese child.
“For each set of three cards, place the card or cards in the boxes of people who are that way."

Reducing prejudice through discussion and joint decisions by two children regarding characteristics of outgroups. Participants: White children, 8 to 11 years old.
One child has been identified at Time 1 as high in prejudice and the other child as low in prejudice using the measure just described.

At Time 2, children make joint decisions.
Their discussion was taped, transcribed, and analyzed.
For example, the number of statements made by either child concerning:
i) cross race similarity (people in all groups get into fights)
ii) negative statements regarding outgroups
iii) negative statements about ingroup (Whites)

At Time 3, children individually, as in Time 1, make judgements about the same outgroups.
This was the post-discussion measure of their attitude.

Results
1. Child with more negative attitude towards the outgroups became less negative.
2. Low prejudice child more likely to make cross race similarity statements and negative ingroup statements. More likely to say (about one of the groups) "Everyone can be mean” or "They all play fair.“
High prejudice children rarely made these comments.

Contact hypothesis
Bring people with negative attitudes toward some outgroup in general into contact under ideal conditions with specific members of that outgroup and their level of prejudice will be reduced.
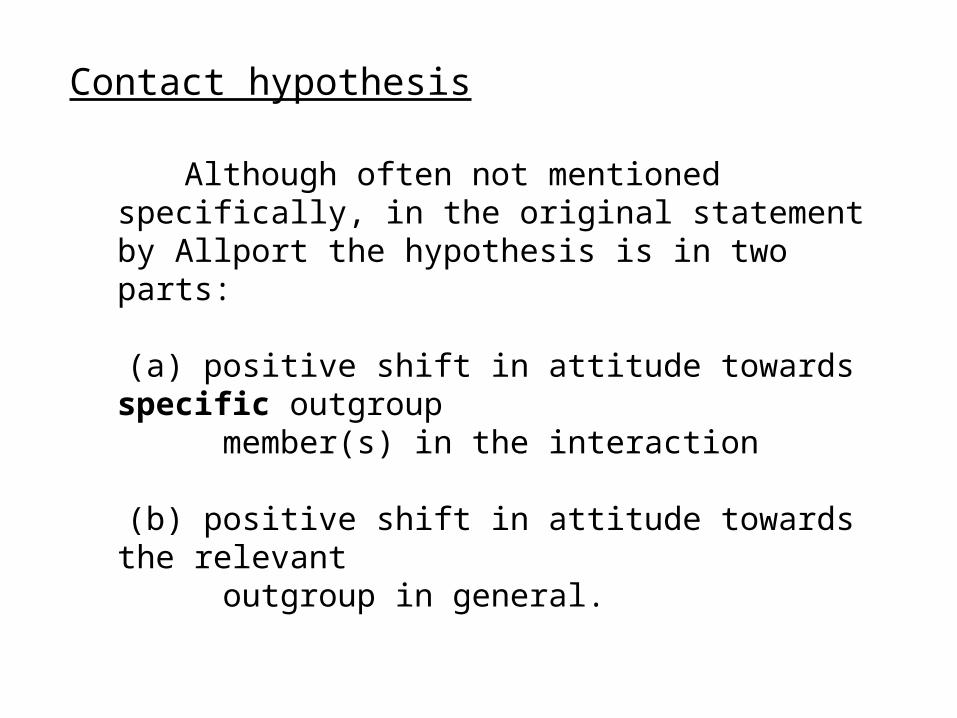
Contact hypothesis
Although often not mentioned specifically, in the original statement by Allport the hypothesis is in two parts:
(a) positive shift in attitude towards specific outgroup member(s) in the interaction
(b) positive shift in attitude towards the relevant outgroup in general.
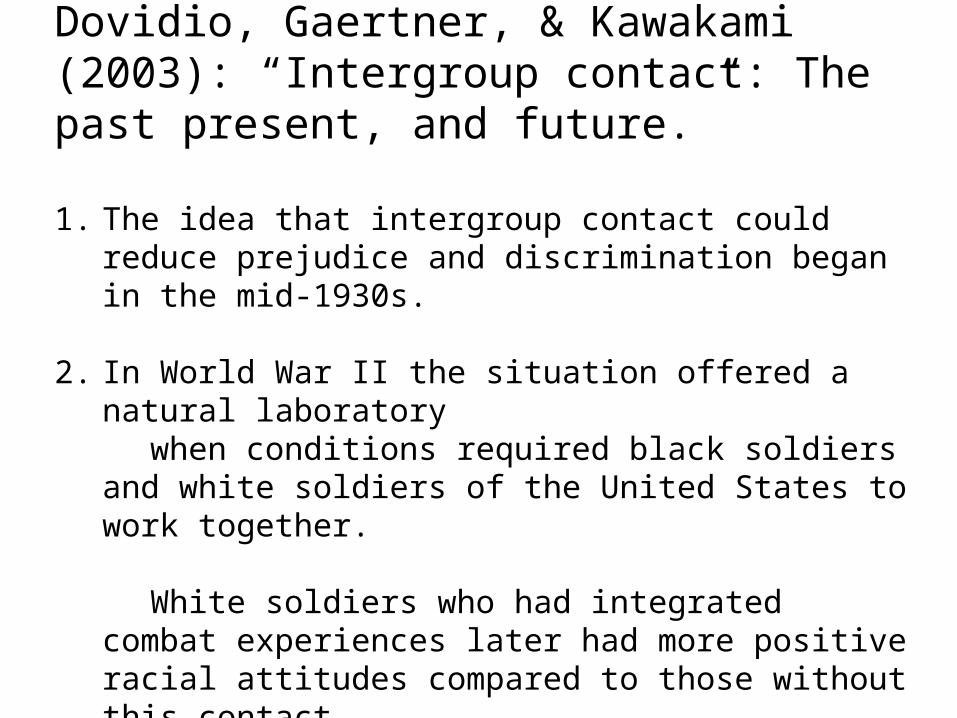
Here is A Historical Overview by Dovidio, Gaertner, & Kawakami (2003): “Intergroup contact: The past present, and future.”
1. The idea that intergroup contact could reduce prejudice and discrimination began in the mid-1930s.
2. In World War II the situation offered a natural laboratory when conditions required black soldiers and white
soldiers of the United States to work together.
White soldiers who had integrated combat experiences later had more positive racial attitudes compared to those without this contact.

3. Researchers began to outline optimal conditions within the contact experience. Allport’s (1954) book on the nature of prejudice formulated many of these ideas and was a very influential source.
4. Pettigrew (2000) reviewed 203 studies and concluded that appropriate contact was related to a decrease in
intergroup biases.
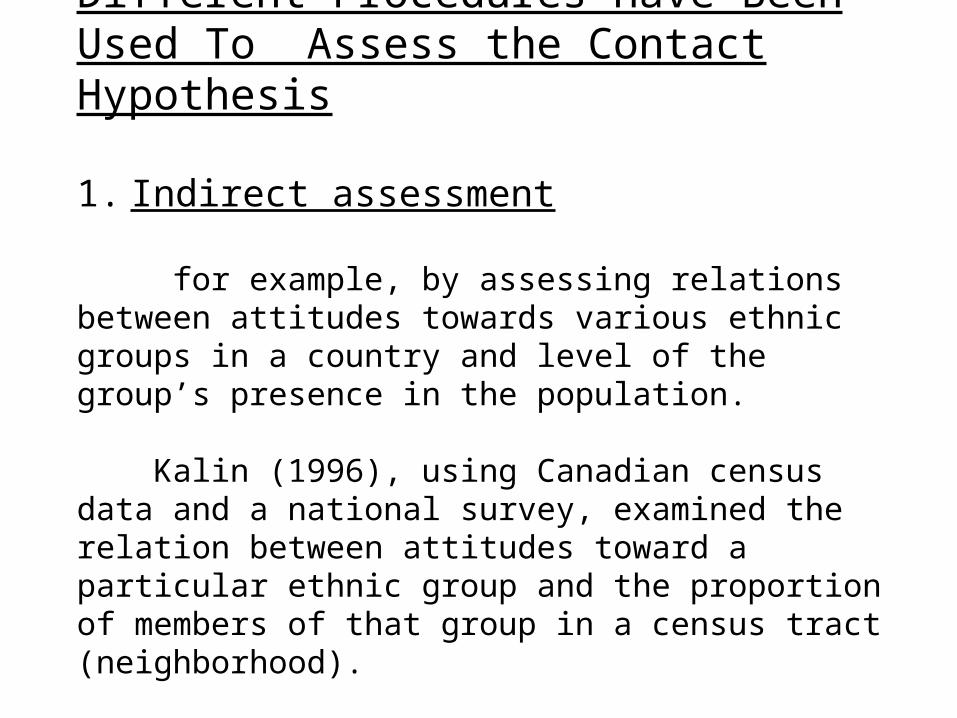
Different Procedures Have Been Used To Assess the Contact Hypothesis
1. Indirect assessment
for example, by assessing relations between attitudes towards various ethnic groups in a country and level of the group’s presence in the population. Kalin (1996), using Canadian census data and a national survey, examined the relation between attitudes toward a particular ethnic group and the proportion of members of that group in a census tract (neighborhood).

e.g., correlation coefficient analysis re attitudes towards Polish people-in-general
variable 1 variable 2 Mean Attitude % of pop. Who are Polish
tract 1 tract 2 tract 3
and so on

Another Indirect Assessment
Wagner (2003) Basic condition: Living in West Germany provided more opportunity for contact with foreigners, compared to living in East Germany.
Study found higher levels of prejudice exhibited by people in East Germany compared to West Germany.

Another Method to Assess the Contact Hypothesis
By Examining Reported Contact and Attitudes in a Field Setting
Levin (2003)
Participants were over 2000 White, Asian, Latino, and African American college students attending ULCA.

The following measures were assessed near the end of their first, second, third, and final years. 1. Friendship variable: At UCLA how many of your closest
friends are Asian American; how many are African American, how many Latino, how many Caucasian. (1=none, 2= few .. 5=all)
2. Ingroup bias variable: How positively or negatively do you feel toward each of the groups.
This measure was the degree of difference between your rating of your own group minus your average rating of the outgroups.

The following measures were assessed near the end of their first, second, third, and final years.
3. Intergroup anxiety scale:
e.g., “I feel uneasy being around people of different ethnicities.”
And reverse-keyed item
e.g., “I feel competent interacting with people from different ethnic groups.”

Results
1. Students who exhibited more ingroup bias and intergroup anxiety at the end of their first year had
i) fewer outgroup friends and
ii) more ingroup friends during their second and third years.

Results
2. Students with more outgroup friendships and fewer ingroup friendships during their second and third years showed
i) less ingroup bias and
ii) less intergroup anxiety at the end of college
These results controlled (statistically) for their prior attitudes and pre-college friendships) and supportsthe contact hypothesis.
Controlling for the pre-measures suggests that it was the outgroup contact experience that “led” to reduced intergroup bias and outgroup anxiety.

Direct assessment through experimental design
1. by systematically bringing individuals into contact with a member of the outgroup – e.g., research of Cook.
2. by changing the nature of the contact experience e.g., Aronson (1978)

Cook (1969, 1971) - Contact studies.
Part I: Administered a questionnaire to White women to measure their attitudes towards Blacks-in-general
Part II: Women who had been identified as highly prejudiced were asked to take part in a study in another lab.
One at a time, these women played a simulation game — the running of a freight railroad company — with two other women, confederates, one White and one Black.
There were two half-hour periods separated by one half-hour period for lunch.
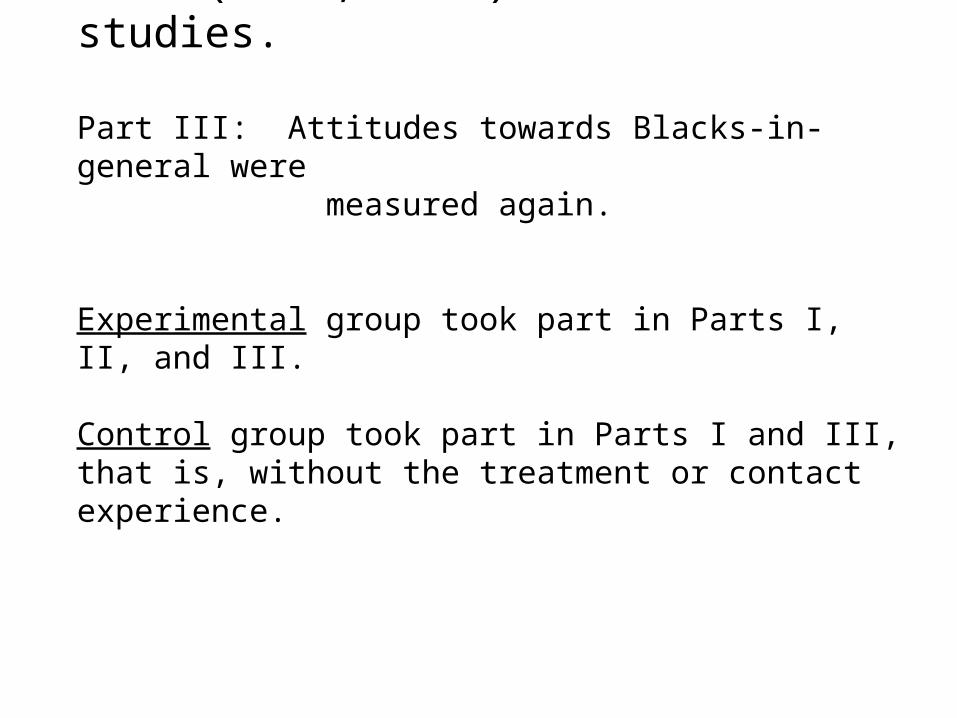
Cook (1969, 1971) - Contact studies.
Part III: Attitudes towards Blacks-in-general were measured again.
Experimental group took part in Parts I, II, and III.
Control group took part in Parts I and III, that is, without the treatment or contact experience.

Ideal Conditions of Intergroup Contact Used by Cook
1. Members of the two groups are of equal status.
2. Insertion of cooperative interdependence with common goals.
The premise here is the rewarding properties of achieving success may become associated with the members of the other group.
3. The contact occurred within the context of acceptance between members of the two groups.
4. Opportunity for personal acquaintance between the members, especially when the attributes of the other group members do not confirm stereotypic expectations.
5. Development of intergroup friendships.
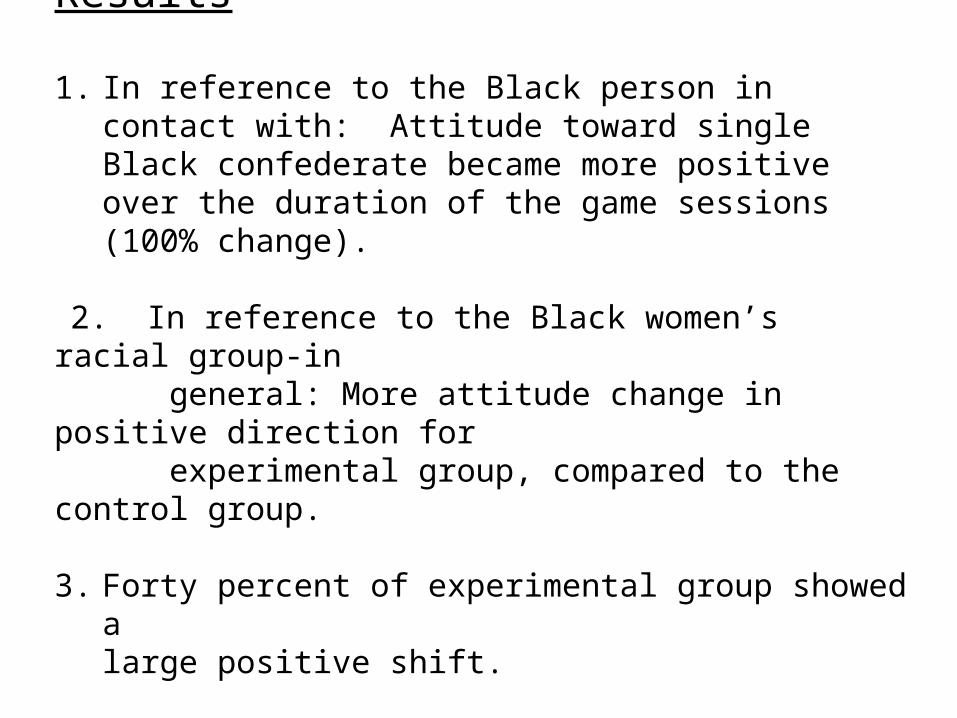
Results
1. In reference to the Black person in contact with: Attitude toward single Black confederate became more positive over the duration of the game sessions (100% change).
2. In reference to the Black women’s racial group-in general: More attitude change in positive direction for experimental group, compared to the control group.
3. Forty percent of experimental group showed alarge positive shift.

Aronson(1970’s)
Cooperative reward structure: The "jigsaw puzzle method“
1. The children's ethnic/racial background was Anglo, Black, or Chicano
2. Divide grade five class into groups of six students. Give each student in a group one sixth of the material that
needed to be learned. Students' task was to learn all of the material. To do so, they would each need to cooperate with the other members of their group.
3. This method was instituted in 10 classes for one and one- half hours per day for six weeks. Outcome compared
with a control group of three classrooms.

Results
1. Children liked each other more (compared to control group children).
2. More positive attitudes toward school.
3. Children felt better about themselves.
4. No reduction in prejudice (that is, attitudes towards the outgroups in question did not become more
positive).
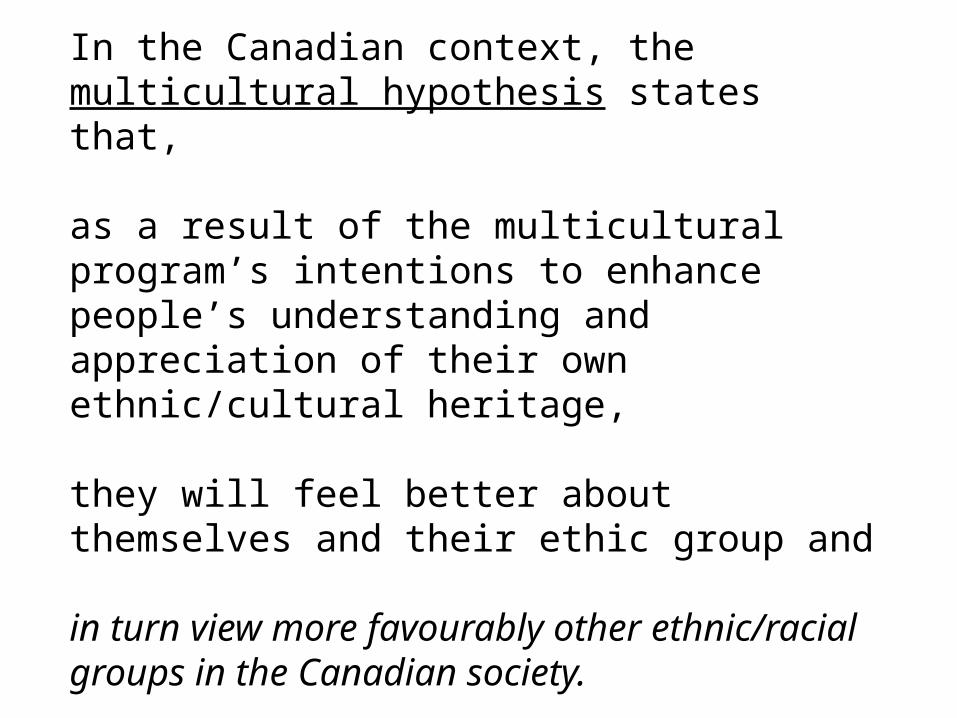
In the Canadian context, the multicultural hypothesis states that,
as a result of the multicultural program’s intentions to enhance people’s understanding and appreciation of their own ethnic/cultural heritage,
they will feel better about themselves and their ethic group and
in turn view more favourably other ethnic/racial groups in the Canadian society.

Other social psychologists have suggested that the opposite result could occur, that, as individuals view their own ethnic group/heritage all the more positively, they may become less tolerant of other groups.
John Berry (Queen’s University) stated that this would depend on whether the group’s view of their own group reached the point of over-glorification.
Glorification -- to make glorious by bestowing honor, praise, or admiration
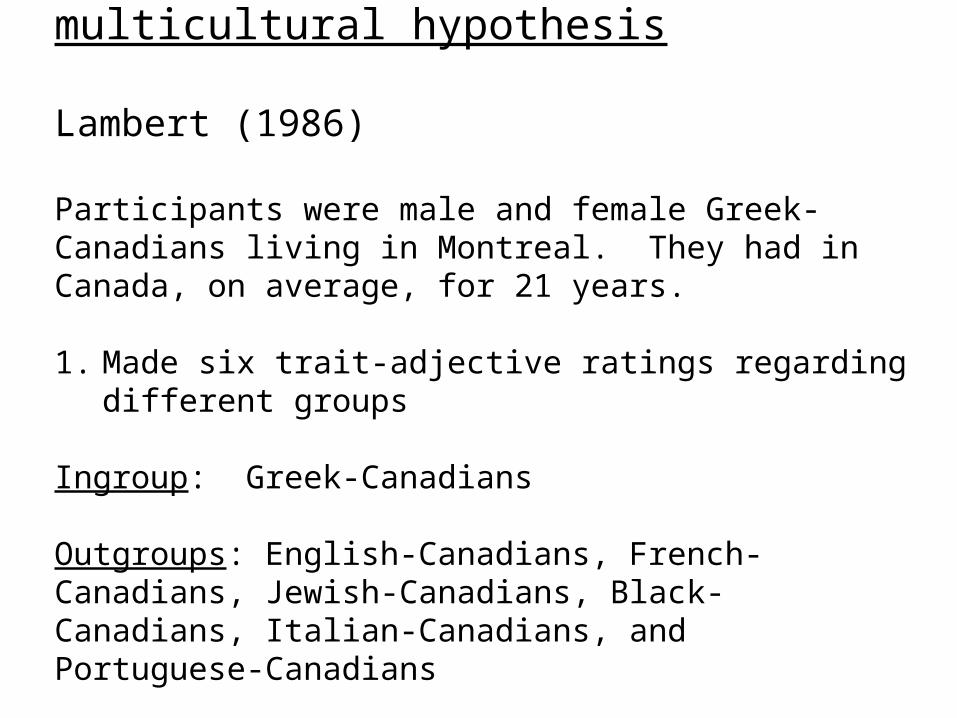
Multiculturalism and the multicultural hypothesis
Lambert (1986)
Participants were male and female Greek-Canadians living in Montreal. They had in Canada, on average, for 21 years.
1. Made six trait-adjective ratings regarding different groups
Ingroup: Greek-Canadians
Outgroups: English-Canadians, French-Canadians, Jewish-Canadians, Black-Canadians, Italian-Canadians, and Portuguese-Canadians
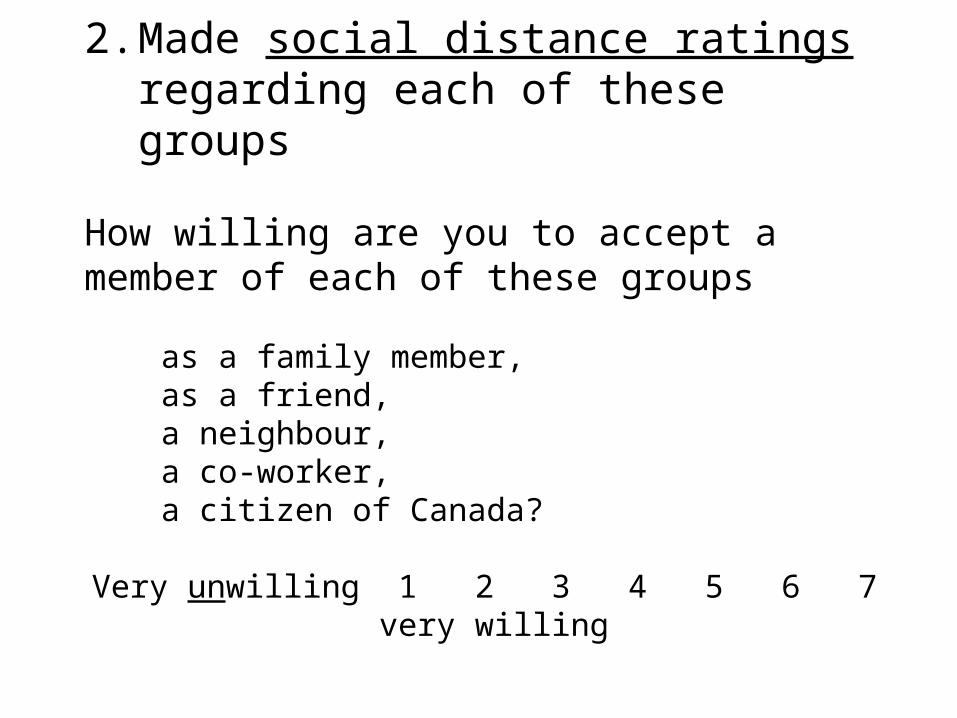
2. Made social distance ratings regarding each of these groups
How willing are you to accept a member of each of these groups
as a family member, as a friend, a neighbour, a co-worker, a citizen of Canada?
Very unwilling 1 2 3 4 5 6 7 very willing

3. Made judgements about how secure they felt about
i) the economic standing of Greek-Canadians
ii) the ability of Greek-Canadians to maintain their culture/language
iii) the ability of Greek-Canadians to maintain their status in the larger Canadian context.

Mean Social Distance Ratings
Greeks English
Family member 6.8 3.0
Friend 6.7 4.4
Neighbour 6.4 5.1

Test of the Multicultural Hypothesis: Correlation Coefficients between Security Ratings and Outgroup Ratings Security Rating Regarding
economic culture status Mean trait Adjective rating .30* .20* .25* Social distance Family -.10 .03 .04
Friends .04 .14 .08
Neighbours .07 .08 .02
* Signifies statistically significant