Outline - Le site web des Mathématiques du...
27
1 March, 5 th 2015 Outline Setting : Multidimensional Data Analysis (MDA) and Social Network Analysis (SNA) Part 1 : to present a framework for the treatment of SNA data structures with explorative techniques of MDA Methods : Smooth factorial analysis-SFA; Factorial Analysis of Local Differences-FALD Benali H. Escofier, B. (1990) Part 2 : To define ad hoc relational data structures highlighting the effect of external information on networks Theoretical frameworks: Homophily principle, Social Influence, ... Mainly based on the paper by G. Giordano, M. P. Vitale (2011). On the use of external information in social network analysis. ADVANCES IN DATA ANALYSIS AND CLASSIFICATION, pp.95- 112, Vol. 5.
Transcript of Outline - Le site web des Mathématiques du...

1
March, 5th 2015
Outline Setting: Multidimensional Data Analysis (MDA) and Social Network
Analysis (SNA)
Part 1: to present a framework for the treatment of SNA data structures with explorative techniques of MDA
Methods: Smooth factorial analysis-SFA; Factorial Analysis of Local Differences-FALD Benali H. Escofier, B. (1990)
Part 2: To define ad hoc relational data structures highlighting the effect of external information on networks
Theoretical frameworks: Homophily principle, Social Influence, ...
Mainly based on the paper by G. Giordano, M. P. Vitale (2011). On the use of external information in social network analysis. ADVANCES IN DATA ANALYSIS AND CLASSIFICATION, pp.95- 112, Vol. 5.

2
Background and Aim
Network Data are present in our life beside our awareness to be part of a system
• Traditional Human interactions (difficult to collect data) • Telecommunication (including online chat messenger, e-mail,… containing rich information in form of text, photo, video, etc.)
• Online Social Network (Facebook, Tweeter, Flicker, etc)
• Biological Networks (Protein interactions)
3
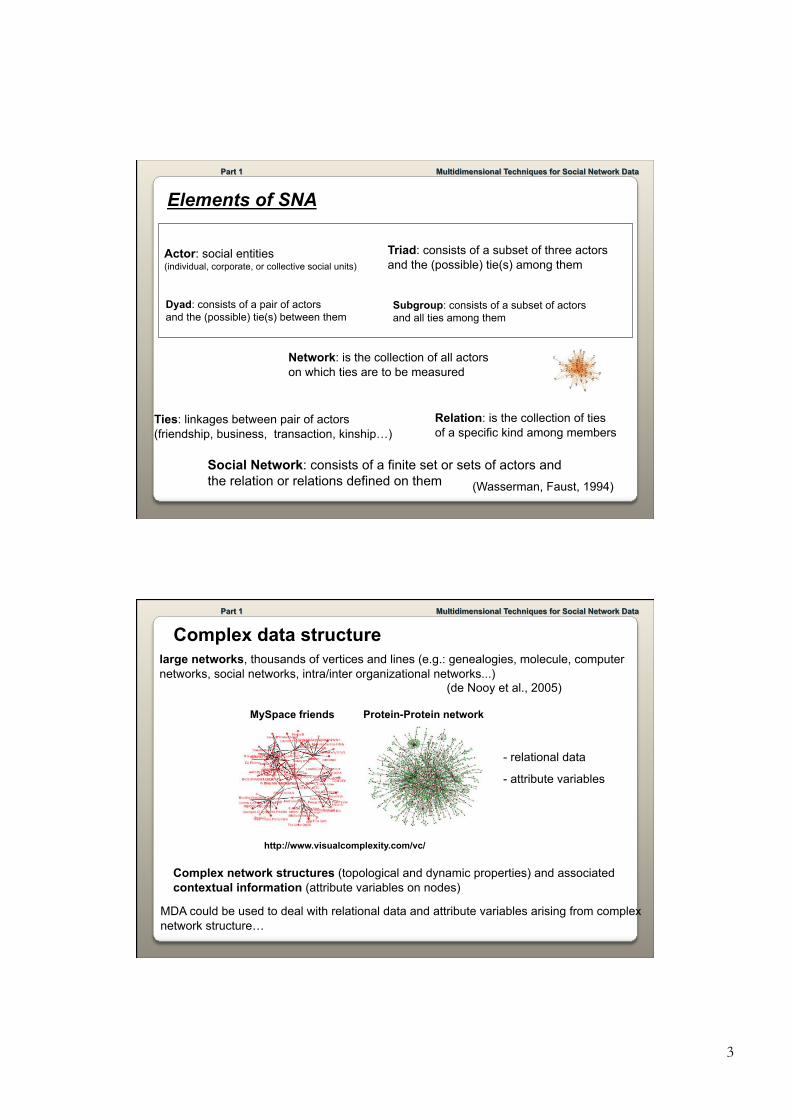
Actor: social entities (individual, corporate, or collective social units)
Elements of SNA
Ties: linkages between pair of actors (friendship, business, transaction, kinship…)
Dyad: consists of a pair of actors and the (possible) tie(s) between them
Triad: consists of a subset of three actors and the (possible) tie(s) among them
Subgroup: consists of a subset of actors and all ties among them
Network: is the collection of all actors on which ties are to be measured
Relation: is the collection of ties of a specific kind among members
Social Network: consists of a finite set or sets of actors and the relation or relations defined on them (Wasserman, Faust, 1994)
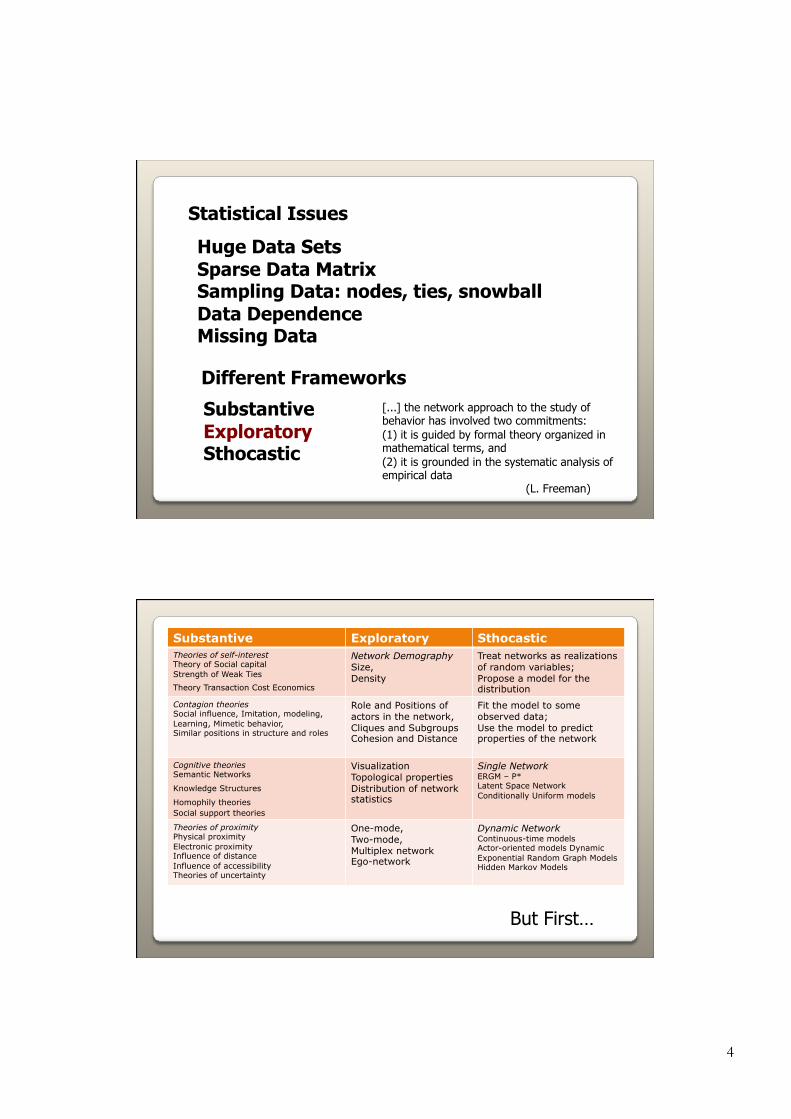
Complex data structure large networks, thousands of vertices and lines (e.g.: genealogies, molecule, computer networks, social networks, intra/inter organizational networks...)
(de Nooy et al., 2005)
Complex network structures (topological and dynamic properties) and associated contextual information (attribute variables on nodes)
MDA could be used to deal with relational data and attribute variables arising from complex network structure…
MySpace friends Protein-Protein network
http://www.visualcomplexity.com/vc/
- relational data
- attribute variables
4
Statistical Issues
Huge Data Sets Sparse Data Matrix Sampling Data: nodes, ties, snowball Data Dependence Missing Data
Different Frameworks
Substantive Exploratory Sthocastic
[...] the network approach to the study of behavior has involved two commitments: (1) it is guided by formal theory organized in mathematical terms, and (2) it is grounded in the systematic analysis of empirical data
(L. Freeman)
Substantive Exploratory Sthocastic Theories of self-interest Theory of Social capital Strength of Weak Ties
Theory Transaction Cost Economics
Network Demography Size, Density
Treat networks as realizations of random variables; Propose a model for the distribution
Contagion theories Social influence, Imitation, modeling, Learning, Mimetic behavior, Similar positions in structure and roles
Role and Positions of actors in the network, Cliques and Subgroups Cohesion and Distance
Fit the model to some observed data; Use the model to predict properties of the network
Cognitive theories Semantic Networks
Knowledge Structures Homophily theories Social support theories
Visualization Topological properties Distribution of network statistics
Single Network ERGM – P* Latent Space Network Conditionally Uniform models
Theories of proximity Physical proximity Electronic proximity Influence of distance Influence of accessibility Theories of uncertainty
One-mode, Two-mode, Multiplex network Ego-network
Dynamic Network Continuous-time models Actor-oriented models Dynamic Exponential Random Graph Models Hidden Markov Models
But First…
5
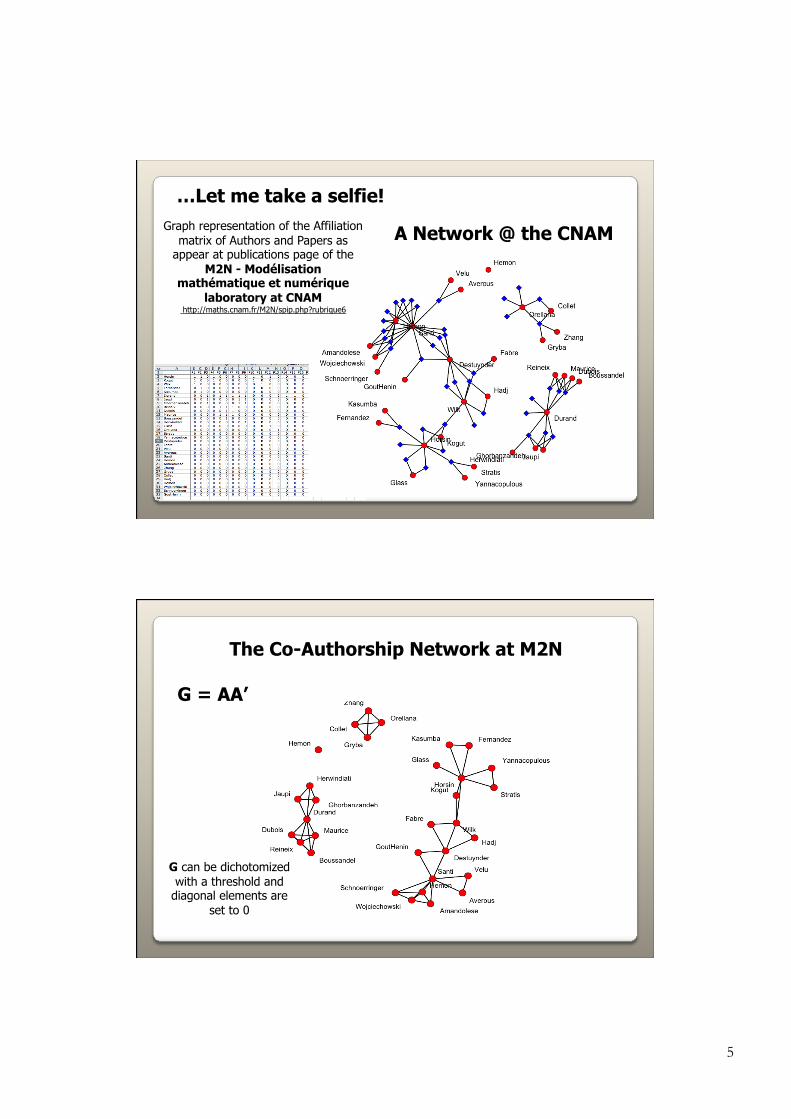
A Network @ the CNAM Graph representation of the Affiliation matrix of Authors and Papers as
appear at publications page of the M2N - Modélisation
mathématique et numérique laboratory at CNAM
http://maths.cnam.fr/M2N/spip.php?rubrique6
…Let me take a selfie!
The Co-Authorship Network at M2N
G = AA’
G can be dichotomized with a threshold and
diagonal elements are set to 0

6
Degree, Betweenness and Eigenvector Centrality Distributions
The Active in Collaborations Scholars with high number of collaborators
(not publications!!)
The Transmitters (Scholars joining two sub-graphs)
The Prestigious Scholars most connected with the most connected
High Betweenness
High Eigenvector Centrality
High Degree
Centrality and Roles in a Network
7
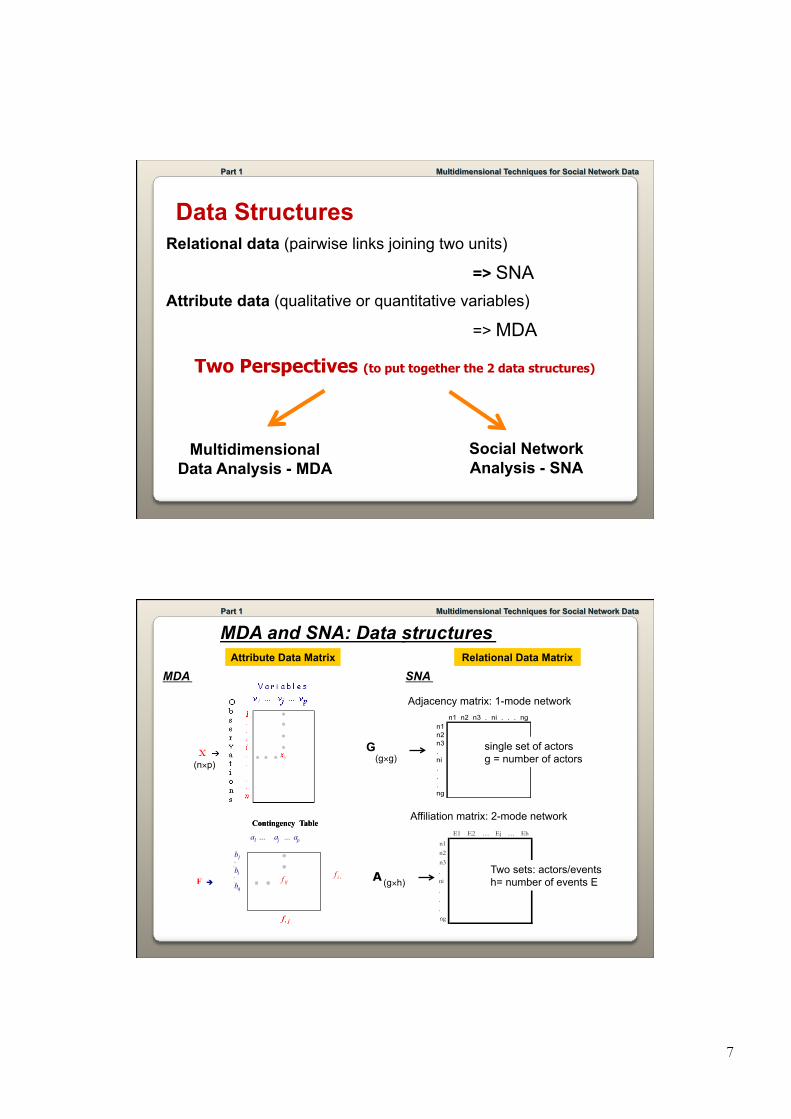
Data Structures Relational data (pairwise links joining two units)
=> SNA Attribute data (qualitative or quantitative variables)
=> MDA Two Perspectives (to put together the 2 data structures)
Multidimensional Data Analysis - MDA
Social Network Analysis - SNA
MDA and SNA: Data structures Attribute Data Matrix
E1 E2 … Ej … Eh
n1 n2 n3 . ni . . . ng
Affiliation matrix: 2-mode network
Adjacency matrix: 1-mode network
Relational Data Matrix
MDA SNA
G (n×p)
(g×g)
A (g×h)
single set of actors g = number of actors
Two sets: actors/events h= number of events E
b 1 . . b i . . b q
a 1 … a j ... a p
f ij
Contingency Table
F !
f . j
f i .
b 1 . . b i . . b q
a 1 … a j ... a p
f ij
Contingency Table
F !
f . j
f i .

8
MDA for SNA
Usually different techniques of MDA have been used to visualise and explore the relationships in the net structure
- Multidimensional Scaling : representation of similarity or dissimilarity measures among the actors onto a factorial map. (Freeman, 2005) - Canonical correlation: analysis of associations among actor characteristics, (i.e. network composition) and the pattern of social relationships (i.e. network structure)
(Wasserman and Faust, 1989) - Correspondence Analysis: analysis of 2-mode networks
(Roberts, 2000; de Nooy, 2003 Faust, 2005) - Clustering techniques for network data
(Batagelj, Ferligoy, 1982, 2000)
such as…
Contiguity analysis is a generalization of linear discriminant analysis in which the partition of elements is replaced by a more general graph structure defined a priori on the set of observations (disjoined cliques, chain structures, undirected graph).
A Brief Review: Contiguity analysis
(Lebart 1969, 2006; Lebart et al., 2000)
Answer
G (n,n) Adjacency matrix holding the n vertices in a contiguity graph (symmetric binary matrix); gii’ = 1 if i is a neighbour of i’ and gii’ = 0 otherwise
How to take into account relational data in MDA?
9
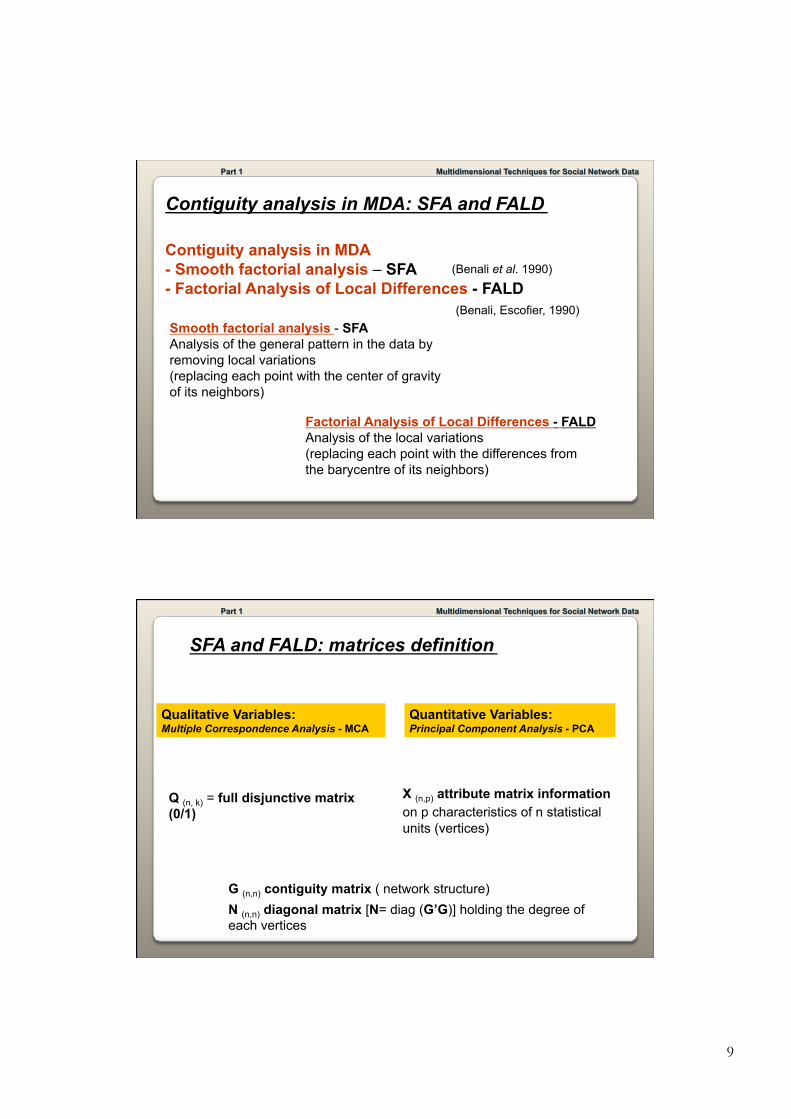
Contiguity analysis in MDA: SFA and FALD
Smooth factorial analysis - SFA Analysis of the general pattern in the data by removing local variations (replacing each point with the center of gravity of its neighbors)
Factorial Analysis of Local Differences - FALD Analysis of the local variations (replacing each point with the differences from the barycentre of its neighbors)
Contiguity analysis in MDA - Smooth factorial analysis – SFA - Factorial Analysis of Local Differences - FALD
(Benali, Escofier, 1990)
(Benali et al. 1990)
Quantitative Variables: Principal Component Analysis - PCA
Qualitative Variables: Multiple Correspondence Analysis - MCA
X (n,p) attribute matrix information on p characteristics of n statistical units (vertices)
Q (n, k) = full disjunctive matrix (0/1)
G (n,n) contiguity matrix ( network structure) N (n,n) diagonal matrix [N= diag (G’G)] holding the degree of each vertices
SFA and FALD: matrices definition

10
SFA
FA
LD
Given the triplet Q, G, N for a MCA multiply the Q matrix by N-1G
Analysis of relational data and auxiliary information
SFA
FA
LD
Analysis of relational data and auxiliary information
Given the triplet X, G, N for a PCA multiply the X matrix by N-1G

11
Entries in adjacency matrix can be seen as a particular case of contiguity relation among statistical units defined in G. It produces a fuzzy partitioning of the units.
Decomposition of the total variance/inertia into two components:
- local variance between the adjacent units
- residual variance
SFA and FALD in SNA
SFA: variability explained by the presence of a contiguity structure
FALD: actors with a prominent role in contiguous groups
to discover patterns in the data
analysis of cohesive sub-group variations
Aim: to explore the association structure between socio-demographic background, attitudinal variables, academic background, university performance (attribute variables on actors) and collaboration among students at university (relational data)
Data sources: students enrolled at the first academic year of the second level degree of Sociology at University of Salerno 2008/09. Web survey: Questionnaire to collect individual characteristics and relational data about collaboration dynamics and community formation during the first level degree.
60% answers (81 enrolled students)
SFA and FALD for qualitative data (MCA): Illustrative example

12
Illustrative example (continued)
Collaboration Network: Definition
From 3 binary symmetric adjacency matrices…to one binary symmetric adjacency matrix obtained by joining the 3 above matrices
Collaboration Network
Formal contacts - information exchange - exams preparation - classmates
Attribute variables on nodes - Socio-demographic (gender; residence;…) - Individual characteristics (work, grade and type of secondary school,…) - Performance (perceived performance of services vs/ final grade,…)
Looking at nodes position in the net structure
the neighbors of the nodes 15 (7 degrees) and 17 (5 degrees) (nodes with few degrees)
Density: 0,443

13
Attributes information on nodes
Gender: Male, Female
Work: work, no_work during the first level degree
Career: Regular (<=4 years); Irregular (>4 years)
Secondary School= SecondarySchool (“Lyceum”); NoSecSchool (“no lyceum”)
Performance = (objective indicator) final degree (NoPerf : score <90/100; Perf : score >= 90/100)
Perceived performance= 5 subjective indicators measured on 10-scale scores (Perf1, Perf2, Perf3, Perf4 Perf5 : score >= 8; No_perf1, No_perf2, No_perf3, No_perf4, No_perf5 : score < 8)
Looking at association structure on attribute variables: MCA
No_work
“Good” students against “Polemic” students

14
Introducing contiguity matrix G (SFA)
Smoothed observations are the barycenter of contiguous units and lye close to characteristics which are peculiar of their egocentered network
No_work
Introducing contiguity matrix: FALD putting emphasis on characteristics describing heterogeneity into contiguous units
No_work
We found there most the same results of MCA because the contiguity structure is not strongly related to attribute
variables

15
REMARKS
SFA and FALD can be used to explore the relationships between the network structure and attribute variables…
The factorial maps show the actor position as a function of the attributes in X (or Q) and the contiguity structure…
Can network structure (dense vs sparse) influence the results on MDA in presence of contiguity?
Aluja Banet, T., Lebart, L. (1984) Local and Partial Principal Component Analysis and Correspondence Analysis, in: COMPSTAT Proceedings, Havranek T., Sidak Z. & Novak M. (Eds.), Phisyca-Verlag, Vienna, 113-118.
Batagelj, V., Ferligoj A., (1982) Clustering with relational constraint, Psychometrika, 47, 413-426. Batagelj V., Ferligoj A.: Clustering relational data. Data Analysis (ed.: W. Gaul, O. Opitz, M. Schader), Springer,
Berlin 2000, 3-15. Benali H. Escofier, B. (1990) Analyse factorielle lissée et analyse factorielle des différences locales. Revue de
Statistique Appliquée, 38, 55-76. Escofier, B., H. Benali, K. Bachar (1990), How to introduce contiguity in correspondence analysis? Application to image segmentation (French), Statistique et Analyse des Donnees, 15, 61-92. Faust K. (2005) Using Correspondance Analysis for Joint Displays of Affiliation Networks, in: Models and Methods in
Social Network Analysis, Carrington P., Scott J. & Wasserman S. (Eds.), Cambridge University Press, Cambridge, 117-147.
Freeman, L. C. (2005). Visualizing Social Networks, in: Models and Methods in Social Network Analysis, Carrington P., Scott J. & Wasserman S. (Eds.), Cambridge University Press, Cambridge, 117-147. Giordano, G., Vitale, M.P. (2011). On the use of external information in social network analysis. Advances in Data
Analysis and Classification, 5, pp.95-112. Lebart L. (1969) Analyse statistique de la contiguité. Publications de l’ISUP, 81–112. Lebart L. (2006) Assessing self organizing maps via contiguity analysis, Neural Networks 19:847 – 854, Elsevier
Science Ltd. Oxford, UK. Tukey, J.W. (1977), Exploratory Data Analysis, Addison-Wesley, Reading. Wasserman S., Faust K., (1989) Canonical Analysis of the Composition and Structure of Social Networks,
Sociological Methodology: 19, pp. 1-42.
Main references
16
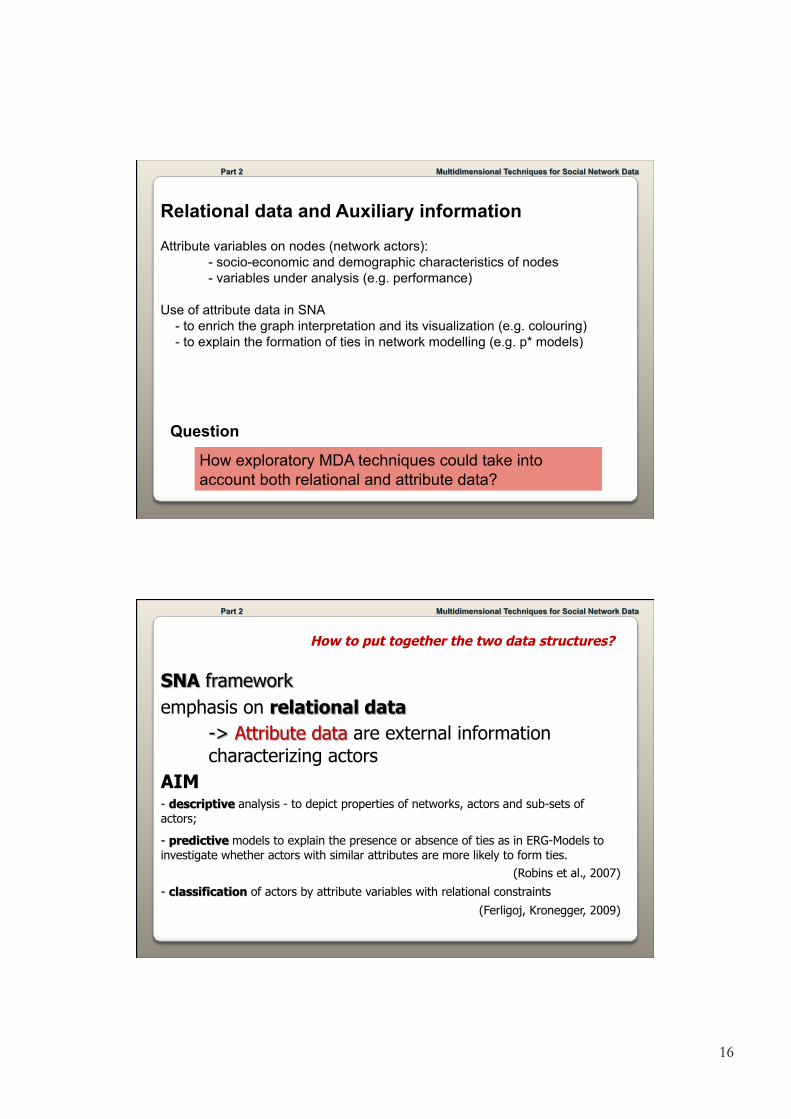
Relational data and Auxiliary information
Attribute variables on nodes (network actors): - socio-economic and demographic characteristics of nodes - variables under analysis (e.g. performance)
Use of attribute data in SNA - to enrich the graph interpretation and its visualization (e.g. colouring) - to explain the formation of ties in network modelling (e.g. p* models)
How exploratory MDA techniques could take into account both relational and attribute data?
Question
How to put together the two data structures?

17
Notation and Definition
A (nxp) affiliation matrix (binary); n actors; p events aij = 1 -> i-th actor is present at the j-th event (i=1, …, n; j=1, …, p)
X (nxm) n actors; r nominal variables expanded into m dummy variables xik = 1 -> i-th actor belongs to the k-th category (i=1, …, n; k=1, …, m)
Z’(pxq) p events; s nominal variables expanded into q dummy variables zhj = 1 -> j-th event belong to the h-th category (h=1, …, q; j=1, …,p)
18
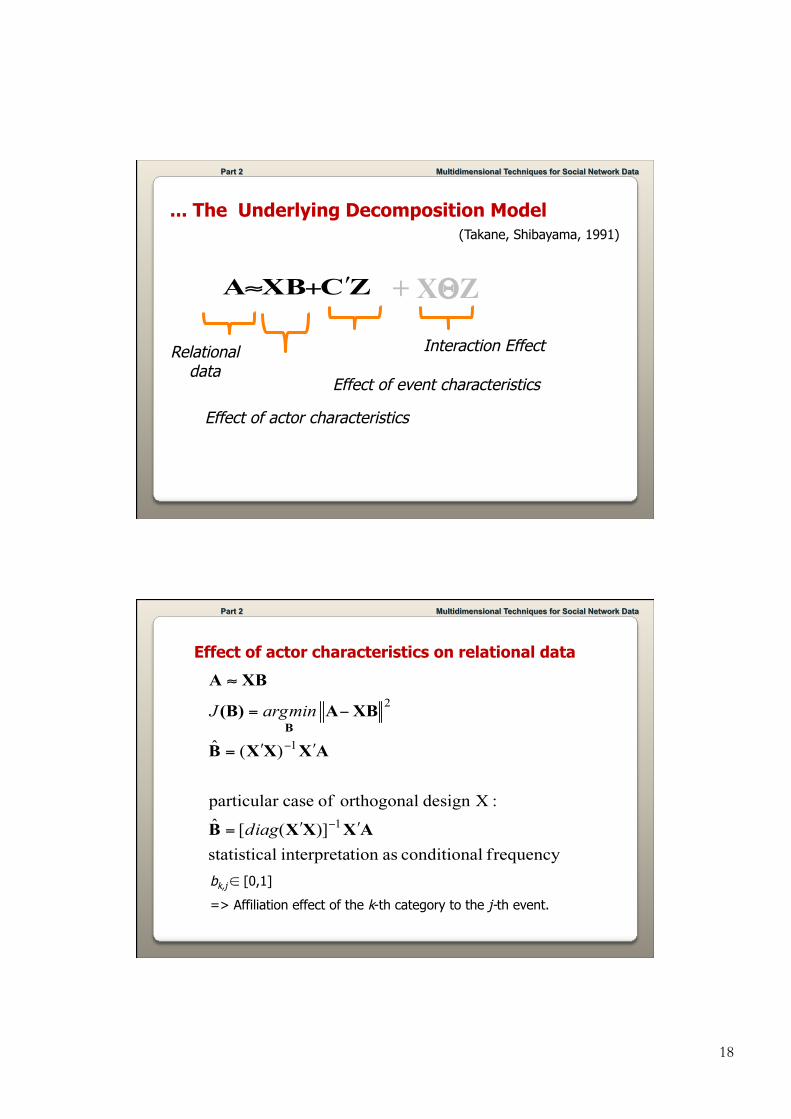
... The Underlying Decomposition Model (Takane, Shibayama, 1991)
Relational data
Effect of actor characteristics
Effect of event characteristics
Interaction Effect
+ XΘZ
bk,j ∈ [0,1]
=> Affiliation effect of the k-th category to the j-th event.
Effect of actor characteristics on relational data

19
Effect of events characteristics in determining the presence of actors at events
Chi affiliation effect due to the presence of actors at event given the h-th event’s category

20
Working Example Collaboration network in an e-learning course
Expected results - Students with a given skill should attend to peculiar weekly practices
obs. network structure could be influenced by actors characteristics
- Weekly practices requiring particular skills should attract different students obs. network structure could be influenced by events characteristics
Data structure
A affiliation matrix where the 18 actors (students) participated in 12 events (weekly practices);
X attribute matrix - 2 nominal variables: gender (Male, Female); skills (technical, math, humanities) observed on 18 students;
Z attribute matrix - 1 nominal variable: theme of practices (reporting, logical, technical) observed on 12 events.
Data structure

21
From A to G: Clustering and Blockmodeling of G
Hierarchical clustering of network positions and Generalized blockmodeling
Analysis of Z and A
C (q x n)
Results …
Events’ categories and actors

22
Analysis of Z and A To derive from the weighted adjacency
where the generic element of GZ is the weight of the tie between a pair of actors related to their presence at the same categories of events
Clustering and Blockmodeling
Analysis of X and A B (m x p)
1 = each column maximum value r x p = row marginal maximum theoretical value
r x m = maximum value of the columns marginal of B (all n actors are present at the j-th event)
p = maximum value of rows marginal of B (a category fully characterises all p events)
Events and actors’ attributes

23
whose generic element weights the joint presence at events of actors having similar characteristics. maximum theoretical value in GX
If a homophily effect is present, then GX shows a weighting system coherent with the capability of all actors characteristics to jointly explain the participation to events.
Analysis of X and A
Clustering and Blockmodeling
Real data set: Scientific collaboration among scientists
… the process generating ties (e.g. co-authorship) in a collaboration network is somewhat affected by attribute data on authors (academic position, research specialty, geographical proximity … ) or on publications (type, scientific relevance, …).
Expected results:
- authors with different academic positions in their institution (phd. student, assistant professor, full professor) are more likely to collaborate in writing a publication than authors sharing the same position;
- authors who work in the same research specialty (e.g. statisticians) are more likely to collaborate in writing a publication than authors from different specialties.
24
Data source: 81 scientists involved in the Economics & Statistics field in an academic institution in Southern Italy
A = affiliation matrix 81 x 358 81 scientists, 358 publications and the cells report 1 if two authors co-authored a paper
Relational Data
Data vectors Definition (Nominal Variables )
For authors
For publications:
(MIUR database and Local Research Archive)
X = matrix 81 x 4 4 columns dummy coding of the 2 nominal variables academic position and research specialty (assistant professor vs full professor; statistics vs economics)
Z = matrix 4 x 358 4 rows dummy coding of the 2 nominal variables type and number of author in publication (article – no article; single vs co-authored publication)
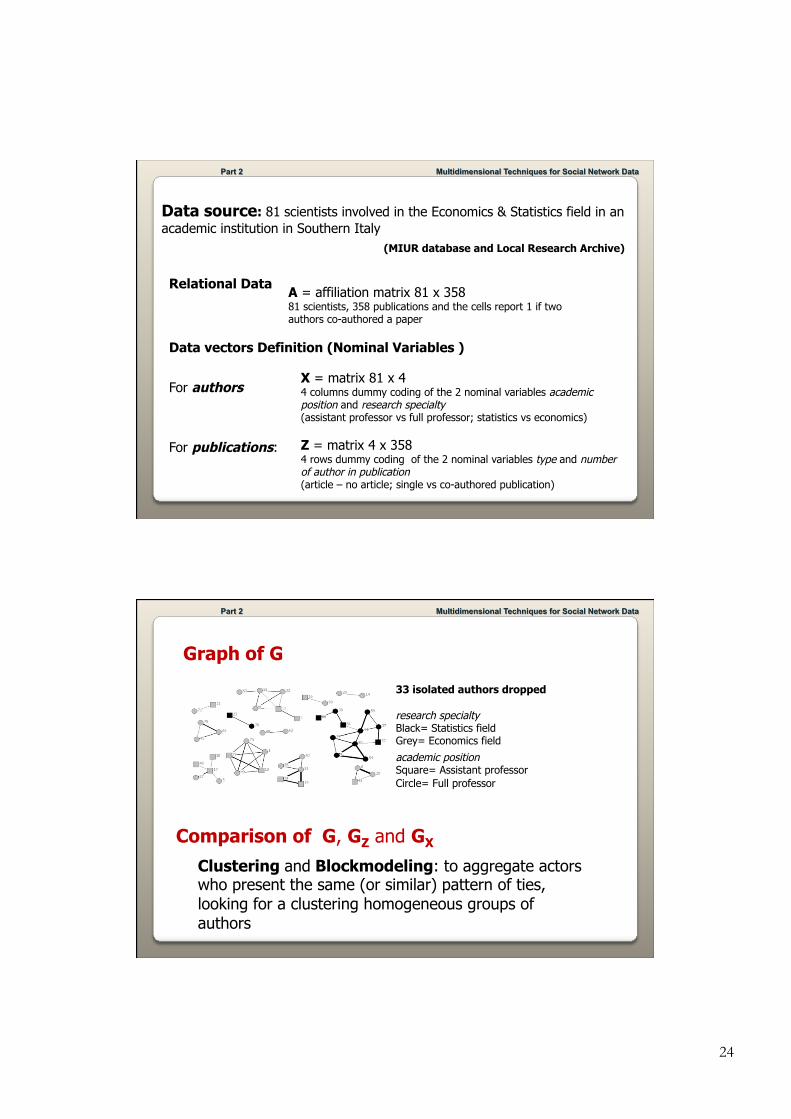
Clustering and Blockmodeling: to aggregate actors who present the same (or similar) pattern of ties, looking for a clustering homogeneous groups of authors
Graph of G
33 isolated authors dropped
research specialty Black= Statistics field Grey= Economics field academic position Square= Assistant professor Circle= Full professor
Comparison of G, GZ and GX

25
Clustering results for G
Results …
Clustering results for GZ
Results …

26
Clustering results for GX
Results …
Comparison of partition in G, GZ and GX
Clusters
Authors attributes

27
Individual Judgements
S1muli
A3ributes Levels
Preference Ra1ngs
Y = XB + err
B = (X’X)-‐ X’Y
Par1cular case:
0
a1, a2, ………, an
a1 a2 . . . an
{0,1} The Adjacency Matrix A will be here considered in the case of undirected, unvalued graphs
A is Binary (presence/absence) A is Symmetric (undirected graph)
The row marginal is the “degree” of each node
“[…] It has been found that in many networks, the distribution of actors' degrees is highly skewed, with a small number of actors having an unusually large number of ties. Simulations and analytic work have suggested that this skewness could have an impact on the way in which communities operate, including the way information travels through the network and the robustness of networks to removal of actors”.
E. J. Newman, D. J. Watts, and S. H. Strogatz