Outline and Description of E3ME-Asia model - …profile-ac.jp/lee/top/20171019/4_2_e3me_ description...
67
Outline and Description of E3ME-Asia model Presented by Soocheol Lee (Meijo University, Japan) Academia Sinica October 6, 2017
Transcript of Outline and Description of E3ME-Asia model - …profile-ac.jp/lee/top/20171019/4_2_e3me_ description...

Outline and Description of E3ME-Asia model
Presented by
Soocheol Lee (Meijo University, Japan)
Academia SinicaOctober 6, 2017
1.Introduction to E3 modelling

“Good modelling involves the combination of best econometric practice, coherent economic theory and knowledge of data. Inevitably conflicts can arise between these three factors, and the modeller will need to exercise judgement in the weight that is attached to the econometric evidence, its consistency with theory and the requirement to model properly the time series observations”
Sean Holly (2013)

1.1 Examples of models
General
Non-Equilibrium
Partial
Equilibrium
GEM-E3*WorldScan*
E3ME*GINFORS*
PRIMES (energy)TIMES (energy)
ASTRA (transport)POLES (energy)
* These models cover the World

1.2 Equilibrium and Non-Equilibrium
• There are several different ways of characterising this distinction:• supply or demand driven
• long or short term
• theoretical or empirical
•Not all are completely accurate, especially now as the two approaches are coming closer together

1.3 Equilibrium and Non-Equilibrium (cont.)
• In the 1960s and 1970s the macroeconometric approach dominated
• Holly (2013) provides reasons for a ‘backlash’ against the approach:• neglect of monetary influence
• the Lucas Critique and rational expectations
• lack of micro-foundations
• inadequate treatment of error processes
• failure to use insights from optimal control theory
• time-inconsistency of discretionary policy
• The focus of research moved to CGE approaches

1.4 Long and Short-Term Analysis?• In conceptual terms the distinction is linked to the ‘neo-
classical synthesis’:• aggregate demand may be a short-run constraint
• but long-term growth rates determined by supply-side factors
• Attempts have been made to create CGE models suitable for short-term assessment (DSGE)• these are now widely used in central banks
• Modern econometrics largely supports long-run analysis
• CGE models, difficult to catch low carbon technology innovation and its effective demand to influence good impact on the economy
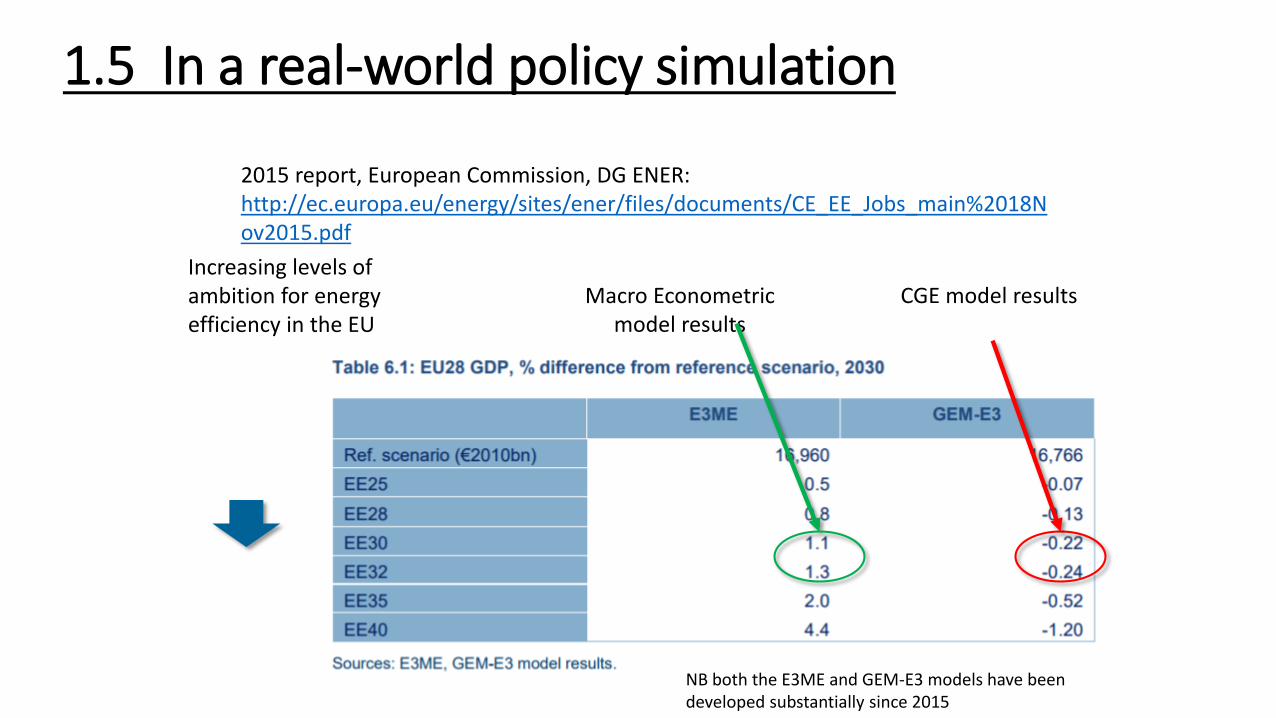
1.5 In a real-world policy simulation
Macro Econometric model results
CGE model resultsIncreasing levels of ambition for energy efficiency in the EU
2015 report, European Commission, DG ENER:http://ec.europa.eu/energy/sites/ener/files/documents/CE_EE_Jobs_main%2018Nov2015.pdf
NB both the E3ME and GEM-E3 models have been developed substantially since 2015

GEM-E3 E3ME
• perfect competition
• constant returns to scale
• equilibrium solution
• full employment
• projection based on one year's data
• guess-estimated parameters
• varying competition over sectors
• varying returns to scale
• product supply-demand balance
• unemployment
• projection based on 40+years' data used for econometric estimation
1.6 comparing GEM-E3(CGE) and E3ME(Macro Econometirc)

1.7 Model Linkages
Cambridge Econometrics and SERI (2011), for DG Environment

2.E3ME Description

12
2.1 E3ME Model(Energy-Environment-Economy Macro Econometric Model)
Macro-Econometric Modeldeveloped by Cambridge EconometricsReinforced Asian sector by collaboration work withREEPS(Research group of East Asian Environmental Policy Studies)in Japan as E3ME-Asia
・Demand driven・No equilibrium, Non optimization
・Four East Asian regions are in the model・Based on data from past 40 years and OECD/IEA forecast

1975
1978 Spin-off from the University of Cambridge Department of Applied Economics • Origins in the ‘Growth
Project’ led by Nobel Laureate Prof Sir Richard Stone
• pioneered the development of detailed sectoral modelling in an input-output framework MDM1980
1985
1990
1995
2000
2005
2010
2003 CE 25th anniversary. Terry Barker sets up charitable trust fund to ensure CE's independence and principles. New Thinking in Economics:‘to advance education in the field of economics for the benefit of the public’
1993 Start of part-EC funded research project to build E3ME
Today 40 staff based in Cambridge. International reputation in the application of whole-economy, sectoral modelling, particularly the global E3ME model
Early 1990s Expansion of scope of CE’s work to • European Regional• UK Energy,
Environment and Economy service
• More tailored project work
Company grows from 10 to 25 staff.
The move to more consultancy projects Product and model developmentsEarly stage of the company
1980s CE’s work focuses mainly on annual subscription services• UK Industrial service• UK Regional serviceand selected projects, notably the EC-funded HERMES project (in effect, a predecessor for E3ME)
2.2 History of E3METhe E3ME model and its predecessors have been around since 1970s and it is one of the most well-known econometric models in Europe and recently globally.
It is used for official analysis for the European Commission (including the recent Clean Energy Package and Climate and Energy Framework 2030).

・E3ME (world) models are:computer-based econometric modelsdeveloped by Cambridge University and Cambridge Econometrics…covering economy, energy and emissions……with detailed sectors (linked by IO tables)……and endogenous technological progress
・They can be used for forecasting but are typically used for policy analysis
… sometimes at national level, usually … international
2.3 E3ME Basic Model Structures:
●
●
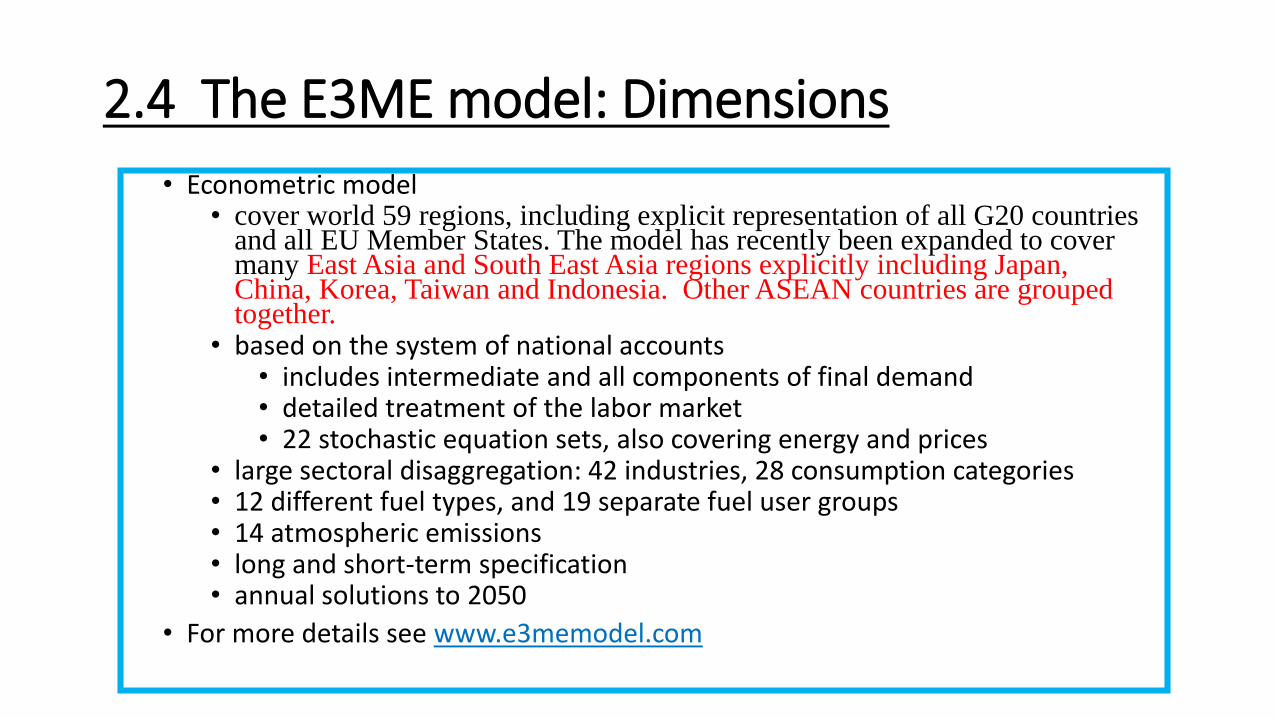
2.4 The E3ME model: Dimensions
• Econometric model• cover world 59 regions, including explicit representation of all G20 countries
and all EU Member States. The model has recently been expanded to cover many East Asia and South East Asia regions explicitly including Japan, China, Korea, Taiwan and Indonesia. Other ASEAN countries are grouped together.
• based on the system of national accounts• includes intermediate and all components of final demand• detailed treatment of the labor market• 22 stochastic equation sets, also covering energy and prices
• large sectoral disaggregation: 42 industries, 28 consumption categories• 12 different fuel types, and 19 separate fuel user groups • 14 atmospheric emissions • long and short-term specification• annual solutions to 2050
• For more details see www.e3memodel.com
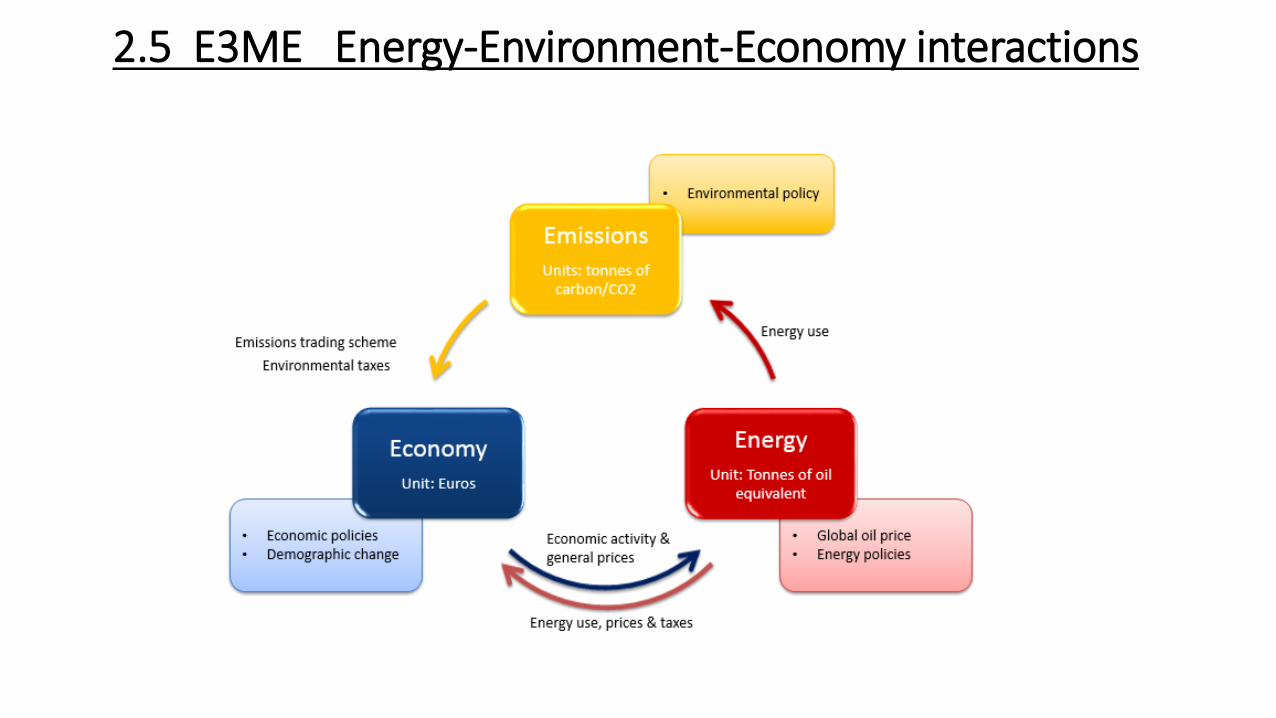
2.5 E3ME Energy-Environment-Economy interactions

FTT:Transportation
FTT:Power
FTT:Industry
2.6 E3ME Engineering-Energy-Environment-Economy interactions

2.7 Method of analysis :The E3ME-FTT integrated assessment model
• Economic'policies'
• Demographic'
change'
• Global'oil'price'• Energy'policies'
• Environmental'policies'
• Resource'efficiency'policies'
Emissions'trading'scheme'
Environmental'taxes'
Energy'use'
Energy'use,'prices'&'taxes'
Economic'ac=vity'&'general'prices'
e.g.'industrial'emissions'of'SF6'
Technology*
Energy'use'
Energy'prices''&'costs'
investment'
Funding'R&D'
Pollu=on'abatement'equipment'
Material'use,''IO,'material'tax'
Economic'ac=vity'&'general'prices'
Energy'demand'
Emissions*
Units:'tonnes'of'carbon/CO2''
Energy*
Unit:'Tonnes'of'oil'equivalent'
Materials''Unit:'tonnes'
Economy*
Unit:'Euros'
2.8 Treatment of Technology
• It is now generally accepted that technology should be endogenous in modelling
• There are two ways of doing it• explicitly (bottom-up, partial approaches)
• implicitly (top-down, general approaches)
• There will always be a limitation that it is not possible to predict all future technologies

2.9 Top-down and Bottom-up Modelling
• These terms mean different things in different areas of modelling
• In energy modelling:• bottom-up models are specified by technology, they
typically come from an engineering background
• top-down models are based on economic relationships
• As it is not possible to define all technologies explicitly, bottom-up models are partial

2.9.1Comparison of top-down and bottom-up modelling methodology
Bottom-up Top-down
Classifications employed Engineering-based Economics-based
Treatment of capital Precise description of capital equipment
Homogenous and abstract concept
Motive force Discount rate employed by agents
Income and priceelasticities
Perception of market Market imperfection and barriers
Perfect market
Potential efficiency improvements
Usually high : costless improvement
Usually low: constraint on economy

22
E3ME
FTT・Fuel consumption・Investment in
new power source・Electricity price
・Electricity demand・Fuel demand
・CO2 emission・Investment spill over・GDP, Employment
2.10 FTT: Power Link between E3ME and FTT
Post-Keynesian,
Post-Schumpeterian
(evolutionary)

2.11 FTT Power and E3ME Model
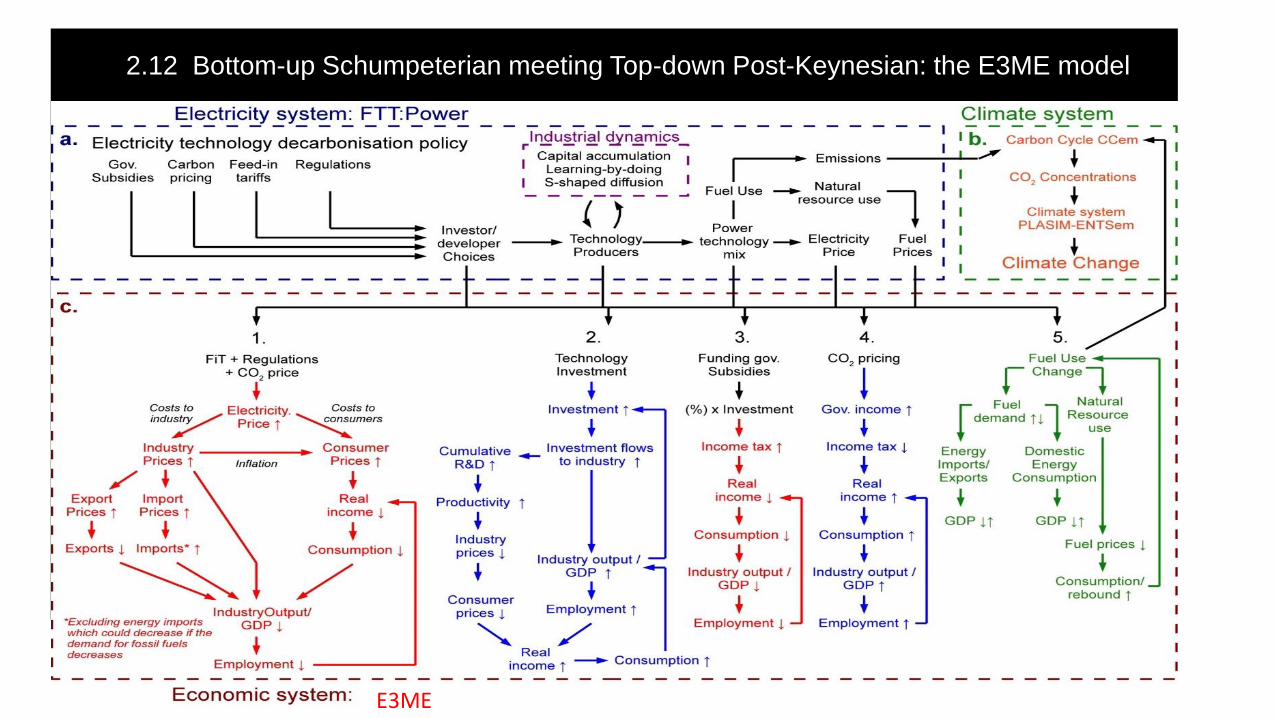
2.12 Bottom-up Schumpeterian meeting Top-down Post-Keynesian: the E3ME model
E3ME

25
2.13 FTT: Power (1)Probabilistic decision makingbetween two technologies
Probabilistic Choice Matrix:
J.-F. Mercure, Energy Policy 48, 799-811 (2012)
[𝐹𝑖𝑗]
26
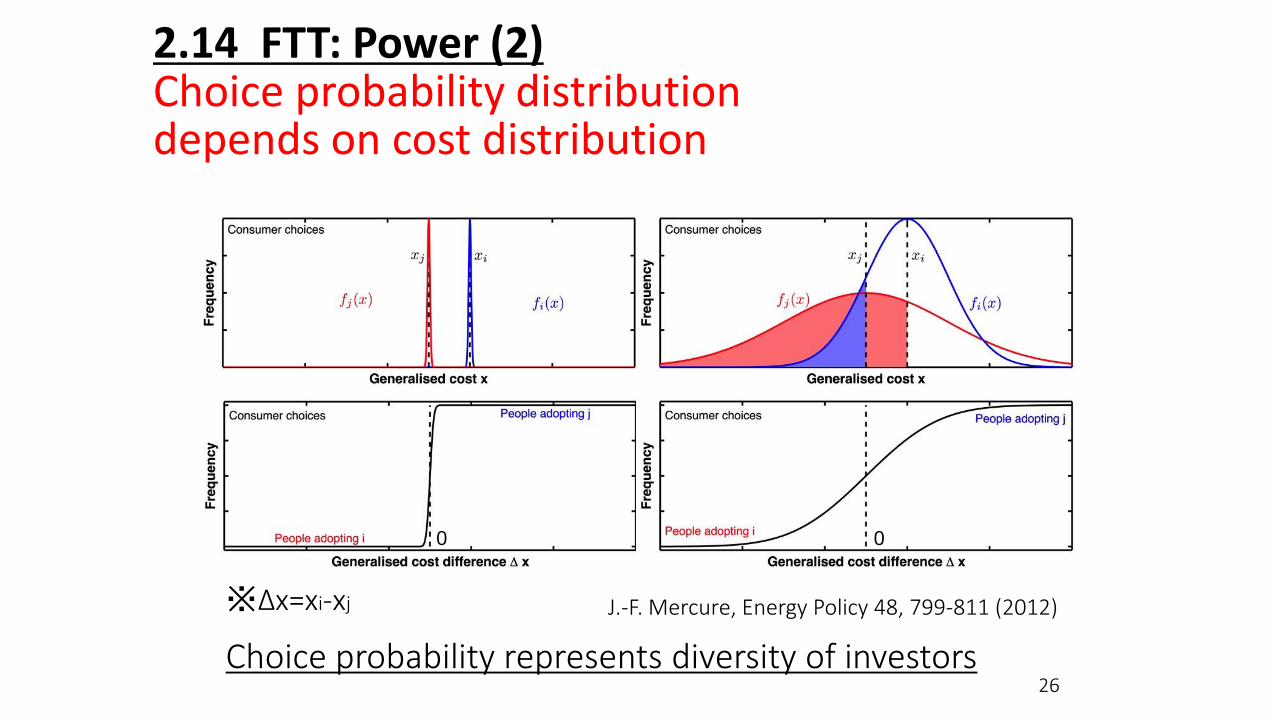
※Δx=xi-xj
0 0
Choice probability represents diversity of investors
J.-F. Mercure, Energy Policy 48, 799-811 (2012)
2.14 FTT: Power (2)Choice probability distributiondepends on cost distribution

Modelling technology substitution
Coal
CCGT
Hydro
Wind
PV
BIGCC…
t = 1
…
J.-F. Mercure, Energy Policy 48, 799-811 (2012)
Coal
CCGT
Hydro
Wind
PV
BIGCC…
t = 3
Substitutions
Fijéë ùû
Coal
CCGT
Hydro
Wind
PV
BIGCC…t = 2
Substitutions
Fijéë ùû

28
Coal
CCGT
Hydro
Wind
PV
BIGCC…
Coal
CCGT
Hydro
Wind
PV
BIGCC…t
Coal
CCGT
Hydro
Wind
PV
BIGCC…
Substitutions
=j
åD
tJ.-F. Mercure, Energy Policy 48, 799-811 (2012)
[𝐹𝑖𝑗]
2.15 FTT: Power (3)Aggregate technology substitution

29
tFAFASSSj
jijiijijjii
Si : Share of technology i
Aij : Life time of technology i and lead time of technology j
(matrix of substitution frequencies)
Fij : Probability that technology i would be chosen between i and j
(probabilistic choice matrix)
t : time
J.-F. Mercure, Energy Policy 48, 799-811 (2012)
2.16 FTT: Power (4)Technology shares determined byAggregating every choices
30
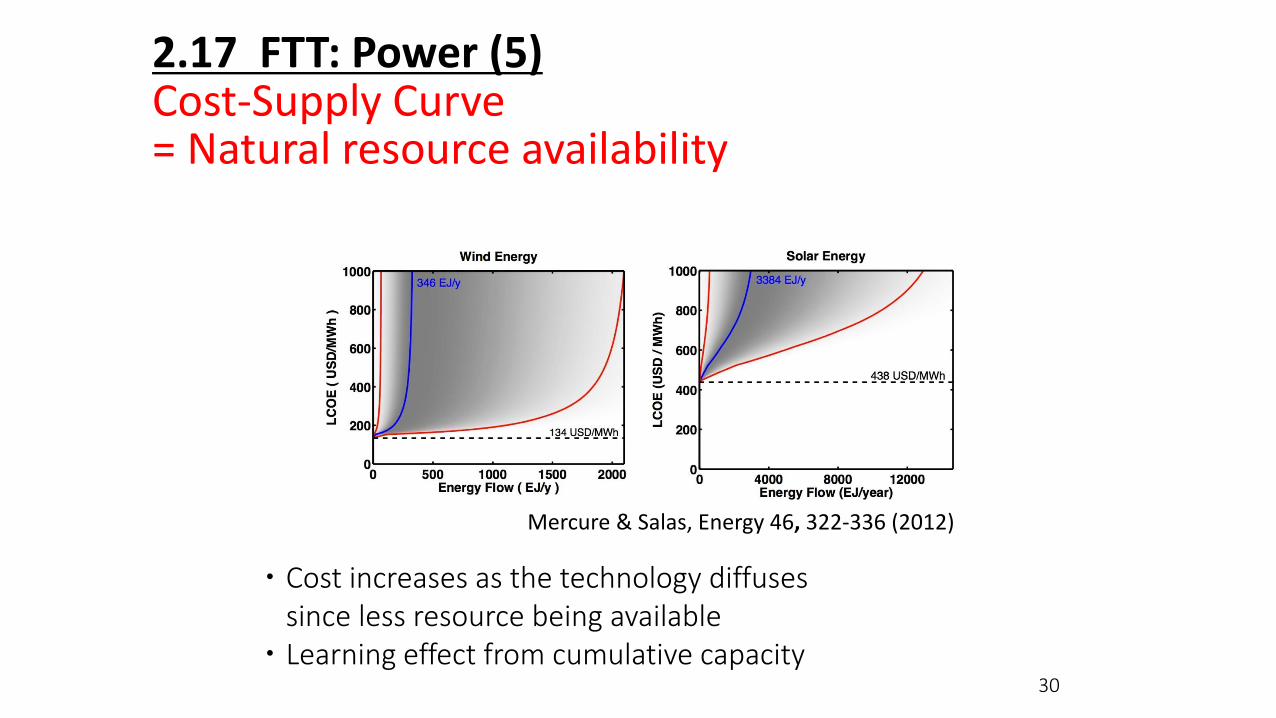
Mercure & Salas, Energy 46, 322-336 (2012)
・Cost increases as the technology diffusessince less resource being available
・Learning effect from cumulative capacity
2.17 FTT: Power (5)Cost-Supply Curve= Natural resource availability

2.18 Cost-supply curves for renewables

2.19 Cost-quantity curves for fossil & nuclear fuels

2.20 E3ME-FTT Transport
car salesdistance driven
incomecar price fuel price
FTT-Transport
car demand by technology
average car price
road transport fuel demand
road transport CO2
- fuel tax- carbon tax
E3ME consumption equation
FTT transport policies*
IO feedback
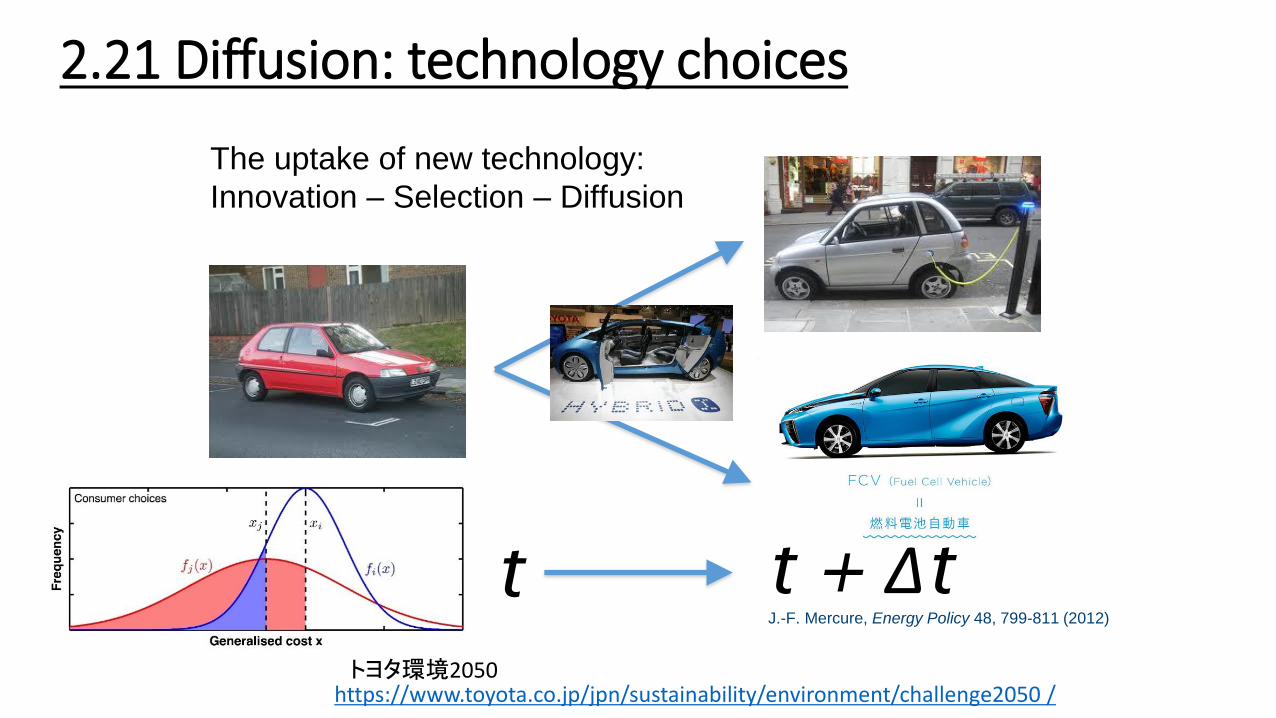
2.21 Diffusion: technology choices
t
The uptake of new technology:
Innovation – Selection – Diffusion
J.-F. Mercure, Energy Policy 48, 799-811 (2012)
t t + Δt
https://www.toyota.co.jp/jpn/sustainability/environment/challenge2050 /トヨタ環境2050

15.$UK Prices'of'cars'(USD/km)Std'of'price'' fuel'cost'(USD)std'fuel'cost O&M'costs'(USD)O&M'costs'(std)'Discount'ratelifetime energy'use'(MJ/km)Distance'travelled'per'year'occupancy'rate'Capacity'factor'C'(initial) CO2EmissionsSeats/Veh Learning'exponent
Petrol$Econ 18683.00 4396.00 0.095 0.013 0.038 0.020 15% 12 1.583 12104 0.375 4539.0 1.00744 109.732966 4 R0.0144996Petrol$Mid 32185.00 8164.00 0.123 0.014 0.051 0.030 15% 12 2.064 12104 0.375 4539.0 0.72093 143.044759 4 R0.0144996
Petrol$Lux 99538.00 49455.00 0.202 0.057 0.064 0.030 15% 12 3.379 12104 0.375 4539.0 R0.216744 234.16231 4 R0.0144996
Advance$Petrol$Econ 18683.00 4396.00 0.076 0.013 0.038 0.020 15% 12 1.425 12104 0.375 4539.0 1.00744 98.759669 4 R0.0740006
Advance$Petrol$Mid 32185.00 8164.00 0.110 0.014 0.051 0.030 15% 12 1.858 12104 0.375 4539.0 0.72093 128.740283 4 R0.0740006
Advance$Petrol$Lux 99538.00 49455.00 0.161 0.057 0.064 0.030 15% 12 3.041 12104 0.375 4539.0 0.216744 210.746079 4 R0.0740006
Diesel$Econ 22608.00 3297.00 0.069 0.010 0.038 0.020 15% 12 1.351 12104 0.375 4539.0 0.3 100.104906 4 R0.0144996
Diesel$Mid$ 33755.00 7065.00 0.077 0.015 0.051 0.030 15% 12 1.581 12104 0.375 4539.0 0 117.12274 4 R0.0144996
Diesel$Large 54793.00 14601.00 0.118 0.025 0.064 0.040 15% 12 2.104 12104 0.375 4539.0 R0.441858 155.926763 4 R0.0144996
Advance$Diesel$Econ 22608.00 3297.00 0.084 0.010 0.038 0.000 15% 12 1.216 12104 0.375 4539.0 0.3 90.0944151 4 R0.0740006
Advance$Diesel$Mid$ 33755.00 7065.00 0.095 0.015 0.051 0.000 15% 12 1.423 12104 0.375 4539.0 0 105.410466 4 R0.0740006
Advance$Diesel$Large 54793.00 14601.00 0.095 0.025 0.064 0.000 15% 12 1.894 12104 0.375 4539.0 R0.441858 140.334087 4 R0.0740006
CNG$Econ 21485.45 1000.00 0.048 0.055 0.039 0.020 15% 12 1.508 12104 0.375 4539.0 0.627906 84.5988 4 R0.0144996
CNG$Mid 37012.75 3000.00 0.071 0.069 0.056 0.030 15% 12 2.210 12104 0.375 4539.0 0.321858 123.981 4 R0.0144996
CNG$large 114468.70 5000.00 0.082 0.076 0.066 0.040 15% 12 2.548 12104 0.375 4539.0 R0.78 142.9428 4 R0.0144996
Hybrid$Econ 29202.00 2826.00 0.084 0.003 0.039 0.030 15% 12 1.414 12104 0.375 4539.0 R0.302328 97.9758621 4 R0.1520031
Hybrid$Mid 34540.00 6594.00 0.073 0.009 0.056 0.040 15% 12 1.216 12104 0.375 4539.0 R0.72 84.2592414 4 R0.1520031
Hybrid$Lux$ 78343.00 9263.00 0.124 0.017 0.066 0.040 15% 12 2.078 12104 0.375 4539.0 R0.78093 144.024517 4 R0.1520031EV$Econ 10990.00 157.00 0.000 0.000 0.046 0.040 15% 12 0.210 12104 0.375 4539.0 1.32558 0 4 R0.1520031
EV$Mid 44745.00 1256.00 0.000 0.000 0.065 0.050 15% 12 0.540 12104 0.375 4539.0 0 0 4 R0.1520031
EV$Lux 89961.00 2355.00 0.000 0.000 0.080 0.060 15% 12 0.580 12104 0.375 4539.0 R3 0 4 R0.1520031
2$Wheelers$Motorcycle$Econ$(<500cc)3808.00 1326.00 0.040 0.003 0.030 0.030 15% 7 0.676 6052 0.55 3328.6 2.2693 46.8324621 2 R0.0144996
2$Wheelers$Motorcycle$Lux$(>500cc)14932.00 5760.00 0.127 0.039 0.030 0.030 15% 7 2.124 6052 0.55 3328.6 0.906978 147.159745 2 R0.0144996Adv$Mot 3808.00 1326.00 0.040 0.095 0.030 0.030 15% 7 0.676 6052 0.55 3328.6 2.2693 46.8324621 2 R0.0144996
Adv$Mot$ 14932.00 5760.00 0.095 0.095 0.030 0.030 15% 7 2.124 6052 0.55 3328.6 0.906978 147.159745 2 R0.0144996
53 regions, 25 technologies
2.22 The diffusion of vehicle technology
Mercure & Lam, In preparation (2016)
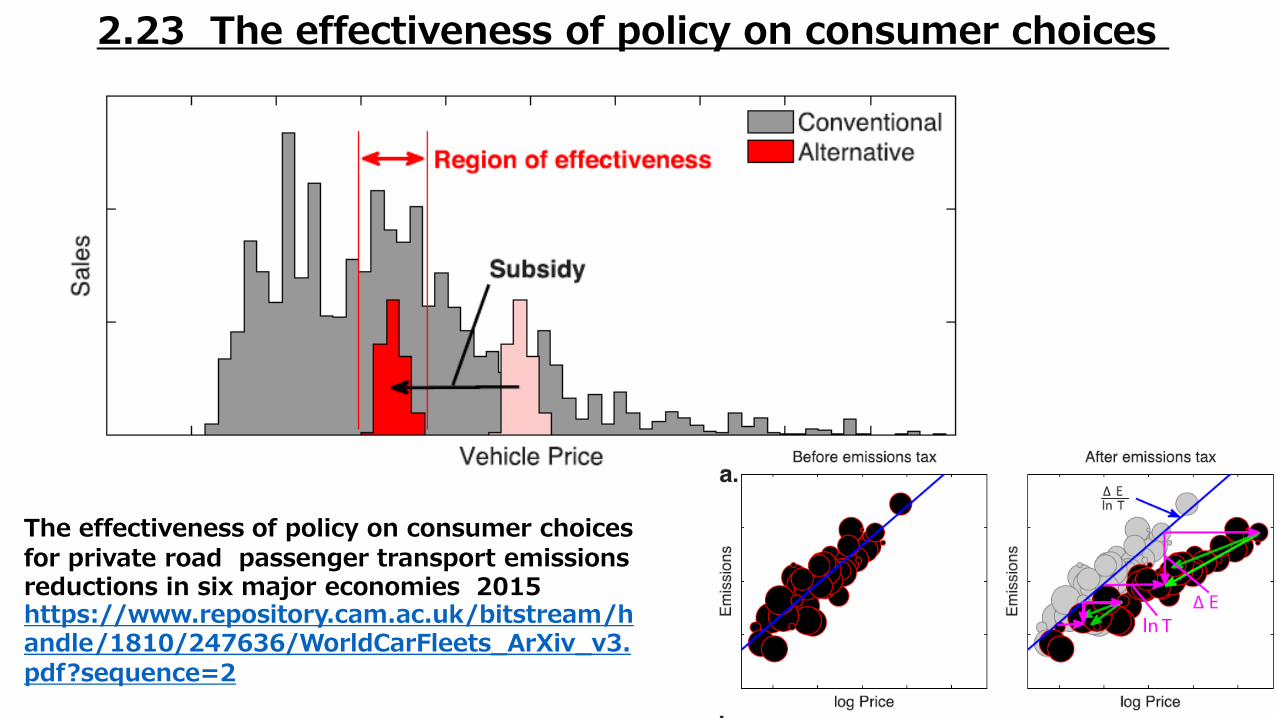
The effectiveness of policy on consumer choices for private road passenger transport emissions reductions in six major economies 2015https://www.repository.cam.ac.uk/bitstream/handle/1810/247636/WorldCarFleets_ArXiv_v3.pdf?sequence=2
2.23 The effectiveness of policy on consumer choices
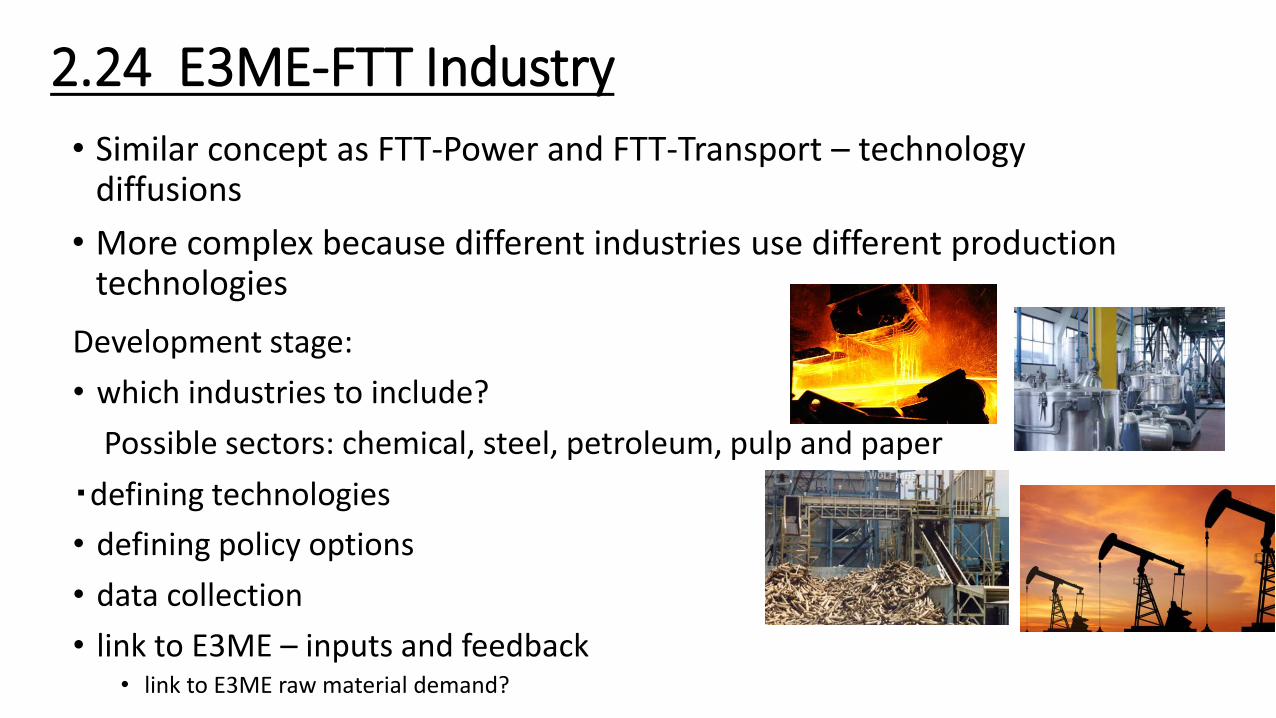
2.24 E3ME-FTT Industry
• Similar concept as FTT-Power and FTT-Transport – technology diffusions
• More complex because different industries use different production technologies
Development stage:
• which industries to include?
Possible sectors: chemical, steel, petroleum, pulp and paper
・defining technologies
• defining policy options
• data collection
• link to E3ME – inputs and feedback• link to E3ME raw material demand?

2.25 The FTT family of models
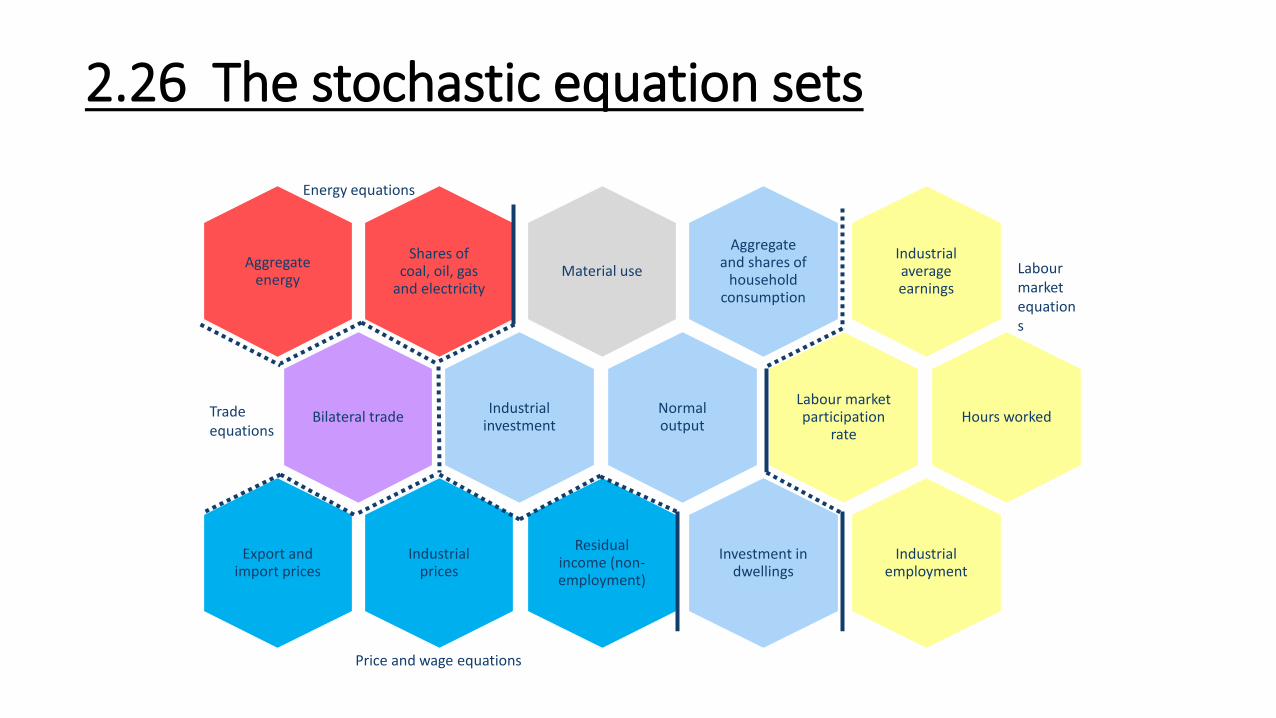
Aggregate and shares of
household consumption
Material use
Normal output
Labour market participation
rate
Investment in dwellings
Residual income (non-employment)
Industrialaverage earnings
Hours worked
Industrial employment
Shares of coal, oil, gas
and electricity
Aggregate energy
Bilateral tradeIndustrial
investment
Industrial prices
Export and import prices
Labour market equations
2.26 The stochastic equation sets
Energy equations
Price and wage equations
Trade equations

2.27 Exogenous variables
• Population
• Natural resources (including coal, oil and natural gas, raw commodity price)
• Current and capital spending of government
• Tax rates and allowances
• Exchange rates
• Short- and long-term interest rates
• World prices of traded goods, e.g. crude oil
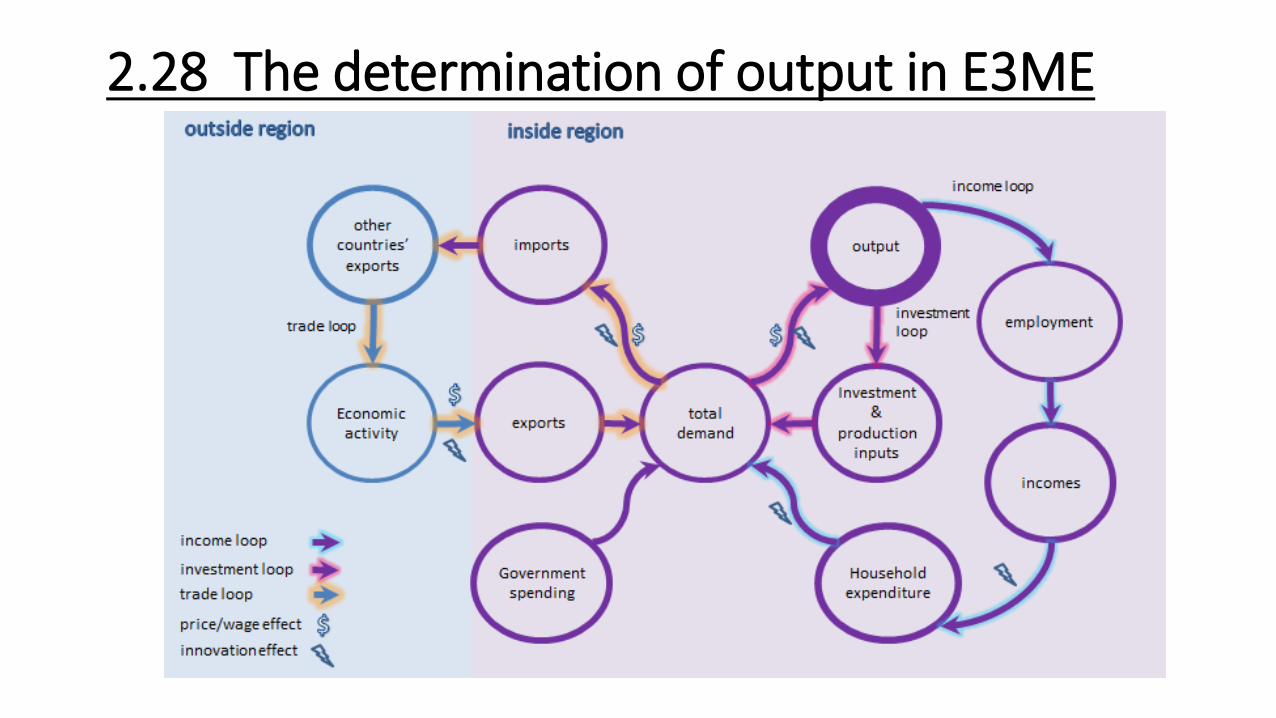
2.28 The determination of output in E3ME
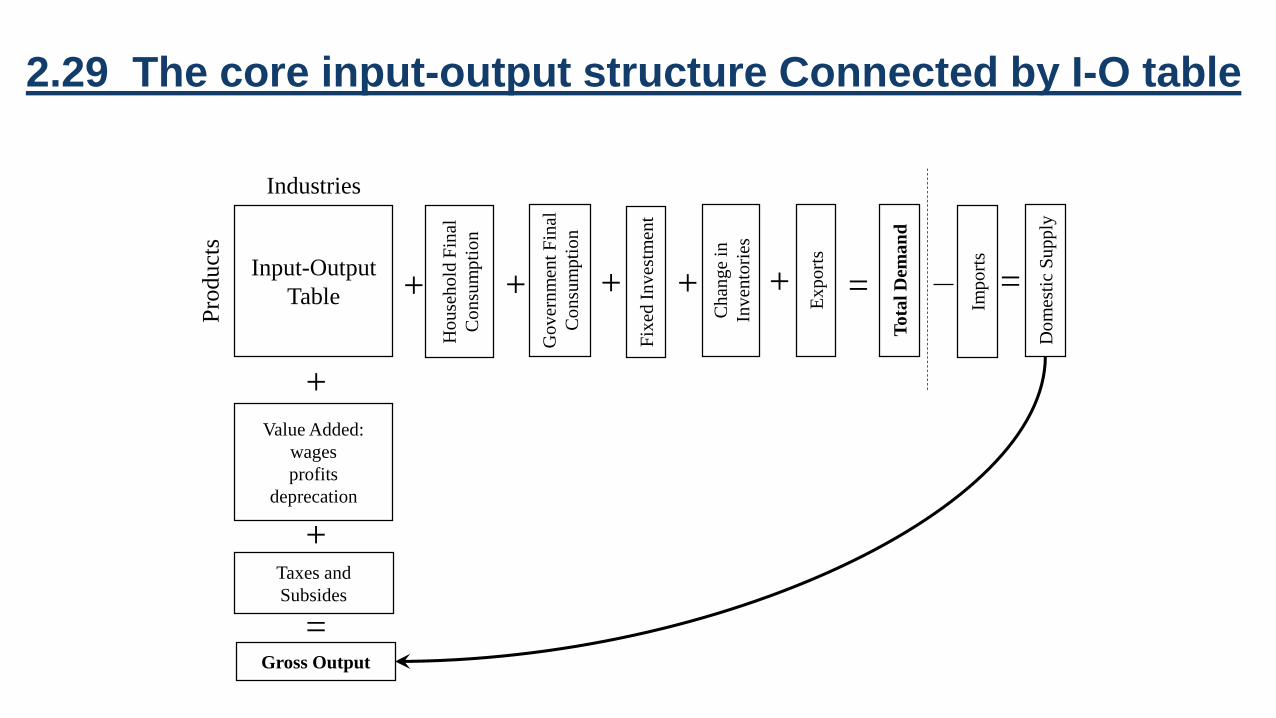
Input-Output
Table
IndustriesP
roduct
s
Ho
use
ho
ld F
inal
Co
nsu
mp
tio
n
Go
ver
nm
ent
Fin
al
Co
nsu
mp
tio
n
Fix
ed I
nv
estm
ent
Ch
ang
e in
Inv
ento
ries
Ex
po
rts
To
tal
Dem
an
d
Do
mes
tic
Su
pp
ly
Imp
ort
s
Value Added:
wages
profits
deprecation
Taxes and
Subsides
Gross Output
+ + + + +
+
+
=
==
2.29 The core input-output structure Connected by I-O table

2.30 Energy and emission classifications in E3ME Version 6
FU:23 (fuel users)
1. Power Generation
2. Own use
3. Hydrogen production
4. Iron & Steel
5. Non-ferrous Metals
6. Chemicals
7. Mineral Products
8. Ore-extraction
9. Food, Drink & Tob.
10. Tex., Cloth. & Foot.
11. Paper & Printing
12. Engineering etc
13. Other Industry
J:12 (fuels)
1. Hard coal
2. Other coal etc
3. Crude oil etc
4. Heavy fuel oil
5. Middle distillates
6. Other gas
7. Natural gas
8. Electricity
9. Heat
10.Combustible waste
11.Biofuels
12.Hydrogen
EM:14 (air emissions)
1. CO2
2. SO2
3. NOX
4. CO
5. Methane
6. Black smoke
7. VOC
8. Nuclear - air
9. Lead - air
10.CFCs
11.N2O (GHG)
12.HF6 (GHG)
13.PFC (GHG)
14.SF6 (GHG)
14. Construction
15. Rail Transport
16. Road Transport
17. Air Transport
18. Other Transport serv.
19. Households
20. Agriculture, forestry, etc.
21. Fishing
22. Other Final Users
23. Non-energy use
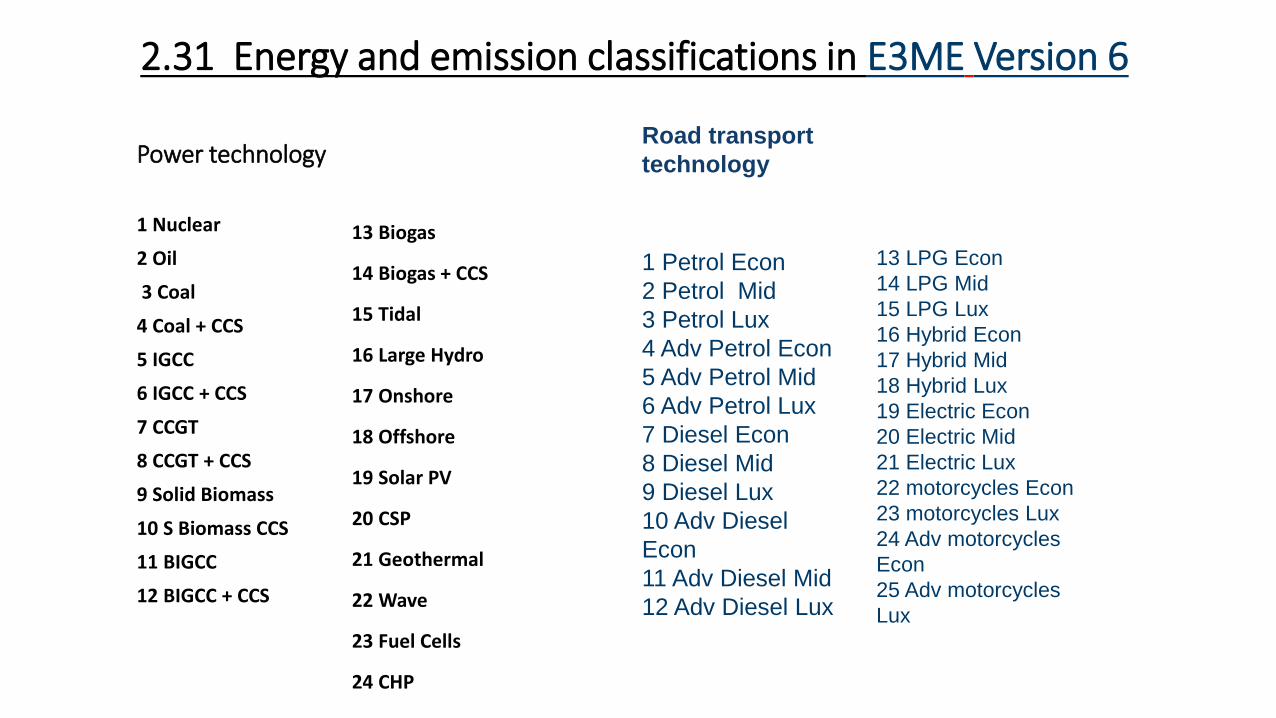
2.31 Energy and emission classifications in E3ME Version 6
Power technology
1 Nuclear
2 Oil
3 Coal
4 Coal + CCS
5 IGCC
6 IGCC + CCS
7 CCGT
8 CCGT + CCS
9 Solid Biomass
10 S Biomass CCS
11 BIGCC
12 BIGCC + CCS
Road transport
technology
1 Petrol Econ
2 Petrol Mid
3 Petrol Lux
4 Adv Petrol Econ
5 Adv Petrol Mid
6 Adv Petrol Lux
7 Diesel Econ
8 Diesel Mid
9 Diesel Lux
10 Adv Diesel
Econ
11 Adv Diesel Mid
12 Adv Diesel Lux
13 Biogas
14 Biogas + CCS
15 Tidal
16 Large Hydro
17 Onshore
18 Offshore
19 Solar PV
20 CSP
21 Geothermal
22 Wave
23 Fuel Cells
24 CHP
13 LPG Econ
14 LPG Mid
15 LPG Lux
16 Hybrid Econ
17 Hybrid Mid
18 Hybrid Lux
19 Electric Econ
20 Electric Mid
21 Electric Lux
22 motorcycles Econ
23 motorcycles Lux
24 Adv motorcycles
Econ
25 Adv motorcycles
Lux

3. How to run the E3ME model (v6 2016)
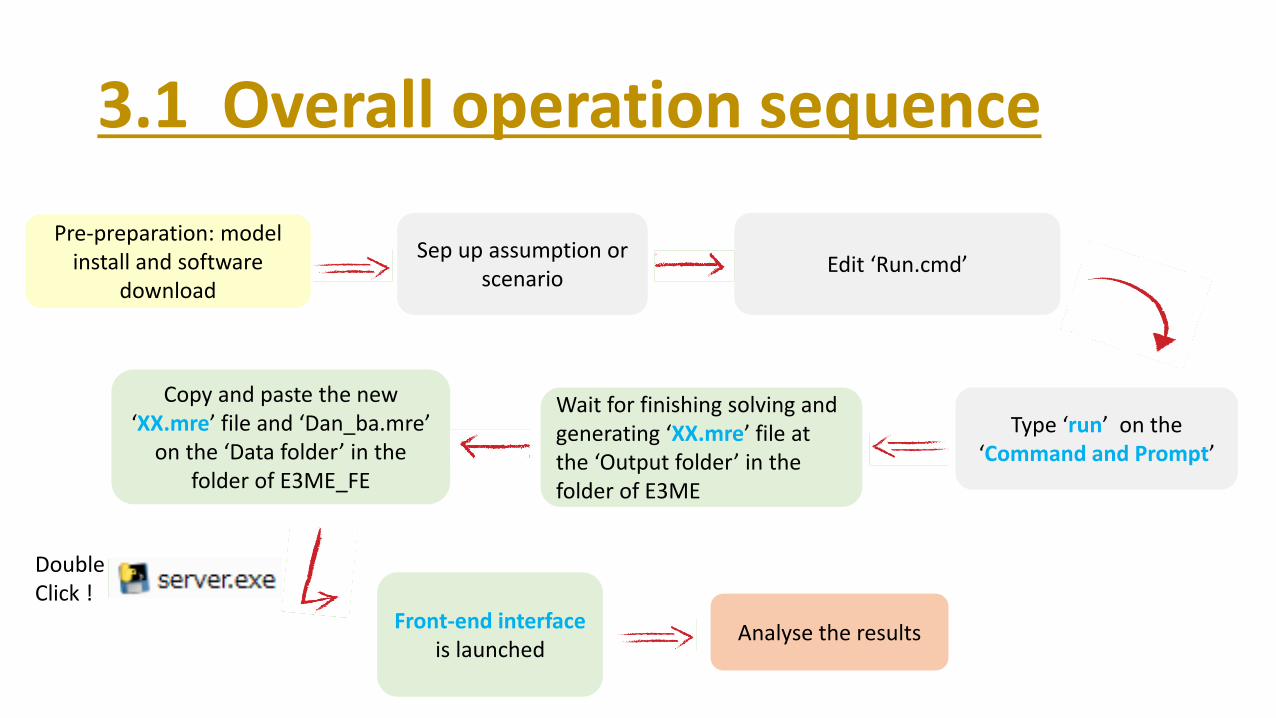
3.1 Overall operation sequence
Sep up assumption or scenario
Edit ‘Run.cmd’
Type ‘run’ on the ‘Command and Prompt’
Copy and paste the new ‘XX.mre’ file and ‘Dan_ba.mre’
on the ‘Data folder’ in the folder of E3ME_FE
Front-end interface is launched
Analyse the results
Double Click !
Wait for finishing solving and generating ‘XX.mre’ file at the ‘Output folder’ in the folder of E3ME
Pre-preparation: model install and software
download

3.2 Necessary model files to install
Install the two folders of E3ME and E3ME_FE in a local drive (C:) in your
computer

3.3 E3ME : storing all necessary model inputs
③
①
②

Folder or files Sub-folder or sub-files Explanations
In
AsnsAssumptions.csv
Assumptions.idiomYou can change the assumption with this file
Scenarios B_ETS.idiom You can change the scenarios with this file
XX.idiom
Enforecast.idiom You can change the period of simulation
DAN1.idiomDANA~E.idiom
Printing files for ‘.mre’ (results in figure)Printing files for ‘.tab’ (results in text)
OutputXX.tab Result in text form
XX.mre Result for graph in the front-end phage
RUN.cmdThis is solution script command file. For a new assumption or scenario, you need to make changes on this file before running the model.
3.4 In , Output, Run files

3.5 File requirements for E3ME

3.6 What are the files?

3.7 How to edit the model input
The model inputs are in text format and can be edited using OxEdit or Notepad.
• 1. Notepad
Find ‘Notepad’ under Accessories folder in the start-up menu.
• 2. OxEdit
Tip
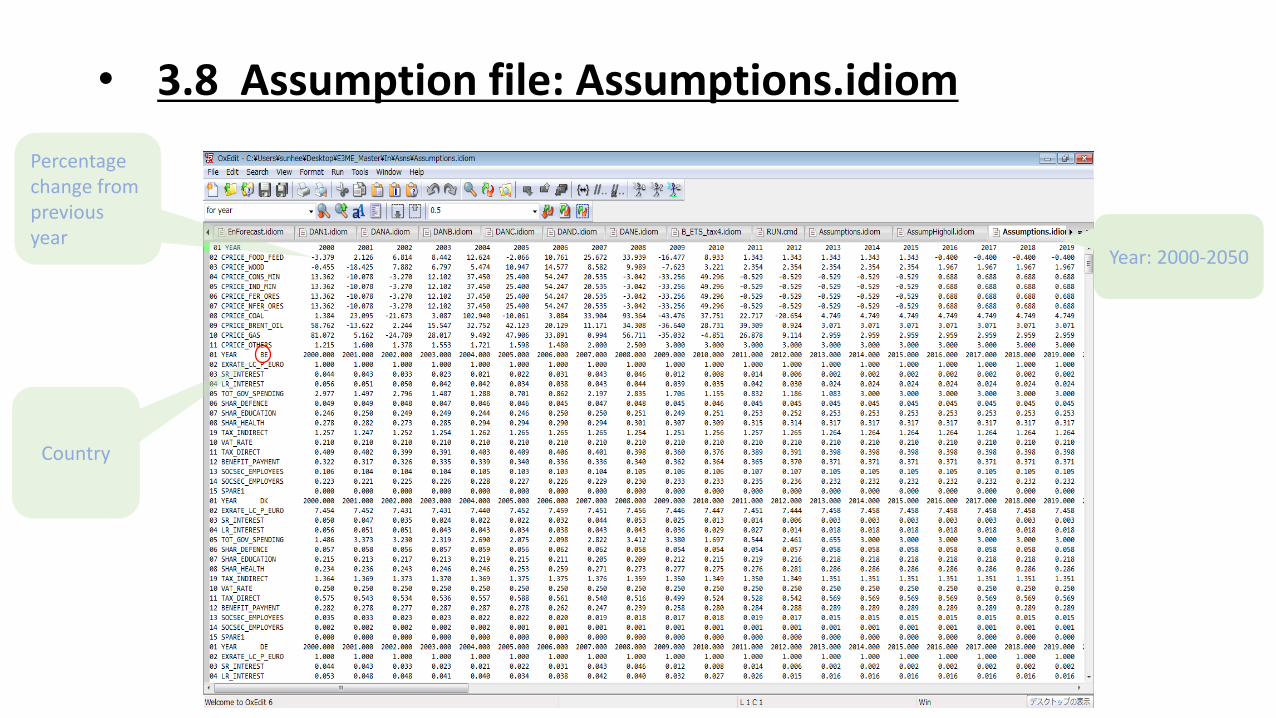
• 3.8 Assumption file: Assumptions.idiom
Year: 2000-2050
Country
Percentage change from previous year

CPRICE_FOOD_FEED Commodity Price: Food/ feed EXRATE_LC_P_EURO Exchange rate
CPRICE_WOOD Commodity Price: Wood SR_INTEREST Interest rate: short run
CPRICE_CONS_MIN Commodity Price: Construction minerals LR_INTEREST Interest rate: long run
CPRICE_IND_MIN Commodity Price: Industrial minerals TOT_GOV_SPENDING Government spending
CPRICE_FER_ORES Commodity Price: Ferrous metals SHAR_DEFENCE Government spending: Defence
CPRICE_NFER_ORES Commodity Price: Non-ferrous metals SHAR_EDUCATION Government spending: Education
CPRICE_COAL Commodity Price: Coal SHAR_HEALTH Government spending: Health
CPRICE_BRENT_OIL Commodity Price: Brent oil TAX_INDIRECT Tax: Indirect
CPRICE_GAS Commodity Price: Gas VAT_RATE Tax: VAT
CPRICE_OTHERS Global Inflation TAX_DIRECT Tax: Direct
BENEFIT_PAYMENT Benefit Payment
SOCSEC_EMPLOYEES Soc sec employees’ contributions
SOCSEC_EMPLOYERS Soc sec employers’ contributions
SPARE1
3.9 Abbreviations

• 3.10 Scenario file: B_ETS.idiom
59: number of country50: Number of yearR: Regions Y1: YearsRTEA: regional energy tax as additional excise duties (euro/toe)
Editing scenario file in text editor (OxEdit)
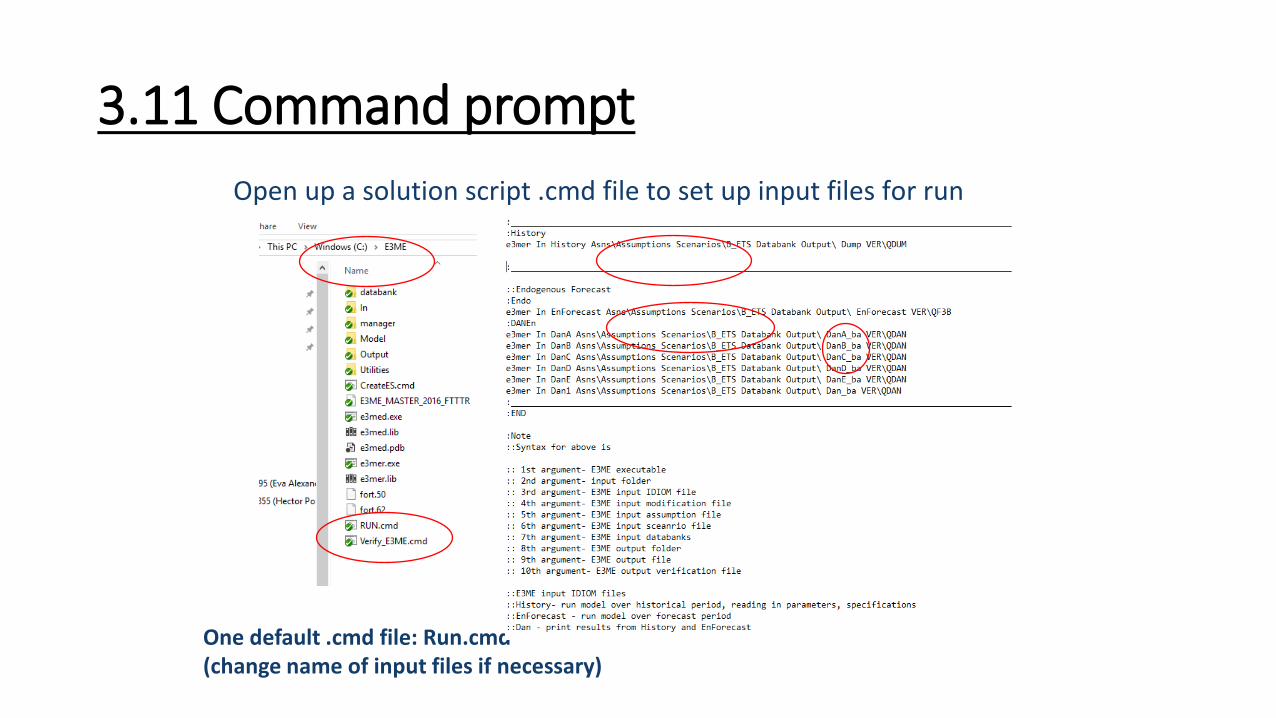
Open up a solution script .cmd file to set up input files for run
3.11 Command prompt
One default .cmd file: Run.cmd(change name of input files if necessary)

3.12 EnForecast: Run model over forecast period

3.13 Run.cmd
The model solutions script is a ‘.cmd’ batch file.
It is stored in C:E3ME folder. Right click to edit the file.
It contains information such as location of model files inputs, their names and names of output file.
If we want to set up a new scenario different from the default E3ME baseline, then we will need to make changes to the solution script accordingly to refer it to the new set of model inputs.

Command Prompt page
3.14 The model solving…

3.14 .tab: results in text form
• Ex. DanA_ba.tab

3.16 xx.mre: results in graph
• .mre file is a large text file which can be read in the model Front-End
• To open results files in the Frone-End, copy over the large “xx.mre” result files and paste in the ‘Data folder’
• Copy and paste the output of baseline (Dan.ba.mre) for comparison with baseline
• Double click on sever.exe in E3ME_FE folder
• Front-End interface is launched automatically

3.17 Inspecting E3ME results

3.18 … and model outputs

3.19 Inspecting E3ME results
• Inspect one file: variables, regions & sectors
• Comparison between files: scenarios vs baseline
– choose any baseline to compare with
– inspect results by variables, regions and sectors
– level, absolute & percentage differences from baseline
• Option to export to Excel
3.20 E3ME Limitations
• Data– annual model
– quality and availability of data
• Econometric– dealing with structural change
– based on historical relationships (Lucas critique)
• Complexity– complex linkages between different part of models
• Treatment of financial markets

Low-carbon, Sustainable
Future in East Asia:
Improving energy systems,
taxation and policy cooperation
Edited by Soocheol Lee, Hector Pollitt and Seung-
Joon park