Outdoor Wireless Networks for Healthcare Applications: Reliability
28
Outdoor Wireless Networks for Healthcare Applications: Reliability Optimization through Prognostics and Health Management Bernard Fong and A.C.M. Fong Introduction Wireless communications technology is widely used in many applications throughout the world. Wireless networks of different types serve target customers with different requirements from general-purpose consumer electronics to telemedicine supporting a diverse range of healthcare applications including critical life-saving missions, there are different reliability requirements for different situations. The main objective of any communication system is to deliver as much information as possible from a source to the intended recipients in a timely manner. The information received should be an exact copy of what has been sent out from the source. An ideal communication system should be available any time and it should 2 CHAPTER
Transcript of Outdoor Wireless Networks for Healthcare Applications: Reliability

Outdoor Wireless Networksfor Healthcare Applications:
Reliability Optimization through Prognostics and
Health ManagementBernard Fong and A.C.M. Fong
Introduction
Wireless communications technology is widely used in many applications throughout the world. Wireless networks of different types serve target customers with different requirements from general-purpose consumer electronics to telemedicine supporting a diverse range of healthcare applications including critical life-saving missions, there are different reliability requirements for different situations. The main objective of any communication system is to deliver as much information as possible from a source to the intended recipients in a timely manner. The information received should be an exact copy of what has been sent out from the source. An ideal communication system should be available any time and it should
2C H A P T E R

34 Telehealthcare Computing and Engineering: Principles and Design
be able to deliver information in real time without any delay or loss of information. In reality, no such system exists because practical systems can fail due to a number of reasons. There is a long list of possible causes of failure. Apart from the usual suspects of hardware problems and human errors, there are certain inherent problems such as additive noise and interference. In information theory, where ‘how good’ information is sent from its source to destination, is quantitatively measured in terms of the ‘likelihood’ that it arrives to the intended recipient intact. We can build a statistical model that describes the behavior of the communication system so that how the information in transit is expected to go through can be predicted based on past experience. So, we can describe statistical attributes like how much noise will be added to the signal during transmission, how long a delay is anticipated for the data to reach the recipient, how much interference is along the path, how likely is a hardware to fail and for how long. We can then use such knowledge to improve system reliability according to different situations.
Through an understanding of various major factors that affect the reliability of wireless communication networks, this chapter aims at providing the readers with a broad understanding of how PHM techniques can be applied to wireless communication networks and to look into various factors that affect the reliability under the harsh outdoor operating environment. While this chapter discusses various aspects of reliability issues with outdoor wireless communication networks, we do not intend to go through the details of telecommunications theory as this would entail at least one whole volume. We shall look at major problems such as communication error and loss of data while in transit. We then look at factors that affect the reliability of a wireless communication system followed by how prognostics can be applied to system planning and deployment before concluding the chapter concisely.
1 Transmission Error
The margin of error for medical application is far more stringent than with ordinary consumer electronic products since they are often used in supporting life-critical missions. Similar to any wireless communication network, telemedicine reliability is about the percentage of data error, or simply the number of bits (usually measured against every block of one million bits sent). This is usually referred to as the ‘bit error rate’ or BER, also known as ‘bit error ratio’. This ratio is the number of corrupted bits verses the number of bits sent, expressed as:
Outdoor Wireless Networks for Healthcare Applications 35
sent bits ofnumber totalreceived bits erroneous ofnumber
=BER
(1)
The likelihood of a bit error, or probability of error, is:
01 )0|1()1|0( pppppe += (2)
Here, we simply add the probability of a ‘1’ bit that is misinterpreted as a ‘0’ and the probability of a ‘0’ bit that is misinterpreted as a ‘1’ together in order to fi nd out the probability of a bit error pe.
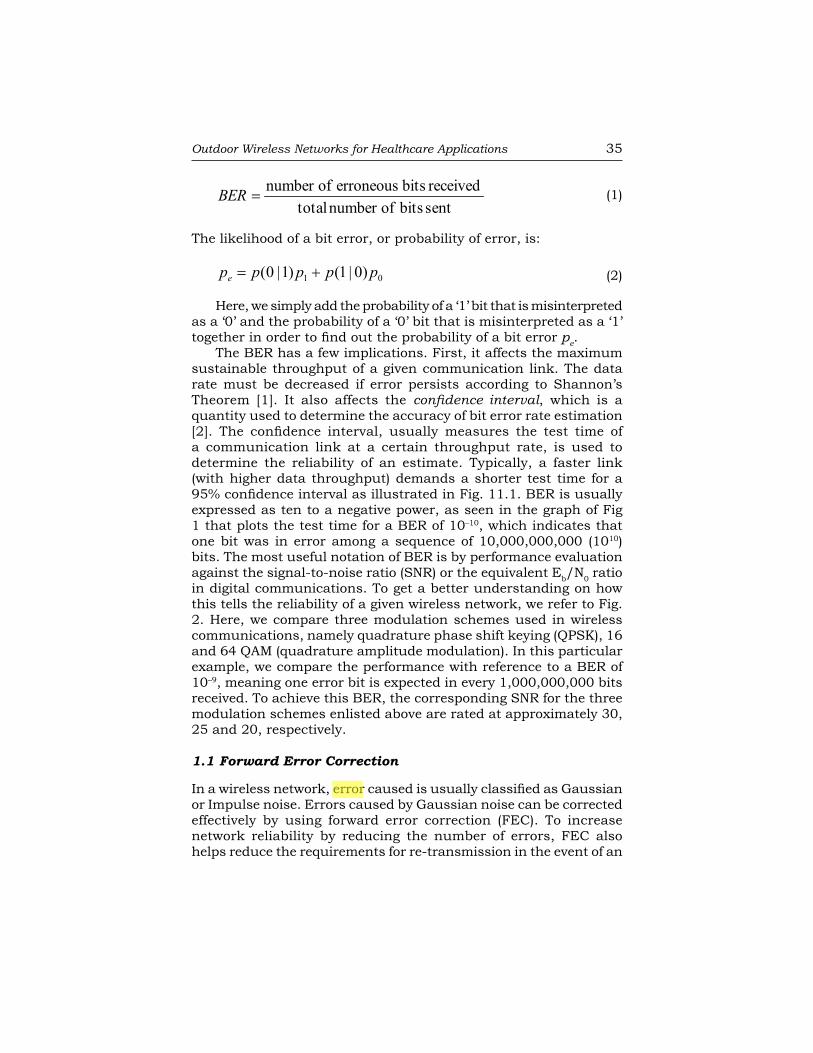
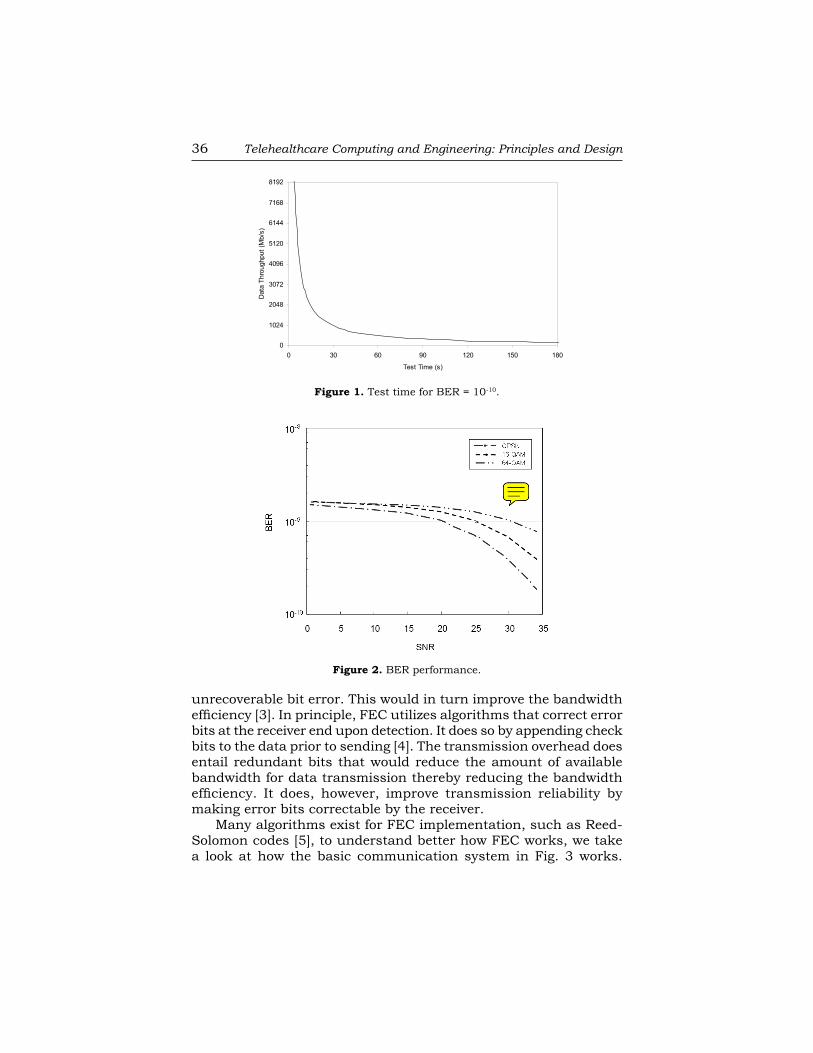
The BER has a few implications. First, it affects the maximum sustainable throughput of a given communication link. The data rate must be decreased if error persists according to Shannon’s Theorem [1]. It also affects the confi dence interval, which is a quantity used to determine the accuracy of bit error rate estimation [2]. The confi dence interval, usually measures the test time of a communication link at a certain throughput rate, is used to determine the reliability of an estimate. Typically, a faster link (with higher data throughput) demands a shorter test time for a 95% confi dence interval as illustrated in Fig. 11.1. BER is usually expressed as ten to a negative power, as seen in the graph of Fig 1 that plots the test time for a BER of 10–10, which indicates that one bit was in error among a sequence of 10,000,000,000 (1010) bits. The most useful notation of BER is by performance evaluation against the signal-to-noise ratio (SNR) or the equivalent Eb/N0 ratio in digital communications. To get a better understanding on how this tells the reliability of a given wireless network, we refer to Fig. 2. Here, we compare three modulation schemes used in wireless communications, namely quadrature phase shift keying (QPSK), 16 and 64 QAM (quadrature amplitude modulation). In this particular example, we compare the performance with reference to a BER of 10–9, meaning one error bit is expected in every 1,000,000,000 bits received. To achieve this BER, the corresponding SNR for the three modulation schemes enlisted above are rated at approximately 30, 25 and 20, respectively.
1.1 Forward Error Correction
In a wireless network, error caused is usually classifi ed as Gaussian or Impulse noise. Errors caused by Gaussian noise can be corrected effectively by using forward error correction (FEC). To increase network reliability by reducing the number of errors, FEC also helps reduce the requirements for re-transmission in the event of an
NB
Cross-Out
NB
Cross-Out
1
NB
Highlight
an error ??
36 Telehealthcare Computing and Engineering: Principles and Design
0
1024
2048
3072
4096
5120
6144
7168
8192
0 30 60 90 120 150 180
Test Time (s)
Dat
a Th
roug
hput
(Mb/
s)
Figure 1. Test time for BER = 10-10.
Figure 2. BER performance.
unrecoverable bit error. This would in turn improve the bandwidth effi ciency [3]. In principle, FEC utilizes algorithms that correct error bits at the receiver end upon detection. It does so by appending check bits to the data prior to sending [4]. The transmission overhead does entail redundant bits that would reduce the amount of available bandwidth for data transmission thereby reducing the bandwidth effi ciency. It does, however, improve transmission reliability by making error bits correctable by the receiver.
Many algorithms exist for FEC implementation, such as Reed-Solomon codes [5], to understand better how FEC works, we take a look at how the basic communication system in Fig. 3 works.
NB
Note
Provide high resolution (300 dpi) jpeg for figure 2

Outdoor Wireless Networks for Healthcare Applications 37
Figure 3. Communication system block diagram.
There are three elementary components: transmitter, receiver and communication channel. In the case of a wireless system, the communication channel is a microwave link. The transceivers, originated from TRANSmitter and receiver pair, consists of the following basic building blocks:Encoder/Decoder: An encoder converts the original message into a sequence of digital bits that represent individual characters, for example, converting the data into signals that contain ‘0’s and ‘1’s. It also appends redundant bits to the data bit stream so that together they form a codeword. Each codeword contains the message itself and necessary information for error correction. The decoder essentially works in reverse by removing the redundant bits from each received codeword, these bits are then used for detection and subsequent correction of error and then recover the original message from it. The number of error bits that a decoder can correct will depend on the specifi c error control code used.Modulator and Demodulator: The modulator converts the original message into a form suitable for sending across the communication channel, each binary bit or group of bits are represented by variation of certain attributes of a carrier wave. For example, ‘0’s and ‘1’s are represented by two different amplitude levels in the simple form of amplitude shift keying (ASK) as illustrated in Fig. 4. Both the frequency and phase remain unchanged.
The wireless channel uses an electromagnetic wave of a certain carrier frequency fc Hz that conveys the data, containing the original information and additional redundancy for error detection. The
Figure 4. Bit representation of ASK.
NB
Highlight
delete s

38 Telehealthcare Computing and Engineering: Principles and Design
carrier wave, by itself, does not have any information content. Its main purpose is to provide suffi cient energy to carry the data across from the transmitter to the receiver through an air interface. This is the part of the overall communication system where most errors are induced. Therefore, we need to pay particular attention to the channel when address system reliability. Finally, an error-control code is a set of codewords generated by the decoder and appended to the data so that the encoder can use them to detect and correct errors. It is worth noting, incidentally, that not all algorithms have the ability to correct errors as some can only detect errors.
1.2 Errors that affect reliability
In addition of BER performance, there are other errors related to reliability, these include common problems such as noise and interference. Generally, these cause two types of error, either burst or random error that differs in statistical occurrence. There are different ways to deal with data error depending on the cause and nature of error. When an error is detected, we can either correct it or initiate a re-transmission to have the data packet that contains the error bit re-sent. Bit error involves the corruption of one or more data, a binary ‘1’ sent is incorrectly treated as a ‘0’ by the receiver or vice versa. Also there are situations when the entire packet is lost while in transit. An automatic re-transmission can be set so that it is initiated when a certain pre-determined timeout period has elapsed without receiving the packet.
Sometimes an error can be undetected as encoders cannot provide a 100% success rate. Codewords that contain errors can therefore get through from time to time. This is usually caused when the error pattern happens to be the same as that of the designed codeword for transmission, so that what is received, is converted with error, into another codeword that may be misinterpreted by the decoder as something else, not the same as what was originally sent. In such a situation, the decoder does not have the necessary information to distinguish between a legitimate codeword (of different information content) or a corrupted codeword that exhibits the same bit pattern.
Other errors include random and burst errors. Random errors are statistically independent events that occur on channels due to Gaussian noise. Such channels of independent-error are said to be memoryless since knowledge of previous channel conditions would not provide any information on current or future error behavior. In contrast, burst errors are not independent, errors occur such that following bits suffer from a higher probability of errors, usually due to previous channel conditions. This condition is referred to as
NB
Highlight
Not clear??
NB
Highlight
to ??
NB
Highlight
the error

Outdoor Wireless Networks for Healthcare Applications 39
channels with ‘memory’ (although the channel itself does not really have any information storage capabilities. Condition based channel maintenance can easily be accomplished with such knowledge.
1.3 Operation of Error Control
In telecommunication networks, there are two major types of schemes for error handling, namely ARQ (automatic error request) and FEC (Forward Error Correction). ARQ is sometimes referred to as backward error correction since it operates by sending NACK (Negative Acknowledgment) for initiation of data re-transmission when it is lost and cannot be recovered by any form of error correcting method. FEC transmits redundant bits along with the original data so that recovery of the corrupted packets can be performed at the receiving end, which increases overhead and takes up additional bandwidth. It is also possible to implement a combination known as HARQ (Hybrid Automatic Repeat reQuest) by putting both ARQ and FEC together in a suitable error control scheme, which can minimize the amount of redundancy and delay by distinguishing the class of service.
HARQ operates by fi rst feeding the data into a buffer and forward it to an FEC encoder that splits the data block into k packets before applying a redundancy of n packets. So, the total packet size P to be transmitted becomes:
nkP += (3)
And transmission effi ciency is:
%100×⎟⎠⎞
⎜⎝⎛=PkEfficiency
(4)
A packet scheduler transmits packets across the wireless channel, which also re-transmits the same packets if the receiver sends NACK to the transmitter’s packet scheduler. Normally, an NACK is initiated if the number of packets received is less than expected, which indicates a packet lost. When the number of packets matches that of expectation the receiver will perform an error check with the received packets.
In FEC, the transmitter uses the data packet to compute a checksum. The operation is actually quite simple, let us take a look at an example that shows how a checksum is used for error detection (we do not attempt to perform an error correction here):
NB
Highlight
as a

40 Telehealthcare Computing and Engineering: Principles and Design
Original Message: 10 15 20 25Checksum: 10 + 15 + 20 +25 = 70Packet to be transmitted: 10 15 20 25 70 Appended to
the message
Received packet: 10 15 22 25 70
So, the receiver adds the four numbers of the data together and obtains 72, which differs from the checksum of 70. This works well for one single error. However, this is not foolproof as errors can go undetected if the data and/or checksum is corrupted to exhibit such a pattern that is internally consistent. For example:
Packet to be transmitted: 10 15 20 25 70Received packet: 10 16 20 25 71 orReceived packet: 10 16 20 24 70
In both cases, no error is detected despite the fact that the received packet differs from that of transmitted. Although we cannot eliminate this kind of error, we can minimize its probability by increasing the amount of information in the checksum. More complex algorithms are available by applying transformations on the message to compute the redundant information. However, for the sake of discussion we shall use only cyclic redundancy check (CRC) as an example. More detailed information can be found in [6].
CRC is a technique for detecting errors in a data packet, but not for making corrections when errors are detected. Several techniques are available for generating checksums that can be appended to a message. The simplest form is a parity bit, which is perhaps the simplest mechanism in reliability for communication systems. This is how it works:
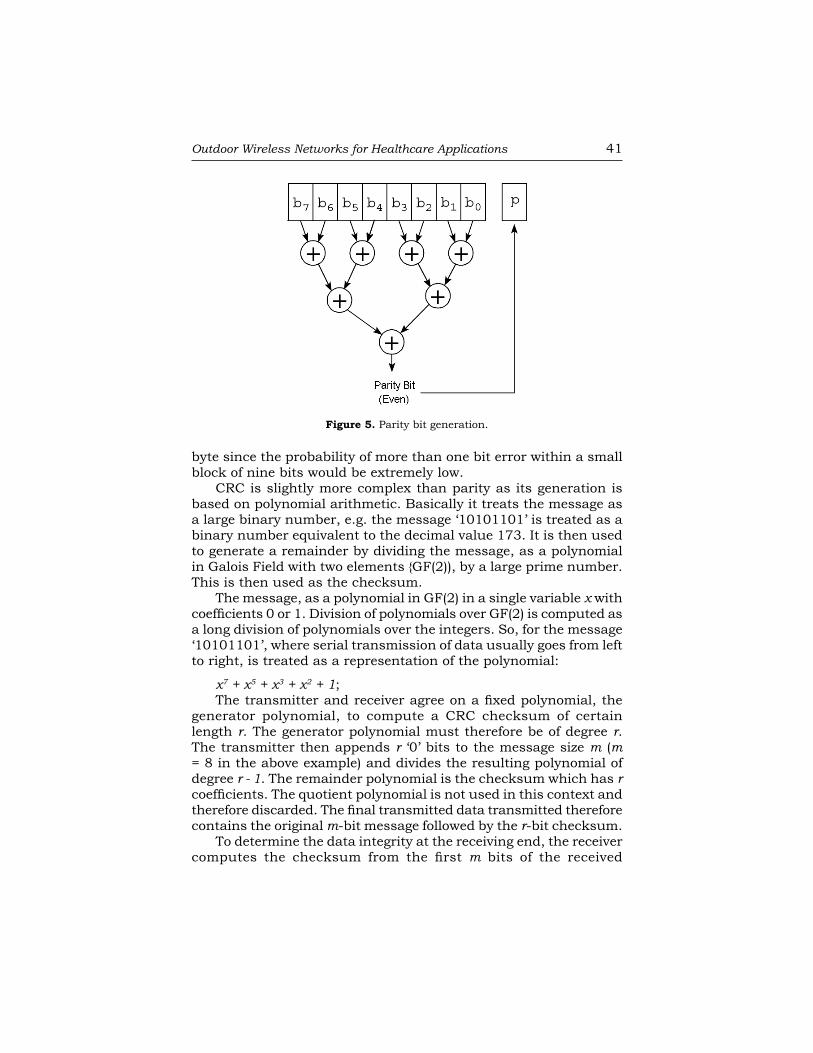
Suppose we have one byte of arbitrary data ‘00101101’ and we assume that odd parity is used. There are, incidentally, several different types of parity [7]. In even parity, the total number of ‘1’ bits including the parity bit itself should be an odd number (likewise, in even parity the total number of ‘1’s should be an even number). An example of how this is generated is illustrated in Fig. 5. So, the transmitter will insert a parity bit of ‘1’ to the data byte in this example because there are four ‘1’s in the byte and to make the total number of ‘1’s become an odd number the parity bit must be ‘1’. Parity check, irrespective of the type used, is good only for picking up odd number of error bits. It is unable to pick up any even number of errors, for example, in the case of two corrupted bits. In practice, this is usually adequate for transmission of an individual
NB
Highlight
Should be odd??
Outdoor Wireless Networks for Healthcare Applications 41
byte since the probability of more than one bit error within a small block of nine bits would be extremely low.
CRC is slightly more complex than parity as its generation is based on polynomial arithmetic. Basically it treats the message as a large binary number, e.g. the message ‘10101101’ is treated as a binary number equivalent to the decimal value 173. It is then used to generate a remainder by dividing the message, as a polynomial in Galois Field with two elements {GF(2)), by a large prime number. This is then used as the checksum.
The message, as a polynomial in GF(2) in a single variable x with coeffi cients 0 or 1. Division of polynomials over GF(2) is computed as a long division of polynomials over the integers. So, for the message ‘10101101’, where serial transmission of data usually goes from left to right, is treated as a representation of the polynomial:
x7 + x5 + x3 + x2 + 1;The transmitter and receiver agree on a fi xed polynomial, the
generator polynomial, to compute a CRC checksum of certain length r. The generator polynomial must therefore be of degree r. The transmitter then appends r ‘0’ bits to the message size m (m = 8 in the above example) and divides the resulting polynomial of degree r - 1. The remainder polynomial is the checksum which has r coeffi cients. The quotient polynomial is not used in this context and therefore discarded. The fi nal transmitted data transmitted therefore contains the original m-bit message followed by the r-bit checksum.
To determine the data integrity at the receiving end, the receiver computes the checksum from the fi rst m bits of the received
Figure 5. Parity bit generation.

42 Telehealthcare Computing and Engineering: Principles and Design
data. This should tally with the last r bits there were received as the checksum appended to the message before transmission. Alternatively, a more reliable method is to divide the block of m + r received bits by the generator polynomial so that the r-bit remainder can be verifi ed as 0.
11.2 Link OutageAny reliable network needs to be available at all times, i.e. it should be up and running and uninterrupted. However, no practical networks can provide absolutely 100% availability. Network availability is measured by the amount of time the network is available. Normally, we expect a network to provide at least 99.99% availability, this is to say that for 99.99% of the time the network is fully operational. 99.99% is equivalent to a down time, i.e., 0.01% of the time, of about 52 minutes per year of network outage. In essence, the link outage measures how reliable a given network is. 52 minutes in a year may not sound signifi cant to most people, as this should be quite adequate for most general consumer electronics applications. For networks that support life-saving missions, we need far better than this and we often talk about 99.999% or even better. Given that numerous factors can cause link outage [8], offering such a high degree of availability may require the support of redundant links. To recapitulate the simple relationship between network availability and link outage, this can be summarized as:
Link Outage = 1 – availability (5)
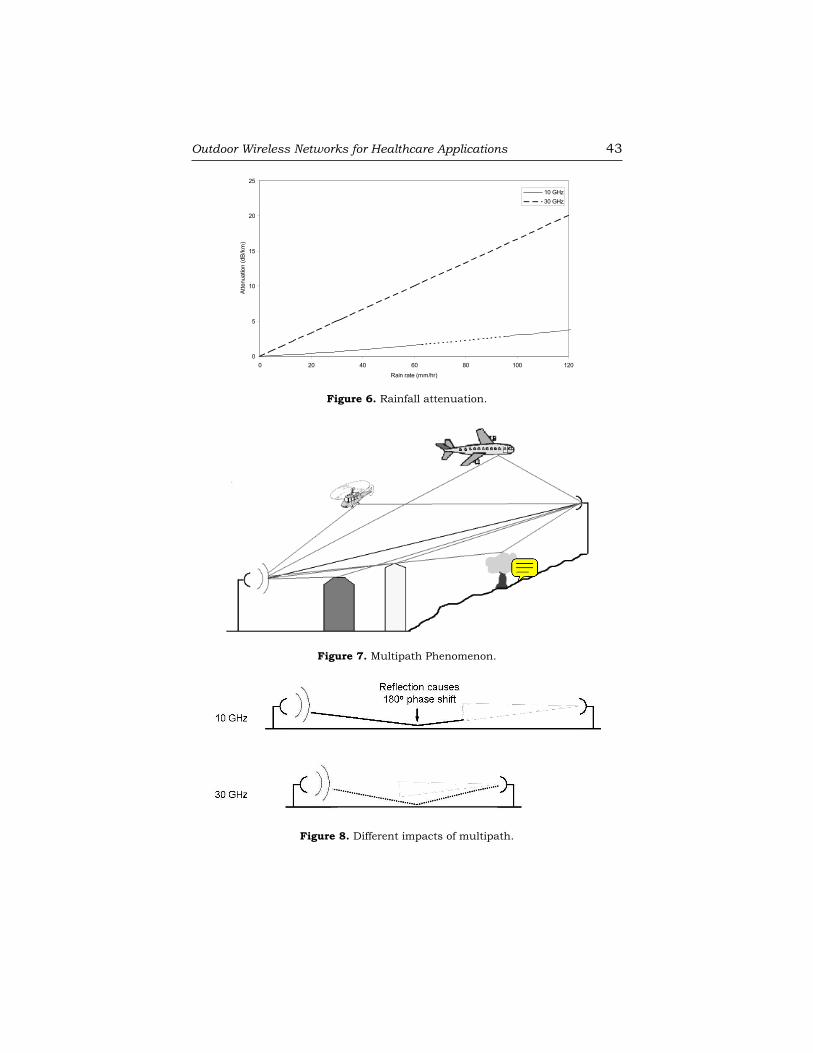
Wireless communications in an outdoor environment can be extremely harsh. Although the extent of impact of various factors depends largely on the carrier frequency, there are issues that affect virtually all outdoor wireless communications networks. Generally, there is a trade-off between the extent of rain-induced attenuation and multipath effects. To illustrate these consequences, we compare the differences between a 10 GHz and a 30 GHz carrier.
The signal attenuation, measured in amount of loss per kilometer of range or dB/km, is plotted against the rate of rainfall in Fig. 6. As the rain becomes heavier, attenuation becomes more severe at higher frequency. Multipath, the effect of different components of the same signal that arrive at the receiving antenna at different times due to different amounts of delays across different propagating paths as shown in Fig. 7, is more severe at lower frequencies. In this context, the main advantage of using high frequency is to suppress multipath effect effi ciently by the use of high gain antennas with short paths in Fig. 8.
NB
Cross-Out
delete
NB
Highlight
a link
Outdoor Wireless Networks for Healthcare Applications 43
0
5
10
15
20
25
0 20 40 60 80 100 120
Rain rate (mm/hr)
Atte
nuat
ion
(dB/
km)
10 GHz30 GHz
Figure 6. Rainfall attenuation.
Figure 7. Multipath Phenomenon.
Figure 8. Different impacts of multipath.
NB
Note
Provide high resolution (300 dpi) jpeg for figure 8
44 Telehealthcare Computing and Engineering: Principles and Design
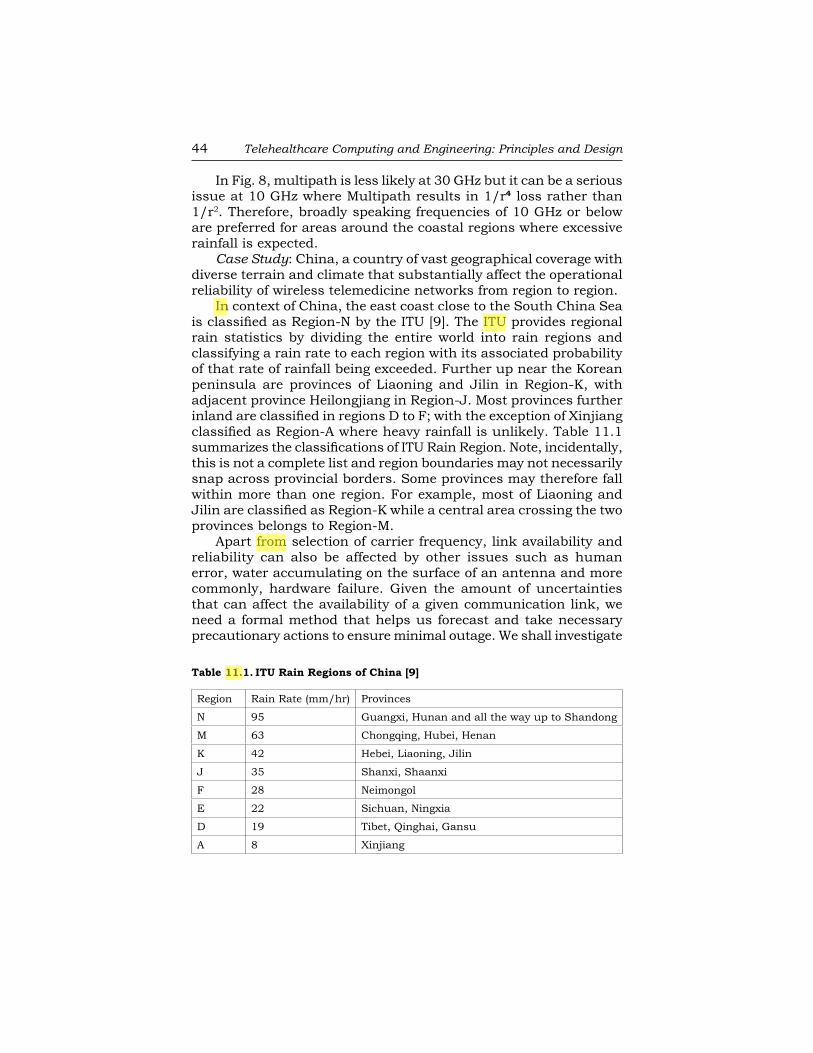
In Fig. 8, multipath is less likely at 30 GHz but it can be a serious issue at 10 GHz where Multipath results in 1/r4 loss rather than 1/r2. Therefore, broadly speaking frequencies of 10 GHz or below are preferred for areas around the coastal regions where excessive rainfall is expected.
Case Study: China, a country of vast geographical coverage with diverse terrain and climate that substantially affect the operational reliability of wireless telemedicine networks from region to region.
In context of China, the east coast close to the South China Sea is classifi ed as Region-N by the ITU [9]. The ITU provides regional rain statistics by dividing the entire world into rain regions and classifying a rain rate to each region with its associated probability of that rate of rainfall being exceeded. Further up near the Korean peninsula are provinces of Liaoning and Jilin in Region-K, with adjacent province Heilongjiang in Region-J. Most provinces further inland are classifi ed in regions D to F; with the exception of Xinjiang classifi ed as Region-A where heavy rainfall is unlikely. Table 11.1 summarizes the classifi cations of ITU Rain Region. Note, incidentally, this is not a complete list and region boundaries may not necessarily snap across provincial borders. Some provinces may therefore fall within more than one region. For example, most of Liaoning and Jilin are classifi ed as Region-K while a central area crossing the two provinces belongs to Region-M.
Apart from selection of carrier frequency, link availability and reliability can also be affected by other issues such as human error, water accumulating on the surface of an antenna and more commonly, hardware failure. Given the amount of uncertainties that can affect the availability of a given communication link, we need a formal method that helps us forecast and take necessary precautionary actions to ensure minimal outage. We shall investigate
Table 11.1. ITU Rain Regions of China [9]
Region Rain Rate (mm/hr) Provinces
N 95 Guangxi, Hunan and all the way up to Shandong
M 63 Chongqing, Hubei, Henan
K 42 Hebei, Liaoning, Jilin
J 35 Shanxi, Shaanxi
F 28 Neimongol
E 22 Sichuan, Ningxia
D 19 Tibet, Qinghai, Gansu
A 8 Xinjiang
NB
Cross-Out
NB
Cross-Out
1
NB
Cross-Out
1
NB
Highlight
Full form of ITU??
NB
Highlight
In the
NB
Highlight
from the
NB
Highlight
delete
Outdoor Wireless Networks for Healthcare Applications 45
how prognostics and system health management can assure network reliability.
11.3 Reliability in Wireless Communication Networks
There are many factors that cause the failure of a wireless network. Apart from hardware failure, there are variable parameters that affect the operational reliability of a network. For example, the presence of noise will prevent a network from transferring data at its maximum possible throughput rate. A reliable communication network is more than one that is always available. In a simple cellphone system, problems of different nature may cause complete loss of service, major loss of service where a large area is affected, minor loss of service that intermittently disconnect calls, or mishandled calls that temporarily fails to connect [10]. With reference to the simple communication system in Fig. 3, successful communication is about delivering information from the transmitter to the receiver in such a way that what has been sent can be read. So, consider the case where we want to send the message ‘Hello World’ from A to B. A reliable communication system would let A talk at any time so the system is always ready. When A talks, B would hear ‘Hello World’ with exactly the same pitch and pace. All kinds of problems can arise when the system is up and running; a defective device within the system may deny A from accessing the system. A lightning strike can suddenly cuts off the link so that only ‘Hello’ gets through to B. Noise interfering with the signal can corrupt the message so that what B hears does not make sense. Time delay can also be a reliability issue, perhaps B gets the message minutes after it was sent. Addressing reliability issues entail investigation of various factors that cause the problem and very often statistical analysis of failure events can help us predict future occurrences and to reduce the likelihood of occurring in the future.
3.1 Channel Capacity
The evaluation of radio link entails the following parameters:
- Available radio frequency (RF) power - Channel bandwidth - Desired BER performance
These are governed by Shannon’s Channel Capacity Theorem [1] that dictates the maximum channel capacity of the link, such that the channel capacity C is given by:
NB
Cross-Out
delete
46 Telehealthcare Computing and Engineering: Principles and Design
⎟⎠⎞
⎜⎝⎛ +=
NSBC 1(log. 2
(6)
Where B is the channel bandwidth, S and N are the power of signal and noise, respectively.
This well-known theorem does have a problem that concerns reliability. It tells us that BER should be zero if the data rate is less than the channel capacity, i.e. when the channel is not fully utilized there should be no bit error. This, of course, cannot be true in any practical system even though it may be theoretically proven. So, where does prognostic come in?
Prognostics allows us plan ahead to combat uncertainties. Since we know it is virtually impossible to achieve BER = 0 no matter what we do. There are ways that we can do to push BER closer towards zero. Let us go back to the basic communication system in Fig. 3, there are certain parameters that affect the BER such that the system will become less reliable. We need to look into the modulation scheme used and reduction in receiver noise [11]. The appropriate selection of modulation scheme would compromise between effi ciency and reliability. Ironically, the use of high order modulation scheme for improved spectral utilization effi ciency (SUE) would increase receiver structure complexity [12]. This may lead to diffi culties with implementing fi lters for suppressing receiver noise. Noise is an inherent problem with wireless links since everything that has heat emit energy would incur random noise [13]. Gaining a statistical knowledge on the properties of noise can help diminish the problem.
3.2 Link Budget
This is a measure of the net gain (or loss for a negative gain) throughout the network, from the transmitter to the receiver through all transmission media. This include antenna gains, feed line that connects various network components together, losses due to atmospheric absorption and signal attenuation over a 3-D space. A certain margin needs to be allocated to compensate for these effects. The link margin is useful for evaluating whether the radio link has an acceptable ‘fade margin’ and how much antenna gain needs to be added. Sometimes, a ‘repeater’ is added along the signal path to regenerate the signal for long distance communication so that the signal can be ‘refreshed’ before it is too severely distorted when being received.
Prognostics techniques can also be used to determine the ‘Fresnel Zone’ for an RF link, which is a series of concentric ellipsoid shaped

Outdoor Wireless Networks for Healthcare Applications 47
space surrounding the line-of-sight (LOS) path, as shown in Fig. 9. The Fresnel Zone concept is extremely important for wireless link reliability because it can provide us with a quantitative description of the space surround the LOS that interference can affect the signal propagating along the LOS path if there is a blockage within the zone. All physical objects can cause refl ection and diffraction to the signal. The zone’s radius r is dependent to the distance d between the antennas and the carrier frequency f as:
fdr.4
3.43=
(7)
In addition to rain induced attenuation and depolarization described in the previous sub-section, other natural phenomena such as wind and lightning can also cause serious problems to link reliability. Antennas, especially large parabolic dishes, may have signifi cant wind loading that can cause damage to the building on which they are mounted. An antenna, if dropped from the rooftop, can have fatal consequences and will certainly lead to link outage. Lightning protection and grounding devices can be installed to protect the outdoor equipment. A lightning strike can cause irreparable damage to network equipment.
The received signal is where we can extract the original information from. The signal level is measured in dBm (normally as a negative value with a signal loss relative to the transmitted power) is given by:
⎟⎠⎞
⎜⎝⎛=mWPdBm
1log10
(8)
Figure 9. Obstacle clearance.
NB
Note
Provide high resolution (300 dpi) jpeg for figure 9
48 Telehealthcare Computing and Engineering: Principles and Design
Where P is the signal power and the 1 mW reference level expresses both transmitted and received sensitivity. For successful communication, the transmitting signal must be of suffi cient power to reach the receiver. Also, the power that reaches the receiving antenna must be of suffi ciently higher power than that of noise; meaning that the signal-to-noise ratio (SNR) must be a positive value at an adequate level for signal detection by the receiver.
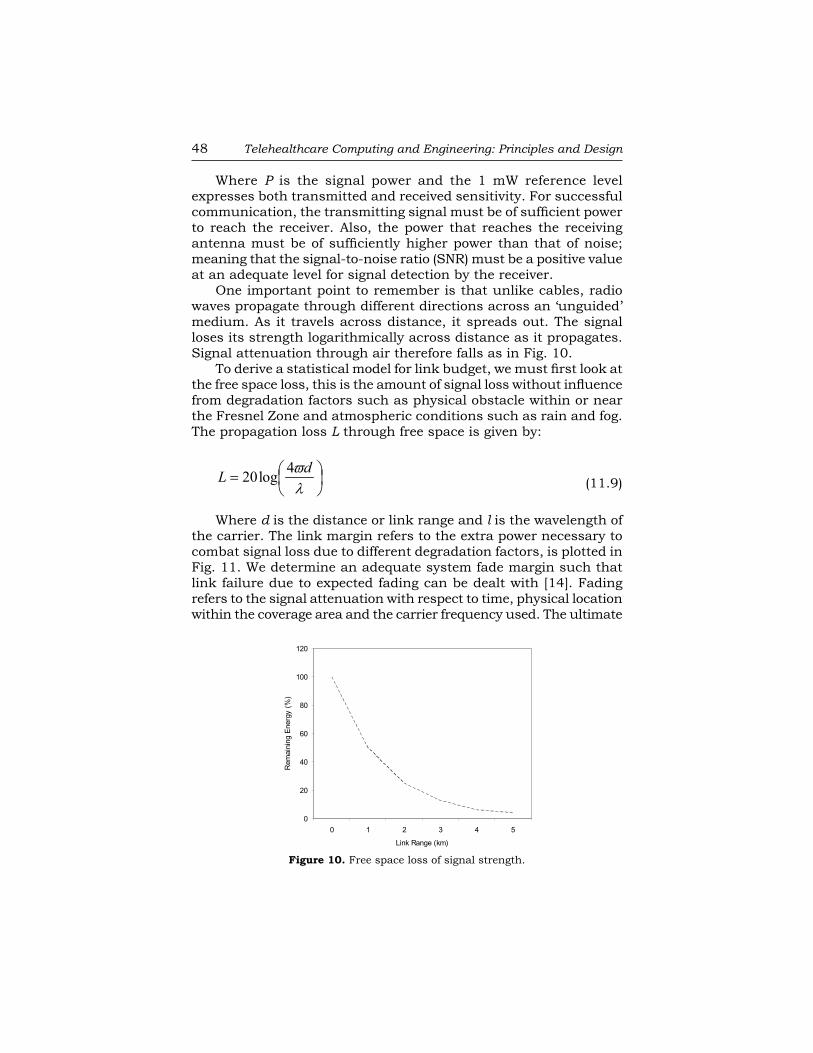
One important point to remember is that unlike cables, radio waves propagate through different directions across an ‘unguided’ medium. As it travels across distance, it spreads out. The signal loses its strength logarithmically across distance as it propagates. Signal attenuation through air therefore falls as in Fig. 10.
To derive a statistical model for link budget, we must fi rst look at the free space loss, this is the amount of signal loss without infl uence from degradation factors such as physical obstacle within or near the Fresnel Zone and atmospheric conditions such as rain and fog. The propagation loss L through free space is given by:
⎟⎠⎞
⎜⎝⎛=
λϖdL 4log20
(11.9)
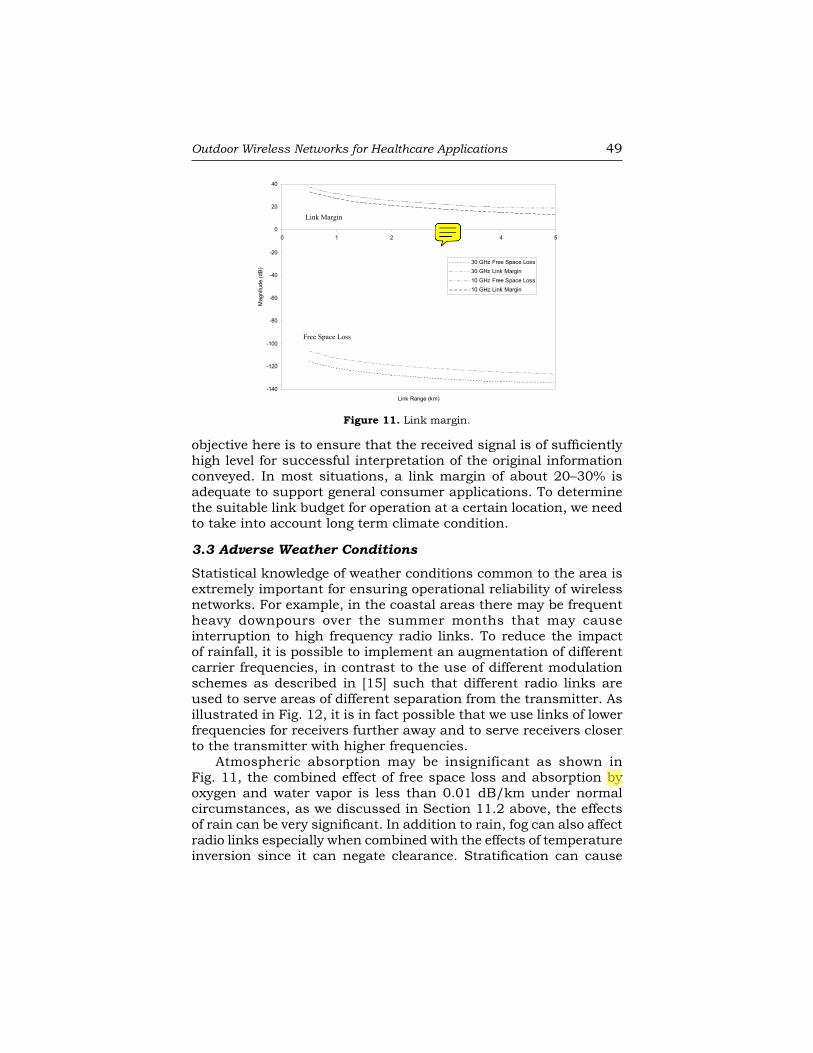
Where d is the distance or link range and l is the wavelength of the carrier. The link margin refers to the extra power necessary to combat signal loss due to different degradation factors, is plotted in Fig. 11. We determine an adequate system fade margin such that link failure due to expected fading can be dealt with [14]. Fading refers to the signal attenuation with respect to time, physical location within the coverage area and the carrier frequency used. The ultimate
Figure 10. Free space loss of signal strength.
0
20
40
60
80
100
120
0 1 2 3 4 5
Link Range (km)
Rem
aini
ng E
nerg
y (%
)
NB
Cross-Out
delete
Outdoor Wireless Networks for Healthcare Applications 49
objective here is to ensure that the received signal is of suffi ciently high level for successful interpretation of the original information conveyed. In most situations, a link margin of about 20–30% is adequate to support general consumer applications. To determine the suitable link budget for operation at a certain location, we need to take into account long term climate condition.
3.3 Adverse Weather ConditionsStatistical knowledge of weather conditions common to the area is extremely important for ensuring operational reliability of wireless networks. For example, in the coastal areas there may be frequent heavy downpours over the summer months that may cause interruption to high frequency radio links. To reduce the impact of rainfall, it is possible to implement an augmentation of different carrier frequencies, in contrast to the use of different modulation schemes as described in [15] such that different radio links are used to serve areas of different separation from the transmitter. As illustrated in Fig. 12, it is in fact possible that we use links of lower frequencies for receivers further away and to serve receivers closer to the transmitter with higher frequencies.
Atmospheric absorption may be insignificant as shown in Fig. 11, the combined effect of free space loss and absorption by oxygen and water vapor is less than 0.01 dB/km under normal circumstances, as we discussed in Section 11.2 above, the effects of rain can be very signifi cant. In addition to rain, fog can also affect radio links especially when combined with the effects of temperature inversion since it can negate clearance. Stratifi cation can cause
Figure 11. Link margin.
-140
-120
-100
-80
-60
-40
-20
0
20
40
0 1 2 3 4 5
Link Range (km)
Mag
nitu
de (d
B)
30 GHz Free Space Loss30 GHz Link Margin10 GHz Free Space Loss10 GHz Link Margin
Link Margin
Free Space Loss
NB
Cross-Out
delete
NB
Highlight
NB
Note
Provide high resolution (300 dpi) jpeg for figure 11

50 Telehealthcare Computing and Engineering: Principles and Design
ducting just like temperature inversion. It can also create refl ective and refractive conditions so that different components of the same signal can interfere with each other. Again, the link range may need to be shortened as in the case of effects of rain. Referring to the example in Fig. 12, we combine the advantages of lower rain induced attenuation with lower carrier frequencies and the wider available bandwidth with higher frequencies. So, initial deployment can utilize a 10 GHz carrier with both vertical and horizontal polarizations in such a way that orthogonally polarized antennas with two linearly polarized antennas are mounted in perpendicular [16]. Subsequent deployment may involve adding a 40 GHz link, also with orthogonally polarized channels, to serve the areas that are closest to the transmitter. There is also a 26 GHz link that covers the area in between. This kind of arrangement would reduce the impact of rainfall on the network. However, its implementation may be restricted by licensing of frequency bands.
3.4 Performance verses Reliability
To enhance area coverage and data and data throughput, the data rate should be lowered to achieve longer range when the network can operate below maximum utilization. Coverage and throughput can also be improved by reduction in transmission power while using an antenna with higher gain. Having two links of vertical and horizontal polarization means we have effectively two radio links instead of one. Frequency reuse, where the same radio frequency can be reused in a different area for another communication channel; sectorization can also increase network capacity as the effective area covered by each transmitting antenna becomes smaller. To reduce the area affected by interference, sectorization into 45o can be achieved as in Fig. 13.
Both links, vertical and horizontal polarizations, can be functional only if they maintain suffi cient separation or else overlap
Figure 12. Covering the same area with three different frequencies of orthogonal polarization.
NB
Highlight
of the
NB
Highlight
by a

Outdoor Wireless Networks for Healthcare Applications 51
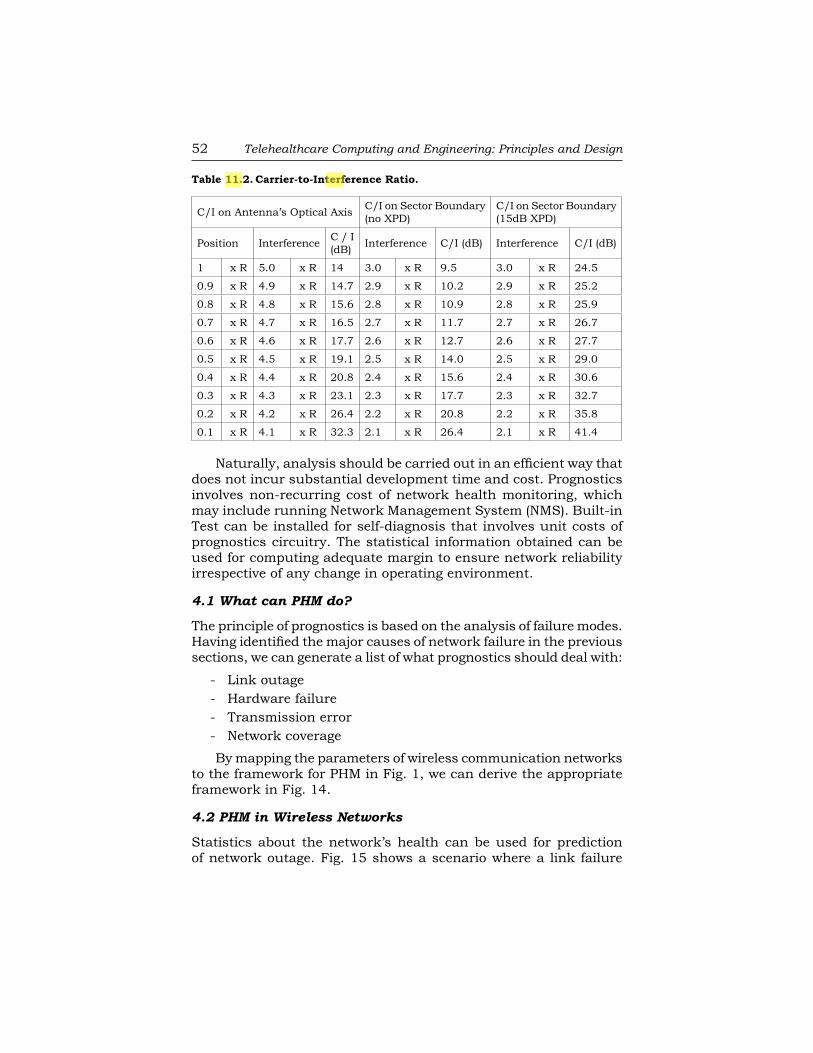
and interfere with each other. In addition to attenuation, rain also causes phase rotation and depolarization to radio waves [18]. Two neighboring sectors must be split at the same time with 45o sectors in order to maintain frequency diversity. Adjacent channel interference is caused by signals received from neighboring sectors, the target carrier-to-interference ratio C/I is listed in Table 2. To combat the impacts of interference, interfering signal is usually suppressed by Intermediate Frequency (IF) fi ltering algorithms implemented at the receiver [19]. In addition, cross-polarization discrimination (XPD) [18], an XPD of 15% can be used to control interference.
11.4 Prognostics in Wireless Networks
By now we should have a general understanding about the importance of reliability assurance in a wireless communication network and what the major problems that affect reliability are. Prognostics and health management techniques can assist with optimizing the health state of a network hence maintain maximum reliability.
Prognostics is the process of predicting the future network condition by analysis of system parameters to preempt failure conditions and implement proactive maintenance plans. In this regard, we have to gather information about the network to:
- Analyze the trend of link outage - Component failure - Sources of interference - Loss or corruption of data packets
Figure 13. Sectorization with 45o.
52 Telehealthcare Computing and Engineering: Principles and Design
Naturally, analysis should be carried out in an effi cient way that does not incur substantial development time and cost. Prognostics involves non-recurring cost of network health monitoring, which may include running Network Management System (NMS). Built-in Test can be installed for self-diagnosis that involves unit costs of prognostics circuitry. The statistical information obtained can be used for computing adequate margin to ensure network reliability irrespective of any change in operating environment.
4.1 What can PHM do?
The principle of prognostics is based on the analysis of failure modes. Having identifi ed the major causes of network failure in the previous sections, we can generate a list of what prognostics should deal with:
- Link outage - Hardware failure - Transmission error - Network coverage
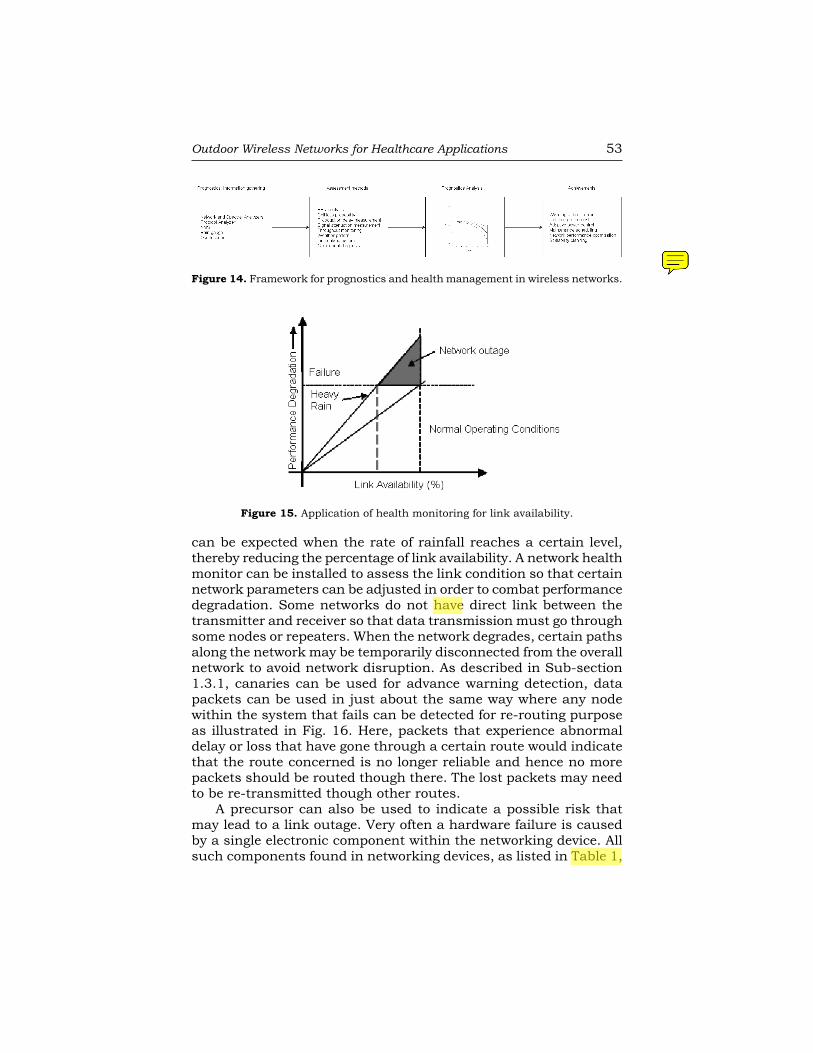
By mapping the parameters of wireless communication networks to the framework for PHM in Fig. 1, we can derive the appropriate framework in Fig. 14.
4.2 PHM in Wireless Networks
Statistics about the network’s health can be used for prediction of network outage. Fig. 15 shows a scenario where a link failure
Table 11.2. Carrier-to-Interference Ratio.
C/I on Antenna’s Optical Axis C/I on Sector Boundary (no XPD)
C/I on Sector Boundary (15dB XPD)
Position Interference C / I (dB) Interference C/I (dB) Interference C/I (dB)
1 x R 5.0 x R 14 3.0 x R 9.5 3.0 x R 24.5
0.9 x R 4.9 x R 14.7 2.9 x R 10.2 2.9 x R 25.2
0.8 x R 4.8 x R 15.6 2.8 x R 10.9 2.8 x R 25.9
0.7 x R 4.7 x R 16.5 2.7 x R 11.7 2.7 x R 26.7
0.6 x R 4.6 x R 17.7 2.6 x R 12.7 2.6 x R 27.7
0.5 x R 4.5 x R 19.1 2.5 x R 14.0 2.5 x R 29.0
0.4 x R 4.4 x R 20.8 2.4 x R 15.6 2.4 x R 30.6
0.3 x R 4.3 x R 23.1 2.3 x R 17.7 2.3 x R 32.7
0.2 x R 4.2 x R 26.4 2.2 x R 20.8 2.2 x R 35.8
0.1 x R 4.1 x R 32.3 2.1 x R 26.4 2.1 x R 41.4
NB
Highlight
delete
NB
Highlight
delete
Outdoor Wireless Networks for Healthcare Applications 53
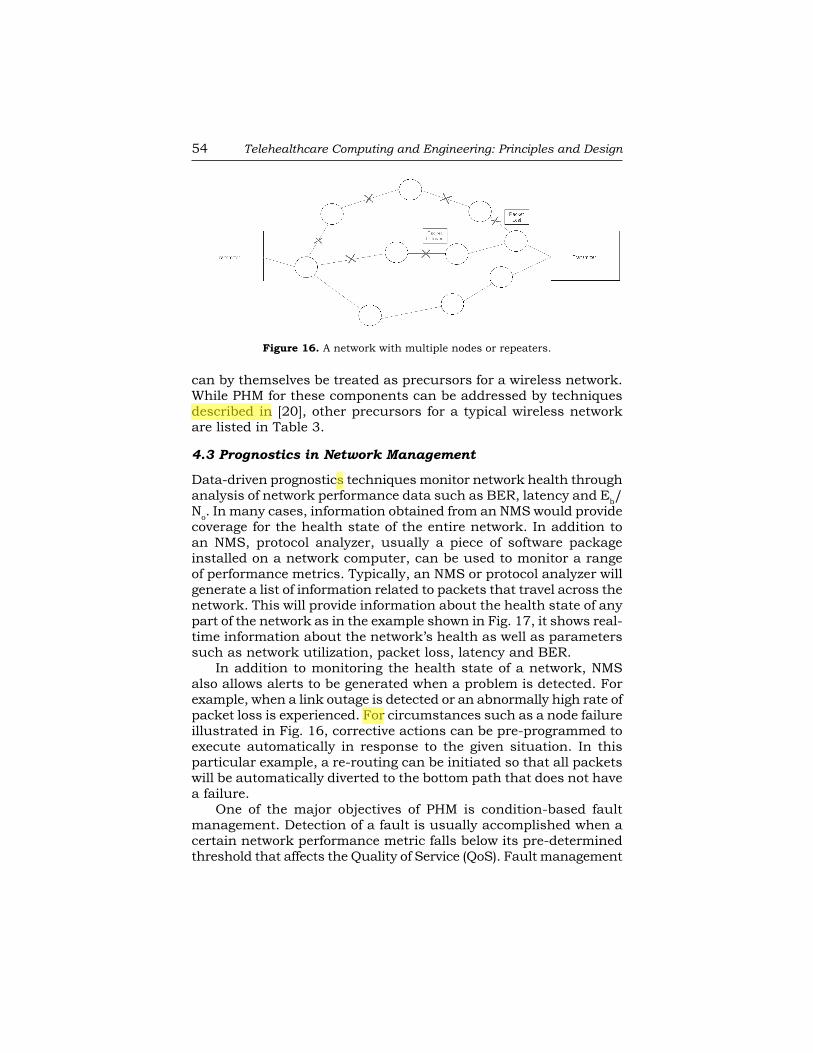
can be expected when the rate of rainfall reaches a certain level, thereby reducing the percentage of link availability. A network health monitor can be installed to assess the link condition so that certain network parameters can be adjusted in order to combat performance degradation. Some networks do not have direct link between the transmitter and receiver so that data transmission must go through some nodes or repeaters. When the network degrades, certain paths along the network may be temporarily disconnected from the overall network to avoid network disruption. As described in Sub-section 1.3.1, canaries can be used for advance warning detection, data packets can be used in just about the same way where any node within the system that fails can be detected for re-routing purpose as illustrated in Fig. 16. Here, packets that experience abnormal delay or loss that have gone through a certain route would indicate that the route concerned is no longer reliable and hence no more packets should be routed though there. The lost packets may need to be re-transmitted though other routes.
A precursor can also be used to indicate a possible risk that may lead to a link outage. Very often a hardware failure is caused by a single electronic component within the networking device. All such components found in networking devices, as listed in Table 1,
Figure 14. Framework for prognostics and health management in wireless networks.
Figure 15. Application of health monitoring for link availability.
NB
Highlight
Table 3 ??
NB
Highlight
have a
NB
Note
Provide high resolution (300 dpi) jpeg for figures 14 & 15
54 Telehealthcare Computing and Engineering: Principles and Design
can by themselves be treated as precursors for a wireless network. While PHM for these components can be addressed by techniques described in [20], other precursors for a typical wireless network are listed in Table 3.
4.3 Prognostics in Network Management
Data-driven prognostics techniques monitor network health through analysis of network performance data such as BER, latency and Eb/No. In many cases, information obtained from an NMS would provide coverage for the health state of the entire network. In addition to an NMS, protocol analyzer, usually a piece of software package installed on a network computer, can be used to monitor a range of performance metrics. Typically, an NMS or protocol analyzer will generate a list of information related to packets that travel across the network. This will provide information about the health state of any part of the network as in the example shown in Fig. 17, it shows real-time information about the network’s health as well as parameters such as network utilization, packet loss, latency and BER.
In addition to monitoring the health state of a network, NMS also allows alerts to be generated when a problem is detected. For example, when a link outage is detected or an abnormally high rate of packet loss is experienced. For circumstances such as a node failure illustrated in Fig. 16, corrective actions can be pre-programmed to execute automatically in response to the given situation. In this particular example, a re-routing can be initiated so that all packets will be automatically diverted to the bottom path that does not have a failure.
One of the major objectives of PHM is condition-based fault management. Detection of a fault is usually accomplished when a certain network performance metric falls below its pre-determined threshold that affects the Quality of Service (QoS). Fault management
Figure 16. A network with multiple nodes or repeaters.
NB
Highlight
missing ??
NB
Highlight
delete s
NB
Highlight
In

Outdoor Wireless Networks for Healthcare Applications 55
entails symptom detection followed by problem isolation. Diagnostics can attempt to fi x a problem depending on the nature of problem. For example, the transmission power can be dynamically elevated on a temporary basis when heavy rain disrupts a wireless link. Log keeping track of each failure event can be used for building a prognostics model for future failure prediction. When burst errors are detected in successions, cumulative network damage modeling can be built to estimate the extent of network degradation.
4.4 Network Coverage
In anticipation of possible network failure, PHM techniques help network planning by considering the impact on reliability when
Table 3. Potential Failure Precursors for Wireless Networks.
Network Component Failure Precursor
Demodulator
• Phase shift
• High frequency noise
• Demodulator hardware degradation
• Synchronization problem
• Clock drift
• Received signal strength
Antenna
• Wind loading
• Physical damage
• Wet surface
• Connector oxidation
• Misalignment (position relative to Tx/Rx)
Channel (air interface and feed lines)
• Burst error
• Packet loss
• Latency (time delay)
• Interference and noise
• Intermittent outage
Network Management System (NMS)
• Lengthy response time
• Excessive CPU utilization
• Effi ciency
• Data congestion
• Power failure
Routing Control
• Re-transmission rate
• Packet loss
• Buffer overfl ow
NB
Highlight
of the
NB
Highlight
delete

56 Telehealthcare Computing and Engineering: Principles and Design
Figu
re 1
7. A
n N
MS
con
sole
.
NB
Note
Provide high resolution (300 dpi) jpeg for figure 17

Outdoor Wireless Networks for Healthcare Applications 57
computing the cell coverage. In situations where link outage is of stochastic nature, i.e. when no statistical model can be constructed, link availability can be improved by adding redundant nodes [21]. Since diagnostics can effectively detect network faults when data is routed to these redundant nodes before a network outage occurs, pre-estimate aggregation becomes an appropriate PHM technique as re-routing of data to these redundant nodes would effectively eliminate any opportunity to collect any run-to-failure data, pre-estimate fusion appropriate is therefore appropriate in this situation. The placement of redundant nodes will also affect data density planning. The problem of network planning involves many parameters, with some commonly considered parameters listed in Table 4.
Table 4. Data density planning.
Network Parameter Planning Consideration
Building density Number per unit area, e.g. km2Average users per building
Expected coverage Percentage: with or without LOSRange: average hub spacing and coverage area per hub
Bandwidth allocation Fixed or dynamically allocated for shared channelsData traffi c: constant or variable bit rate (CBR or VBR)
Overlapping cells would provide an increased overage coverage at the expense of less coverage area per cell. The cell boundaries need to be carefully evaluated to ensure network reliability [22]. Cell to cell interference needs to be carefully considered with higher order modulation because signal points are closely packed so that resolving each constellation point will be prone to interference. This will lead to an economical trade-off between cell coverage and hub spacing. The optimal hub spacing ds relative to the range d would be:
22dds =
(10)
The cell coverage would roughly be halved when increasing the modulation order from QPSK (or 4-QAM) to 16-QAM then to 64-QAM and 256-QAM.
Coverage area can be severely affected by the network deployment region as classifi ed by ITU [9] and the carrier frequency. As illustrated in Fig. 18, the range can be extended from approximately 5 to 15 km with a 10 GHz carrier. In the best case scenario for ITU rain region E, a 30 GHz carrier can only reach up to 4.5 km under identical operating conditions. The coverage area also depends largely on the
NB
Highlight
The coverage
NB
Highlight
for the

58 Telehealthcare Computing and Engineering: Principles and Design
target network availability. Fig. 19 shows the reduction in relative coverage to just over 25% for availability improvement from 99.99% to 99.999% making it adequate for supporting healthcare applications. At the same time, the economic cost for such improvement would be about three-fold.
5 Summary
Reliability of virtually any wireless network has very signifi cant implications on its operation. Important parameters such as network availability and data throughput can be optimized given careful planning. Wireless networks for telemedicine applications requiring at least 99.999% availability would need high resolution planning [23]. Prognostics and health management techniques provide
Figure 18. Cell coverage for 90o sector.
Figure 19. Relative coverage area.
0
10
20
30
40
50
60
70
80
90
100
99.990% 99.995% 100.000%
Availability
Rel
ativ
e C
over
age
Are
a (5
)

Outdoor Wireless Networks for Healthcare Applications 59
a cost-effective solution for the reliability prediction of wireless communication networks through condition-based optimization of various network parameters such as system link margin, dynamic routing and power control. It is also possible to balance between network performance and reliability through best possible utilization of network resources.
REFERENCES
[1] C.E. Shannon: A mathematical theory of communication. Bell System Technical Journal, Vol. 27, pp. 379–423.
[2] M.C. Jeruchim, P. Balaban and K.S. Shammugan. 2000. Simulation of Communication Systems, 2/e, Springer, ISBN: 978-0-306-46267-2.
[3] A. Nafaa, T. Taleb and L. Murphy. 2008. Forward error correction strategies for media streaming over wireless networks, IEEE Communications Magazine, Vol. 46 No. 1, pp. 72–79.
[4] V. Bhargava. 1983. Forward error correction schemes for digital communications, IEEE Communications Magazine, Vol. 21 No. 1, pp. 11–19.
[5] B. Fong, P.B. Rapajic, G.Y. Hong and A.C.M. Fong. 2003. Forward error correction with Reed-Solomon codes for wearable computers, IEEE Transactions on Consumer Electronics, Vol. 49 No. 4, pp. 917–921.
[6] T.K. Moon. 2006. Error Correction Coding: Mathematical Methods and Algorithms, Wiley-Interscience, ISBN: 0471648000.
[7] W. Stallings. 2006. Data and Computer Communications, 8/e, Prentice Hall, ISBN: 0132433109.
[8] B. Fong, P.B. Rapajic, G.Y. Hong and A.C.M. Fong. 2003. Factors causing uncertainties in outdoor wireless wearable communications, IEEE Pervasive Computing, Vol. 2 No. 2, pp. 16–19.
[9] ITU-R P.837-5 - .2007. Characteristics of precipitation for propagation modeling.
[10] H.A. Malec. 1998. Communications reliability: A historical perspective, IEEE Transactions on Reliability, Vol. 47 No. 3, pp. 333–345.
[11] J. Peters. 1956. Procedures to Reduce Noise and To Increase Channel Capacity with Pulse Code Modulation, IRE Transactions on Circuit Theory, Vol. 3 No. 3, pp. 197–198.
[12] B. Fong, G.Y. Hong and A.C.M. Fong. 2002. A modulation scheme for broadband wireless access in high capacity networks, IEEE Transactions on Consumer Electronics, Vol. 48 No. 3, pp. 457–462.
[13] S. Haykin. 2009. Communication Systems, 5/e, Wiley, ISBN: 0471697907. [14] B. Fong, P.B. Rapahic, A.C.M. Fong and G.Y. Hong. 2003. Polarization of
received signals for wideband wireless communications in a heavy rainfall region, IEEE Communications Letters, Vol. 7 No. 1, pp. 13-14.
[15] B. Fong, N. Ansari, A.C.M. Fong and G.Y. Hong. 2004. On the scalability of fi xed broadband wireless access network deployment, IEEE Communications Magazine, Vol. 42 No. 9, pp. 12–18.
[16] A. Lozano, A.M. Tulino and S. Verdu. 2003. Multiple-antenna capacity in the low-power regime, IEEE Transactions on Information Theory, Vol. 49 No. 10, pp. 2527–2544.
NB
Highlight
check ??

60 Telehealthcare Computing and Engineering: Principles and Design
[17] S.O. Ajose, N.O. Sadiku and U. Goni. 1995. Computation of attenuation, phase rotation and cross-polarization of radio waves due to rainfall in tropical regions, IEEE Transactions on Antennas and Propagation, Vol. 43 No. 1, pp. 1–5.
[18] A.A. Abidi. 1995. Direct-conversion radio transceivers for digital communications, IEEE Journal of Solid-State Circuits, Vol. 30 No. 12, pp. 1399–1410.
[19] B. Bahlmann and P. Ramkumar, XPD—Cross Polarization Discrimination: http://www.birds-eye.net/defi nition/acronym/?id=1151878664
[20] D.K. Lau and B. Fong. 2011. Prognostics and health management, Microelectronics Reliability, Vol. 51 No. 2 pp. 253-254.
[21] G. Egeland and P. Engelstad. 2009. The Availability and Reliability of Wireless Multi-Hop Networks with Stochastic Link Failures, IEEE Journal on Selected Areas in Communications, Vol. 27 No. 7, pp. 1132–1146.
[22] P. Bernardin, M.F. Yee and T. Ellis. 1998. Cell radius inaccuracy: a new measure of coverage reliability, IEEE Transactions on Vehicular Technology, Vol. 47 No. 4, pp. 1215–1226.
[23] B. Fong, A.C.M. Fong and C.K. Li. 2011. Telemedicine Technologies: Information Technologies for Medicine, Wiley, ISBN: 047074569X.