Outcomes for PSM Alumni 2014 Front · PSM programs require an experiential component that must...
49
Transcript of Outcomes for PSM Alumni 2014 Front · PSM programs require an experiential component that must...

2
Evaluation Report:
PSM Student Outcomes Survey 2014
By
Kiriko Komura
Manager, PSM National Office
Keck Graduate Institute

3
The 2014 PSM Student Outcomes survey was conducted by the PSM National Office at Keck Graduate Institute. This survey was focused on revealing students’ reasons to choose the PSM programs, benefits and attributes of the PSM programs, professional development, and the current conditions of their career paths.
This report will be available online at the PSM National Office website at www.scienemasters.com.
If you have any questions or concerns, please contact us at:
PSM National Office Keck Graduate Institute 535 Watson Drive Claremont, CA 91711 www.sciencemasters.com
Kiriko Komura, Ph.D. (909) 607-9368 [email protected]
Copyright ©2014 Keck Graduate Institute, Claremont, CA. All Rights Reserved. PSM National Office at KGI.

4
Table of Contents
Executive Summary ........................................................................................................................ 5
Introduction ..................................................................................................................................... 7
The Evaluation Process ................................................................................................................... 8
Survey Results ................................................................................................................................ 9
Graduate Information, Fields of Study, Demographics, and Expectations ................................. 9
PSM Program’s Satisfaction, Value to the Occupation ............................................................ 16
PSM Graduates’ Employment Information ............................................................................... 17
Conclusion .................................................................................................................................... 22 Appendix A: Survey ................................................................................................................... 23

5
Executive Summary
In August and September of 2014, a total of 660 alumni of the domestic PSM programs participated in a PSM student outcomes survey. This is the first year that the PSM National Office at Keck Graduate Institute (KGI) began conducting evaluations at the student and institution/program levels. The evaluations were formerly conducted by the Council of Graduate Schools (CGS). The administration of these surveys has now been added to the new responsibilities of the PSM office previously performed by CGS.
This document contains a detailed report about this survey, complementing the CGS surveys performed in the previous years. In July 2014, the transition of these evaluations was implemented by Jeffery Allum, Director, Research and Policy Analysis at CGS and Kiriko Komura, Manager of the PSM Office. Only a few changes were made to the CGS survey.
A total of 660 PSM graduates between 2011-12, 2012-13, and 2013-2014 completed the survey. The participants’ backgrounds and characteristics from the survey revealed that more males responded to this survey, and respondents have diverse racial and ethnic backgrounds. Moreover, the respondents were from a wide range of STEM fields including PSM programs in biotechnology and computer/information science which were the highest attended/chosen/graduated.
The data showed respondent satisfaction as high on the attributes of their PSM program. Attributes cited included the quality of science and/or mathematical training, internship(s) and “real world” practical experiences, and the quality of other non-scientific professional training.
One of the questions in the survey asked the participants to cite the reasons to select the PSM programs. The top three reasons to select the PSM programs were (1) to acquire specific skills and knowledge, (2) to increase opportunities for promotion, advancement and/or pay increases, and (3) to learn more about something in which I am particularly interested.
The survey asked a series of questions regarding the participants’ current jobs, employers and attributes of the PSM that contributed to finding their current positions. For example, questions were asked to determine how valuable PSM degrees have been to the respondents up to the time of the assessment. The greatest values indicated by graduates of the PSM programs were internship(s) and “real world” practical experiences, the quality of scientific and/or mathematical training, and post-graduation employment prospects. The data indicated that roughly 90 percent of the PSM graduates who responded to this survey attained full-time jobs closely related to their master’s degree.
Participants in this survey commented on how their PSM programs experiences were beneficial to their skills and knowledge, career choices and development, and their continued education. The data indicated that the top three main benefits of having earned a PSM degree were acquiring new skills and knowledge, learning more about something in which the participant was particularly interested in, and increasing opportunities for promotion, advancement, and/or pay.

6
The PSM experience was very effective for their professional development and achieving career goals. Participants commented very positively. The survey allowed the participants to provide open-ended comments, to which 145 respondents provided statements. Comments included: “the rich experience,” the “best decision,” the “most valuable experience,” the “good networking,” the “hands-on experience,” the “best opportunities,” and the “wide range of STEM disciplines including defense and security.” The experiential component in their programs’ curriculum and the internship experiences received mixed responses. Analysis of the data revealed how the internship experience was beneficial for the students to acquire skills and knowledge and practical experiential training. The data showed that the alumni of the programs did not necessarily obtain their current occupations directly due to internships affiliated with their master’s program. Furthermore, the PSM alumni suggested that the PSM programs should include more business and finance courses and can be improved by developing their respective curricula as recommended by each program’s employer advisory board. The respondents again remarked on this point in the open-ended comments section. They offered areas of improvement, such as non-profit management courses, more lab training, a certificate to work in the medical field, and increasing the reputation of the PSM for potential employers.
In general, most participants responded positively to how the program enhanced their career development and aided in achieving their goals. Overall, we find that the guidelines of the PSM and the features of the programs contributed well to the students’ professional development through the quality of both the scientific and/or mathematical training and the non-scientific professional training.
The 2013 -2014 academic year represented an important milestone for the PSM movement, with the celebration of the 300th PSM program affiliation. The increasing numbers of PSM programs through development and effort are receiving the recognition of the state, institutions, and institution’s advisory board members. The results of this student outcomes survey showed that those efforts and our survey findings are well aligned. The results of the survey strongly support the proposition that PSM program prepares graduates for outstanding careers in STEM disciplines

7
Introduction
The assessment was targeted to PSM graduates during the past 3 academic years (2011-2012, 2012-2013, and 2013-2014). Some institutions are new to PSM and only their 2013-2014 graduates participated in this survey. The survey was facilitated by each PSM program’s directors, coordinators, deans or alumni offices. Distribution ended in September. This survey’s results were analyzed by quantitative analysis and released as a PSM Student Outcomes Report on the PSM National Office website. Because of the recent transition, the PSM office created and developed new online surveys and sweepstakes rules and systems.
The more specific goals and objectives of the survey were presented in this report. Below is an excerpt taken directly from the previous year’s report.
The PSM degree is designed to allow students to pursue advanced training in science, while simultaneously developing workplace skills highly valued by employers. PSM programs prepare graduates for careers in business, government, and non-‐profit organizations, combining rigorous study in science and/or mathematics with coursework in management, policy, law, or related fields. Along with an emphasis on the development of professional skills such as writing, leadership, and communication, most PSM programs require an experiential component that must include a final project that is developed with an employer, often during the course of an internship (PSM Student Outcomes Report, 2013, p.1).
In addition, the evaluator included questions about demographics (race/ethnicity and gender), and open-ended comments sections to this year’s survey to understand better the current and future trends of the PSM programs. Furthermore, the questions about the levels of satisfaction and the main reasons to enroll in the master’s programs were asked without comparing student status vs. working status.
Furthermore, as the report stated earlier, this is the first survey administered by the PSM National Office at KGI. With respect to the former surveys and reports, the evaluator did not compare the data between the previous year and current year. The comparison will be the next step in the following year when the PSM national office conducts the second survey.
Finally, we appreciate each of the participants’ of the survey and institutions who distributed the survey. Their time and effort contributes to and is revealed throughout this evaluation.

8
The Evaluation Process
The evaluation of the 2014 PSM student outcomes survey process included:
1. Online-survey instrument development 2. Survey invitation distribution 3. Survey distribution by facilitator at each institution or program. The survey was
administered in August and September of 2014. 4. Survey data collection 5. Survey data analysis in October 2014
In July, the PSM National Office at KGI developed and formulated the online survey and the sweepstakes rules and systems, based on what CGS previously administered, and launched the first survey.
Prior to the data collection, the survey invitation, including the online survey link, was distributed to the PSM program coordinators, directors, deans or provosts of their graduate education offices. As of October 2014, the total number of PSM programs is 322. However, the survey invitation was sent to the 302 domestic PSM programs, which includes the ones affiliated with PSM for more than one year, but did not include the ones affiliated with PSM for less than one year.
Upon the approval or agreement of each institution or program, they distributed this survey to their graduates. However, some institutions did not distribute this survey because they were confused about the PSM National Office administering the survey. They also did not want to distribute the same survey to their graduates who participated in the survey previously. Other reasons included that they have similar surveys at their institutions administered by their alumni offices.
The survey data collection was completed at the end of September. The online survey was administered using Survey Monkey and a technical consultant worked with the PSM Office to assist with the entire process of the online survey development, distribution, and data collection to ensure that the collected data was kept confidential. SPSS, the statistical software, was used to analyze and summarize the statistical data. Analysis did not focus on summarizing by subgroup. Analysis was primarily targeted on the sample as a whole group.
9
Survey Results
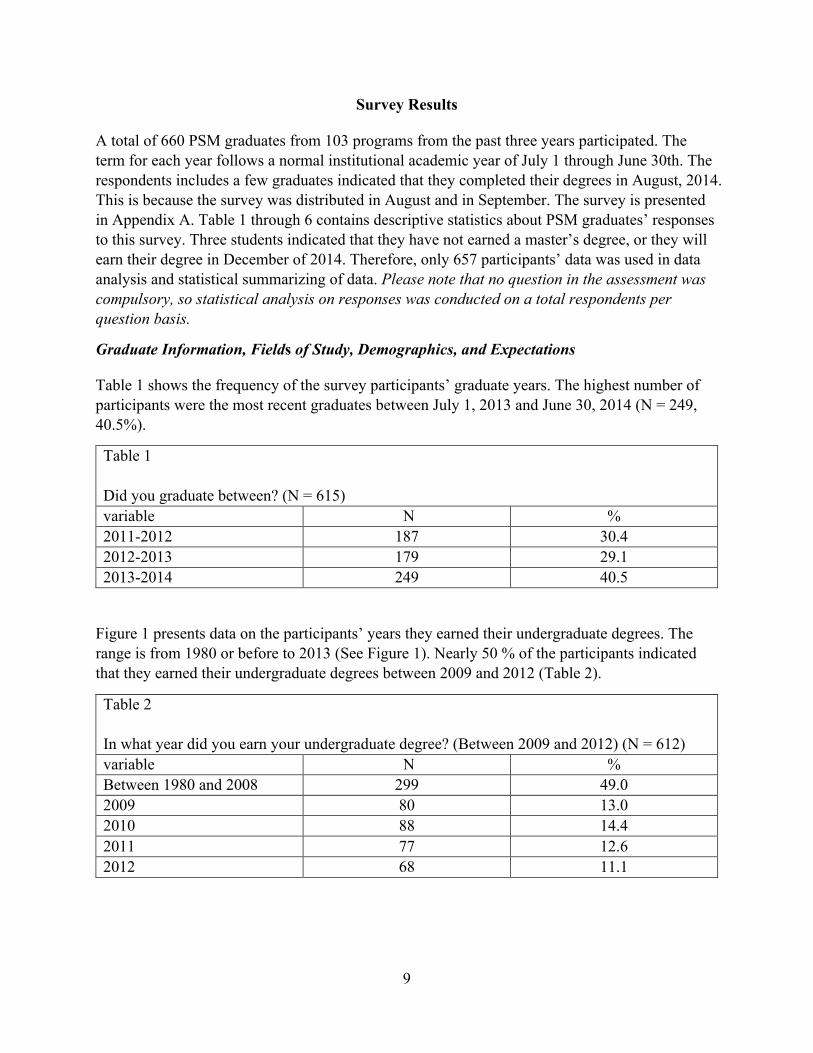
A total of 660 PSM graduates from 103 programs from the past three years participated. The term for each year follows a normal institutional academic year of July 1 through June 30th. The respondents includes a few graduates indicated that they completed their degrees in August, 2014. This is because the survey was distributed in August and in September. The survey is presented in Appendix A. Table 1 through 6 contains descriptive statistics about PSM graduates’ responses to this survey. Three students indicated that they have not earned a master’s degree, or they will earn their degree in December of 2014. Therefore, only 657 participants’ data was used in data analysis and statistical summarizing of data. Please note that no question in the assessment was compulsory, so statistical analysis on responses was conducted on a total respondents per question basis.
Graduate Information, Fields of Study, Demographics, and Expectations
Table 1 shows the frequency of the survey participants’ graduate years. The highest number of participants were the most recent graduates between July 1, 2013 and June 30, 2014 (N = 249, 40.5%).
Table 1 Did you graduate between? (N = 615) variable N % 2011-2012 187 30.4 2012-2013 179 29.1 2013-2014 249 40.5
Figure 1 presents data on the participants’ years they earned their undergraduate degrees. The range is from 1980 or before to 2013 (See Figure 1). Nearly 50 % of the participants indicated that they earned their undergraduate degrees between 2009 and 2012 (Table 2).
Table 2 In what year did you earn your undergraduate degree? (Between 2009 and 2012) (N = 612) variable N % Between 1980 and 2008 299 49.0 2009 80 13.0 2010 88 14.4 2011 77 12.6 2012 68 11.1

10
Table 3 presents data on the PSM graduates’ STEM disciplines. The list of disciplines follows the 22 disciplines listed in the PSM Program Locator, found on the PSM website. Biotechnology and Computer/Information Sciences were high, roughly 20 %, and Environmental Sciences/Climate Sciences followed at 12.2 %. However, as Table 3 demonstrates, the PSM graduates’ STEM fields of study vary widely, which is one of the features of the PSM programs’ emphasizing the application of STEM fields.
Table 3 Respondent’s STEM field of study (N = 632) STEM field N % Biotechnology 136 21.5 Bioinformatics / Computational 20 3.2 Pharmaceutical Sciences / Pharmacology 16 2.5 Other Biological Sciences 56 8.9 Chemistry / Chemical Sciences 8 1.3 Computer / Information Sciences 132 20.9 GIS / Remote Sensing 4 .6 Agriculture/ Natural Resources 15 2.3 Environmental Sciences / Climate Sciences 77 12.2
N
Year

11
Earth / Atmospheric / Ocean Sciences 19 3.0 Energy / Power 5 .8 Forensic Sciences 7 1.1 Statistics / Biostatistics 23 3.6 Financial Mathematics 3 .5 Biomathematics 1 .2 Industrial Mathematics 13 2.1 Other Mathematics 53 8.4 Medical-Related Sciences 10 1.6 National Defense 7 1.1 Physics / Applied Physics 1 .2 Nanoscience 18 2.8 Other Interdisciplinary Science 8 1.2
Table 4 demonstrates the PSM graduates’ statuses/situations before they enrolled in their PSM programs. As the data reveals, 46.1% (N = 282) of the respondents were employed only, without additional obligations, and 20.3% (N = 124) of participants were simultaneously working and pursuing their academic endeavors. Respondents who were only students, without simultaneously holding a professional occupation, followed as 23.7% (N = 145). Therefore, 66.4 % of the respondents were working professionals prior to enrolling in their PSM programs.
Table 4 Think back to the time period immediately before you enrolled in this master’s program. Which one of the following best describes your situation then? (N = 612) Status before enrolling in the PSM programs N % I was a student 145 23.7 I was both working and a student 124 20.3 I was caring for family full-time 9 1.5 I was not working, but seeking work 42 6.9 I was working 282 46.1 Other 10 1.5
The survey also asked if the participants have changed their occupation before and after their master’s programs. As can be seen in Table 5, nearly 54% of the respondents changed their profession after completion of their PSM programs.

12
Table 5 Is your current job the same job you had when you began your maser’s degree (N = 519 ) variable N % Yes 125 24.1 No 280 53.9 I was not working immediately prior to starting my master’s degree
114 22.0
This year’s survey asked questions about the PSM graduate’s race/ethnicity and gender to capture their demographics. As Table 6 presents, just under 10 percent more male graduates (N=324, 55.3%) than female graduates (N = 258, 44.0%) participated in this survey. Three hundred forty of the participants identified themselves as White/Non-Hispanic, 140 as Asian/Asian American, 70 as African American. Other Latino, Mexican/Chicano, American Indian/Alaska Native, and Native Hawaiian/Pacific Islander followed respectively in self-identification by percentage of respondents.
Table 6 Demographics and Characteristics variable N (%) Gender (N = 586) Female 258 (44.0) Male 324 (55.3) Unknown 4 (0.7) Race/Ethnicity (N = 587)* African American/Black 70 (12.2) American Indian/Alaska Native 9 (1.6) Asian/Asian American 140 (24.5) Mexican/Chicano 14 (2.4) Native Hawaiian/Pacific Islander 3 (0.5) Other Latino 23 (4.0) White/Non-Hispanic 340 (59.4) Other* 15 Note. The sum of the percentage is greater than 100 % due to some respondents identifying more than one ethnicity. Note. The responses percentage excludes responses of ‘other.’

13
Table 7 presents the main reasons respondents elected to attend their PSM programs. The survey participants were allowed to check three main reasons. The participants selected different reasons, and the numbers and percentage add up to more than 657 people. This year the survey analysis did not compare the differences in this question: students who were working vs. not working as about 70 percent of the students indicated that they were working before enrolling in the program as Table 4 discussed. The respondents ranked the top 5 reasons as:
To acquire specific skills and knowledge
To increase opportunities for promotion, advancement, and/or pay
To learn more about something in which I am particularly interested.
To facilitate a job/career change and the timing of earning the master’s degree
It was the best option available at the time
Analysis of the data reveals that the PSM program students’ reasons to select the program is more weighted on their professional development and preparation for their future careers, which meets the PSM guidelines regarding the professional skills and experiential components. However, “To meet requirements of a prospective employer, and my current employer” were both ranked lower. Additional responses to this question included how they desired more opportunities to work on a research grant from federal agencies, such as NSF, to have more business courses, and more faculty member’s engagement in the program.
Table 7 What were the three main reasons why you chose to enroll in this master’s program? (N = 1732) Rank variable N %
1 To acquire specific skills and knowledge 434 25.1
2 To increase opportunities for promotion, advancement, and/or pay 343 19.8
3 To learn more about something in which I am particularly interested 328 18.9
4 To facilitate a job/career change 253 14.6 5 It was the best option available at the time 141 8.1
6 To use as a stepping stone for further education (e.g., Ph.D.) 112 6.6
7 To meet requirements of a prospective employer 87 5.0 8 To meet requirements of my current employer 11 0.6
Other 23 1.3 Note that these respondents each selected three choices. (A few selected only one or two.) Each percentage reported in this table is the percentage of the total number of responses, 1732. That is, each % equals the number who chose that option divided by 1732, (N/1732). Thus, the percentages will add to 100%, representing all the responses.

14
Table 8 What are the three main benefits of having earned a Professional Science Masters’ Degree? (N = 1691) Rank variable N %
1 I have acquired new skills and knowledge 432 25.5
2 I learned more about something in which I am particularly interested 312 18.5
3 It increased opportunities for promotion, advancement, and/or pay 292 17.3
4 It helped me to facilitate a job/career change 194 8.7
5 It will help me meet the requirements of a prospective employer 147 11.5
6 It was the best available option at the time 108 6.4 7 It helped meet the requirements of my current employer 86 5.1 8 It will be a stepping stone for further education 93 5.5
Other 27 1.6 Note that these respondents each selected three choices. (A few selected only one or two.) Each percentage reported in this table is the percentage of the total number of responses, 1691. That is, each % equals the number who chose that option divided by 1691, (N/1691). Thus, the percentages will add to 100%, representing all the responses.
As can be seen in Table 8, the same variables were used to ask PSM graduates about the benefits of having earned a PSM degree. An interesting incite was revealed regarding how the respondents ranked the variables of the top 3 reasons to select the PSM programs and the benefits of the PSM program similarly. These variables include: acquired skills and knowledge; increased opportunities for promotion, advancement, and/or pay; learned more about something in which they are interested. This finding demonstrates that the PSM graduates were able to have the benefits of earning their PSM degrees equal with their reasons to enroll in the PSM programs.
Table 9 discusses which topics were covered by the PSM programs. As the numbers in the table show, responses add up to more than the 657 survey respondents. A technical and/or scientific topic ranked the highest, but this is expected because the PSM program is a STEM featured program. The second, third, and fourth topic follows as project management, ethics, and research development. Respondents also selected leadership and communication skills. Regarding the computer programming and analysis design, the computer/information field was one of the highest fields of study in this survey. PSM guidelines recommend a professional skills component of 20%, and the topics related to the component were well covered as the respondents indicated. Public policy and teaching and/or training ranked low, which the majority of the PSM programs do not include in their curriculums anyway. Furthermore, they shared that specific topics, such as management, finance, and problem solving were covered in their PSM programs.

15
Table 9 Which of the following topics were covered by your master’s program? (select all that apply) (N = 3974) variable N % Technical and/or Scientific 500 12.6 Project management 419 10.5 Ethics 416 10.5 Research Development 383 9.6 Leadership 314 7.9 Communications 309 7.8 Regulatory affairs 268 6.7 Computer programming, analysis design 254 6.4 General management 239 6.0 Patents, licensing, trademarks 230 5.8 Marketing and/or sales 196 4.9 Production and/or quality control 190 4.8 Public Policy 167 4.2 Teaching and/or training 71 1.8 Other 18 0.5 Other: Bioinformatics topics, Statistics, Business and Entrepreneurship, Clinical Prosthetics and Orthotics training, Computer and Information Security, Environmental Management, Finance, Information Technology, Medical Physics, Problem Solving, Zoo Animal Behavior Note that these respondents each selected minimum one and maximum fifteen choices. Each percentage reported in this table is the percentage of the total number of responses, 3974. That is, each % equals the number who chose that option divided by 3974, (N/3974). Thus, the percentages will add to 100%, representing all the responses.
Along the same variables, respondents were asked to evaluate the fields of their principal employers. Technical and /or scientific areas of work remain high. However, the frequencies of areas of work are a wider range in comparison with the topics covered by the PSM programs. That the variety of topics in both science and non-science, and experiential and professional skills curriculum are performed by the PSM graduate’s current work are both interesting findings (Table 10).
Table 10 What primary work activities do you perform at your principal employer (select all that apply) (N= 1898) variable N % General management 136 7.2 Project management 221 11.6 Ethics 65 3.4 Computer programing, analysis, design 149 7.9 Regulatory affairs 98 5.2

16
Leadership 148 7.8 Technical and/or scientific 328 17.3 Public Policy 33 1.7 Marketing and/or sales 64 3.4 Patents, Licensing, trademarks 20 1.1 Communications 156 8.2 Production and/or quality control 116 6.1 Research and development 203 10.7 Teaching and/or training 119 6.3 Other 42 2.2 Note that these respondents each selected minimum one and maximum fifteen choices. Each percentage reported in this table is the percentage of the total number of responses, 1898. That is, each % equals the number who chose that option divided by 1898, (N/1898). Thus, the percentages will add to 100%, representing all the responses.
PSM Program’s Satisfaction, Value to the Occupation
Table 11 reports on data about the satisfaction-attributes of the masters’ programs. As can be seen in Table 11, six variables were measured by four different levels of satisfaction (Likert Scale). The three variables that have high satisfaction levels include:
The quality of scientific and/or mathematical training
Internship(s) and “real world” practical experiences
The quality of non-scientific professional training
However, the mean score of the other three variables are very close, roughly 3.00. These findings show that the respondents are generally satisfied with the program due to the components of the PSM programs and the PSM guidelines.
The survey asked participants to rank the attributes of the PSM programs in terms of how valuable they are to the alumni now. The same 6 variables for asking the satisfaction were used. As Table 12 demonstrates, the variables listed as high in Table 11 were also ranked high. One difference was that the value of the post-graduation employment prospects was ranked higher than their satisfaction level. This finding is relevant because once the graduates attain work, they find more value in the PSM’s expectations for the PSM students to be well trained and prepared for their post-graduation employment.
Table 11 How satisfied are you with each of the following attributes of this master’s program?
variable Very
dissatisfied Somewhat dissatisfied
Generally satisfied
Very satisfied
Total N Mean SD
Post-graduation employment prospects 43 (7.6) 97 (17.1) 261 (46.0) 166 (29.3) 567 2.98 .876

17
The quality of scientific and/or mathematical training 6 (1.0) 61 (10.6) 295 (51.2) 214 (37.2) 576 3.25 .678 The distinctive nature/reputation of the program 44 (7.9) 86 (15.5) 255 (45.9) 171 (30.8) 556 2.99 .883 Internship (s) and “real world” practical experiences 35 (6.6) 72 (13.7) 171 (32.4) 249 (47.2) 527 3.20 .914 The quality of non-scientific professional training 17 (3.0) 93 (16.5) 292 (51.7) 163 (28.8) 565 3.06 .755 Networking opportunities 37 (6.4) 103 (17.9) 254 (44.2) 181 (31.5) 575 3.01 .868 Note. missing data and N/A respondents were not included Note. 1 = Very dissatisfied, 2 = Somewhat dissatisfied, 3= Generally satisfied, 4= Very satisfied
Table 12 Rank the following six attributes of your master’s experience in terms of how valuable they are to you Now. (N=592) Not at all
valuable Minimally valuable
Generally valuable
Highly valuable
Total N Mean SD
variable N (%) N (%) N (%) N (%) Post-graduation employment prospects 38 (6.9) 81 (14.6) 227 (41.0) 208 (37.5) 554 3.09 .888 The quality of scientific and/or mathematical training 22 (4.1) 82 (15.3) 254 (47.5) 177 (33.1) 535 3.10 .800 The distinction of having earned a PSM degree 52 (8.9) 105 (18.0) 242 (41.5) 184 (31.6) 583 2.96 .923 Internship(s) and “real world” practical experiences 44 (8.7) 72 (14.2) 149 (29.3) 243 (47.8) 508 3.16 .970 The quality of professional training (e.g. business, law, communications, etc.) 23 (4.1) 109 (19.3) 259 (45.8) 175 (30.9) 566 3.04 .815 Networking 42 (7.5) 135 (24.0) 199 (35.4) 186 (33.1) 562 2.94 .932 Note. missing data and N/A respondents were not included Note. 1 = Not at all valuable, 2 = Minimally valuable, 3= Generally valuable, 4= Highly valuable
PSM Graduates’ Employment Information
The survey included questions to capture the PSM graduates’ trends in their career paths and current job statuses. Moreover, the survey was designed to understand the value and satisfaction of the graduates’ programs in relation with their current occupations.
Table 13 reports on data regarding the PSM graduates’ current situations. Unsurprisingly, a total of 86.2% of the respondents were currently working. Only about 5% of the respondents were students, and 6.2% were not working but seeking work.

18
Table 13 Which one of the following best describes your current situation? (N = 601) variable N % I am a student 28 4.7 I am both working and a student 31 5.2 I am caring for family full-time 6 1.0 I am not working but seeking work 37 6.2 I am working 487 81.0 Other 12 2.0
The survey participants who responded “I am working” and “I am both working and a student” were asked whether or not their PSM degrees were closely related to their current work. Additionally, the participants who responded as currently being a student, beyond the PSM degree, were asked whether or not their current academic programs were closely related to their PSM degrees. Table 14 and 15 presents this data. Nearly 61% of respondents indicated that their current work is closely related to their PSM degree. About 54% of the respondents stated that their current academic program is closely related to their PSM degree. Forty-three responded that their current work is not closely related to their PSM degrees. The survey asked them to select the reasons. The following reasons were ranked high: there are no suitable jobs in my preferred field, this job pays more, this job is more suitable to my skills and interests; and this job is more local/convenient (Table 16). The other reason also identified was how the location matters. Moreover best available job for the time being, cannot find a job with my degree and experience, currently working to get out of my field and into one related to my degree, I am interested in another field, and multiple master’s degree were also indicated.
Table 14 Is the work you are doing now closely related to your master’s degree (N = 519)* variable Frequency (N) % Yes, it is closely related 315 60.7 Yes, it is somewhat related 161 31.0 No, it is not at all related 43 8.3 Note. This question was only answered by the respondents in the Table 13. N=31 (working and a student) + 487 (working) + 1 (other) =519 (See text above.)

19
Table 15 Is your program of study closely related to your master’s degree (N = 28) variable N % Yes, it is closely related 15 53.6 Yes, it is somewhat related 10 35.7 No, it is not at all related 3 10.7 This question was only answered by the respondents in the Table 13. N=28 (a student)
Table 16 Why are you working in this job, as opposed to a job more closely related to your master’s degree? (Select all that apply) (N = 74) variable N % This job is more local/convenient 8 10.8 This job is more secure 6 8.1 There are no suitable jobs in my preferred field 14 18.9 This job offers better opportunities for advancement 6 8.1 This job is more suitable to my skills and interests 8 10.8 This job is more interesting 4 5.4 This job pays more 10 13.5 I prefer a job not related to my master’s degree 2 2.7 Other 16 21.6 This question was only answered by the respondents in the Table 14. (No, it is not at all related). Note that these respondents each selected minimum one and maximum nine choices. Each percentage reported in this table is the percentage of the total number of responses, 74. That is, each % equals the number who chose that option divided by 74, (N/74). Thus, the percentages will add to 100%, representing all the responses.
Internship(s) experiences were highly ranked in the measure of participant satisfaction with their PSM programs and highly valuable to their current occupation (Table 11, Table 12). The survey also included a question to understand the relationships between graduates’ internship experiences and their current job. This question was only asked to the respondents who indicated that they are currently working. However, as Table 17 presents, interestingly, PSM graduates did not pursue their employment directly because of an internship affiliated with their programs (N = 279, 76.3%). This finding suggests that the internships were more toward helping graduates with their reasons to select and benefits of their programs to acquire skills and have hands on experiences. However, the experiences did not directly influence their job pursuits.

20
Table 17 Did you get this job because of an internship affiliated with our master’s program (N = 279 ) variable N % Yes 66 23.7 No 213 76.3
Table 18 through Table 20 report data regarding the respondents’ demographics and characteristics that are currently working or both working and students. It is not surprising that 95.5% of the PSM graduates in this survey have full-time jobs. Business industry (N = 260, 50.5%) and government employee (N = 116, 22.4 %) are ranked higher than the other principal employers. Their annual salaries vary, but range between $40,000 and $69,999 totaling 45.2% of the respondents.
Table 18 Which one of the following best describes the sector of your principal employer during the month of August, 2014? (N = 517) variable N % Academia 48 9.3 Business industry (including self-employed) 261 50.5 Government 116 22.4 Non-profit 33 6.4 Start-up business/enterprise 31 6.0 Other 28 5.4
Table 19 Is your employment full time or part time? (N = 513) variable N % Full-time (35 or more paid hours/week) 490 95.5 Part-time (less than 35 paid hours per week) 23 4.5

21
Table 20 What was your base ANNUAL salary for your principal job as of August 2014? (N = 507) variable N % $29,999 or less 33 6.5 $30,000 to $39,999 31 6.1 $40,000 to $49,999 73 14.4 $50,000 to $59,999 81 16.0 $60,000 to $69,999 75 14.8 $70,000 to $79,999 64 12.6 $80,000 to $89,999 39 7.7 $90,000 to $99,999 31 6.1 $100,000 to $109,999 28 5.5 $110,000 to $119,999 17 3.4 $120,000 or more 35 6.9

22
Conclusion
This report identifies the current trends of the PSM programs’ graduates by evaluating PSM graduates’ outcomes. The purpose of this evaluation was to understand how their PSM degrees are relevant to their career paths and professional development. This evaluation utilized an online survey, which was distributed to the 302 domestic PSM programs with a survey instrument developed to meet this evaluation’s purposes. The survey was distributed to the alumni through their institution’s program directors, coordinators, or deans/provosts. Descriptive statistics was employed to assess PSM graduates over the past 3 years to summarize their demographics and backgrounds. The summarized data included their STEM disciplines, prior PSM program experiences/statuses, post degree-attainment experiences/statuses, and PSM programs’ experiences and post-PSM degree outcomes. Results from two Likert scale questions of PSM program satisfaction and attributes of the PSM degrees include mean, standard deviation, and frequencies. Based on the results of this survey, it is clear that PSM graduates’ reasons for selecting their programs and the reported value of the PSM during the first few years of employment, are consistent. This suggests that the PSM brand and the value proposition were clear to most respondents upon enrollment in a PSM program. The students highly ranked their programs’ benefits in both science and non-science curricula and components, which supports the requirements stated in the PSM Guidelines. Additionally, the report shows that students’ expectations in professional development and future career success are high. The next step for the PSM programs is to support students to increase opportunities for hands-on experiences and develop more networking and marketing to promote PSM programs, and improve the PSM brand/reputation for the students to have better access to occupations closely aligned with their fields of study and interests.

23
Appendix A:
Survey
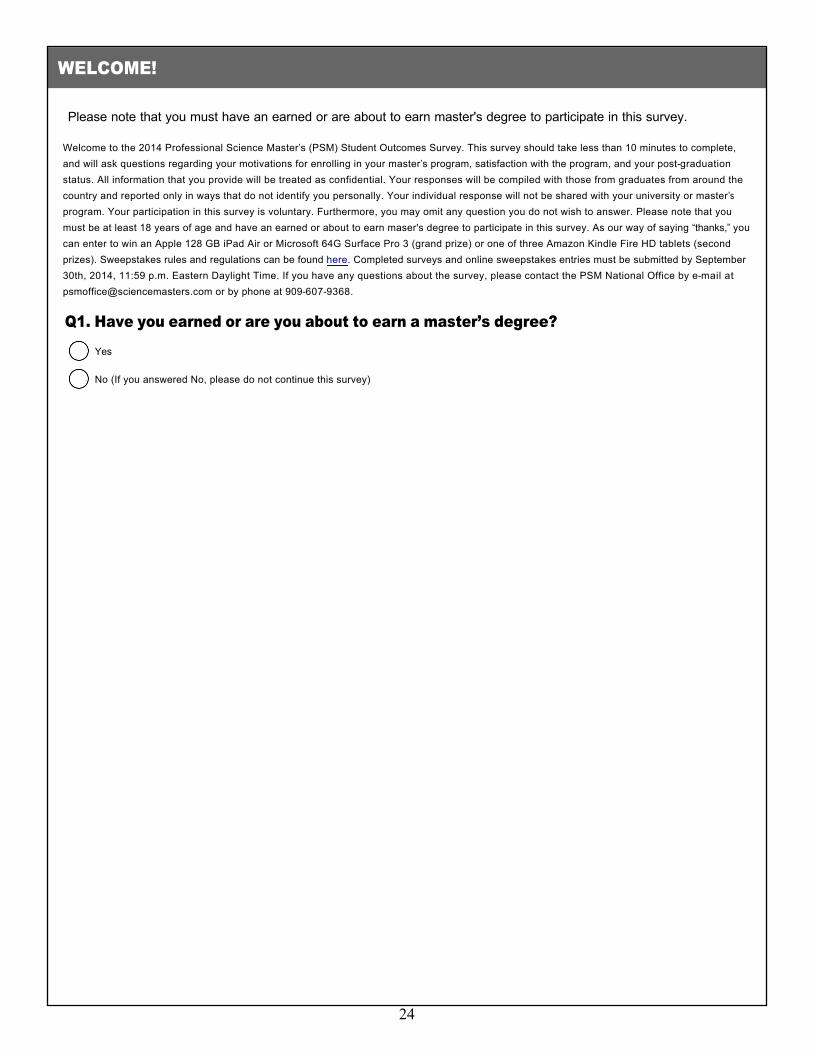
Please note that you must have an earned or are about to earn master's degree to participate in this survey.
Welcome to the 2014 Professional Science Master’s (PSM) Student Outcomes Survey. This survey should take less than 10 minutes to complete, and will ask questions regarding your motivations for enrolling in your master’s program, satisfaction with the program, and your postgraduation status. All information that you provide will be treated as confidential. Your responses will be compiled with those from graduates from around the country and reported only in ways that do not identify you personally. Your individual response will not be shared with your university or master’s program. Your participation in this survey is voluntary. Furthermore, you may omit any question you do not wish to answer. Please note that you must be at least 18 years of age and have an earned or about to earn maser's degree to participate in this survey. As our way of saying “thanks,” you can enter to win an Apple 128 GB iPad Air or Microsoft 64G Surface Pro 3 (grand prize) or one of three Amazon Kindle Fire HD tablets (second prizes). Sweepstakes rules and regulations can be found here. Completed surveys and online sweepstakes entries must be submitted by September 30th, 2014, 11:59 p.m. Eastern Daylight Time. If you have any questions about the survey, please contact the PSM National Office by email at [email protected] or by phone at 9096079368.
Q1. Have you earned or are you about to earn a master’s degree?
WELCOME!
Yes
nmlkj
No (If you answered No, please do not continue this survey)
nmlkj
24

From which of the following academic institutions and master’s programs did you graduate?
6
Other (please specify)
25

Did you graduate between ...
6
Other (please specify)
26

In what year did you earn your undergraduate degree?
6
Other
27

Think back to the time period immediately before you enrolled in this master’s program. Which one of the following best describes your situation then?
REASONS FOR ENROLLING
I was working
nmlkj
I was both working and a student
nmlkj
I was a student
nmlkj
I was caring for family fulltime
nmlkj
I was not working, but seeking work
nmlkj
Other (please specify)
nmlkj
28
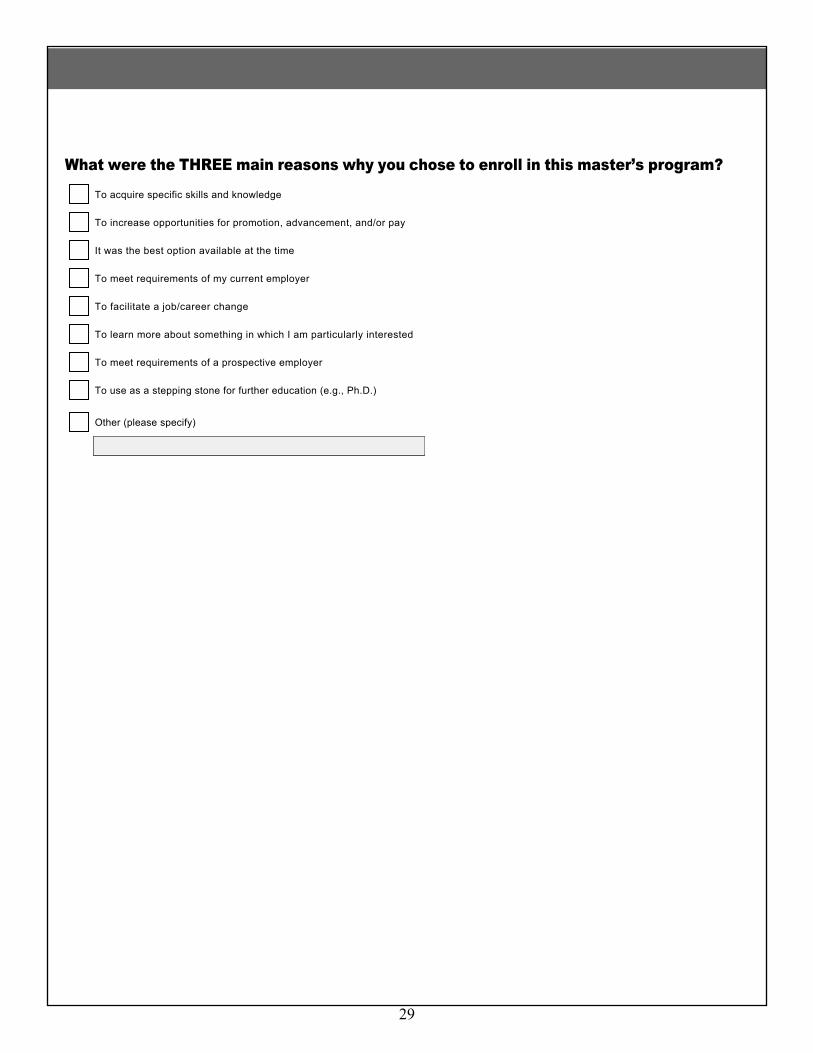
What were the THREE main reasons why you chose to enroll in this master’s program?
To acquire specific skills and knowledge
gfedc
To increase opportunities for promotion, advancement, and/or pay
gfedc
It was the best option available at the time
gfedc
To meet requirements of my current employer
gfedc
To facilitate a job/career change
gfedc
To learn more about something in which I am particularly interested
gfedc
To meet requirements of a prospective employer
gfedc
To use as a stepping stone for further education (e.g., Ph.D.)
gfedc
Other (please specify)
gfedcOther
29

Which of the following topics were covered by your master’s program? (Select all that apply.)
SATISFACTION WITH THE MASTER’S PROGRAM
Patents, licensing, trademarks
gfedc
Project management
gfedc
Public policy
gfedc
Computer programming, analysis, design
gfedc
Marketing and/or sales
gfedc
Regulatory affairs
gfedc
Technical and/or scientific
gfedc
General management
gfedc
Research and development
gfedc
Communications
gfedc
Ethics
gfedc
Production and/or quality control
gfedc
Leadership
gfedc
Teaching and/or training
gfedc
Other (please specify)
gfedc
30

How satisfied are you with each of the following attributes of this master’s program?
Very satisfied Generally satisfied Somewhat dissatisfied Very dissatisfied N/A
Internship(s) and “real world” practical experiences
nmlkj nmlkj nmlkj nmlkj nmlkj
Postgraduation employment prospects
nmlkj nmlkj nmlkj nmlkj nmlkj
The quality of scientific and/or mathematical training
nmlkj nmlkj nmlkj nmlkj nmlkj
Networking opportunities nmlkj nmlkj nmlkj nmlkj nmlkj
The distinctive nature/reputation of the program
nmlkj nmlkj nmlkj nmlkj nmlkj
The quality of nonscientific professional training (e.g., business, law, communications, etc.)
nmlkj nmlkj nmlkj nmlkj nmlkj
31

Which one of the following best describes your current situation?
YOUR CURRENT SITUATION
I am working
nmlkj
I am both working and a student
nmlkj
I am a student
nmlkj
I am caring for family fulltime
nmlkj
I am not working, but seeking work
nmlkj
Other (please specify)
nmlkj
32

Is the work you are doing now closely related to your master’s degree?
Yes, it is closely related
nmlkj
Yes, it is somewhat related
nmlkj
No, it is not at all related
nmlkj
33

Is your program of study closely related to your master’s degree?
Yes, it is closely related
nmlkj
Yes, it is somewhat related
nmlkj
No, it is not at all related
nmlkj
34

Why are you working in this job, as opposed to a job more closely related to your master’s degree? (Select all that apply.)
This job is more suitable to my skills and interests
gfedc
There are no suitable jobs in my preferred field
gfedc
This job is more interesting
gfedc
This job pays more
gfedc
This job offers better opportunities for advancement
gfedc
This job is more local/convenient
gfedc
This job is more secure
gfedc
I prefer a job not related to my master’s degree
gfedc
Other (please specify)
gfedc
35

Is your current job the same job you had when you began your master’s degree?
Yes
nmlkj
No
nmlkj
I was not working immediately prior to starting my master’s degree
nmlkj
36

Did you get this job because of an internship affiliated with your master’s program?
Yes
nmlkj
No
nmlkj
37

Which one of the following best describes the SECTOR of your principal employer during the month of August, 2014? (By principal employer, we mean the one employer that constitutes the majority of your time. If you have more than one employer, consider the employer who compensates you the most as your principal employer.)
EMPLOYMENT INFORMATION
Business/industry (including selfemployed)
nmlkj
Startup business/enterprise
nmlkj
Government
nmlkj
Academia
nmlkj
Nonprofit
nmlkj
Other (please specify)
nmlkj
38

What was the title of the principal job you held during the month of August, 2014?
55
66
39
Is your employment fulltime or parttime?
Fulltime (35 or more paid hours per week)
nmlkj
Parttime (less than 35 paid hours per week)
nmlkj
Other (please specify)
40

What primary work activities do you perform at your principal employer? (Select all that apply.)
Ethics
gfedc
Technical and/or scientific
gfedc
Marketing and/or sales
gfedc
Leadership
gfedc
Production and/or quality control
gfedc
Project management
gfedc
Research and development
gfedc
Regulatory affairs
gfedc
Computer programming, analysis, design
gfedc
Communications
gfedc
Public policy
gfedc
General management
gfedc
Patents, licensing, trademarks
gfedc
Teaching and/or training
gfedc
Other (please specify)
gfedc
41

What was your base ANNUAL salary for your principal job as of August 2014? (Exclude bonuses, overtime, benefits, or secondary compensation.)
$29,999 or less
nmlkj
$30,000 to $39,999
nmlkj
$40,000 to $49,999
nmlkj
$50,000 to $59,999
nmlkj
$60,000 to $69,999
nmlkj
$70,000 to $79,999
nmlkj
$80,000 to $89,999
nmlkj
$90,000 to $99,999
nmlkj
$100,000 to $109,999
nmlkj
$110,000 to $119,999
nmlkj
$120,000 or more
nmlkj
42

What are the THREE main benefits of having earned a Professional Science Master's degree?
VALUE OF YOUR MASTER’S DEGREE
It helped me meet the requirements of my current employer
gfedc
It will help me meet the requirements of a prospective employer
gfedc
It helped me to facilitate a job/career change
gfedc
It was the best available option at the time
gfedc
I learned more about something in which I am particularly interested
gfedc
It increased opportunities for promotion, advancement, and/or pay
gfedc
I have acquired new skills and knowledge
gfedc
It will be a stepping stone for further education (e.g., Ph.D., M.D., PharmD., J.D.)
gfedc
Other (please specify)
gfedc
43

Rank the following six attributes of your master’s experience in terms of how valuable they are to you NOW.
Highly valuable Generally valuable Minimally valuable Not at all valuable N/A
The quality of professional training (e.g., business, law, communications, etc.)
nmlkj nmlkj nmlkj nmlkj nmlkj
Internship(s) and “real world” practical experiences
nmlkj nmlkj nmlkj nmlkj nmlkj
Postgraduation employment prospects
nmlkj nmlkj nmlkj nmlkj nmlkj
Networking nmlkj nmlkj nmlkj nmlkj nmlkj
The quality of scientific and/or mathematical training
nmlkj nmlkj nmlkj nmlkj nmlkj
The distinction of having earned a Professional Science Master’s (PSM) degree
nmlkj nmlkj nmlkj nmlkj nmlkj
44

How would you classify yourself? (Check all that apply.)
African American/Black
gfedc
American Indian/Alaska Native
gfedc
Asian/Asian American
gfedc
Mexican American/Chicano
gfedc
Other Latino
gfedc
Native Hawaiian/Pacific Islander
gfedc
White/NonHispanic
gfedc
Other (please specify)
45

What is your gender?
Male
nmlkj
Female
nmlkj
Unkown
nmlkj
46

Are there any additional comments you wish to make?
55
66
47

Thank you very much for participating in this survey. A summary report of the findings will be available at www.sciencemasters.com later this summer.
SWEEPSTAKES: As our way of saying “thank you” for your participation, the PSM National Office would like to offer you the chance to win an Apple 128 GB iPad Air Wifi or Microsoft 64G Surface Pro 3 (grand prize) or one of three Amazon Kindle Fire HD tablets (second prizes). To enter the sweepstakes, click "done" below, and you will be redirected to the sweepstakes entry form. By going to a different web site, we can assure that your sweepstakes entry will not be connected to the responses that you provided in this survey. If you have questions about this sweepstakes, please contact PSM National Office by email at [email protected] or by phone at 9096079368.
THANK YOU!
48