Outcomes-Based Funding Formula Profile ... - Tennessee
8
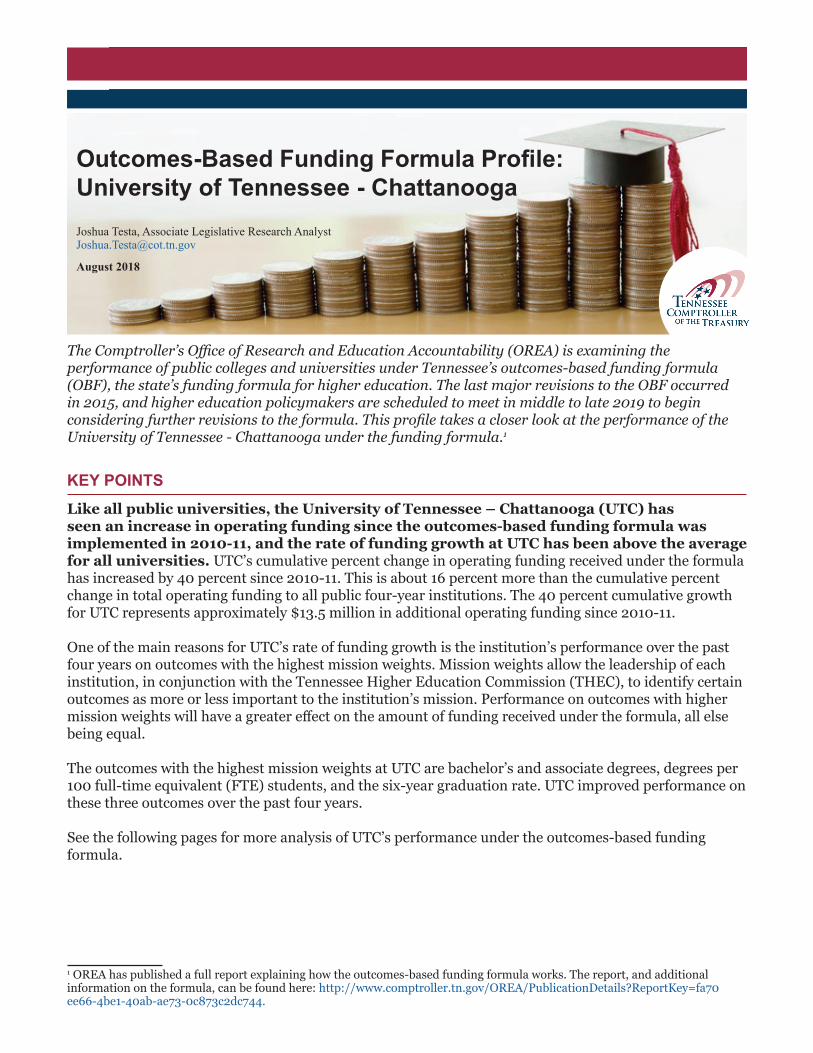
Joshua Testa, Associate Legislative Research Analyst [email protected] August 2018 Outcomes-Based Funding Formula Profile: University of Tennessee - Chattanooga The Comptroller’s Office of Research and Education Accountability (OREA) is examining the performance of public colleges and universities under Tennessee’s outcomes-based funding formula (OBF), the state’s funding formula for higher education. The last major revisions to the OBF occurred in 2015, and higher education policymakers are scheduled to meet in middle to late 2019 to begin considering further revisions to the formula. This profile takes a closer look at the performance of the University of Tennessee - Chattanooga under the funding formula. 1 KEY POINTS Like all public universities, the University of Tennessee – Chattanooga (UTC) has seen an increase in operating funding since the outcomes-based funding formula was implemented in 2010-11, and the rate of funding growth at UTC has been above the average for all universities. UTC’s cumulative percent change in operating funding received under the formula has increased by 40 percent since 2010-11. This is about 16 percent more than the cumulative percent change in total operating funding to all public four-year institutions. The 40 percent cumulative growth for UTC represents approximately $13.5 million in additional operating funding since 2010-11. One of the main reasons for UTC’s rate of funding growth is the institution’s performance over the past four years on outcomes with the highest mission weights. Mission weights allow the leadership of each institution, in conjunction with the Tennessee Higher Education Commission (THEC), to identify certain outcomes as more or less important to the institution’s mission. Performance on outcomes with higher mission weights will have a greater effect on the amount of funding received under the formula, all else being equal. The outcomes with the highest mission weights at UTC are bachelor’s and associate degrees, degrees per 100 full-time equivalent (FTE) students, and the six-year graduation rate. UTC improved performance on these three outcomes over the past four years. See the following pages for more analysis of UTC’s performance under the outcomes-based funding formula. 1 OREA has published a full report explaining how the outcomes-based funding formula works. The report, and additional information on the formula, can be found here: http://www.comptroller.tn.gov/OREA/PublicationDetails?ReportKey=fa70 ee66-4be1-40ab-ae73-0c873c2dc744.
Transcript of Outcomes-Based Funding Formula Profile ... - Tennessee
Joshua Testa, Associate Legislative Research [email protected]
August 2018
Outcomes-Based Funding Formula Profile: University of Tennessee - Chattanooga
The Comptroller’s Office of Research and Education Accountability (OREA) is examining the performance of public colleges and universities under Tennessee’s outcomes-based funding formula (OBF), the state’s funding formula for higher education. The last major revisions to the OBF occurred in 2015, and higher education policymakers are scheduled to meet in middle to late 2019 to begin considering further revisions to the formula. This profile takes a closer look at the performance of the University of Tennessee - Chattanooga under the funding formula.1
KEY POINTSLike all public universities, the University of Tennessee – Chattanooga (UTC) has seen an increase in operating funding since the outcomes-based funding formula was implemented in 2010-11, and the rate of funding growth at UTC has been above the average for all universities. UTC’s cumulative percent change in operating funding received under the formula has increased by 40 percent since 2010-11. This is about 16 percent more than the cumulative percent change in total operating funding to all public four-year institutions. The 40 percent cumulative growth for UTC represents approximately $13.5 million in additional operating funding since 2010-11.
One of the main reasons for UTC’s rate of funding growth is the institution’s performance over the past four years on outcomes with the highest mission weights. Mission weights allow the leadership of each institution, in conjunction with the Tennessee Higher Education Commission (THEC), to identify certain outcomes as more or less important to the institution’s mission. Performance on outcomes with higher mission weights will have a greater effect on the amount of funding received under the formula, all else being equal.
The outcomes with the highest mission weights at UTC are bachelor’s and associate degrees, degrees per 100 full-time equivalent (FTE) students, and the six-year graduation rate. UTC improved performance on these three outcomes over the past four years.
See the following pages for more analysis of UTC’s performance under the outcomes-based funding formula.
1 OREA has published a full report explaining how the outcomes-based funding formula works. The report, and additional information on the formula, can be found here: http://www.comptroller.tn.gov/OREA/PublicationDetails?ReportKey=fa70ee66-4be1-40ab-ae73-0c873c2dc744.

Like all public universities, the University of Tennessee – Chattanooga (UTC) has seen an increase in operating funding since the outcomes-based funding formula was implemented in 2010-11, and the rate of funding growth at UTC has been above the average for all universities. Exhibit 1 shows the cumulative percent change in operating dollars for Tennessee’s nine public universities based solely on their performance across the three components in the formula that determine funding recommendations: weighted outcomes, fixed costs, and quality assurance funding. (The exhibit excludes Tennessee’s community colleges and colleges of applied technology.2) UTC’s cumulative percent change in funding is designated by the dotted blue line while the total cumulative percent change in university funding is shown by the dotted black line.
Exhibit 1: Cumulative Change in Operating Funding for Tennessee’s Public Universities in the Formula, 2010-11 to 2018-19
Note: These figures represent cumulative changes in operating funds and do not include adjustments to salary, health insurance, retirement funds, or changes due to the removal of the hold harmless provision. Total funding does not include community colleges or colleges of applied technology (TCATs).* The 2018-19 cumulative change is based on THEC’s funding recommendation formula and may change depending on THEC’s Legislative Action plans expected at the end of 2018. Source: Tennessee Higher Education Commission.
2 A different formula – based on costs and enrollment – determines Tennessee’s colleges of applied technology (TCAT) formula calculation. Although TCATs compete with universities and community colleges over the same revenue source, they are excluded from the exhibits to allow for a comparison between institutions that compete on similar metrics. Although community colleges compete with universities for funding in the outcomes-based funding formula, they are rewarded for improving performance on outcomes that are different from universities. Community colleges are excluded from the exhibits to allow for a comparison of universities that are funded on similar outcomes.
UTC

The breakdown of UTC’s annual change in operating funds is seen in Exhibit 2, which shows how UTC’s operating dollars change each year compared to the average annual change of all public four-year universities. Since 2015-16, UTC has shown larger annual increases in operating funds than the average of all universities in the formula.
Exhibit 2: Annual Change in Operating Funding for UTC and the Average of all Universities in the Formula, 2010-11 to 2018-19
Note: These figures represent annual changes in operating funds and do not include adjustments to salary, health insurance, retirement funds, or changes due to the removal of the hold harmless provision. Adding the annual changes in funding for each institution will not result in the total cumulative change in funding shown in Exhibit 1. Average university funding does not include community colleges or colleges of applied technology (TCATs).* The 2018-19 annual change is based on THEC’s funding recommendation formula and may change depending on THEC’s Legislative Action plans expected at the end of 2018. Source: Tennessee Higher Education Commission.
One of the main reasons for UTC’s above average rate of funding growth is its performance on outcomes with higher mission weights. Mission weights allow the leadership of each institution, in conjunction with THEC, to assign differing weights to outcome measures to reflect the institution’s mission. Like most universities, UTC’s mission weights are highest for bachelor’s and associate degrees produced (25 percent), followed by degrees per 100 FTE students (15 percent), and six-year graduation rate (15 percent), as seen in Exhibit 3.
UTC has improved performance during the past four years on these three outcomes. Improving outcomes with higher mission weights will earn an institution more funding, all else being equal.
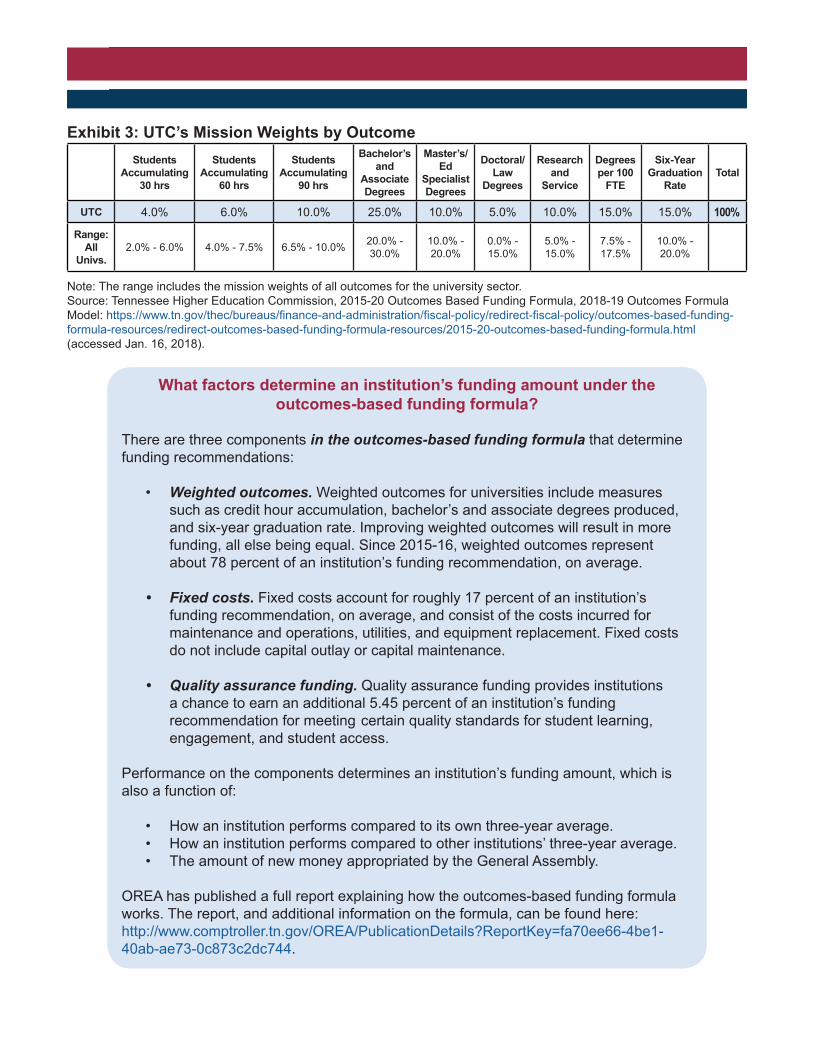
Exhibit 3: UTC’s Mission Weights by Outcome
Note: The range includes the mission weights of all outcomes for the university sector.Source: Tennessee Higher Education Commission, 2015-20 Outcomes Based Funding Formula, 2018-19 Outcomes Formula Model: https://www.tn.gov/thec/bureaus/finance-and-administration/fiscal-policy/redirect-fiscal-policy/outcomes-based-funding-formula-resources/redirect-outcomes-based-funding-formula-resources/2015-20-outcomes-based-funding-formula.html (accessed Jan. 16, 2018).
Students Accumulating
30 hrs
Students Accumulating
60 hrs
Students Accumulating
90 hrs
Bachelor’s and
AssociateDegrees
Master’s/Ed
Specialist Degrees
Doctoral/ Law
Degrees
Research and
Service
Degrees per 100
FTE
Six-Year Graduation
RateTotal
UTC 4.0% 6.0% 10.0% 25.0% 10.0% 5.0% 10.0% 15.0% 15.0% 100%
Range:All
Univs.2.0% - 6.0% 4.0% - 7.5% 6.5% - 10.0% 20.0% -
30.0%10.0% - 20.0%
0.0% - 15.0%
5.0% - 15.0%
7.5% - 17.5%
10.0% - 20.0%
What factors determine an institution’s funding amount under the outcomes-based funding formula?
There are three components in the outcomes-based funding formula that determine funding recommendations:
• Weighted outcomes. Weighted outcomes for universities include measures such as credit hour accumulation, bachelor’s and associate degrees produced, and six-year graduation rate. Improving weighted outcomes will result in more
funding, all else being equal. Since 2015-16, weighted outcomes represent about 78 percent of an institution’s funding recommendation, on average.
• Fixed costs. Fixed costs account for roughly 17 percent of an institution’s funding recommendation, on average, and consist of the costs incurred for maintenance and operations, utilities, and equipment replacement. Fixed costs do not include capital outlay or capital maintenance.
• Quality assurance funding. Quality assurance funding provides institutions a chance to earn an additional 5.45 percent of an institution’s funding recommendation for meeting certain quality standards for student learning, engagement, and student access.
Performance on the components determines an institution’s funding amount, which is also a function of:
• How an institution performs compared to its own three-year average.• How an institution performs compared to other institutions’ three-year average.• The amount of new money appropriated by the General Assembly.
OREA has published a full report explaining how the outcomes-based funding formula works. The report, and additional information on the formula, can be found here: http://www.comptroller.tn.gov/OREA/PublicationDetails?ReportKey=fa70ee66-4be1-40ab-ae73-0c873c2dc744.

Exhibit 4 shows changes in UTC’s weighted outcomes in the funding formula for the past four years.3 The shaded boxes around the multicolored bars are the mission weights set by UTC in conjunction with THEC. For example, UTC applies a 25 percent mission weight to its bachelor’s and associate degree production, which has improved since 2015-16. A similar pattern emerges for the next two highest-weighted outcomes – degrees produced per 100 FTE students and six-year graduation rate – both of which show improvements since 2015-16. The increased rate of change across these outcomes, coupled with the high mission weights applied to them, augments UTC’s performance under the formula.
Exhibit 4: UTC’s Weighted Outcomes and Mission Weights, 2015-16 to 2018-19
Note: Weighted outcomes include combined three-year averages of outcome measures, scales, and mission weights. Source: Tennessee Higher Education Commission, 2015-20 Outcomes Based Funding Formula, 2018-19 Outcomes Formula Model: https://www.tn.gov/thec/bureaus/finance-and-administration/fiscal-policy/redirect-fiscal-policy/outcomes-based-funding-formula-resources/redirect-outcomes-based-funding-formula-resources/2015-20-outcomes-based-funding-formula.html (accessed Jan. 16, 2018).
UTC’s performance on weighted outcomes, and the other two formula components (fixed costs and quality assurance funding), are analyzed in monetary terms in Exhibit 5.
In the weighted outcomes component, UTC improved performance on six out of nine outcomes and saw a decrease in performance on the remaining three. The net increase in recommended funding for weighted outcomes totaled $1.3 million. Fixed costs and quality assurance funding also improved, resulting in an increase of $156,800 and $26,200, respectively, from 2017-18, all else being equal.
3 Outcomes for Tennessee’s colleges and universities underwent changes from the 2010-15 formula to the 2015-20 formula. The exhibit compares weighted outcomes since the implementation of the 2015-20 formula to maintain a consistent unit of comparison.

An additional $3.6 million was recommended for UTC through the formula based on the institution’s performance from 2017-18 to 2018-19. The additional funding is applied to UTC’s recurring state appropriation to produce a total recommended funding appropriation of $54.7 million for 2018-19.
Exhibit 5: Estimated Effects of the Formula’s Components on UTC’s Funding Recommendation, 2017-18 to 2018-19
* The total weighted outcomes will not equal the sum of all changes on weighted outcome measures since the analysis estimates each outcome while holding all other data constant. The change in total weighted outcomes includes all changes to weighted outcome measures, holding all other components constant.Note: The estimated effects of each outcome calculated by OREA may differ slightly from THEC’s estimates since OREA conducted its own analysis of the formula’s components. Any differences are most likely due to rounding. The 2018-19 funding recommendation may change depending on THEC’s Legislative Action plans expected at the end of 2018. Weighted outcomes include combined three-year averages of outcome measures, scales, and mission weights.Source: Tennessee Higher Education Commission, Breakdown of Outcomes-Based Formula Components Impact on 2018-19 State Appropriations: https://www.tn.gov/content/dam/tn/thec/bureau/fiscal_admin/fiscal_pol/obff/2018-19%20Formula%20Component%20Analysis_FINAL%20for%20website_email.pdf (accessed March 16, 2018).
Outcomes-Based Funding Formula Components Performance Change from 2017-18 (%)
Effect on Funding Recommendation
($)Total
2017-18 Additional Funding $2,128,500
Weighted Outcome Measures MissionWeights
Students Accumulating 30 hrs 4.00% -5.96% -$42,200 Students Accumulating 60 hrs 6.00% 0.17% $2,300 Students Accumulating 90 hrs 10.00% 3.70% $120,900 Bachelor’s and Associates 25.00% 4.14% $545,500 Master’s/Ed Specialist Degrees 10.00% -6.02% -$158,100 Doctoral / Law Degrees 5.00% 5.17% $56,900 Research, Service and Sponsored Programs 10.00% -10.15% -$108,300 Degrees per 100 FTE 15.00% 5.01% $145,200 Six-Year Graduation Rate 15.00% 4.71% $776,500
Total Weighted Outcomes* 3.14% $1,337,600
Fixed Costs 2.07% $156,800
Quality Assurance 1.15% $26,200
Increase from 2018-19 Components $1,520,600
2018-19 Total Recommended Additional Funding $3,649,100Total Recommended Funding Appropriation $54,655,200

Definitions: 2016-17 Outcomes-Based Funding FormulaOutcomes Definitions
Students Accumulating 30, 60, 90 hours
Students credit hour accumulation is measured by the number of full-time and part-time students whose cumulative credits earned at the beginning of a semester are less than the established credit hour threshold benchmarks of 30, 60, or 90 student credit hours and whose cumulative credit hours earned at the end of the semester are equal to or greater than the credit hour threshold benchmarks during the academic year.
Bachelor’s and Associate degrees
The combined total of bachelor’s and associate degrees conferred to undergraduate students during an academic year. Students earning multiple degrees in an academic year have each earned degree count as a separate outcome. Double majors do not count as two outcomes. Austin Peay State University and Tennessee State University are the only universities that grant associate degrees.
Master’s/Education Specialist degrees
The combined total of master’s and education specialist’s degrees and certificates conferred to students during an academic year. Students earning multiple degrees in an academic year will have each earned degree count as a separate outcome. Double majors with the same degree do not count as two outcomes.
Doctoral/Law degrees
The combined total of doctoral and law degrees conferred to students during an academic year. The outcome does not include medical or pharmacy degrees. Students earning multiple degrees in an academic year will have each earned degree count as a separate outcome. Double majors with the same degree do not count as two outcomes.
Research and service
Expenditures on activities eligible for indirect cost allocation, primarily but not exclusively externally generated funding for research, service, or instruction. The data should exclude financial aid, capital funding, state appropriations, donations from foundations, and practice income.
Degrees per 100 FTE
The combined total of associate and bachelor’s degrees conferred during an academic year for every 100 year-round, end-of-term undergraduate full-time enrollment (FTE) generated during the same academic year. Non-degree seeking students are not included in undergraduate FTE. Full-time enrollment is 30 semester credit hours.
6-year graduation rateFirst-time, full-time, fall freshmen and summer first-time freshmen who continued in the fall, attempting 12 credit hours at the census date, who were awarded a bachelor’s or associate degree as of the summer semester following their sixth year.
Note: Data definitions are based on THEC’s 2016-17 formula definitions. Definitions for the 2017-18 formula have not been updated.Source: Tennessee Higher Education Commission, 2015-20 Outcomes-Based Funding Formula Overview, Appendix D.

Contact Information
Justin P. WilsonComptroller of the Treasury
Jason E. MumpowerChief of Staff
State CapitolNashville, Tennessee 37243
615.741.2501
For more information, please visit theComptroller’s Office of Research & Education Accountability at:
www.comptroller.tn.gov/orea