Van suikermolen tot grootbedrijf : technische vernieuwing in de Java ...
Upload
darren-longCategory
view
217download
0
Outcome-related test quality
Linda [email protected]
Postgraduaat & navormingsprogramma klinische biologie (29-11-2007)
Vernieuwing & evaluatie van kwaliteit van immunoassay doseringen

Postgraduaat en navormingsprogramma, UZ Brussel, 29-11-2007 2
OverviewIntroduction
• Background
• Analytical quality – An issue?
Outcome-related test quality – TSH, subclinical hypothyroidism
Postgraduaat en navormingsprogramma, UZ Brussel, 29-11-2007 3
BackgroundPlebani M, Carraro P. Mistakes in a stat laboratory: types and frequency. Clin Chem 1997;43:1348-51.
The distribution of mistakes was:
-pre-analytical 68.2%,
-analytical 13.3%, and
-post-analytical 18.5%.
>Focus on pre- and post-analytics
Critique
Stöckl D. Modern quality management misunderstood? Clin Chem 1998;44:1066-7.
Postgraduaat en navormingsprogramma, UZ Brussel, 29-11-2007 4
Background“Analytical errors are no longer the main factor influencing the reliability and clinical utilization of laboratory diagnostics.”
Lippi G, Guidi GC, Mattiuzzi C, Plebani M. Preanalytical variability: the dark side of the moon in laboratory testing. Clin Chem Lab Med 2006;44:358-65.
Is that so?
Postgraduaat en navormingsprogramma, UZ Brussel, 29-11-2007 5
Analytical qualityKidney disease
Calcium
Vitamin D
Parathyroid hormone
Postgraduaat en navormingsprogramma, UZ Brussel, 29-11-2007 6
Analytical quality – Calcium“Based on analysis of over 89,000 patients receiving serum calcium tests at the Mayo Clinic in 1998–1999, we find that the number of follow-up procedures, and hence health care costs, is directly related to initial calcium test values. With approximately 3.55 million patients per year receiving screening serum calcium tests being affected by bias, the potential economic impacts range from $60 million to $199 million per year for analytic biases of 0.1 and 0.5 mg/dL, respectively”.
Gallagher MP, Mobley LR, Klee GG, Schryver P. RTI Planning Report 04-1, The impact of calibration error in medical decision making. April 2004.

Postgraduaat en navormingsprogramma, UZ Brussel, 29-11-2007 7
Analytical quality – Vitamin D“Vitamin D assays yield markedly differing results; whether an individual is found to have low or normal vitamin D status is a function of the laboratory used. If the medical community is to make progress in correcting widespread hypovitaminosis D, vitamin D measurement must be standardized”
Binkley N et al. Assay variation confounds the diagnosis of hypovitaminosis D: A call for standardization. J Clin Endocrinol Metab 2004;89:3152–7.
Postgraduaat en navormingsprogramma, UZ Brussel, 29-11-2007 8
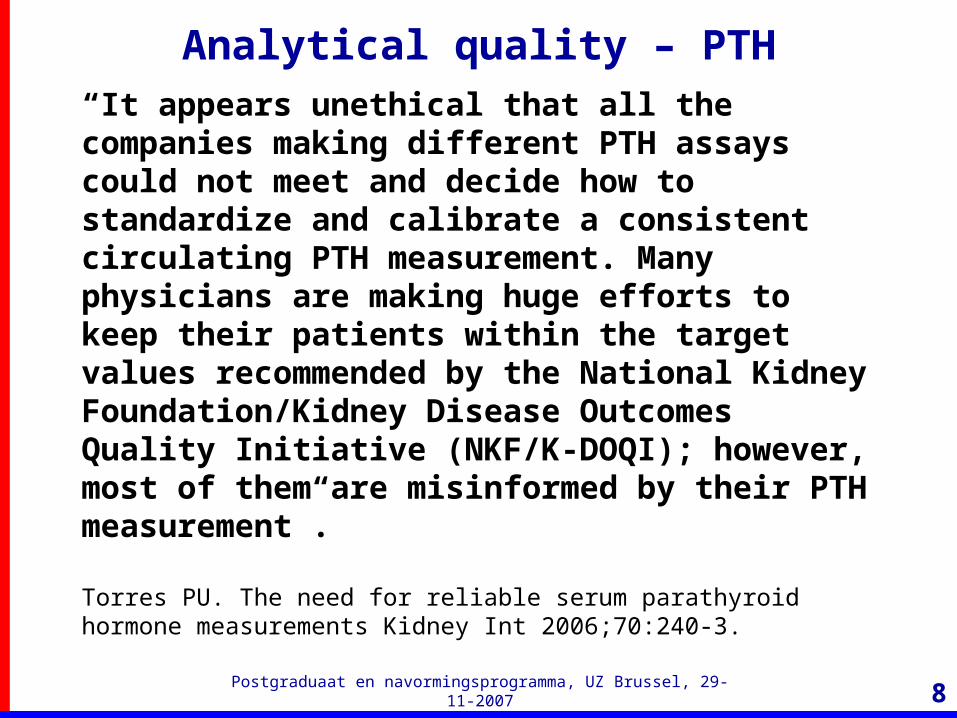
Analytical quality – PTH“It appears unethical that all the companies making different PTH assays could not meet and decide how to standardize and calibrate a consistent circulating PTH measurement. Many physicians are making huge efforts to keep their patients within the target values recommended by the National Kidney Foundation/Kidney Disease Outcomes Quality Initiative (NKF/K-DOQI); however, most of them are misinformed by their PTH measurement”.
Torres PU. The need for reliable serum parathyroid hormone measurements Kidney Int 2006;70:240-3.
Postgraduaat en navormingsprogramma, UZ Brussel, 29-11-2007 9
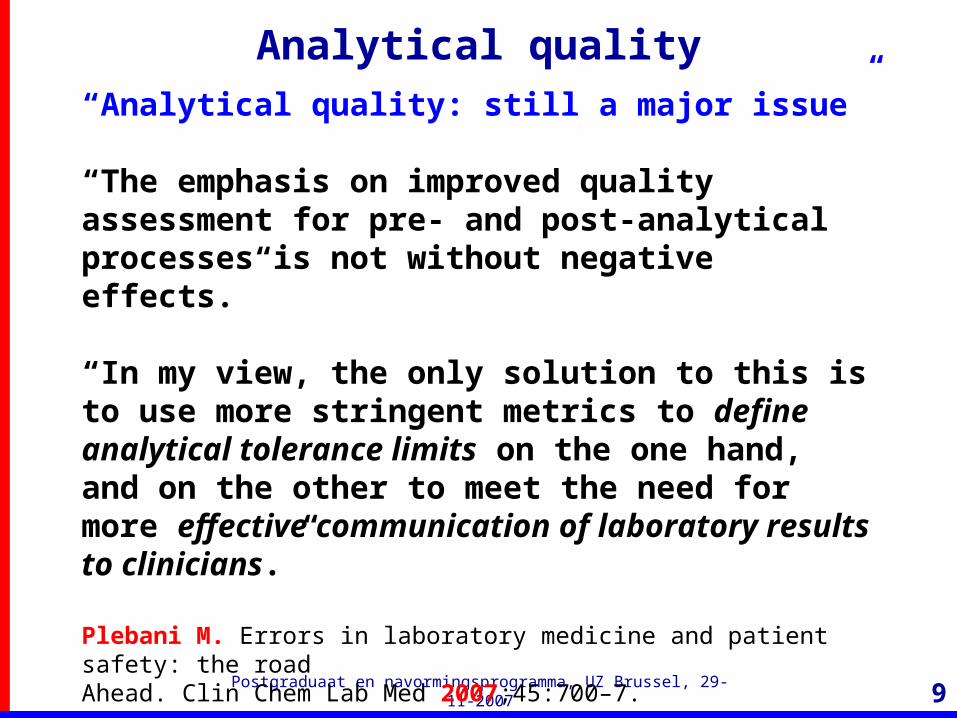
Analytical quality“Analytical quality: still a major issue”
“The emphasis on improved quality assessment for pre- and post-analytical processes is not without negative effects.”
“In my view, the only solution to this is to use more stringent metrics to define analytical tolerance limits on the one hand, and on the other to meet the need for more effective communication of laboratory results to clinicians.”
Plebani M. Errors in laboratory medicine and patient safety: the roadAhead. Clin Chem Lab Med 2007;45:700–7.

Postgraduaat en navormingsprogramma, UZ Brussel, 29-11-2007 10
Outcome-related test quality
TSHSubclinical hypothyroidism
“Define analytical tolerance limits”
interrelated“Need for more effective communication of results
to clinicians”
Postgraduaat en navormingsprogramma, UZ Brussel, 29-11-2007 11
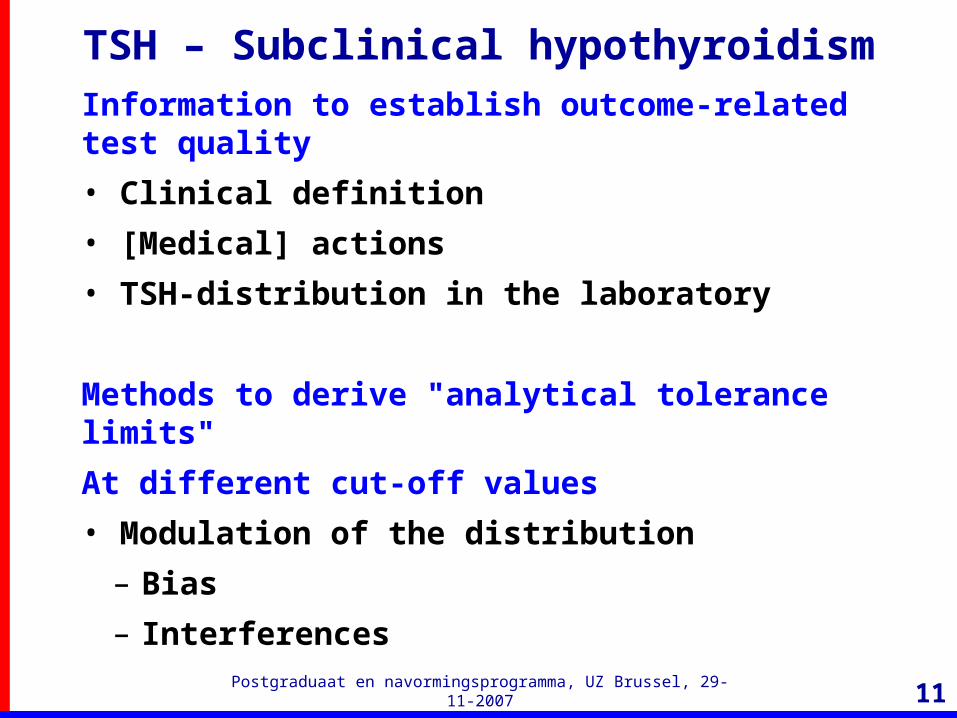
TSH – Subclinical hypothyroidismInformation to establish outcome-related test quality
• Clinical definition
• [Medical] actions
• TSH-distribution in the laboratory
Methods to derive "analytical tolerance limits"
At different cut-off values
• Modulation of the distribution
– Bias
– Interferences
Postgraduaat en navormingsprogramma, UZ Brussel, 29-11-2007 12
TSH – Subclinical hypothyroidismClinical definition
TSH >5 mIU/L
Belgian situation?
Postgraduaat en navormingsprogramma, UZ Brussel, 29-11-2007 13
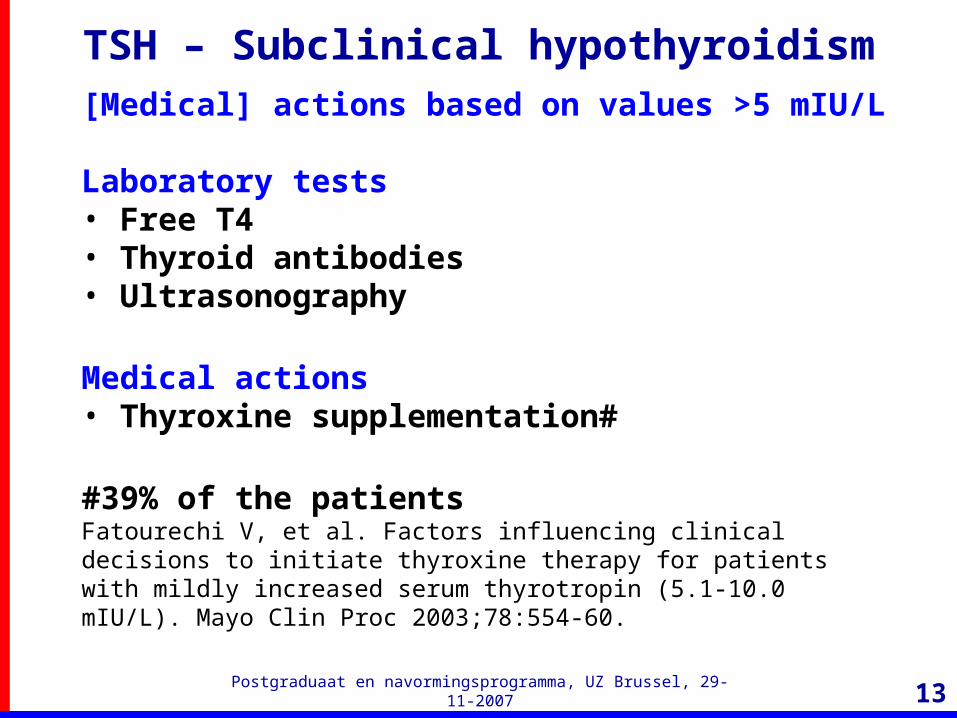
TSH – Subclinical hypothyroidism[Medical] actions based on values >5 mIU/L
Laboratory tests• Free T4• Thyroid antibodies• Ultrasonography
Medical actions• Thyroxine supplementation#
#39% of the patientsFatourechi V, et al. Factors influencing clinical decisions to initiate thyroxine therapy for patients with mildly increased serum thyrotropin (5.1-10.0 mIU/L). Mayo Clin Proc 2003;78:554-60.
Postgraduaat en navormingsprogramma, UZ Brussel, 29-11-2007 14
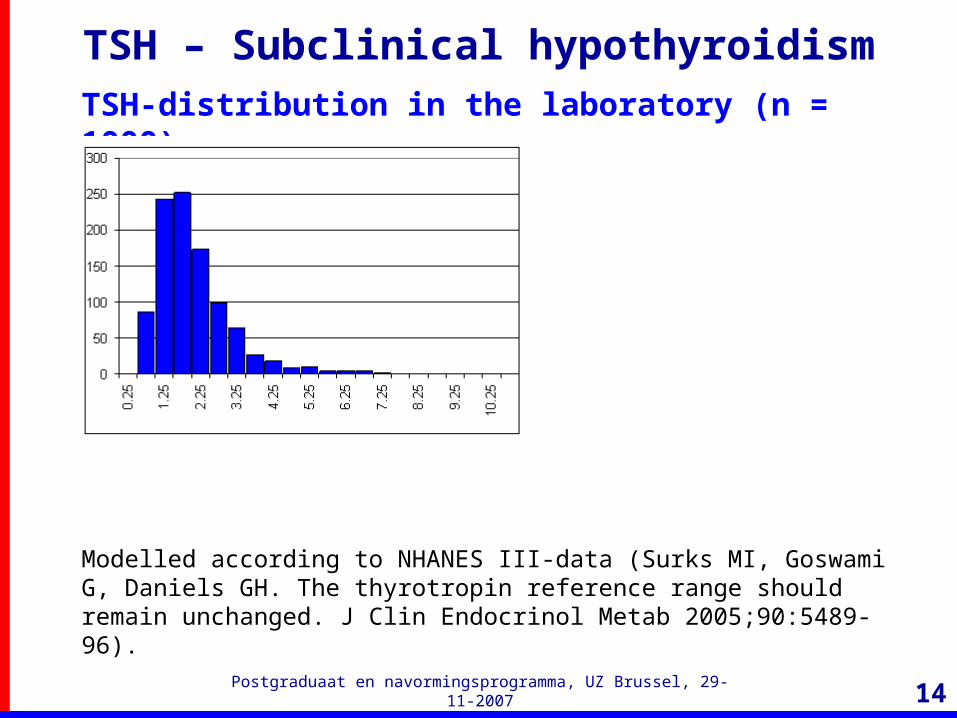
TSH – Subclinical hypothyroidismTSH-distribution in the laboratory (n = 1000)
Modelled according to NHANES III-data (Surks MI, Goswami G, Daniels GH. The thyrotropin reference range should remain unchanged. J Clin Endocrinol Metab 2005;90:5489-96).

Postgraduaat en navormingsprogramma, UZ Brussel, 29-11-2007 15
TSH – Subclinical hypothyroidismTSH >5 mIU/L• n = 27 (per 1000)• 2.7 %
Postgraduaat en navormingsprogramma, UZ Brussel, 29-11-2007 16
TSH – Subclinical hypothyroidismMethods to derive "analytical tolerance limits"
• Modulation of the distribution
– Bias
– Interferences
Postgraduaat en navormingsprogramma, UZ Brussel, 29-11-2007 17
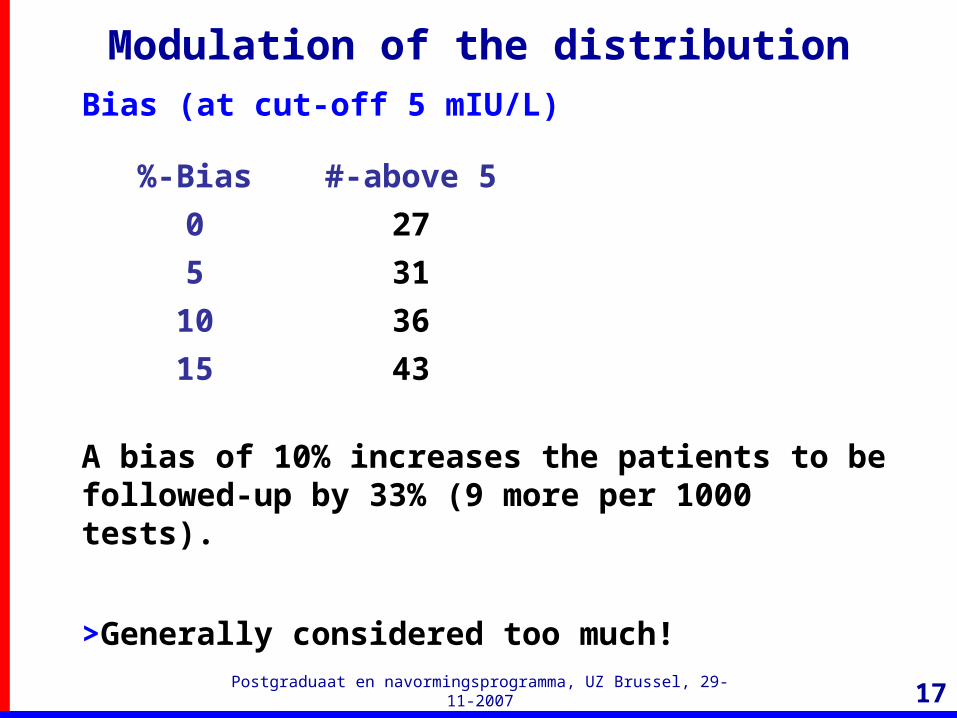
Modulation of the distributionBias (at cut-off 5 mIU/L)
A bias of 10% increases the patients to be followed-up by 33% (9 more per 1000 tests).
>Generally considered too much!
%-Bias #-above 5
0 27
5 31
10 36
15 43
Postgraduaat en navormingsprogramma, UZ Brussel, 29-11-2007 18
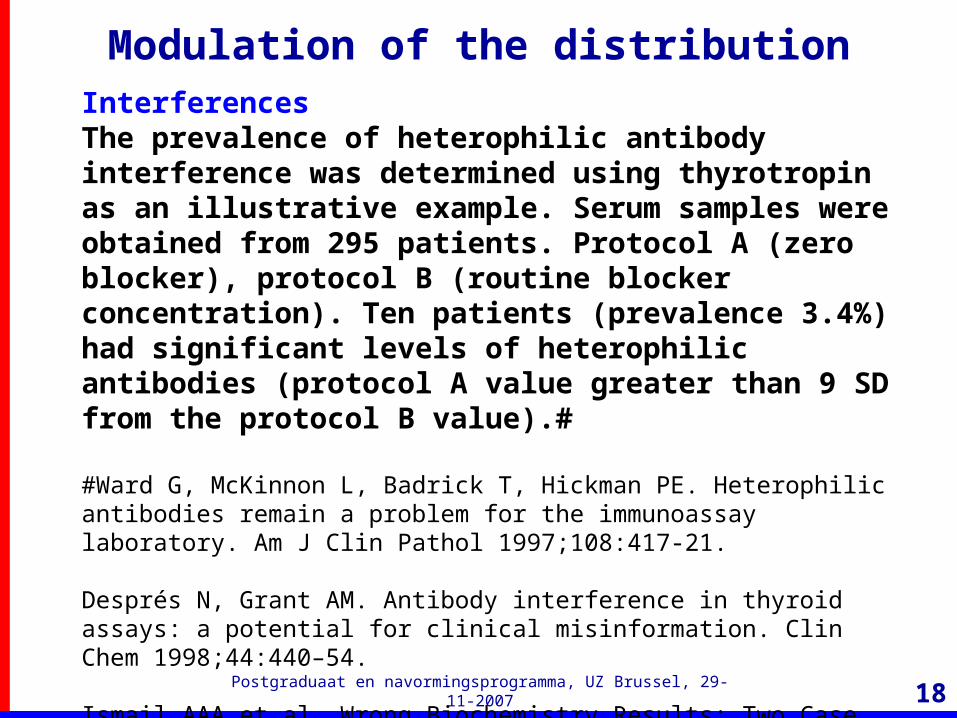
Modulation of the distributionInterferencesThe prevalence of heterophilic antibody interference was determined using thyrotropin as an illustrative example. Serum samples were obtained from 295 patients. Protocol A (zero blocker), protocol B (routine blocker concentration). Ten patients (prevalence 3.4%) had significant levels of heterophilic antibodies (protocol A value greater than 9 SD from the protocol B value).#
#Ward G, McKinnon L, Badrick T, Hickman PE. Heterophilic antibodies remain a problem for the immunoassay laboratory. Am J Clin Pathol 1997;108:417-21.
Després N, Grant AM. Antibody interference in thyroid assays: a potential for clinical misinformation. Clin Chem 1998;44:440–54.
Ismail AAA et al. Wrong Biochemistry Results: Two Case Reports and Observational Study in 5310 Patients on Potentially Misleading Thyroid-stimulating Hormone and Gonadotropin Immunoassay Results. Clin Chem 2002;48:2023–29.
Postgraduaat en navormingsprogramma, UZ Brussel, 29-11-2007 19
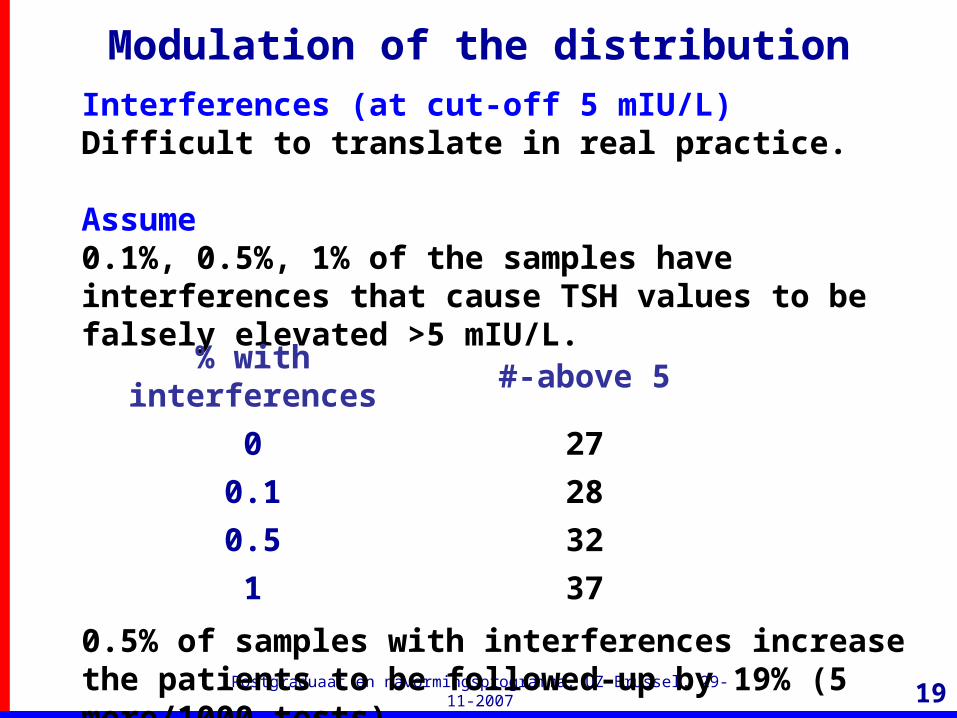
Modulation of the distributionInterferences (at cut-off 5 mIU/L)Difficult to translate in real practice.
Assume0.1%, 0.5%, 1% of the samples have interferences that cause TSH values to be falsely elevated >5 mIU/L.
0.5% of samples with interferences increase the patients to be followed-up by 19% (5 more/1000 tests).
% with interferences #-above 5
0 27
0.1 28
0.5 32
1 37
Postgraduaat en navormingsprogramma, UZ Brussel, 29-11-2007 20
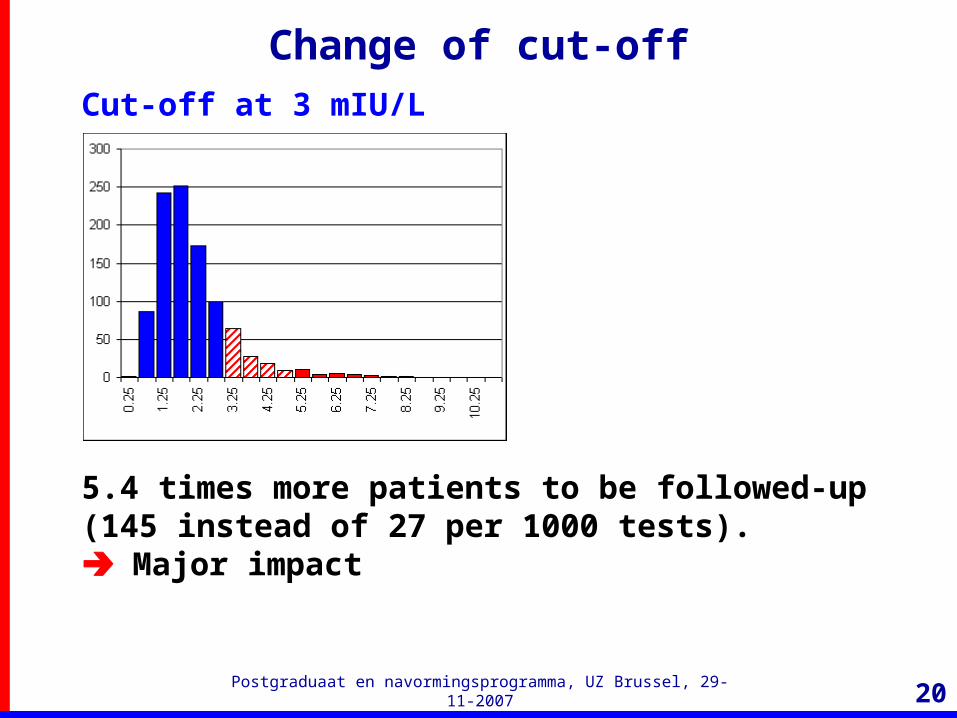
Change of cut-offCut-off at 3 mIU/L
5.4 times more patients to be followed-up (145 instead of 27 per 1000 tests). Major impact
Postgraduaat en navormingsprogramma, UZ Brussel, 29-11-2007 21
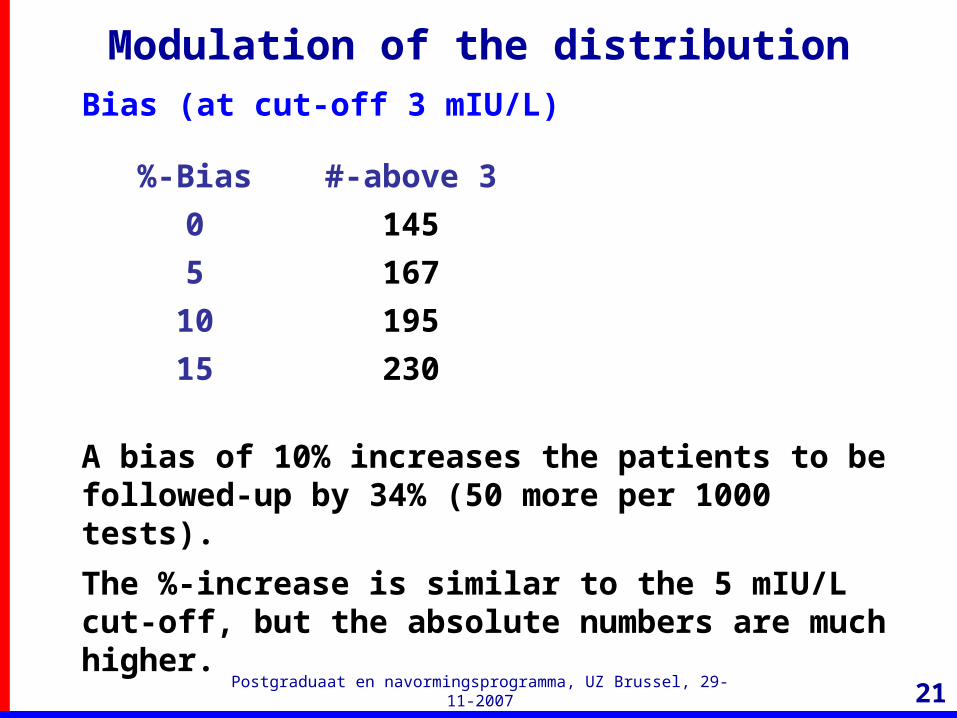
Modulation of the distributionBias (at cut-off 3 mIU/L)
A bias of 10% increases the patients to be followed-up by 34% (50 more per 1000 tests).
The %-increase is similar to the 5 mIU/L cut-off, but the absolute numbers are much higher.
%-Bias #-above 3
0 145
5 167
10 195
15 230
Postgraduaat en navormingsprogramma, UZ Brussel, 29-11-2007 22
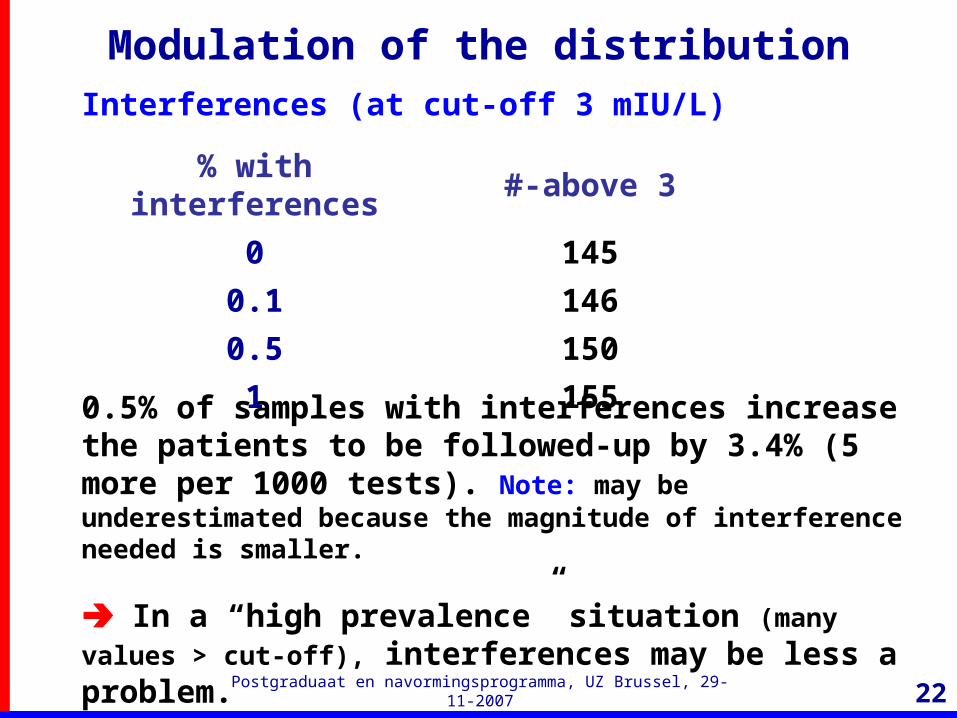
Modulation of the distributionInterferences (at cut-off 3 mIU/L)
0.5% of samples with interferences increase the patients to be followed-up by 3.4% (5 more per 1000 tests). Note: may be underestimated because the magnitude of interference needed is smaller.
In a “high prevalence” situation (many values > cut-off), interferences may be less a problem.
% with interferences #-above 3
0 145
0.1 146
0.5 150
1 155
Postgraduaat en navormingsprogramma, UZ Brussel, 29-11-2007 23
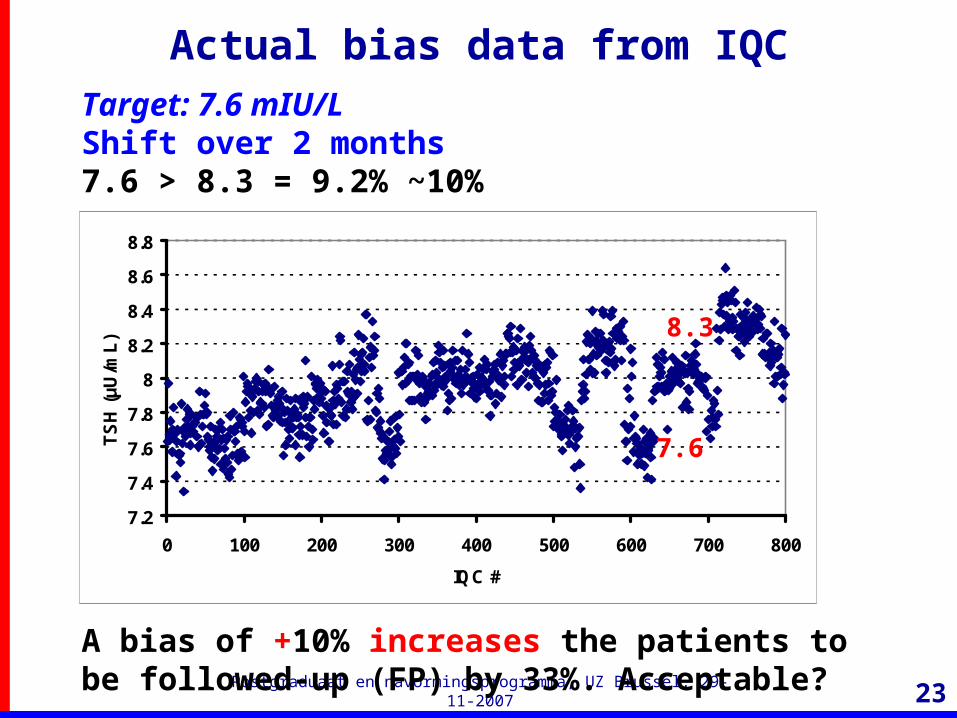
Actual bias data from IQCTarget: 7.6 mIU/LShift over 2 months7.6 > 8.3 = 9.2% ~10%
A bias of +10% increases the patients to be followed-up (FP) by 33%. Acceptable?
7.2
7.4
7.6
7.8
8
8.2
8.4
8.6
8.8
0 100 200 300 400 500 600 700 800
IQC #
TS
H (
µU
/mL
) .
..
7.6
8.3
Postgraduaat en navormingsprogramma, UZ Brussel, 29-11-2007 24
7.2
7.4
7.6
7.8
8
8.2
8.4
8.6
8.8
0 100 200 300 400 500 600 700 800
IQC #
TS
H (
µU
/mL
) .
..
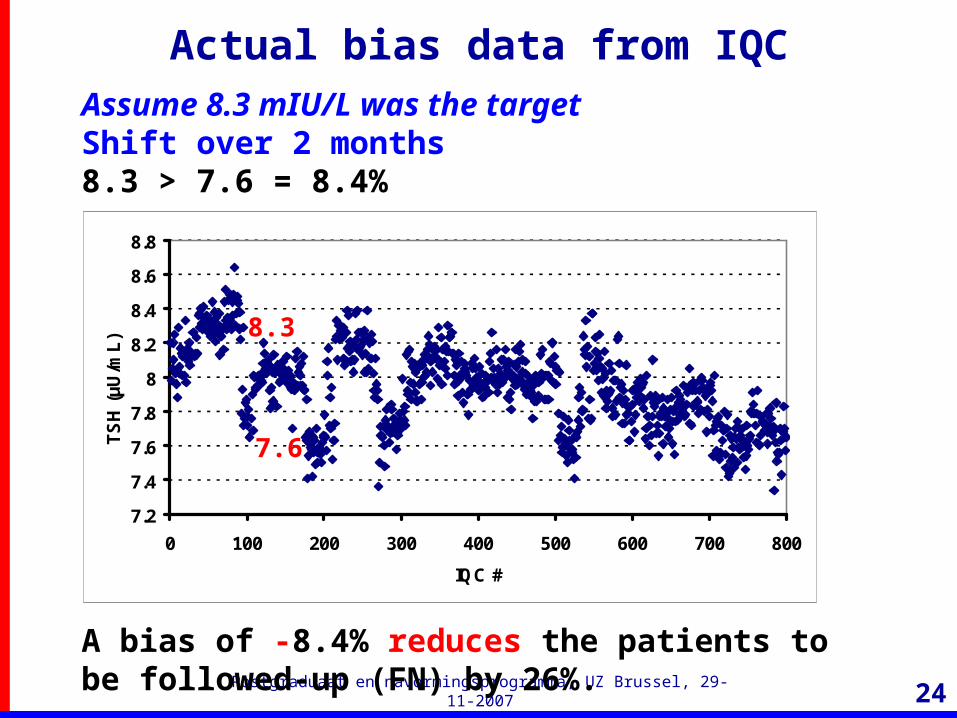
Actual bias data from IQCAssume 8.3 mIU/L was the targetShift over 2 months8.3 > 7.6 = 8.4%
A bias of -8.4% reduces the patients to be followed-up (FN) by 26%.
7.6
8.3
Postgraduaat en navormingsprogramma, UZ Brussel, 29-11-2007 25
Outcome-related test qualityObservations
• Bias and interferences may produce false positives/negatives
How much does a laboratory want to accept?
• Follow recommendations in literature
A bias of 10% increases the patients to be followed-up by 33% (9 more per 1000 tests).
Considered too much by Klee GG (Mayo Clinics perform >100 000 TSH measurements per year).
>Risk assessment
Postgraduaat en navormingsprogramma, UZ Brussel, 29-11-2007 26
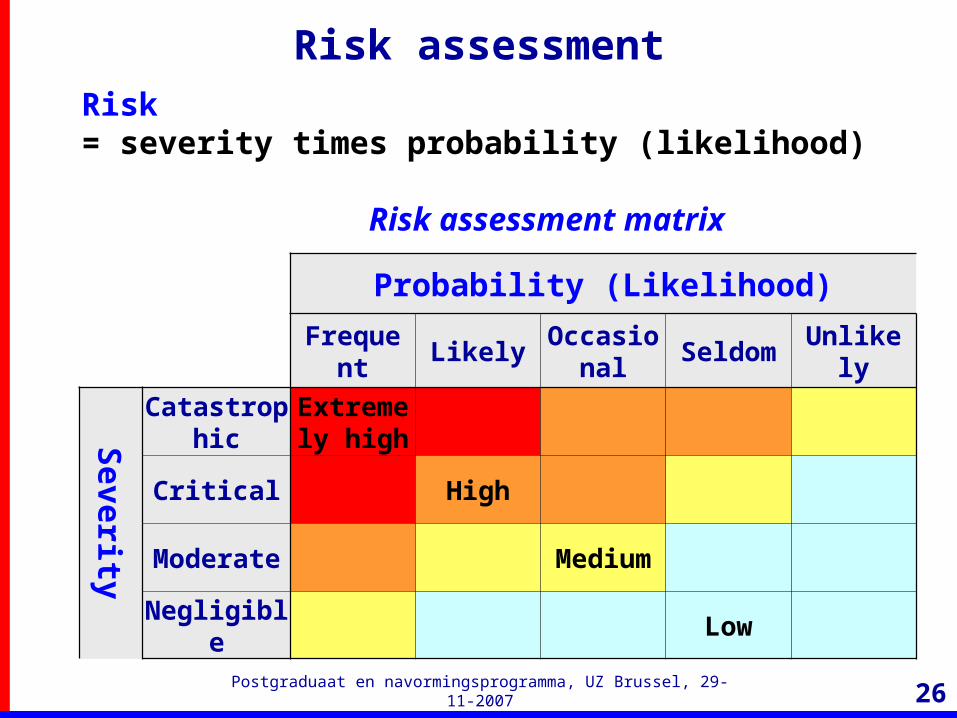
Risk assessmentRisk= severity times probability (likelihood)
Risk assessment matrix
Probability (Likelihood)
Frequent Likely Occasional Seldom Unlikely
Severity
CatastrophicExtremely
high
Critical High
Moderate Medium
Negligible Low

Postgraduaat en navormingsprogramma, UZ Brussel, 29-11-2007 27
Risk assessmentWhat is the consequence of a false positive?
• Additional laboratory testing
• Thyroxine supplementation
Are the consequences of a false positive at high, medium, or low risk?
• Very difficult to answer
• Few models available
>Laboratory may develop basic risk assessment strategies
Postgraduaat en navormingsprogramma, UZ Brussel, 29-11-2007 28
Outcome-related test qualityAreas that may be affected
• Purchase of equipment
• Batch acceptance
• IQC
• …
Postgraduaat en navormingsprogramma, UZ Brussel, 29-11-2007 29
Outcome-related test qualityPossible actions when risk is identified
Intensify communication “Analytics/Clinic”
Purchase a better system
Modify standard practices (examples)
– Test batches before use: refuse if possible
– Work with IQC rules with increased probability of false positives
Standard practices are understood as:
Practices that are based on the statistics of the stable process and using decisions at the 95% or 99% probability-level (Null-hypothesis) or 90% probability-level (Power calculations).
Postgraduaat en navormingsprogramma, UZ Brussel, 29-11-2007 30
TSH – outcome-related test qualityOther references
Klee GG. Clinical interpretation of reference intervals and reference limits. A plea for assay harmonization. Clin Chem Lab Med 2004;42:752-7.
Fatourechi V, Klee GG, Grebe SK, Bahn RS, Brennan MD, Hay ID, McIver B, Morris JC 3rd. Effects of reducing the upper limit of normal TSH values. JAMA 2003;290:3195-6.
Klee GG, Schryver PG, Kisabeth RM. Analytic bias specifications based on the analysis of effects on performance of medical guidelines. Scand J Clin Lab Invest 1999;59:509-12.
Hay ID, Klee GG. Linking medical needs and performance goals: clinical and laboratory perspectives on thyroid disease. Clin Chem 1993;39:1519-24.

Postgraduaat en navormingsprogramma, UZ Brussel, 29-11-2007 31
Outcome-related test qualityImportant only for TSH and similar?
Postgraduaat en navormingsprogramma, UZ Brussel, 29-11-2007 32
Outcome-related test qualitySerum sodium
Action limits?
Mild hyponatraemia: <135 - 125 mmol/L
Moderate hyponatraemia: <125 - 115 mmol/L
Severe hyponatraemia: <115 mmol/L
(Smellie WSA, Heald A. Hyponatraemia and hypernatraemia: pitfalls in testing. BMJ 2007;334:473-476)
Postgraduaat en navormingsprogramma, UZ Brussel, 29-11-2007 33
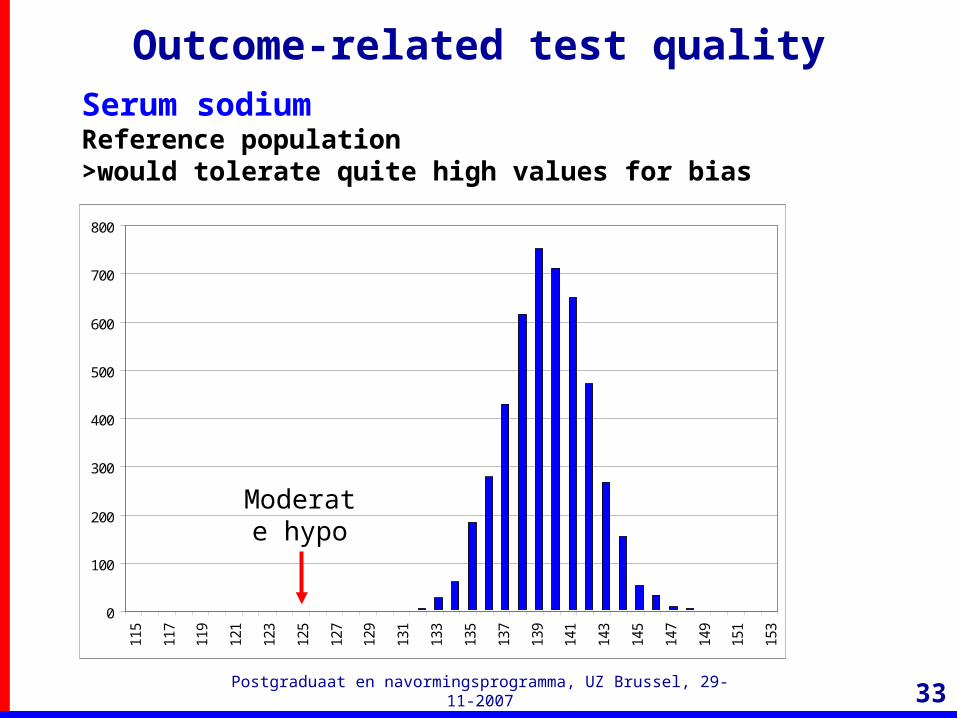
Outcome-related test qualitySerum sodiumReference population>would tolerate quite high values for bias
0
100
200
300
400
500
600
700
800
115
117
119
121
123
125
127
129
131
133
135
137
139
141
143
145
147
149
151
153
Moderate hypo
Postgraduaat en navormingsprogramma, UZ Brussel, 29-11-2007 34
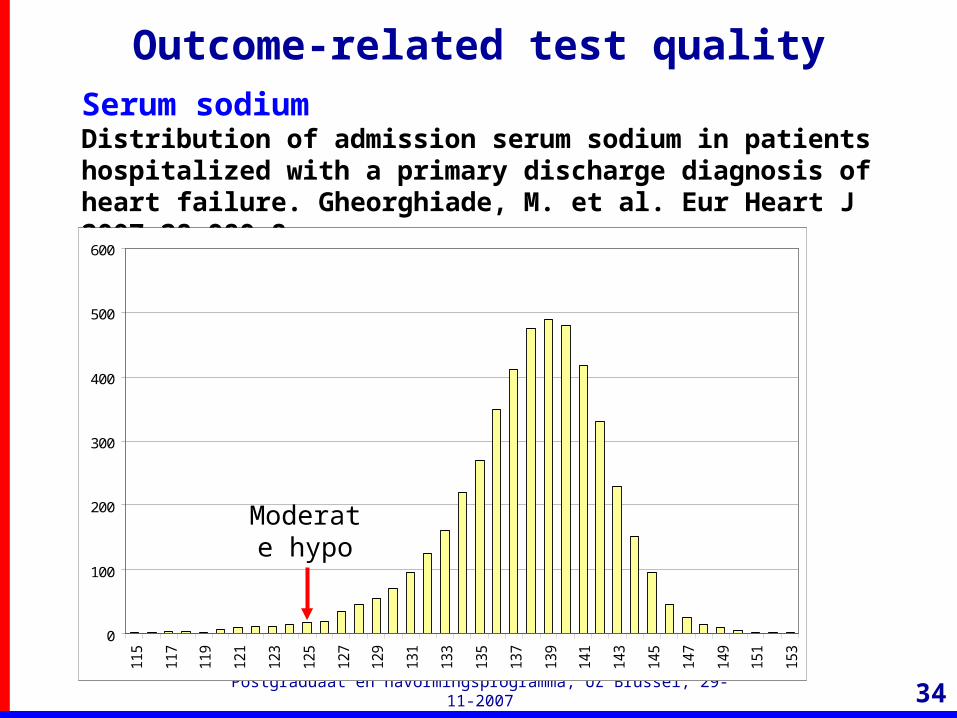
Outcome-related test qualitySerum sodiumDistribution of admission serum sodium in patients hospitalized with a primary discharge diagnosis of heart failure. Gheorghiade, M. et al. Eur Heart J 2007;28:980-8.
0
100
200
300
400
500
600
115
117
119
121
123
125
127
129
131
133
135
137
139
141
143
145
147
149
151
153
Moderate hypo
Postgraduaat en navormingsprogramma, UZ Brussel, 29-11-2007 35
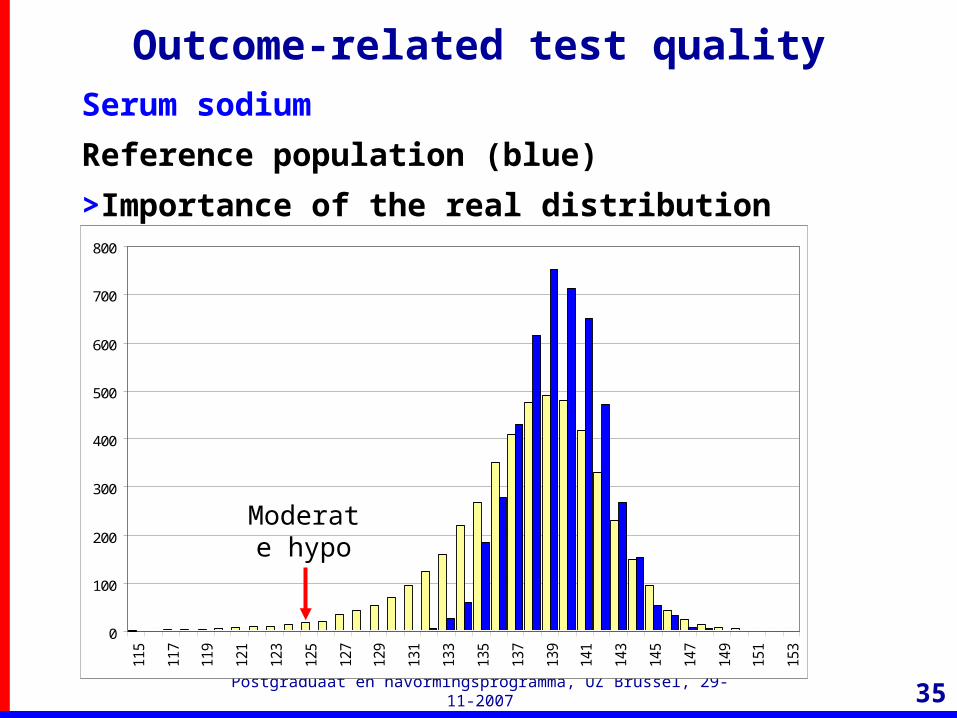
Outcome-related test qualitySerum sodium
Reference population (blue)
>Importance of the real distribution
0
100
200
300
400
500
600
700
800
115
117
119
121
123
125
127
129
131
133
135
137
139
141
143
145
147
149
151
153
Moderate hypo
Postgraduaat en navormingsprogramma, UZ Brussel, 29-11-2007 36
Outcome-related test qualitySummary
• Concept becomes increasingly important (own opinion) (alternative or complementary to other concepts, e.g. the biological –)
• Engage in the topic
– Inform yourself about test quality (ongoing)
– Communicate with clinicians
– Use data from LIS; do modulations on the basis of bias/interferences, imprecision; investigate [clinical] consequences
• Think about risk assessment
• Act on “risk analytes”


![Vernieuwing Rijksdienst D1 V[1].090604](https://static.fdocuments.in/doc/165x107/545431b8af795978688b47e8/vernieuwing-rijksdienst-d1-v1090604.jpg)