Outcome Measurement: Put Your Heart Into It! · HP HSP MP HSP LP HSP United Way Site 2 HP HSP MP...
19
5/12/15 1 Outcome Measurement: Put Your Heart Into It! David P. Cecil, PhD, LCSW Asbury University Evalua&on History, Ra&onale, Literature “There is nothing so useless as doing efficiently that which should not be done at all.” - Peter Drucker
Transcript of Outcome Measurement: Put Your Heart Into It! · HP HSP MP HSP LP HSP United Way Site 2 HP HSP MP...
5/12/15
1
Outcome Measurement: !Put Your Heart Into It!!
David P. Cecil, PhD, LCSW!Asbury University!
!!
Evalua&on History, Ra&onale, Literature
“There is nothing so useless as doing efficiently that which should not be done at all.” !
- Peter Drucker!
5/12/15
2
Evaluation: Why are we hung up?!
• What are we supposed to think about evaluation? #United Way, 1996 !
• What do we really think?!
Frustration!
• Last minute demands!• Threat of de-funding !
#(Balch and McWilliams, 1975; Wall, Busch, Koch, Alexander, Minnich, and Jackson-Walker, 2005) !• Lack of clarity!• Lack of standardized process and evaluation (Mason, 2000)!• Unreasonable expectations!!“No matter how discouraged we get, God has not asked us to do the impossible” -George Grace!
!
The Outcome Measurement Movement !Real Benefits to Real Clients!
• HSPs struggling! !– Need to prove worth!– Need to do it quickly!!!
• Benefits = Outcomes!– Initial: what did the client learn?!– Intermediate: how did learning change behavior?!– Long-term: how did this change their condition?!

5/12/15
3
Measuring… Not so bad!
• Excel will do (quite nicely in fact)!• Logical connections, not causal inference!• Do not overreach !• Descriptive and Frequency stats!
– Mean, median !• A couple good standardized instruments!• Build your own!
– Pre-posttests!– Individualized rating scales!
Break Through!
• Didn’t know we didn’t know (Cook and Wittmann, 1998) !• Consensus… a revelation!!• New language, new strategies (Mannarino and Durlak, 1980;
Bilsker and Goldner, 2002; Smith, et al, 2006; Whittaker, et al, 2006) !• Identify better AND easier strategies!
Steps in Evidence Based Practice!Chapter 2!
1. Question formulation!2. Search for evidence!3. Critical appraisal of relevant studies (must
understand statistics)!4. Determine most appropriate/effective!5. Apply intervention!6. Evaluation and Feedback!
5/12/15
4
Outcome Measurement Intended Use
Outcomes and Beyond!
• Needs assessment for program development!• Efficiency for bottom line!• Process for… process!
– Formative and Program Monitoring!• Outcome measurement for effectiveness
– Outcomes = Benefits to clients!– Addresses efficiency and process evaluation along
the way!
A User Friendly, Practical Approach!
• Careful identification of resources (United Way, 1996) !• Sharpen, refine snapshot of services!• Specify and Quantify (Conceptual to Operational)
– Services!– Those served!
• Benefits to clients (Weinbach, 2005) !– Learning!– Changed behavior!– Improved condition!
5/12/15
5
General Evaluation Questions!
• Are clients being helped?!• Are clients satisfied?!• Has program made real difference?!• Does it deserve money spent? More, less?!• New intervention better than old?!• How do we improve?!• Do staff make efficient use of time?!
Research on Mo&va&on in Human Services and Evalua&on
Research Ques&ons Sub-‐ques&ons
– What are the indicators of successful implementa1on?
– What factors facilitate successful implementa&on?
• What are the outcomes (benefits) of implemen&ng the United Way model?
– What factors are barriers to successful implementa&on?
David Cecil, PhD, LCSW (c) copyright
5/12/15
6
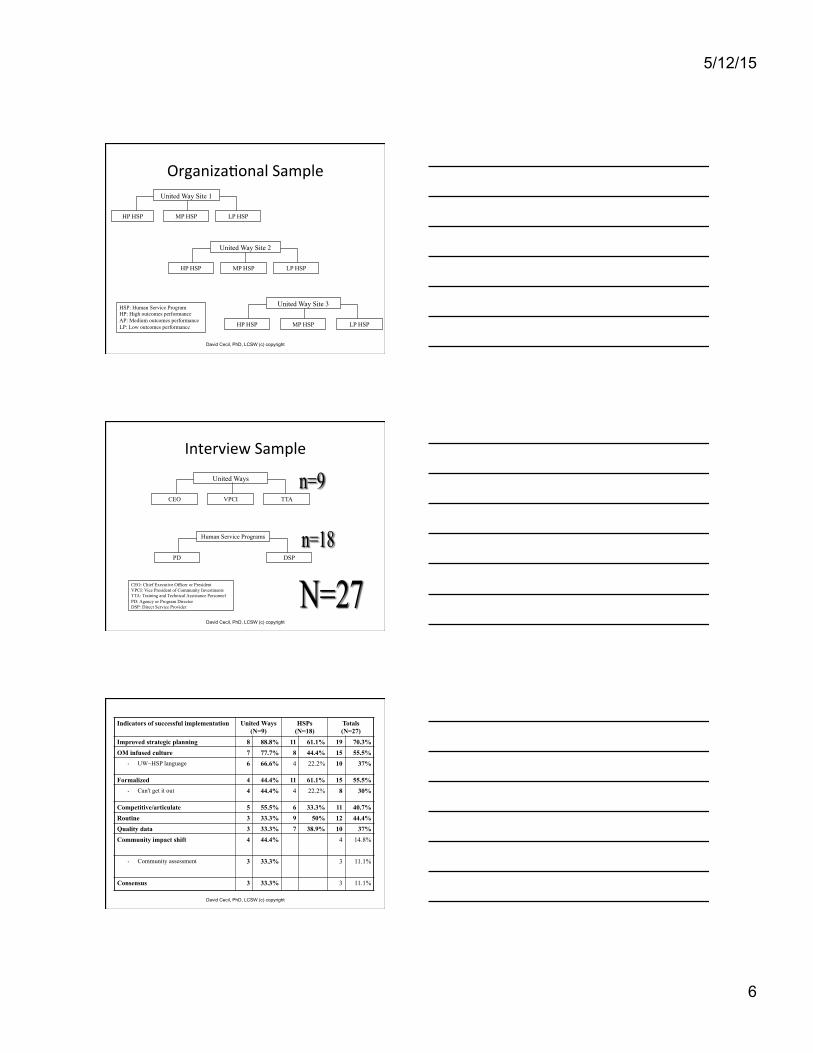
Organiza&onal Sample United Way Site 1
HP HSP MP HSP LP HSP
United Way Site 2
HP HSP MP HSP LP HSP
United Way Site 3
MP HSP HP HSP LP HSP
HSP: Human Service Program HP: High outcomes performance AP: Medium outcomes performance LP: Low outcomes performance
David Cecil, PhD, LCSW (c) copyright
Interview Sample United Ways
VPCI CEO TTA
Human Service Programs
PD DSP
CEO: Chief Executive Officer or President VPCI: Vice President of Community Investments TTA: Training and Technical Assistance Personnel PD: Agency or Program Director DSP: Direct Service Provider
David Cecil, PhD, LCSW (c) copyright
Indicators of successful implementation United Ways (N=9)
HSPs (N=18)
Totals (N=27)
Improved strategic planning 8 88.8% 11 61.1% 19 70.3% OM infused culture 7 77.7% 8 44.4% 15 55.5%
• UW~HSP language 6 66.6% 4 22.2% 10 37%
Formalized 4 44.4% 11 61.1% 15 55.5% • Can't get it out 4 44.4% 4 22.2% 8 30%
Competitive/articulate 5 55.5% 6 33.3% 11 40.7% Routine 3 33.3% 9 50% 12 44.4% Quality data 3 33.3% 7 38.9% 10 37% Community impact shift 4 44.4% 4 14.8%
• Community assessment 3 33.3% 3 11.1%
Consensus 3 33.3% 3 11.1%
David Cecil, PhD, LCSW (c) copyright

5/12/15
7
Indicators of successful implementation
Low (N=6)
Medium (N=6)
High (N=6)
Improved strategic planning 1 16.6% 5 83.3% 5 83.3%
Formalized 5 83.3% 2 33.3% 4 66.6%
• Can't get it out 1 16.6% 3 50%
• Point person 2 33.3% 1 16.6%
• Forms 2 33.3% 1 16.6%
Routine 4 66.6% 1 16.6% 4 66.6%
OM infused culture 1 16.6% 3 50% 4 66.6%
• UW~HSP language 1 16.6% 2 33.3% 1 16.6%
Quality data 4 66.6% 3 50%
Competitive/articulate 1 16.6% 2 33.3% 3 50%
Pro-evaluation 1 16.6% 2 33.3% 1 16.6%
David Cecil, PhD, LCSW (c) copyright
Facilita&ng and Barrier Factors
High turnover
Resistant leadership
Constrained resources
Flexibility
User friendly model
Program improvement
David Cecil, PhD, LCSW (c) copyright
Outcome Measurement Review (if needed)
5/12/15
8
Outcome Measurement Limits and Process
• Quasi-‐experimental • Necessarily a convenience sample • AQri&on • Mostly descrip&ve stats; light use of inferen&al
• Pre-‐post tests (baseline data compared to future data)
• Mixed methods
Outcome Measurement United Way Model
• Inputs-‐ Resources • Ac&vi&es-‐ Snapshot of services • Outputs-‐ Specified and Quan&fied
– Services – Those served
• Outcomes-‐ Benefits to clients – Ini&al, Intermediate, Long Term
• Indicators-‐ Measures outcomes – Expressed as a % or # achieving outcomes
Elements of an Output
• Meaningful to the client (client-‐centered) • Services
– What kind of services? – How oWen and how long?
• Those served – Who are your clients (i.e., CMI adults) – How many?
• The trick: one output statement with ALL of this informa&on.

5/12/15
9
Combining Services with Those Served
• Provide 1 hr/day homework assistance to 50 at-risk youth.
• Provide 1hr/week home-based case management to 100 elderly adults.
• Provide up to 9 months of shelter to 50 homeless men.
Inputs Activities Outputs Outcomes
Initial Intermedia
te Long-term
Staff includes contracted Occupational Therapist and Occupational Therapist Assistant.
In-home safety management
Provide in-home safety management (up to 4, 1 hour visits) to ~100 severely vision impaired clients.
Office facility/equipment
Eccentric reading classes
Provide in-home eccentric reading classes (up to 4, 1 hour visits) to ~100 severely vision impaired clients.
Adapted facility and equipment (for vision impairment)
Community re-entry classes
Provide 2 hours of community re-entry classes to ~10 severely vision impaired clients.
MUSC Partnership
Outcomes Benefits to Client
• Initial outcomes – Increased Knowledge – Improved Skills
• Intermediate outcomes – Modified Behavior
• Long Term outcomes – Improved Condition
5/12/15
10
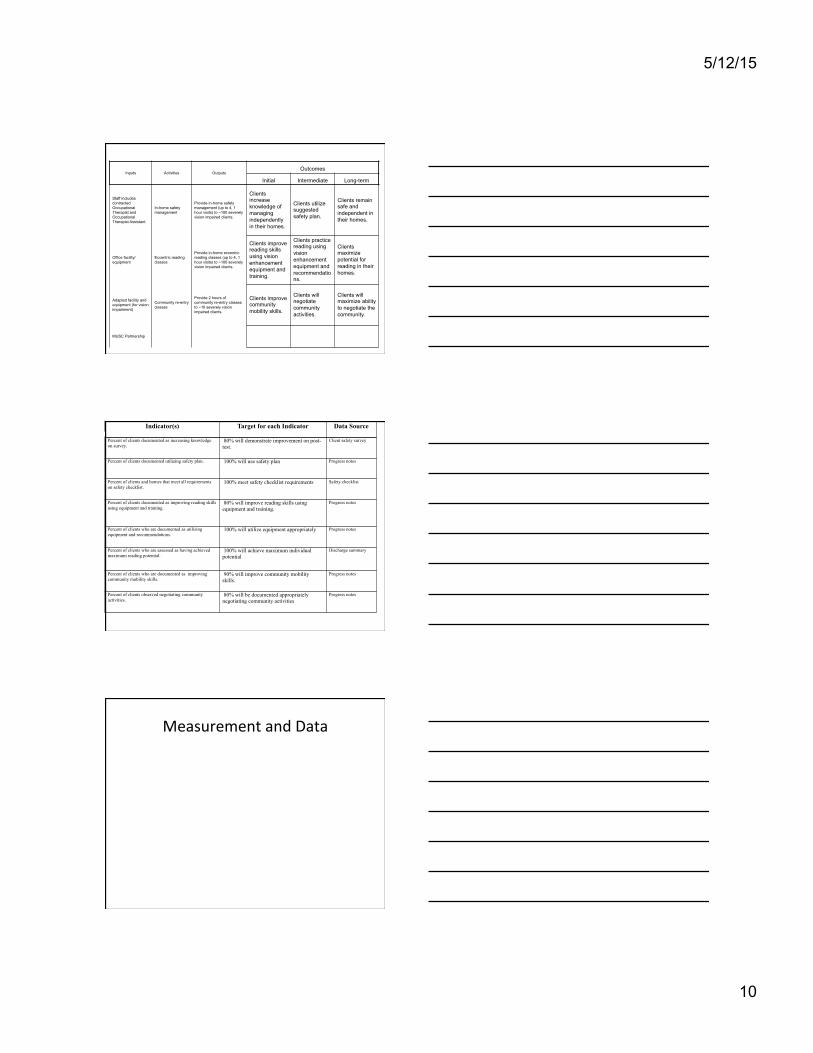
Inputs Activities Outputs Outcomes Initial Intermediate Long-term
Staff includes contracted Occupational Therapist and Occupational Therapist Assistant.
In-home safety management
Provide in-home safety management (up to 4, 1 hour visits) to ~100 severely vision impaired clients.
Clients increase knowledge of managing independently in their homes.
Clients utilize suggested safety plan.
Clients remain safe and independent in their homes.
Office facility/equipment
Eccentric reading classes
Provide in-home eccentric reading classes (up to 4, 1 hour visits) to ~100 severely vision impaired clients.
Clients improve reading skills using vision enhancement equipment and training.
Clients practice reading using vision enhancement equipment and recommendations.
Clients maximize potential for reading in their homes.
Adapted facility and equipment (for vision impairment)
Community re-entry classes
Provide 2 hours of community re-entry classes to ~10 severely vision impaired clients.
Clients improve community mobility skills.
Clients will negotiate community activities.
Clients will maximize ability to negotiate the community.
MUSC Partnership
Indicator(s) Target for each Indicator Data Source
Percent of clients documented as increasing knowledge on survey.
80% will demonstrate improvement on post-test.
Client safety survey
Percent of clients documented utilizing safety plan. 100% will use safety plan
Progress notes
Percent of clients and homes that meet all requirements on safety checklist.
100% meet safety checklist requirements
Safety checklist
Percent of clients documented as improving reading skills using equipment and training.
80% will improve reading skills using equipment and training.
Progress notes
Percent of clients who are documented as utilizing equipment and recommendations.
100% will utilize equipment appropriately Progress notes
Percent of clients who are assessed as having achieved maximum reading potential.
100% will achieve maximum individual potential
Discharge summary
Percent of clients who are documented as improving community mobility skills.
90% will improve community mobility skills.
Progress notes
Percent of clients observed negotiating community activities.
80% will be documented appropriately negotiating community activities
Progress notes
Measurement and Data
5/12/15
11
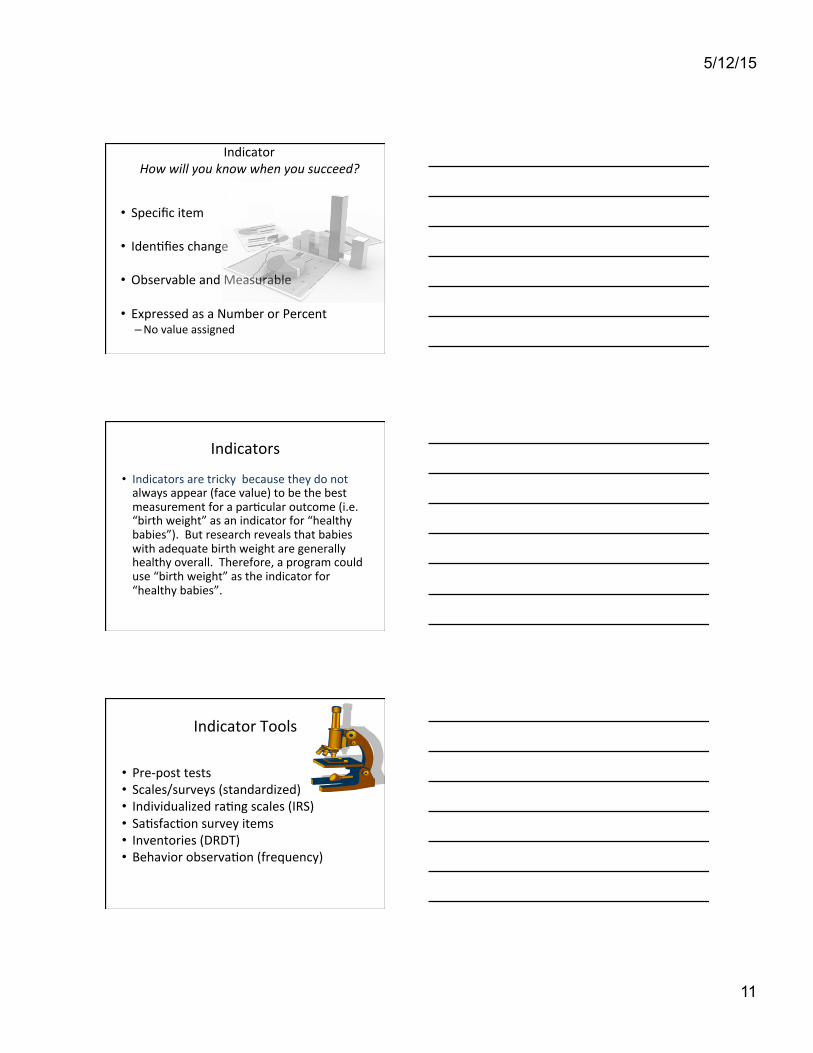
Indicator
How will you know when you succeed?
• Specific item • Iden&fies change
• Observable and Measurable
• Expressed as a Number or Percent – No value assigned
Indicators
• Indicators are tricky because they do not always appear (face value) to be the best measurement for a par&cular outcome (i.e. “birth weight” as an indicator for “healthy babies”). But research reveals that babies with adequate birth weight are generally healthy overall. Therefore, a program could use “birth weight” as the indicator for “healthy babies”.
Indicator Tools
• Pre-‐post tests • Scales/surveys (standardized) • Individualized ra&ng scales (IRS) • Sa&sfac&on survey items • Inventories (DRDT) • Behavior observa&on (frequency)

5/12/15
12
Outcome(s) Indicator(s)
Clients increase knowledge of managing independently in their homes.
Percent of clients documented as increasing knowledge on survey.
Clients utilize suggested safety plan.
Percent of clients documented utilizing safety plan.
Clients remain safe and independent in their homes.
Percent of clients and homes that meet all requirements on safety checklist.
Clients improve reading skills using vision enhancement equipment and training.
Percent of clients documented as improving reading skills using equipment and training.
Clients practice reading using vision enhancement equipment and recommendations.
Percent of clients who are documented as utilizing equipment and recommendations.
Clients maximize potential for reading in their homes.
Percent of clients who are assessed as having achieved maximum reading potential.
Clients improve community mobility skills.
Percent of clients who are documented as improving community mobility skills.
Clients will negotiate community activities.
Percent of clients observed negotiating community activities.
Data Collec&on, Management, and Analysis
Levels of Measurement (reminder)
• Nominal (categorize as names or labels) – Gender: 1 (male) or 2 (female) – CT Group, BMod Group
• Ordinal (rank order) – Likert-‐type (scale of 1 to 7; 1=strongly disagree, etc…) – Grades (A, B, C, F)
• Interval (actual numbers, Equal distance) – Zero is arbitrary
• Temperature – Grades (90, 85)
• Ratio (actual numbers with “true zero”) – Percentage (90%, 85%) – Age
5/12/15
13
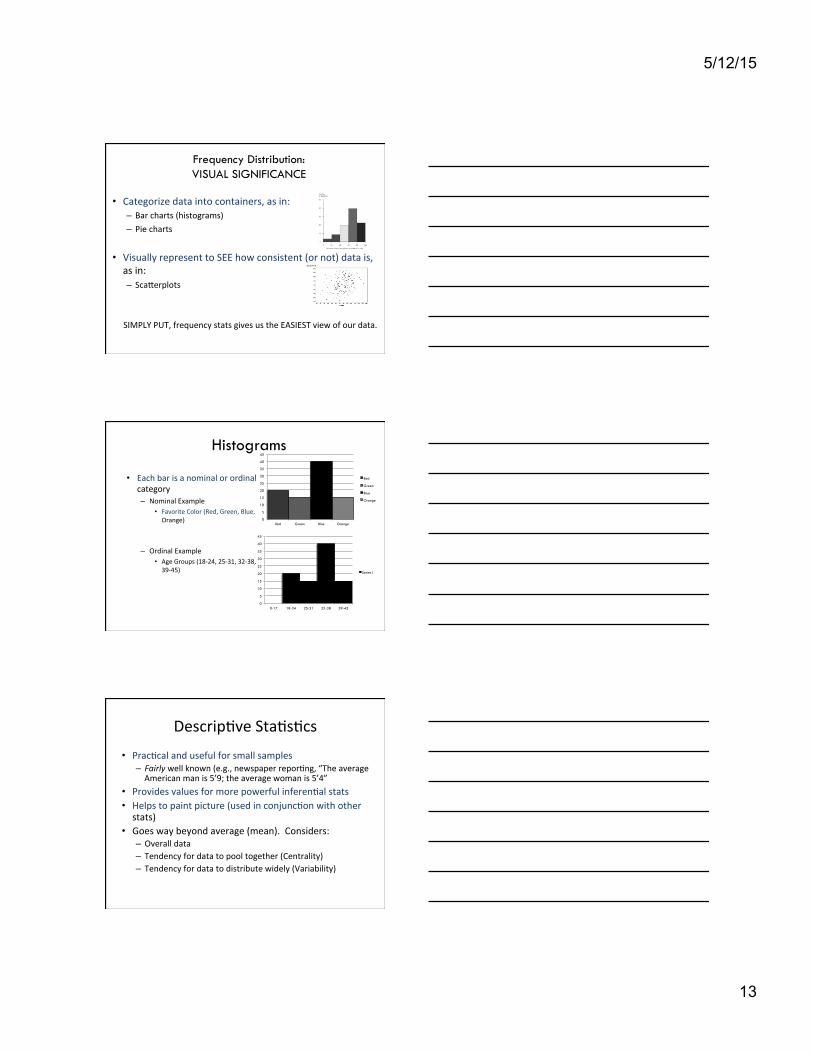
Frequency Distribution: VISUAL SIGNIFICANCE
• Categorize data into containers, as in: – Bar charts (histograms) – Pie charts
• Visually represent to SEE how consistent (or not) data is, as in: – ScaQerplots SIMPLY PUT, frequency stats gives us the EASIEST view of our data.
Histograms
• Each bar is a nominal or ordinal category – Nominal Example
• Favorite Color (Red, Green, Blue, Orange)
– Ordinal Example • Age Groups (18-‐24, 25-‐31, 32-‐38, 39-‐45)
0
5
10
15
20
25
30
35
40
45
Red Green Blue Orange
Red
Green
Blue
Orange
0
5
10
15
20
25
30
35
40
45
0-17 18-24 25-31 32-38 39-45
Series1
Descrip&ve Sta&s&cs
• Prac&cal and useful for small samples – Fairly well known (e.g., newspaper repor&ng, “The average American man is 5’9; the average woman is 5’4”
• Provides values for more powerful inferen&al stats • Helps to paint picture (used in conjunc&on with other stats)
• Goes way beyond average (mean). Considers: – Overall data – Tendency for data to pool together (Centrality) – Tendency for data to distribute widely (Variability)
5/12/15
14
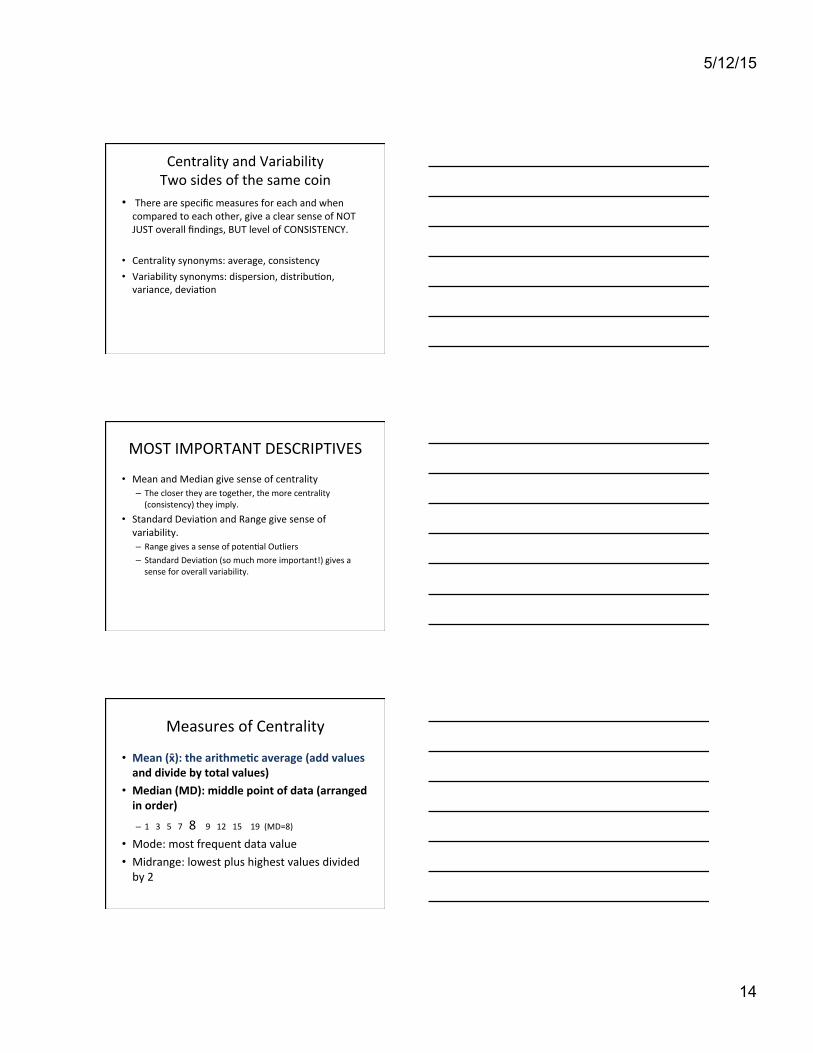
Centrality and Variability Two sides of the same coin
• There are specific measures for each and when compared to each other, give a clear sense of NOT JUST overall findings, BUT level of CONSISTENCY.
• Centrality synonyms: average, consistency • Variability synonyms: dispersion, distribu&on, variance, devia&on
MOST IMPORTANT DESCRIPTIVES
• Mean and Median give sense of centrality – The closer they are together, the more centrality (consistency) they imply.
• Standard Devia&on and Range give sense of variability. – Range gives a sense of poten&al Outliers – Standard Devia&on (so much more important!) gives a sense for overall variability.
Measures of Centrality
• Mean (x̄): the arithme1c average (add values and divide by total values)
• Median (MD): middle point of data (arranged in order)
– 1 3 5 7 8 9 12 15 19 (MD=8)
• Mode: most frequent data value • Midrange: lowest plus highest values divided by 2
5/12/15
15
Variability Standard Devia&on
• What makes a HIGH or LOW Standard Devia&on? • Must be defined in context of study.
– SD= 2 on a 20 point scale (10% varia&on) vs. – SD= 2 on a 100 point scale (2% varia&on) – CUT-‐OFFS
• 0-‐10%: liQle or no varia&on • 11-‐20%: some significant varia&on • 21-‐30%: significant varia&on • 31-‐40%: very significant varia&on • 41+
Descrip&ve Stats Excel
2 3 6 8 4 5 9 8 4 6
Mean 5.50 Standard Error 0.73 Median 5.50 Mode 6.00 Standard Deviation 2.32 Sample Variance 5.39 Kurtosis -1.13 Skewness 0.10 Range 7.00 Minimum 2.00 Maximum 9.00 Sum 55.00 Count 10.00
Conclusions/Recommenda&ons
5/12/15
16
Recommenda&ons for Implementers
• Beware of forcefulness and pressure • Individualize • Work toward formal and rou&ne • Respect influencing factors • Use consultants carefully
David Cecil, PhD, LCSW (c) copyright
Cont. Recommenda&ons for Implementers
• Front-‐line diffusion • Connect outcomes to turnover
– 35% of HSPs turn best staff over in 2 years • Respect diversity • Con&nuous and Advancing training • Emphasize HSP consensus building • Community impact shiW • Inter-‐United Way collabora&on
David Cecil, PhD, LCSW (c) copyright
Program Recommenda&ons
• Program leadership • Implica&ons for turnover • Educate your funding sources
– Use Influencing Factors • Clarify job descrip&ons
– E.g., Managers manage
David Cecil, PhD, LCSW (c) copyright
5/12/15
17
Program Recommenda&ons
• Front-‐line diffusion • Community impact shiW • Market your outcomes • Take advantage of consulta&on
– Co-‐opt
David Cecil, PhD, LCSW (c) copyright
Implementer Success
• Flexible • Low intra-‐organiza&onal contradic&on • Community spirit and rela&onships • Open lines of communica&on, guidance • Sustained, persistent effort
David Cecil, PhD, LCSW (c) copyright
Program Success
• Taking responsibility
• Desire for growth and improvement
• Respect funding source influence
David Cecil, PhD, LCSW (c) copyright
5/12/15
18
A Final Word About Strategic Planning based in LaPiana Bigger Picture
Considerations!La Piana!
• Evaluation should be fluid and organic!• Too many goals, unattainable!• Cumbersome, confusing, and loses interest!• SWOT: strengths, weaknesses, opportunities, and threats!• Leads to frustrated staff, bad data, inaction, time delays!• Is strategy consistent with our identity?!
“If you can’t describe what you are doing as a process, you don’t know what you are doing.” Deming!
Forming opera&onal strategies
• Systems, policies to be well run and stable? • Human, financial, facili&es for next 1 year? • Longer-‐term capital, staffing, cash needs? • Opera&onal informa&on to make good decisions?
• Signs you need more opera&onal strategies – Funders want more detail in financial reports – In service aQendance is low – Board asking for monthly report – Unhappy staff, low morale, ill equipped middle managers
5/12/15
19
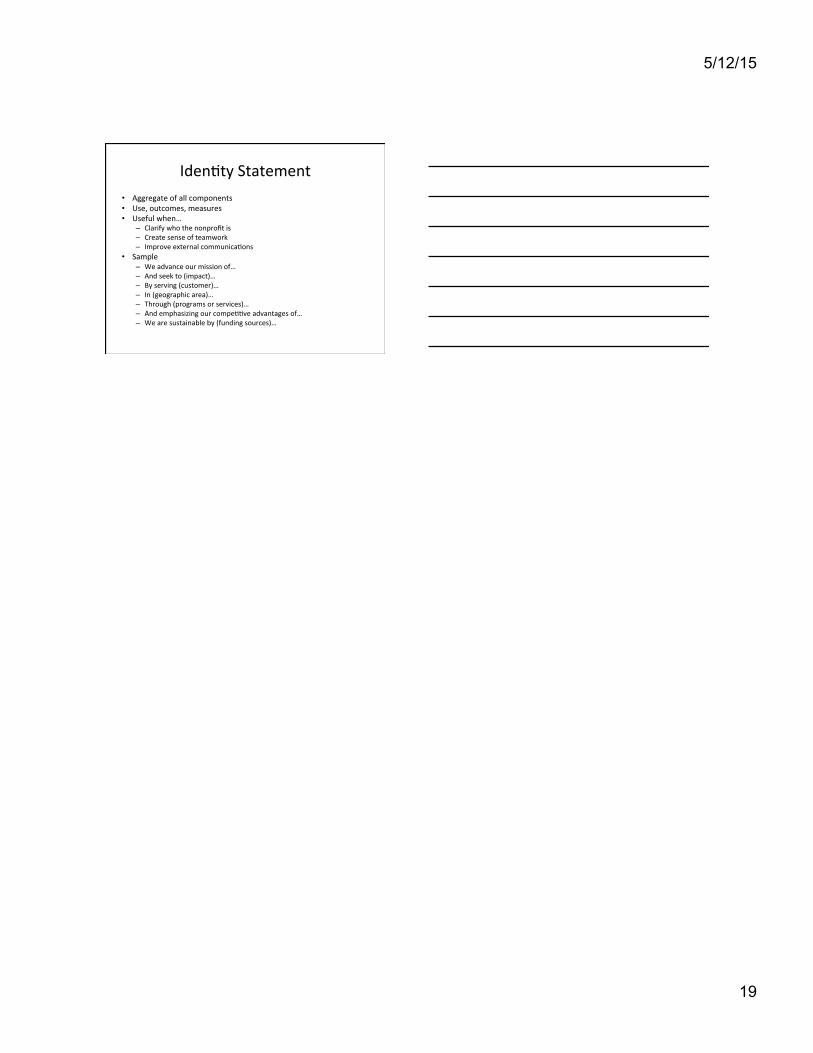
Iden&ty Statement • Aggregate of all components • Use, outcomes, measures • Useful when…
– Clarify who the nonprofit is – Create sense of teamwork – Improve external communica&ons
• Sample – We advance our mission of… – And seek to (impact)… – By serving (customer)… – In (geographic area)… – Through (programs or services)… – And emphasizing our compe&&ve advantages of… – We are sustainable by (funding sources)…


![MolecularCharacterizationofHeatShockProtein70-1Geneof Goat ...downloads.hindawi.com/archive/2010/108429.pdf · HSP70, HSP 60, HSP 40, HSP 10, and small HSP families [3]. Among HSPs,](https://static.fdocuments.in/doc/165x107/60928a385d38631f9170bc5d/molecularcharacterizationofheatshockprotein70-1geneof-goat-hsp70-hsp-60-hsp.jpg)