Outcome Assessment of the Ministry of Health Malaysia ... · PDF fileOutcome Assessment of the...
12
ORIGINAL ARTICLE Outcome Assessment of the Ministry of Health Malaysia Dialysis Programme TO Lim, MRCP*, Y N Lim, MRCP*, H S Wong, MRCP*,G Ahmad, M.Med*, T S Singam, MA*, Zaki Morad, FRCP*, A B Suleiman, FRACP*, G Rozina, MRCP**, L M Ong, MRCP**, L S Hooi, MRCP*** ,Wan Shaariah, MRCP****, C C Tan, MRCP*****, C S Loo, MRCP******, *Department of Nephrology, Hospital Kuala Lumpur, **Department of Medicine, Penang Hospital, ***Department of Medicine, Sultanah Aminah Hospital, ****Department of Medicine, Seremban Hospital, *****Department of Medicine, Tengku Ampuan Rahimah Hospital, ******Department of Medicine, Ipoh Hospital Introduction Public healthcare programme evaluation includes determining programme effectiveness (outcome assessment), programme efficiency (economic evaluation), accessibility (reachability of services) and equity (equal provision for equal needs)1,2, All agree that rigorous programme evaluation should be an integral component of programme operation, this however is rarely performed in practice, Outcome assessment refers to measuring the effects on health status of patients caused by the medical services provided. Health outcome is of fundamental concern to patients and is the main reason they sought medical Med J Malaysia Vol 54 No 4 Dec 1999 care. The primary objective of any health care intervention is to improve people health outcome. The efficacy of a health care intervention is usually established by clinical trial. It is tempting to assume that this automatically generalises to the healthcare programme where the intervention is applied in practice, Clinical trial is designed to safeguard its internal validity and power, and hence it is conducted under ideal circumstances and strict selection criteria are applied to maximise patient homogeneity. In healthcare programme, budget permitting, all who could potentially benefit from treatment are accepted, and patient mix has considerable impact on outcome of treatment. Further, few trials are long enough to provide 459
Transcript of Outcome Assessment of the Ministry of Health Malaysia ... · PDF fileOutcome Assessment of the...

ORIGINAL ARTICLE
Outcome Assessment of the Ministry of Health Malaysia Dialysis Programme
TO Lim, MRCP*, Y N Lim, MRCP*, H S Wong, MRCP*,G Ahmad, M.Med*, T S Singam, MA*, Zaki Morad, FRCP*, A B Suleiman, FRACP*, G Rozina, MRCP**, L M Ong, MRCP**, L S Hooi, MRCP*** ,Wan Shaariah, MRCP****, C C Tan, MRCP*****, C S Loo, MRCP******, *Department of Nephrology, Hospital Kuala Lumpur, **Department of Medicine, Penang Hospital, ***Department of Medicine, Sultanah Aminah Hospital, ****Department of Medicine, Seremban Hospital, *****Department of Medicine, Tengku Ampuan Rahimah Hospital, ******Department of Medicine, Ipoh Hospital
Introduction
Public healthcare programme evaluation includes determining programme effectiveness (outcome assessment), programme efficiency (economic evaluation), accessibility (reachability of services) and equity (equal provision for equal needs)1,2, All agree that rigorous programme evaluation should be an integral component of programme operation, this however is rarely performed in practice,
Outcome assessment refers to measuring the effects on health status of patients caused by the medical services provided. Health outcome is of fundamental concern to patients and is the main reason they sought medical
Med J Malaysia Vol 54 No 4 Dec 1999
care. The primary objective of any health care intervention is to improve people health outcome. The efficacy of a health care intervention is usually established by clinical trial. It is tempting to assume that this automatically generalises to the healthcare programme where the intervention is applied in practice, Clinical trial is designed to safeguard its internal validity and power, and hence it is conducted under ideal circumstances and strict selection criteria are applied to maximise patient homogeneity. In healthcare programme, budget permitting, all who could potentially benefit from treatment are accepted, and patient mix has considerable impact on outcome of treatment. Further, few trials are long enough to provide
459

ORIGINAL ARTiClE
reliable estimates of long term outcome measures like mortality; as opposed to intermediate outcome measures that are the more typical end-points of trial. Thus, one must still ultimately rely on outcome data generated from programme operation to determine the effectiveness of an intervention. In the past decade, with escalating health care cost and the perception that the benefits of medical care are more often assumed than known, there is increasing emphasis on outcome assessment and provider accountabilitylA
However, it is not surprising that the outcome of care provided by health services remains largely unassessed. Routine data on health outcomes are extremely difficult and expensive to obtain. One rare exception is dialysis programme. Most well organised dialysis programmes have parallel data system (so called Dialysis Registry) to keep track of patient movements as well as outcomes5-8 .
Traditionally, the usual data to assess the outcome of dialysis comprises mortality, technique failure and biomedical or physiological measures like adequacy of dialysis, blood pressure and phosphate control, anaemia correction and so on. These are still the usual statistics reported by Dialysis Registries5•6• These are no doubt important as dialysis treatment has historically and still is fundamentally concerned with saving lives. However, it is no less important to demonstrate that dialysis treatment dose not 'merely' keep people alive, but is also capable of restoring 'normal' health, and rehabilitating patients vocationally and functionally. Dialysis treatment has considerable impact on patients' lifestyle. The treatment is time consuming and is not without adverse effects. The fluid and dietary restrictions required of patients on dialysis further impact on their quality of life.
In this report, we describe the outcomes on dialysis in the Ministry of Health Malaysia (MOH) dialysis programme. Outcomes were assessed by mortality, work related rehabilitation and quality of life.
Materials and Methods
This study is based on data collected by the Malaysian Dialysis and Transplant Registry'. The Registry was
460
started in 1992 and by end of 1997, there were 51 participating centres comprising 26 government centres, 17 non-governmental organisation centres and 8 private centres. Subjects for this study are from MOH centres only. The inception cohort consisted 3216 patients who commenced dialysis between 1980 and 1996. Patient ascertainment was complete for MOH centres8 ; and follow up was almost complete as well (less than 1 % lost to follow up).
Participating centres notified patients on dialysis to the Registry and abstracted required data from patient medical records using a data collection form developed and tested by the Registry. Baseline data collected were patient identifier, demographic data, primary renal disease, diabetes mellitus, HBsAg status, date commencing dialysis and history of renal replacement therapy. An annual outcome report was also required for each patient indicating outcome status (death, transplanted, transferred to another modality of dialysis, lost to follow-up). Since 1994, data on work related rehabilitation and quality oflife as assessed by QL index9
were also collected annually. In addition, the Registry conducted annual survey to obtain detailed data on dialysis prescription, vascular or peritoneal access for dialysis, dialysis complications (peritonitis, vascular access related problems), body weight, blood pressure and laboratory data. The Registry coordinating centre monitors the submission of reports and checks reports for completeness and consistency. An active mechanism is in place to track down missing data. Mortality outcome was validated by cross checking with the National Birth and Death Register.
The instrument used for measuring quality of life, the QL index, contains five items. Each item measures a dimension of quality of life. The 5 dimensions covered are activity level, activities of daily living, feeling of healthiness, social support and psychological outlook. Each dimension is scored on a scale from 0 (worst health) to 2 (best health). The 5 scores are summed to give a total ranging between 0 and 10. The instrument was administered by a staff of each dialysis centre. All staff have received prior training and instruction on how to use the instrument. The instrument has previously been validated in the same dialysis population 10.
Med j Malaysia Vol 54 No 4 Dec 1999

OUTCOME ASSESSMENT OF THE MINISTRY OF HEALTH MALAYSIA
Statistical Analysis
Mortality outcome was analysed by the following methods:
1. Annual death rates were calculated by dividing the number of deaths in a year by the estimated mid-year dialysis population.
2. Survival probabilities were calculated by the KaplanMeier methodll.Survival time was from the time the patients started dialysis until they died on that therapy. Transplantation, transfer to another dialysis modality, lost to follow-up and study termination were treated as censored events. Log rank test was used to compare survival curves.
3. Relative survival rate l2 •ll is the ratio of the observed survival probability in the patient group to the expected survival probability expected in a group of the general population similar with respect to age, sex and calendar time. The expected survival probability was calculated from the mortality rate of the Malaysian populationl4. The relative survival rate can be regarded as the proportion who would be alive if only the excess mortality caused by ESRF on dialysis were to occur; it attempts to estimate the effect of ESRF alone on survival. Comparison of relative survival rates were by maximum likelihood test described by Hakulinenl5 or for two groups only, the Charles Brown test l6 .
4. Life expectancy is an estimate of the average future life span for a person. It is the most readily understood summary statistic for mortality. It was calculated using the method described by Hakama and Hakulinen 17, which is the more accurate than other approximate methods ls,19. Both relative survival and life expectancy were computed using the program from the Finnish Cancer Registry20.
Comparisons of QL index scores were by Kruskal Wallis analysis of variance and comparisons of proportions by Pearson's chi-square test. Statistical significance was accepted at 5 % level.
Results
Table I shows the patient characteristics. Recent cohorts were older and the proportion of diabetic were higher. Older and diabetic patients were more often accepted for
Med J Malaysia Vol 54 No 4 Dec 1 999
CAPD. This is not accidental, nephrologists generally prefer to treat older diabetic patients on CAPD. Hence, in this analysis, no attempt is made to compare outcome of HD and CAPD due to selection bias in treatment allocation. Response rates to the annual work related rehabilitation and quality of life (QOL) assessment were variable. For rehabilitation assessment of HD patients, the response rates in 1994, 1995 and 1996 were 71%, 74% and 73% respectively, and the corresponding figures for QOL assessment were 67%, 72% and 72%. For rehabilitation assessment of CAPD patients, the response rates in 1995 and 1996 were 55% and 73% respectively, and the corresponding figures for QOL assessment were 54% and 54%.
Figure 1 shows the death rates on dialysis (both HD and CAPD) from 1980 to 1996. Death rates have been stable and mostly below 10% since 1981.
Tables II and III show the observed and relative survival rates on HD and CAPD respectively according to age, sex and diabetes. Young HD patients have extremely good long term survival; at 15 years, the survival rate was still 49%. Older patients have poorer survival as expected. However, on adjusting for the higher background mortality of older subjects, the relative survival rates for older HD and CAPD patients were similar to younger ones if not slightly better. This may be interpreted to mean that older patients did as well as younger ones on dialysis in respect of survival outcome. Their poorer observed survival rates on dialysis were entirely due to their age and not that older subjects were more susceptible to adverse effects of dialysis treatment. There was little difference in survival between the two sexes. Not surprisingly, diabetics did poorly on dialysis; and diabetics of all ages (Table IV and V) have similar poor survival outcome on both HD and CAPD.
Table IV shows the life expectancy on HD and CAPD. Young patients of age below 40 have remarkable life expectancies of 16.4 and 18.6 years on HD and CAPD respectively. This however still represented a loss of 64% and 62% respectively of their expected life span. Diabetics on the other hand can only expect to live another 2.8 years on CAPD and 5.3 years on HD; a huge proportion (87% and 78% respectively) of their
expected life span were lost.
461

ORIGINAL ARTICLE
Table I Patient Characteristics
1980·83 1984·88 N= 333 N= 566
Age (mean±SD) 37± 12 39 ± 13
Sex: Males 222 (67%) 379 (67%) Females 111 (33%) 187 (33%)
Diabetes: Absent 315 (95%) 519 (92%) Present 18 (5%) 47 (8%)
1980·83 1984·88 N=79
Age (mean+SD) 43 ± 13
Sex: Males 45 (57%) Females 34 (43%)
Diabetes: Absent 63 (80%) Present 16 (20%)
Tables V to VII show the rehabilitation outcome on HD and CAPD. Results were consistent from year to year; slightly more than half the HD patients were able to return to part or full time paid employment. Only 4 to 5% were unable to work as a result of ill health. Not surprisingly, more young patients could return to work; males tend to be employed while females tend to the home. Remarkably, half the diabetic patients between the age of 20 and 55 on dialysis were able to return to paid employment.
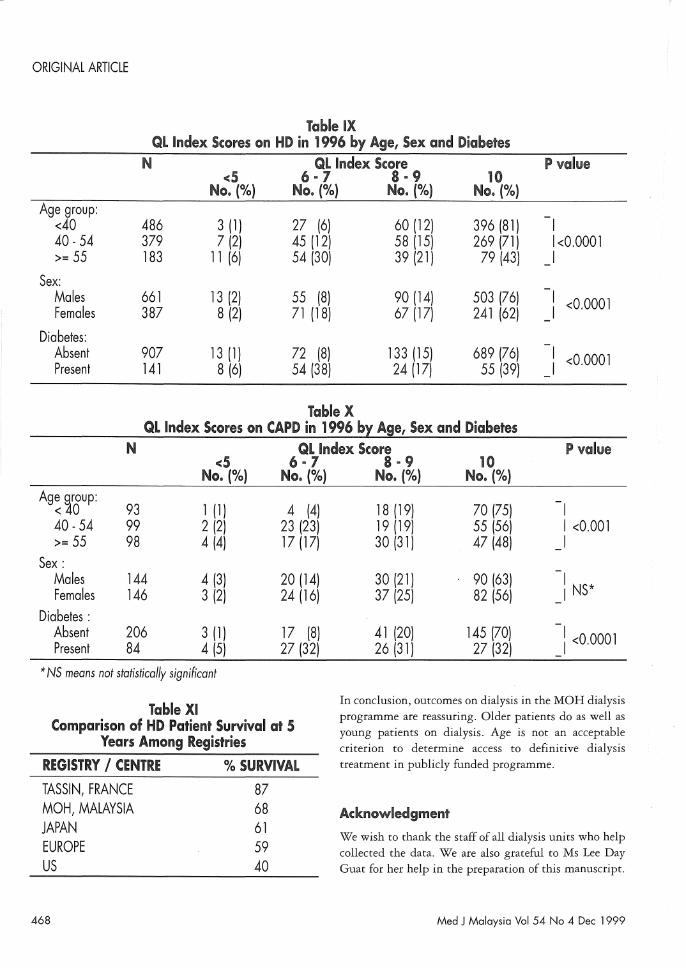
Tables VIII to X show the quality of life outcome on dialysis. Results were also consistent from year to year; 65 % to 71 % of HD patients have 'normal' quality of life (QL index score =10) and 60 to 62% on CAPD. There was an obvious age trend in QL index scores, as younger patients would be expected to have better'
462
HD Inception Cohorts
1989·92 1993·96 All years N= 704 N= 881 N= 2484
41 ± 13 45 ± 14 41 ± 13
455 (65%) 539 (61%) 1595 (64%) 249 (35%) 342 (39%) 889 (36%)
593 (84%) 668 (76%) 2095 (84%) 111 (16%) 213 (24%) 389 (16%)
CAPD Inception Cohorts
1989·92 1993·96 All years N=164 N=489 N=732
47 ± 15 45 ± 17 46 ± 16
89 (54%) 266 (54%) 400 (55%) 75 (46%) 223 (46%) 332 (45%)
105 (64%) 317 (65%) 485 (66%) 59 (36%) 172 (35%) 247 (34%)
functional status particularly physical functioning. Male patients appeared to do better functionally; while diabetics did poorly.
Discussion
The results of this outcome assessment should be interpreted cautiously. Long term medical follow-up studies are liable to certain methodological problems. In particular, failure to use inception cohort and incomplete ascertainment can lead to so called survivor bias resulting in spuriously favorable survival outcome2 ••
Similarly, high rate of loss to follow-up can biased the outcomes as a result of poorer risk patients being selectively censored21 • We were able to avoid all these methodological pitfalls in this study. However, we
Med J Malaysia Vol 54 No 4 Dec 1999

OUTCOME ASSESSMENT OF THE MINISTRY OF HEALTH MALAYSIA
+-' c (J) u '-(J)
0.. C
(/)
.$ ro .... .e +-' ro (J)
0
20
15
10
5
o
percent
1 year
Fig. 1: ArmlJol death rates on dialysis, 1980 to i 996.
cannot claim the cohort studied was a representative sample of patients with ESRF. Patient selection bias was inevitable in accessing treatment in the first place so long that dialysis treatment remains scarce in Malaysia. Registry data8 supported such selection bias, young and non-diabetic patients were accorded preferential access especially in the early years of the MOH programme. The results therefore have limited generalis ability to
other programmes or treatment facility, it strictly pertains to MOH experience. Finally, it should be borne in mind the QL index is a crude measure of QOL. Obvious ceiling effect" was present. Most dialysis patients scored 10, the maximum achievable on the QL index scale as would almost all normal healthy people but few would argue that dialysis patients do not suffer significant impairment in QOL.
Med J Malaysia Vol 54 No 4 Dec 1999
By any standard however, the survival, rehabilitation and QOL outcomes of the MOH dialysis programme are acceptable. No less important, the results have been consistent from year to year in spite of increasing intake of older and higher risk patients (diabetics) in more recent years. In comparison with the results reported by other centres or registries for the year 1982 - 19872),2\ as shown in Table XI, survival outcome for patients in the MOH programme was much better than United State and slightly better than Europe and Japan. This is of course not a fair comparison, our patients were younger and we dialysed fewer high-risk patients like diabetics. However, on standardising to 1987 - 1989 US black patients' age and diabetic distributions (black patients have the best survival outcome in the US), dialysis mortality rate in the MOH programme between 1987
463

ORIGINAL ARTICLE
Table II HD Patient Observed Survival (Obs.surv.) and Relative Survival
(Rel.surv.) Rates According to Age Group, Sex and Diabetes
N 1 year
Age group: < 40 1153 Obs. surv 93 (1) 40-54 875 88 (1) >= 55 452 86 (2)
< 40 1153 ReI. surv 94 (1) 40 -54 875 91 (1) >= 55 452 95 (2)
Sex: Males 1591 Obs. surv 90 (1) Females 889 90 (1)
Males 1591 ReI. surv. 93 (1) Females 889 92 (1)
Diabetes: Absent 2093 Obs. surv 92 (1) Present 387 79 (2)
Absent 2093 ReI. surv 95 (1) Present 387 85 (2)
* NS means not statistically significant
and 1989 was 49% lower than is expected from US Renal Data System (US RDS) mortality rates (Table XII)25. Such comparisons need to be interpreted with caution. Mortality outcome is markedly influence by dialysis acceptance rate and transplantation rate of a country26. High acceptance rate (e.g. US) is associated with poor mortality outcome as poorer risk patients are increasingly accepted. Similarly, high transplantation rate (e.g., US again) is also associated with poor mortality outcome on dialysis as low risk patients are selectively transplanted. MOH practice and Malaysia in general have low rates for both dialysis acceptance and transplantation. This, to a certain extent, accounts for the low observed mortality rates on dialysis in our population. Interestingly, mortality rates on dialysis is remarkably similar to those observed in Japan27 , another country with low transplantation rate as ours.
464
% Survival Rates(SE} at P value 5 years 10 years 15 years
79 (2) 66 (2) 49 (4) I 62 (2) 37 (3) 22 (4) I <0.0001 48 (3) 14 (3) o (0) I
83 (2) 74 (2) 58 (5) I 73 (2) 54 (4) 46 (8) 1<0.0001 87 (5) 54 (12) 0(0) I
67 (1) 45 (2) 27 (3) I NS* 67 (2) 48 (3) 37 (4) I
81 (2) 66 (3) 49 (6) INS 77 (2) 64 (4) 58 (6) I
73 (1) 51 (2) 34 (3) I 37 (3) 16 (4) I <0.0001
84 (1) 70 (2) 55 (5) I 53 (4) 32 (7) I <0.0001
Rehabilitation outcome of the MOH programme was also similar to that observed in Australia. The ANZDATN reported 50 to 54% of dialysis out-patients were able to do part or full time work. Similarly, it reported 67 to 75% of dialysis out-patients in the age group 25 - 44 years scored 90 or 100 on the Karnofsky scale, which we take as equivalent to score of 10 on QL index.
Gain in life expectancy from medical intervention has recently been advocated as providing an important basis for judging the worthiness of an intervention. However, the life expectancy results achieved on HD and CAPD reported in this study may be unfamiliar to most doctors and are certainly hard to interpret on its own. For example, the reported life expectancy of 16.4 years on HD for patients below age 40 years may not seem remarkable. An obvious way to enhance interpretation is compare the
Med J Malaysia Vol 54 No 4 Dec 1999

OUTCOME ASSESSMENT OF THE MINISTRY OF HEALTH MALAYSIA
Table III CAPO Patient Observed Survival (Obs.surv.) and Relative Survival (Rel.surv.)
Rates According to Age Group, Sex and Diabetes
N % Survival Rates (SE) at P value 1 year 5 years
Age group: < 40 242 Obs. surv 94 (2) 80 (6) I 40 -54 243 90 (2) 51 (7) I <0.0001 >= 55 247 80 (3) 30 (6) I
< 40 242 ReI. surv 94 (2) 83 (6) I 40 -54 243 93 (2) 61 (7) I NS* >= 55 247 90 (3) 57 (10) I
Sex: Males 400 Obs. surv 87 (2) 43 (5)
: NS Females 332 88 (2) 58 (8)
Males 400 ReI. surv. 93 (2) 59 (7) : NS Females 332 92 (2) 73 (7)
Diabetes: Absent 485 Obs. surv 94 (1) 67 (4) I Present 247 76 (3) 19 (5) 1<0.0001
Absent 485 ReI. surv 98 (1) 82 (5) I Present 247 82 (3) 29 (8) 1<0.0001
* NS means not statistically significant
Table IV Life Expedancy on HI) and CAPO by Agel Sex and Diabetes
HD CAPO N life Expectancy % of Expected N Life Expedcll'u:y % of Expected
Years (SE) life lost Years (SE) Life Lost Age group:
< 40 1153 16.4 (1.3) 64% 242 18.6 (3.6) 62% 40-54 875 9.3 (0.9) 68% 243 6.5 (1.6) 77% >= 55 452 5.3 (0.5) 70% 247 3.8 (0.7) 78%
Sex: Males 1591 11.2 (0.9) 67% 400 5.9 (1.4) 80% Females 889 12.9 (1.3) 65% 332 6.9 (1.9) 79%
Diabetes: Absent 2093 12.9 (0.9) 64% 485 8.8 (2.1) 76% Present 387 5.3 (1.1) 78% 247 2.8 (0.4) 87%
All 2480 11.7 (0.8) 66% 732 6.4 (1.3) 80%
Med J Malaysia Vol 54 No 4 Dec 1999 465

ORIGINAL ARTICLE
Table V Work Related Rehabilitation on HD and CAPD
1994 1995 1996 Rehabilitation Status : HD HD CAPD HD CAPD
N = 840 N = 973 N = 227 N = 1058 N = 298 No. ('Yo) No. ('Yo) No. ('Yo) No. ('Yo) No. ('Yo)
Full time work for pay 419 (50) 455 (47) 55 (21) 503 (48) 65 (22) Part time work for pay 61 (7) 59 (6) 7 (3) 47 (4) 13 (4) Unable to find job 34 (4) 49 (5) 4 (2) 49 (4) 7 (2) Home maker 141 (17) 179 (18) 62 (27) 210 (20) 88 (29) Student or age < 15 3 «1) 8 (3) 23 (10) 12 (1) 38 (13) Retired or age> 65 139 (17) 181 (19) 54 (23) 182 (17) 68 (23) Unable to work 43 (5) 42 (4) 22 (10) 55 (5) 19 (6)
Table VI Work Related Rehabilitation on HD in 1996 bX Age, Sex and Diabetes
(Only for Patients Age>=20 an Age<55) N Full or Part Time Unable to Find Home Unable to P value
Work for Pay Empl~ment Maker Work No. ('Yo) No. (00) No. ('Yo) No. ('Yo)
Age group: 20·39 409 301 (74) 27 (7) 40·54 305 179 (59) 13 (4)
Sex: Males 450 398 (88) 29 (6) Females 264 82 (31) 11 (4)
Diabetes: Absent 653 450 (69) 38 (6) Present 61 30 (49) 2 (3)
results with the gains in life expectancy associated with treatment in target populations with other established diseases29 • As shown in Table XII, the gains in life expectancy on dialysis compare rather favorably with those achieved by treatment of other diseases. Unfortunately, to
our knowledge, similar local data for treatment of other diseases are not available for comparison.
The survival outcome on dialysis in the MOH programme also confirms local nephrologists' impression that young non-diabetic patients without comorbidities do well on dialysis with reasonably long life expectancy and high rehabilitation rate. This
466
69 (17) 12 (3) <0.0001 91 (30) 22 (7)
1 «1) 22 (5) <0.0001 159 (60)' 12 (5)
144 (22) 21 (3) <0.0001 16 (26) 13 (21)
probably underlies the selection bias in favour of young and middle-aged patients in the past, though acceptance rates of older patients have improved8 as availability of dialysis increases in recent years. Work related rehabilitation is not a relevant outcome measure for elderly patients, and functional outcome cannot be expected to be as good as younger patients as physical functioning declines with age. It is notable that older patients did as well as younger patients with respect to their relative survival outcome. Hence, on survival outcome alone, there is no ground for discriminating against older patients, though they did and continue to
suffer such fate.
Med J Malaysia Vol 54 No 4 Dec 1 999

OUTCOME ASSESSMENT OF THE MINISTRY OF HEALTH MALAYSIA
Table VII Work Related R.ehabilitation on CAP I) in 1996 by Age, Sex and Diabetes
(Ol'llly for Patients Age>20 and Age<55)
N Full or Part Time Unable to Find Home Unable P value Work: for Pay Employment Maker to Work No. (%) No. (%) No. (%) No. (%)
Age group: 20 - 39 38 20 (53) 4 (10) 13 (34) 1 (3) <0.05 40 - 54 60 26 (43) o (0) 30 (50) 4 (7)
Sex: Males 37 32 (87) 2 (5) o (0) 3 (8) <0.0001 Females 61 14 (23) 2 (3) 43 (70) 2 (3)
Diabetes: Absent 78 36 (46) 4 (5) 37 (47) 1 (1) <0.01 Present 20 10 (50) 0 (0) 6 (30) 4 (20)
Table VIII Distribution of QL Index Scores on HD and CAPI)
1994 1995 1996 QL index HD HI) CAPI) HD CAP I) Summated score N :: 802 N::;: 948 N::: 221 N :: 1048 N :::290
No. (%) No. (%) No. (%) No. (%) No. (%)
o (worst) 0 (0) o (0) o (0), o (0) o (0) 1 2 «1) o (0) 1 «1) o (0) o (0) 2 7 (1 ) 4 «1) 1 « 1) 2 «1) o (0) 3 4 «1) 5 «1) o (0) 7 «1) 2 (1) 4 6 «1) 16 (2) 3 (1) 12 (1) 5 (2) 5 15 (2) 29 (3) 8 (4) 35 (3) 9 (3) 6 23 (3) 38 (4) 11 (5) 37 (4) 12 (4) 7 38 (5) 52 (5) 22 (10) 54 (5) 23 (8) 8 54 (7) 75 (8) 16 (7) 60 (6) 28 (10) 9 93 (11) 110 (12) 21 (9) 97 (9) 39 (13)
10 (best) 560 (70) 619 (65) 138 (62) 744 (71) 172 (60)
Med J Malaysia Vol 54 No 4 Dec 1999 467
ORIGINAL ARTICLE
Table IX QL Index Scores on HI) in 1996 by Age, Sex and Diabetes
N <5
No. (%) Age group:
dO 486 3 (1) 40 -54 379 7 (2) >= 55 183 11 (6)
Sex: Males 661 13 (2) Females 387 8 (2)
Diabetes: Absent 907 13 (1) Present 141 8 (6)
Ql Index Score 6·1 8·9
No. (%) No. (%)
27 (6) 60 (12) 45 (12) 58 (15) 54 (30) 39 (21)
55 (8) 90 (14) 71 (18) 67 (17)
72 (8) 133 (15) 54 (38) 24 (17)
Table X
10 No. (%)
396 (81) 269 (71)
79 (43)
503 (76) 241 (62)
689 (76) 55 (39)
P value
I 1<0,0001 I
<0,0001
<0,0001
QL Index Scores on CAPO in 1996 by Agel Sex and Diabetes N Ql Index Score P value
<5 6·7 No. (%) No. (%)
Age group: 93 1 (1) 4 (4) < 40
40 -54 99 2 (2) 23 (23) >= 55 98 4 (4) 17 (17)
Sex: Males 144 4 (3) 20 (14) Females 146 3 (2) 24 (16)
Diabetes: Absent 206 3 (1) 17 (8) Present 84 4 (5) 27 (32)
* NS means not statistically significant
Table XI Comparison of HD Patient Survival at 5
Years Among Registries
REGISTRY I CENTRE % SURVIVAL
TASSIN, FRANCE 87 MOH, MALAYSIA 68 JAPAN 61 EUROPE 59 US 40
468
8·9 10 No. (%) No. (%)
18 (19) 70 (75) I 19 (19) 55 (56) I <0,001 30 (31) 47 (48) I
30 (21) 90 (63) : NS* 37 (25) 82 (56)
41 (20) 145 (70) I 26 (31) 27 (32) I <0,0001
In conclusion, outcomes on dialysis in the MOH dialysis programme are reassuring, Older patients do as well as young patients on dialysis, Age is not an acceptable criterion to determine access to definitive dialysis treatment in publicly funded programme,
ACKnowledgment
We wish to thank the staff of all dialysis units who help collected the data. We are also grateful to Ms Lee Day Guat for her help in the preparation of this manuscript.
Med J Malaysia Vol 54 No 4 Dec 1999

OUTCOME ASSESSMENT OF THE MINISTRY OF HEALTH MALAYSIA
Table XII Comparison of Death Rates on Dialysis
(Standardised to 1987-89 US RDS Black Patients; Age and Diabetic Distribution)
CENTRES Observed Death Rate Standardised Number of Deaths/l 00 Patient-Years Mortality Ratio
US RDS 1987 -9 19.9 1 MOH, Malaysia 1987 - 89 6.5 0.51
Table XIII Gain in Life Expectancy from Medical Interventions29
Disease; Intervention and Target Population Gain in Life Expectancy in Months
MOH dialysis programme (this study) HD patients age>=55 CAPD patients age>=55 diabetic HD patients diabetic CAPD patients
Cardiovascular disease coronary artery bypass or percutaneous transluminal coronary angioplasty for men with triple vessels disease
thrombolytic therapy with recombinant tissue plasminogen activator for patients with suspected acute myocardial infarction heart transplantation
Cancer radical prostatectomy or radiation for 65 year-old men with localised prostate cancer
adjuvant chemotherapy for women with node-negative breast cancer
chemotherapy for patients with advanced non-small cell lung cancer
autologous bone marrow transplantation for patients with relapsed non-Hodgkin's
lymphoma
Others - Interferon for 35 year-olds with chronic hepatitis B, positive HBcAg but without cirrhosis.
Med J Malaysia Vol 54 No 4 Dec 1999
64 46 64 34
4 -14
15
31 - 99
1 - 11 7.7 - 11 l.8-2.9
72
37
469
ORIGINAL ARTICLE
1. Phillips C, Palfrey C, Thomas P. Evaluating health and social care. MacMillan Press, London 1994.
2. Tugwell P, Benneett K], Sackett DL, Haynes RB. The measurement iterative loop: a framework for the critical appraisal of need, benefit and costs of health interventions.] Chron dis 1985; 339-51.
3. ReIman AS. Assessment and accountability. New Eng] Med 1988; 319: 1220-2.
4. Epstein AM. The outcomes movement. New Eng] Med 1990; 323: 266-70.
5. United States Renal Data System. 1990 Annual Report. Bethesda, MD. The National Institute of Health. The National Institute of Diabetes, Digestive and Kidney Disease, and the Division of Kidney, Urologic and Hematologic Diseases, August 1990.
6. Wing A], Bryer M, Brunner FP et at. Combined Report on regular dialysis and transplant in Europe, XII 1982. Proc Eur Dial Transplant Assoc 1983; 20: 5.
7. Disney A (ed). Australia and New Zealand Dialysis and Transplant Registry (ANZDATA) reports, 1993. Adelaide, Queen Elizabeth Hospital 1993.
8. Lim TO., Lim YN. (ed) Foutth report of the Malaysian Dialysis and Transplant Registry, Kuala Lumpur, 1998.
9. Spitzer WD, Dobson A], Hall] et al. Measuring the quality of life of cancer patients, a concise QL index for use by physicians.] Chron Dis 1981; 34: 585-97.
10. Lim TO. et al. Reliability, validity and discriminatory ability of Spitzer's QL index in dialysis patients. Med ] Malaysia 1998; 53: 392-400.
11. Kaplan EL, Meier P. Non-parametric estimation from incomplete observations.] Am Stat Assoc 1958; 53: 457-81.
12. Ederer F, Axtel LM, Cutler SJ. The relative survival rate: a statistical methodology. Natl Cancer Inst Manual 1961; 6: 101-21.
13. Hakulinen. On long term relative survival rates.] Chron Dis 1977; 30: 431-43.
14. Abridged Life Tables 1981-1996, Malaysia. Department of Statistics, Malaysia.
15. Hakulinen T, Tenkanen L, Abeywickrama K, Paivarinta 1. Testing equality of relative survival patterns based on aggregated data. Biometrics 1987; 43: 313-25.
470
16. Brown ce. The statistical comparison of relative survival rates. Biometrics 1984; 39: 941-8.
17. Hakama M, Hakulinen T Estimating the expectation of life in cancer survival studies with incomplete follow-up information.] Chron Dis 1977; 30: 585-97.
18. Beck ]R, Kassirer ]P, Pauker SG. A convenient approximation of life expectancy (the DEALE) 1.
Validation of the method. Am] Med 1982; 73: 883-8.
19. Beck]R, Pauker SG, Gottlieb ]E, Klein Ket at. A convenient approximation of life expectancy (the DEALE) II. Use in medical decision making. Am] Med 1982; 73: 889-97.
20. Hakulinen T, Gibberd R, Abeywickrame K, Soderman B. A computer program package for cancer survival studies. Finnish Cancer Registry 1988.
21. Sims T Importance of a high tracing rate in long term medical follow up studies. Lancet 1973; i: 433-75.
22. Fitzpatrick R, Fletcher A, Gore S, Jones D et al. Quality of life measures in health care I: Application and issues on assessment. Br Med] 1992; 305: 1074-7.
23. Held P], Brunner F, Odaka M, Garcia]R et al. Five year survival for ESRD patients in the US, Europe and ]apan,1982 to 1987. Am] Kid Dis 1990; 15: 451-7.
24. Charra B, Calemard E, Ruffet M, Chazot C et al. Survival as an index of adequacy of dialysis. Kid Int 1992; 41: 1286-91.
25. Wolfe RT, Gaylin DS, Port FK, Held P] et al. Using US RDS generated mortality tables to compare local ESRD mortality rates ro national rates. Kid Int. 1992; 42: 991-6.
26. Kjellstrand CM, Hylander B, Collins Ae. Mortality on dialysis on the influence of early start, patient characteristics and transplantation and acceptance rates. Am] Kid Dis 1990; 15: 483-90.
27. Odaka M. Mortality in chronic dialysis patients in Japan Am] Kid Dis 1990; 15: 410-3.
28. Sackett DL, Whelton G. Cancer risk in ulcerative colitis: scientific requirements for the study of prognosis. Gasteroenterology 1980; 78: 1632-5.
29. Wright ]C, Weinstein Me. Gains in life expectancy from medical interventions-standardizing data on outcomes. New Engl] med 1998; 339: 380-6.
Med J Malaysia Vol 54 No 4 Dec 1 999