Outbound Network Simulation for Staples, Inc.
56
Project Number: ZAZ-ST03 Outbound Network Simulation for Staples, Inc. A Major Qualifying Project Report Submitted to the Faculty Of the WORCESTER POLYTECHNIC INSTITUTE in partial fulfillment of the requirements for the Degree of Bachelor of Science By _______________ Matthew Fleming _______________ Craig McIntyre Dated: March 1, 2007 Approved: _________________ Amy Z. Zeng
Transcript of Outbound Network Simulation for Staples, Inc.
Project Number: ZAZ-ST03
Outbound Network Simulation for Staples, Inc.
A Major Qualifying Project Report
Submitted to the Faculty
Of the
WORCESTER POLYTECHNIC INSTITUTE
in partial fulfillment of the requirements for the
Degree of Bachelor of Science
By
_______________ Matthew Fleming
_______________ Craig McIntyre
Dated: March 1, 2007
Approved:
_________________
Amy Z. Zeng
2
Acknowledgements
The team would like to thank Professor Amy Zeng for her guidance during the project.
We would also like to thank Staples for giving us the opportunity to work on a project
like this; especially Jim Callery and Victoria Eddy for their help.
3
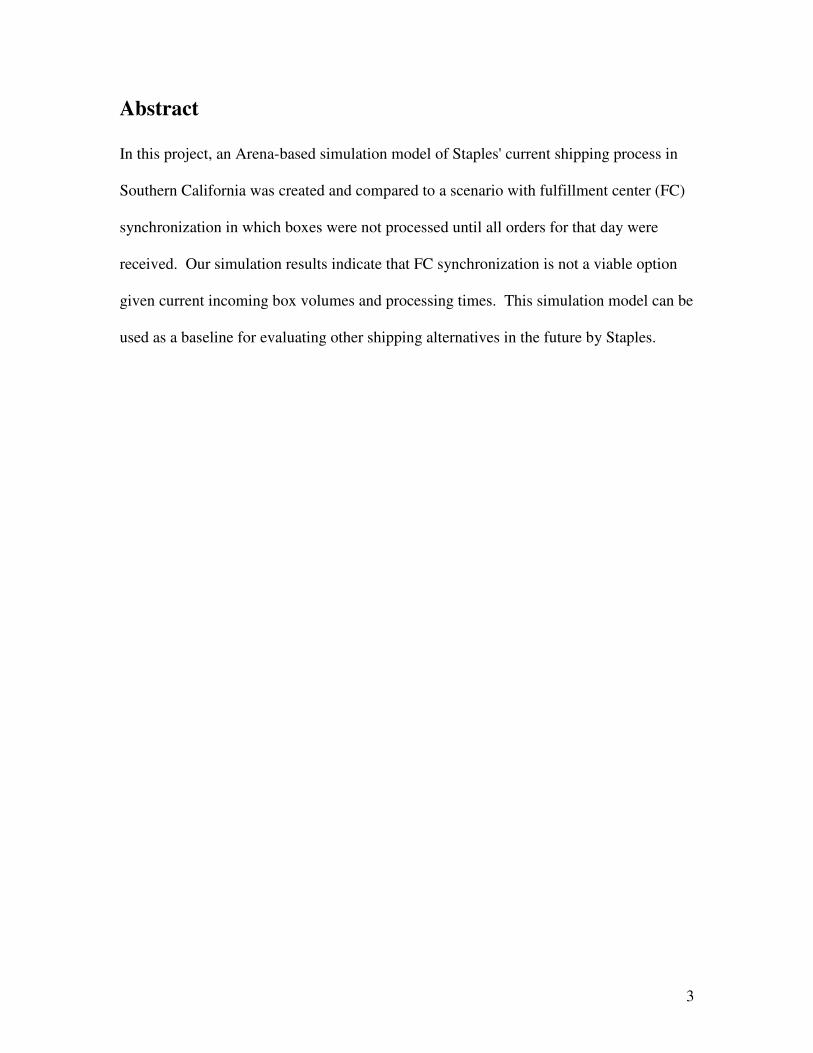
Abstract
In this project, an Arena-based simulation model of Staples' current shipping process in
Southern California was created and compared to a scenario with fulfillment center (FC)
synchronization in which boxes were not processed until all orders for that day were
received. Our simulation results indicate that FC synchronization is not a viable option
given current incoming box volumes and processing times. This simulation model can be
used as a baseline for evaluating other shipping alternatives in the future by Staples.
4
Table of Contents Table of Figures ...................................................................................................................5 Table of Tables ....................................................................................................................6 1 Introduction.......................................................................................................................7 2 Background and A Preliminary Study ..............................................................................9
2.1 Corporate Profile....................................................................................................... 9 2.2 Staples History....................................................................................................... 10 2.3 Outbound Network.................................................................................................. 11
2.3.1 Fulfillment Centers and Service Delivery Operations ..................................... 12 2.3.2. The UPS “Dog House” Model........................................................................ 12 2.3.3 Visit to Putnam FC........................................................................................... 15 2.3.4 Visit to North Reading SDO............................................................................ 17
2.4 Process Description................................................................................................. 22 3 Literature Review............................................................................................................25
3.1 Staples Supply Chain .............................................................................................. 25 3.2 A Description of Logistics and its Significance ..................................................... 26 3.3 Characteristics of other Companies’ Distribution Processes .................................. 28 3.4 Process Improvement.............................................................................................. 31 3.5 Simulation............................................................................................................... 34 3.6 Arena....................................................................................................................... 35
4 Methodology...................................................................................................................36 5 Simulation and Results ...................................................................................................37
5.1 Baseline Model ....................................................................................................... 37 5.2 FC Synchronization ................................................................................................ 48 5.3 Results..................................................................................................................... 50
6 Conclusions and Recommendations ...............................................................................51 References..........................................................................................................................55
5
Table of Figures Figure 1: Staples order filling process diagram ................................................................ 12 Figure 2: UPS doghouse model ........................................................................................ 13 Figure 3: SDO location diagram....................................................................................... 14 Figure 4: Movable SDOs .................................................................................................. 15 Figure 6: The conveyor belt just before boxes are loaded onto the tucks......................... 17 Figure 7: Items that have been restocked.......................................................................... 17 Figure 8: One of the delivery trucks at the North Reading SDO...................................... 18 Figure 9: Workers processing boxes................................................................................. 19 Figure 10: Mailboxes where drivers get their routes ........................................................ 20 Figure 11: Flex belt that connects the line haul to the conveyor belt ............................... 21 Figure 12: SDO Diagram.................................................................................................. 23 Figure 13: Outbound process map. ................................................................................... 24 Figure 14: A screenshot of the box volume input parameter selected in Arena. .............. 38 Figure 15: Box create time graph...................................................................................... 39 Figure 16: The hub assignment input parameter selected in Arena.................................. 40 Figure 17: Conveyor Process time selected in the model….. ........................................... 41 Figure 18: Truck Load Process screenshot from Arena.................................................... 42 Figure 19: A sample of the data used to determine line haul travel times........................ 43 Figure 20: SDO Load........................................................................................................ 44 Figure 21: A process map of the baseline model summarizing the inputs. ...................... 45 Figure 22: This shows the hub cut times. ......................................................................... 46 Figure 23: A decision module: when the given truck fills up to 900 boxes, the orders go
to the next truck. ....................................................................................................... 47 Figure 24: Maximum conveyor capacity module ............................................................. 48 Figure 25: A process map of FC synch summarizing the inputs. ..................................... 49

6
Table of Tables
Table 1 …………………………………………………………………………………51
Table 2 …………………………………………………………………………………51
7
1 Introduction Since its start up in 1986, Staples Incorporated has grown into one of the most
recognizable names in office supplies. Consumers ranging from the single home office
worker to entire companies to the can purchase supplies at one of the local Staples retail
stores, or order them online. This MQP will deal with the online orders and how they are
transported from Staples to the consumer. More specifically, the outbound network that
Staples relies on to deliver supplies from its FCs (fulfillment centers) to its SDOs (service
delivery operations) was be defined, and analyzed in this project (Callery, 04OCT06).
The whole outbound network will not be analyzed, as WPI has neither the time
nor the money to send its students to FC’s and SDO’s all over the country in order to
gather information. Instead, only the Southern California network was modeled in a
simulation program called Arena in order to find any potential cost cutting measures.
Modeling this systems was a large part of this MQP, with consideration being paid to the
following areas:
• FC Wave-Sort-Load – the three main phases that an order goes through in
a fulfillment center. First, the orders are sent out in waves, and they are
picked and put into boxes. Secondly, these orders are sorted by which
SDO they are going to, and are finally loaded onto a tractor trailer truck.
• Line haul – the transportation from FC to SDO on a tractor trailer truck.
• SDO Sort-Load-Return – upon arrival to the SDO, the tractor trailer is
unloaded, and the packages that it contains are sorted into specific routes
for distribution from the SDO by smaller, more numerous trucks. After
this, the smaller trucks are loaded up, and they go to their routes to deliver
their packages (Callery, 20SEP06).
8
After the current system was modeled in Arena, a scenario which will be
explained later called FC synchronization was tested to see if it is an improvement over
the current process.
The reason that outbound network simulation is being done for Staples is because
their famous one day delivery guarantee is directly affected by this network. If Staples’
delivery system isn’t efficient enough, deliveries will not make it to consumers on time.
This is unacceptable for Staples as missed deliveries lead to frustrated customers who
might decide to purchase their office supplies elsewhere (Plourde, 29AUG06). Outbound
network simulation is also being conducted in order to find any new methods or
processes that can make Staples’ delivery service more profitable. Another reason why
this simulation is being performed is to provide the two WPI students who are creating
this report with practical experience.
By the end of this project, the authors gained experience in data collection and
verification, simulation modeling and analysis, process improvement and of course, the
general experience of dealing with a large company such as Staples. The WPI academic
program stresses practical application of academic material learned in the classroom, with
the MQP the final big step for soon to be graduating undergraduates (WPI, 2006).
The main function of the simulation is for Staples to receive a working and
functional baseline model to be utilized for future projects with the Southern Californmia
network as well as gain information about the possibility of implementing a FC
synchronization model.
9
2 Background and A Preliminary Study
2.1 Corporate Profile
Staples breaks its business into three segments: North American Retail, North
American Delivery and International Operations.
North American retail is comprised of 1,539 stores throughout the U.S. and
Canada. The typical Staples superstore is around 20,000 square feet and is complete with
a selection of over 7,000 products, a Copy & Print Center, a UPS Ship Center, Build–to–
Order computer capabilities as well as internet kiosks which allow customers to shop on
Staples.com so no customer leaves without finding what they were looking for. Major
cities like Manhattan, Boston, and San Francisco also have smaller store formats, called
Staples Express (Staples, 2006).
North American Delivery is the segment that this project will be focused on. It
encompasses Staples Contract, Staples Business Delivery and Quill. Staples Contract is
Staples’ fastest growing business. It serves both mid-sized and Fortune 1000 companies
through Staples Business Advantage and Staples National Advantage respectively.
Contract has “procurement contracts” with each company at the lowest total delivered
cost to them. “For two years in a row, Staples Contract Division has been certified by
J.D. Power and Associates for delivering ‘An Outstanding Customer Service
Experience’” . Staples Business Delivery is a combination of Staples.com and Staples’
catalog businesses which serves small to medium sized companies. Staples’ 29
fulfillment centers and fleet of 800 delivery trucks are a major part of what handles
Staples Business Delivery. Staples.com has 45,000 products available to customers who
can browse through in the comfort of their home or office.
10
Quill Corporation is an office supplies direct marketer which was acquired by
Staples in 1998. Quill and Quoll.com are a separate brand which also serves small to
medium-sized businesses. “Quill is known for top–notch customer service and highly
effective marketing to vertical industries such as the legal, medical and educational
professions.” (Staples, 2006)
Staples is now all over the world icluding Belgium, Germany, the Netherlands,
Portugal, the United Kingdom, and China. The Chinese operations are based in Beijing
and Shanghai, and include a retail showroom in Shanghai and its e-commerce site
english.oa365.com. It supplies many of the Chinese government departments as well as
many companies with office supplies. Staples runs 262 stores in its European group.
Some of those stores are under the name Staples Office Centre, which also has a delivery
business (Staples, 2006).
2.2 Staples History
The nest egg for the creation of Staples by Tom Steinberg happened over the
fourth of July 1985. Tom’s printer ribbon had broken and unable to find a store that he
could purchase one from, he came up with the idea for an office supplies superstore. Ten
months later the first Staples retail store opened its doors.
Staples made it easy for the average consumer and small business to get office
supplies at prices that prior to Staples inception were only available to large companies
through contracts. In the two years following its opening many copy cat stores popped
up around the country, but due to high competition from a few, only three remain today.
11
Today Staples has expanded from a retail-only corporation to offering catalogs,
and e-commerce sites. These offerings are also available in a majority of the globe as
Staples has gone international (Staples, 2006).
Staples has not only changed in terms of the media in which they offer there
products and the places they are able to reach, they have also adjusted their goals. They
are not only focused on price and selection, but have adapted to the fast-paced demanding
world in which we live by making it easier for businesses to by products. The stores are
easier to utilize. The higher-demand items like ink and paper are at the front of the stores
where people can easily find them. They also guarantee that they will have the type of
ink or toner cartridge the customer needs in stock. Associates are schooled on how to
make each customer’s trip to the store as productive and quick as possible so they can get
on to other things. As they say, there ultimate “goal – [is] for every customer after every
purchase to think... Staples, that was easy” . Up to this point that kind of focus on
customer satisfaction has lended itself well to maximizing the bottom line. In 2005,
Staple’s profit’s reached $16.1 billion (Staples, 2006).
2.3 Outbound Network
A successful company is often distinguished from an unsuccessful company on
how efficiently it gets its product to the consumer. Nowhere is this more applicable than
in companies such as Staples, which promise next day delivery on office supplies
purchased online. In order to achieve this promise, Staples must have an efficient
shipping network capable of handling a great amount of volume in the shortest time
12
possible. This has been achieved by creating a series of FCs (Fulfillment Centers) and
SDOs (Service Delivery Operations) that handle a customer’s order (Plourde, 29AUG06).
2.3.1 Fulfillment Centers and Service Delivery Operations
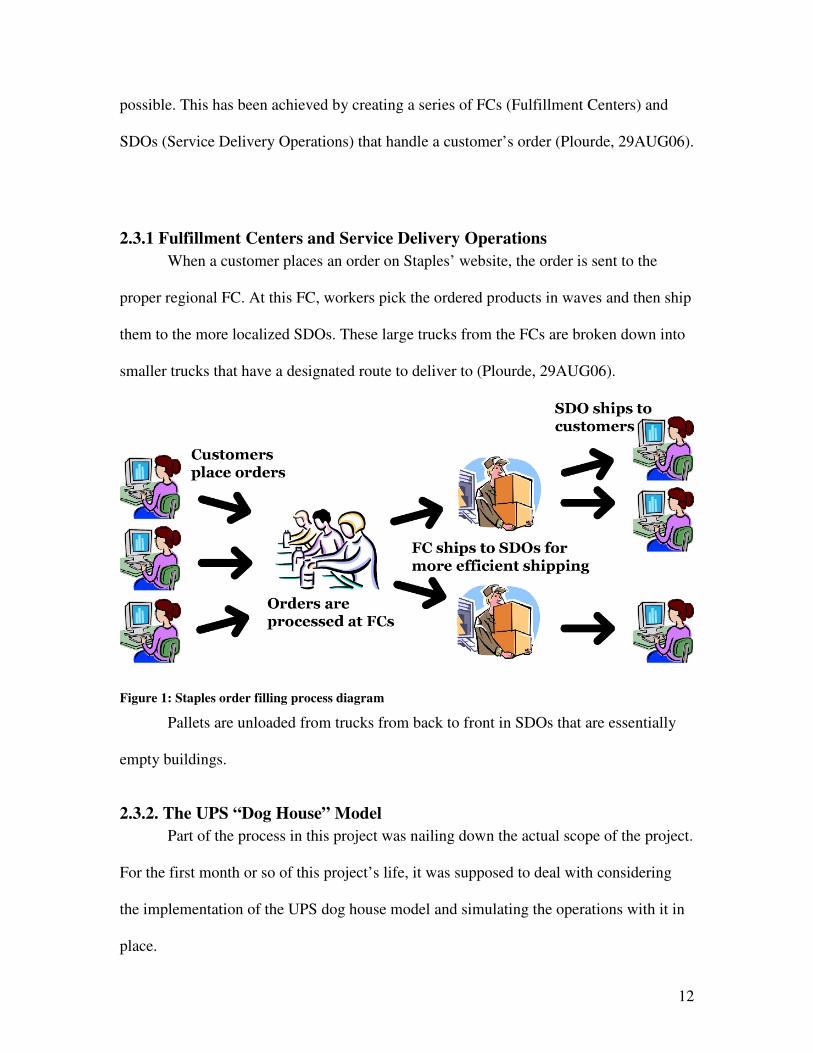
When a customer places an order on Staples’ website, the order is sent to the
proper regional FC. At this FC, workers pick the ordered products in waves and then ship
them to the more localized SDOs. These large trucks from the FCs are broken down into
smaller trucks that have a designated route to deliver to (Plourde, 29AUG06).
Figure 1: Staples order filling process diagram
Pallets are unloaded from trucks from back to front in SDOs that are essentially
empty buildings.
2.3.2. The UPS “Dog House” Model
Part of the process in this project was nailing down the actual scope of the project.
For the first month or so of this project’s life, it was supposed to deal with considering
the implementation of the UPS dog house model and simulating the operations with it in
place.
13
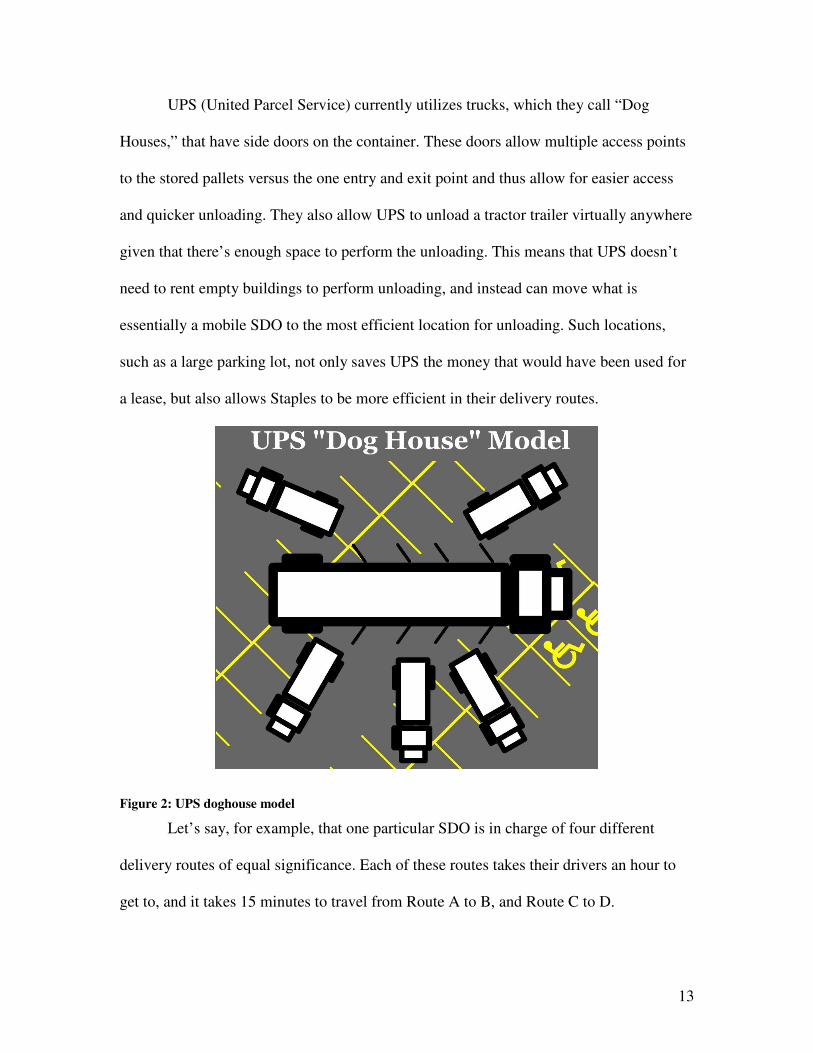
UPS (United Parcel Service) currently utilizes trucks, which they call “Dog
Houses,” that have side doors on the container. These doors allow multiple access points
to the stored pallets versus the one entry and exit point and thus allow for easier access
and quicker unloading. They also allow UPS to unload a tractor trailer virtually anywhere
given that there’s enough space to perform the unloading. This means that UPS doesn’t
need to rent empty buildings to perform unloading, and instead can move what is
essentially a mobile SDO to the most efficient location for unloading. Such locations,
such as a large parking lot, not only saves UPS the money that would have been used for
a lease, but also allows Staples to be more efficient in their delivery routes.
Figure 2: UPS doghouse model
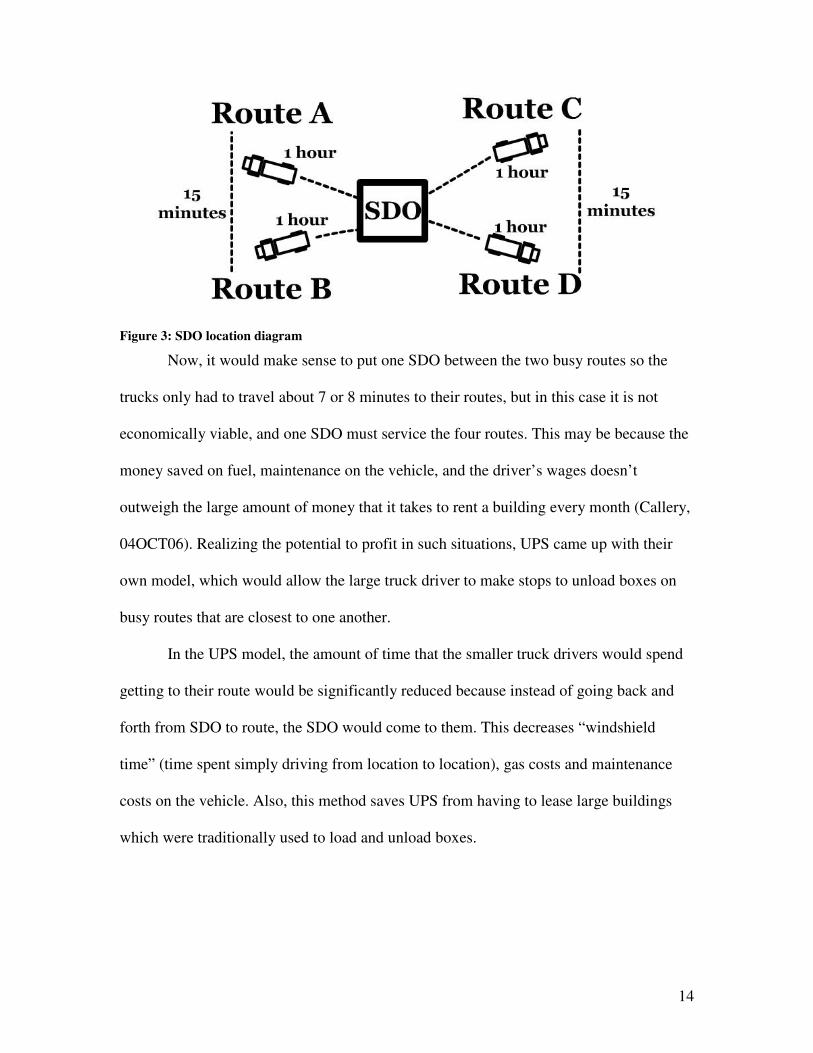
Let’s say, for example, that one particular SDO is in charge of four different
delivery routes of equal significance. Each of these routes takes their drivers an hour to
get to, and it takes 15 minutes to travel from Route A to B, and Route C to D.
14
Figure 3: SDO location diagram
Now, it would make sense to put one SDO between the two busy routes so the
trucks only had to travel about 7 or 8 minutes to their routes, but in this case it is not
economically viable, and one SDO must service the four routes. This may be because the
money saved on fuel, maintenance on the vehicle, and the driver’s wages doesn’t
outweigh the large amount of money that it takes to rent a building every month (Callery,
04OCT06). Realizing the potential to profit in such situations, UPS came up with their
own model, which would allow the large truck driver to make stops to unload boxes on
busy routes that are closest to one another.
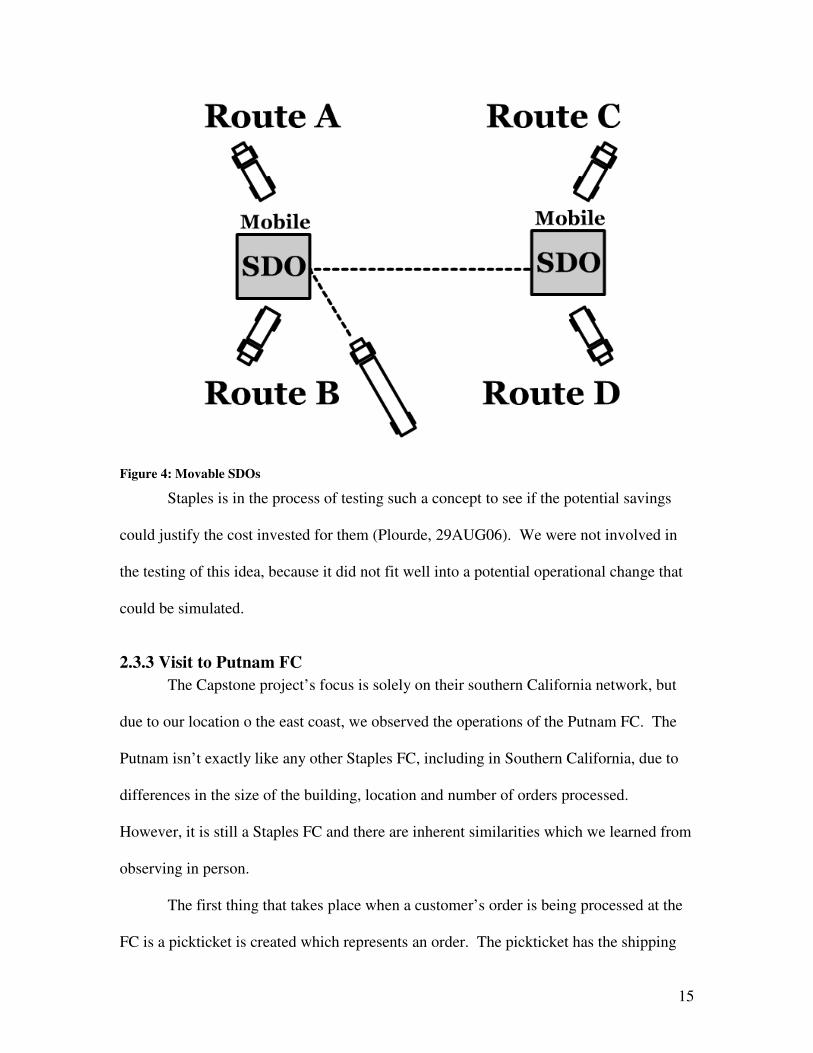
In the UPS model, the amount of time that the smaller truck drivers would spend
getting to their route would be significantly reduced because instead of going back and
forth from SDO to route, the SDO would come to them. This decreases “windshield
time” (time spent simply driving from location to location), gas costs and maintenance
costs on the vehicle. Also, this method saves UPS from having to lease large buildings
which were traditionally used to load and unload boxes.
15
Figure 4: Movable SDOs
Staples is in the process of testing such a concept to see if the potential savings
could justify the cost invested for them (Plourde, 29AUG06). We were not involved in
the testing of this idea, because it did not fit well into a potential operational change that
could be simulated.
2.3.3 Visit to Putnam FC
The Capstone project’s focus is solely on their southern California network, but
due to our location o the east coast, we observed the operations of the Putnam FC. The
Putnam isn’t exactly like any other Staples FC, including in Southern California, due to
differences in the size of the building, location and number of orders processed.
However, it is still a Staples FC and there are inherent similarities which we learned from
observing in person.
The first thing that takes place when a customer’s order is being processed at the
FC is a pickticket is created which represents an order. The pickticket has the shipping
16
label on it. The computer system organizes the orders based on the carton size and the
number of items in the order. It also sets when the waves (a wave is when a group of
orders is printed and sent to the floor for processing) are to begin.
Next clothes pins are attached to the boxes which the orders will be shipped in.
The clothes pins indicate the level of priority of the order. In descending order of
importance, the colors are as follows: red, blue, yellow, green, and white. From there the
computer system sorts the boxes to different parts of the warehouse based on what items
are in the given order.
At this point workers “pick” by looking at a given box, and putting the
appropriate items in the box. The worker is responsible for fulfilling their own wok, as
well as checking the work of the previous worker. Color coding is utilized again here to
indicate the level of experience of the previous employees. Employees who have more
than a year experience use blue or black ink, workers with less than six months use red,
and employees who have worked for more than six months but less than a year use green
ink.
At the end of the process line, quality control workers check the green and red
inked work as well as the last picker if he/she isn’t a green or red. Boxes that have
mistakes are reprocessed. After this, the orders are put onto conveyor belts which sort by
the destination, and the boxes are placed on trucks for shipment.
17
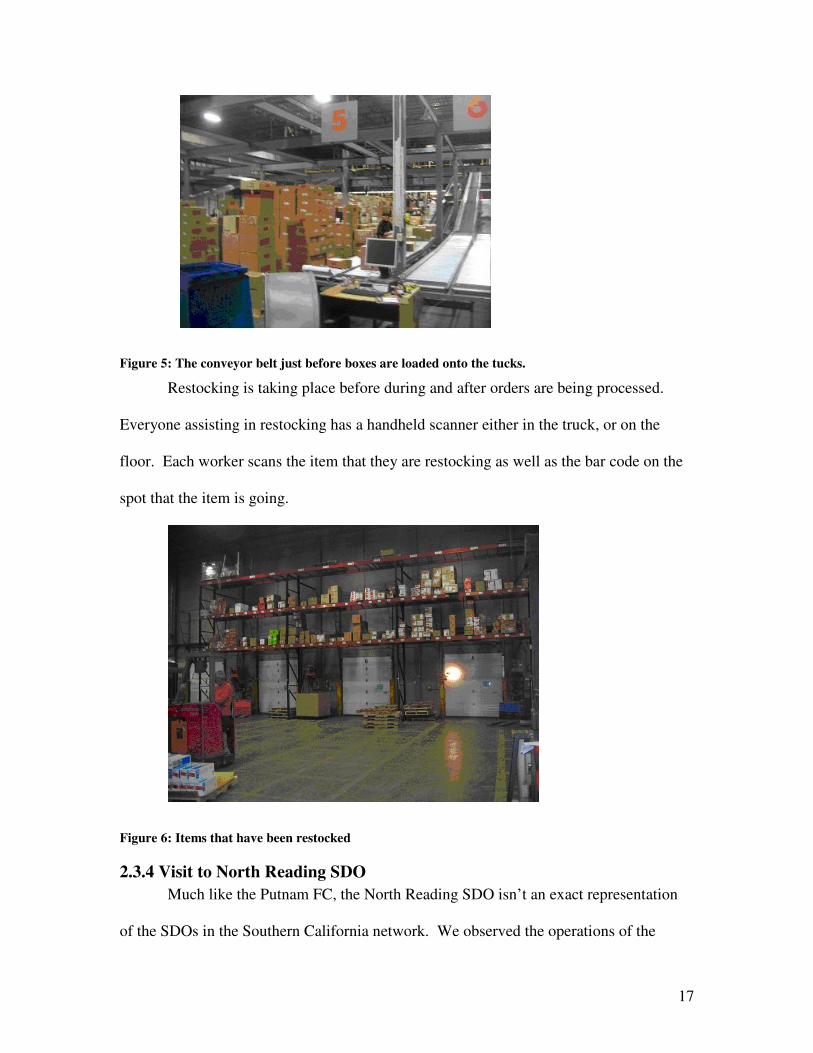
Figure 5: The conveyor belt just before boxes are loaded onto the tucks.
Restocking is taking place before during and after orders are being processed.
Everyone assisting in restocking has a handheld scanner either in the truck, or on the
floor. Each worker scans the item that they are restocking as well as the bar code on the
spot that the item is going.
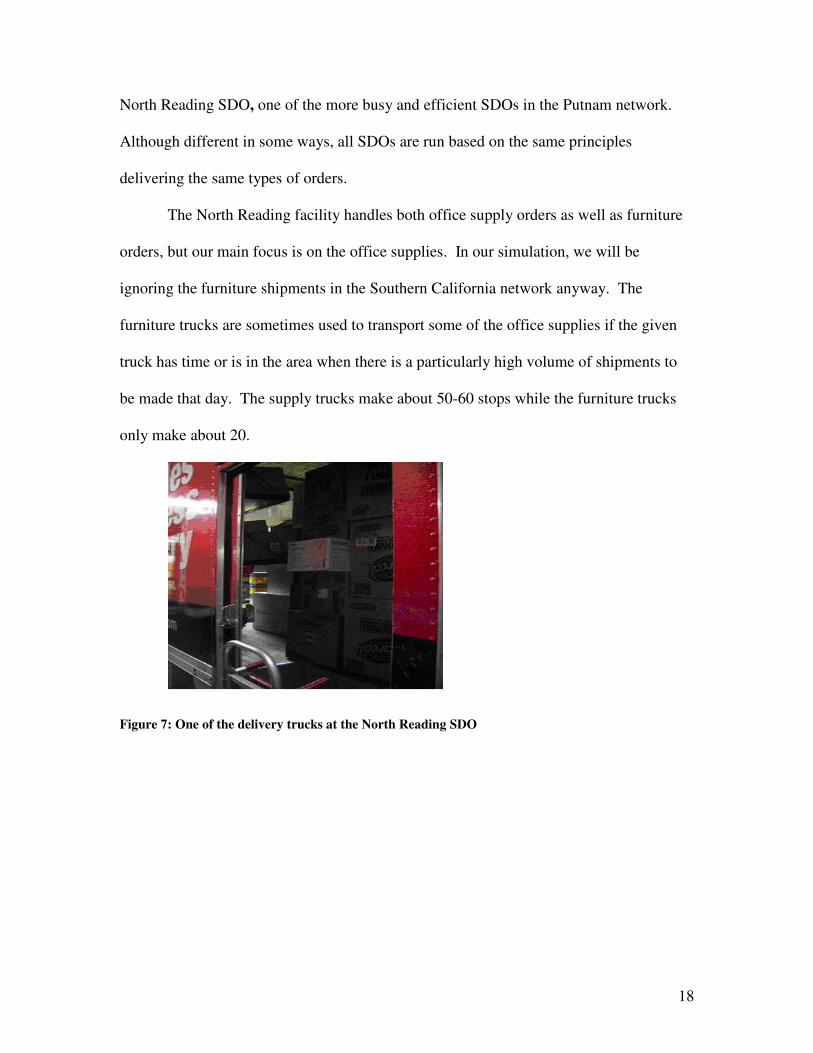
Figure 6: Items that have been restocked
2.3.4 Visit to North Reading SDO
Much like the Putnam FC, the North Reading SDO isn’t an exact representation
of the SDOs in the Southern California network. We observed the operations of the
18
North Reading SDO, one of the more busy and efficient SDOs in the Putnam network.
Although different in some ways, all SDOs are run based on the same principles
delivering the same types of orders.
The North Reading facility handles both office supply orders as well as furniture
orders, but our main focus is on the office supplies. In our simulation, we will be
ignoring the furniture shipments in the Southern California network anyway. The
furniture trucks are sometimes used to transport some of the office supplies if the given
truck has time or is in the area when there is a particularly high volume of shipments to
be made that day. The supply trucks make about 50-60 stops while the furniture trucks
only make about 20.
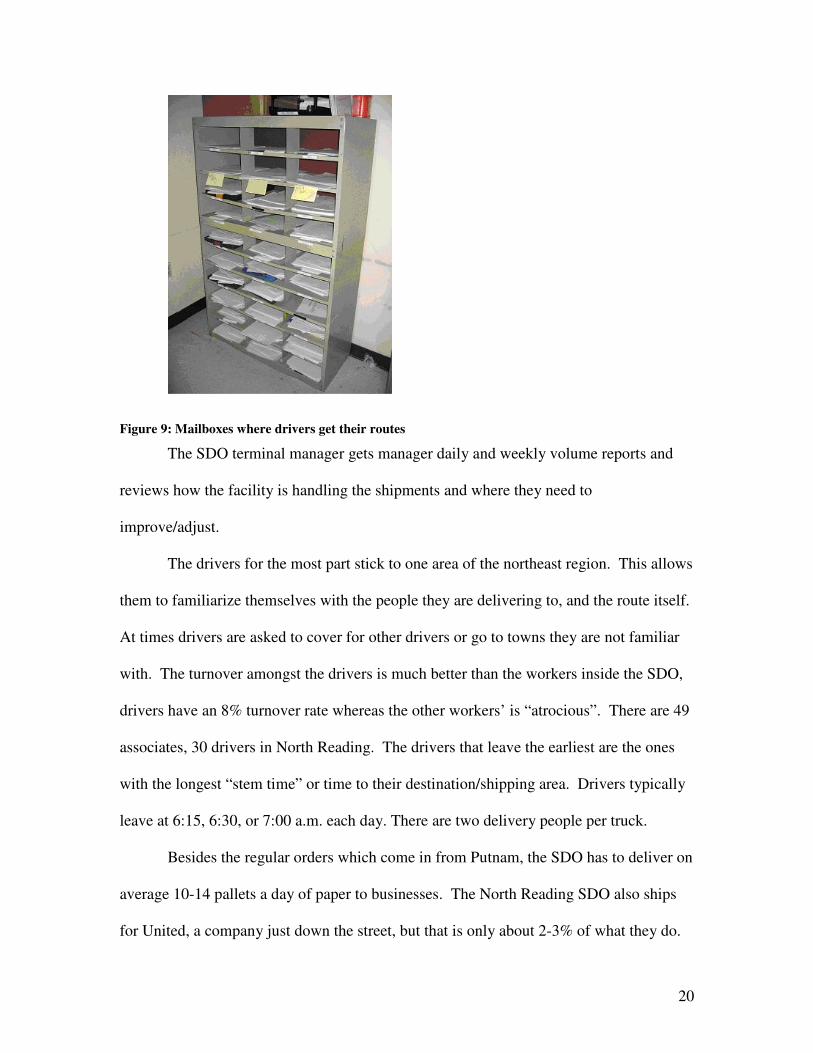
Figure 7: One of the delivery trucks at the North Reading SDO

19
Between 8:30 and 9:00 a.m. each day the SDO gets volume predictions for the upcoming
night. 60-70% of the boxes they get from Putnam are on a floor loaded trailer.
Previously everything was palletized; the new system allowed Staples to eliminate a line
haul to North Reading, which saves time and money. There are roughly 800 pieces on
each line haul, and each piece is scanned into the building, and then scanned again as it is
going onto its truck.
Figure 8: Workers processing boxes
There are 25 trucks available to be used at the facility. Each worker loading the delivery
trucks is responsible for 3-4 trucks. An entire Putnam delivery is processed in 45
minutes.
Route Optimization software is utilized after the orders are in to Putnam. Each
driver gets a route when they come in, and he/she then goes about planning out the order
of the stops they will make.
20
Figure 9: Mailboxes where drivers get their routes
The SDO terminal manager gets manager daily and weekly volume reports and
reviews how the facility is handling the shipments and where they need to
improve/adjust.
The drivers for the most part stick to one area of the northeast region. This allows
them to familiarize themselves with the people they are delivering to, and the route itself.
At times drivers are asked to cover for other drivers or go to towns they are not familiar
with. The turnover amongst the drivers is much better than the workers inside the SDO,
drivers have an 8% turnover rate whereas the other workers’ is “atrocious”. There are 49
associates, 30 drivers in North Reading. The drivers that leave the earliest are the ones
with the longest “stem time” or time to their destination/shipping area. Drivers typically
leave at 6:15, 6:30, or 7:00 a.m. each day. There are two delivery people per truck.
Besides the regular orders which come in from Putnam, the SDO has to deliver on
average 10-14 pallets a day of paper to businesses. The North Reading SDO also ships
for United, a company just down the street, but that is only about 2-3% of what they do.
21
There is a storage area where they keep some orders for customers if the customer
decides that they don’t want their order right away.
Another service the SDO performs is repackaging some of the products that show
up in damaged boxes. Especially with the floor loaded line hauls, the bottom row of
boxes gets damaged quite a bit. It “happens all the time” according to Bill Dunn. The
drivers don’t want to deliver anything that is damaged because many of the customers
they are delivering to are regulars. So the associates will repackage the orders at the
SDO.
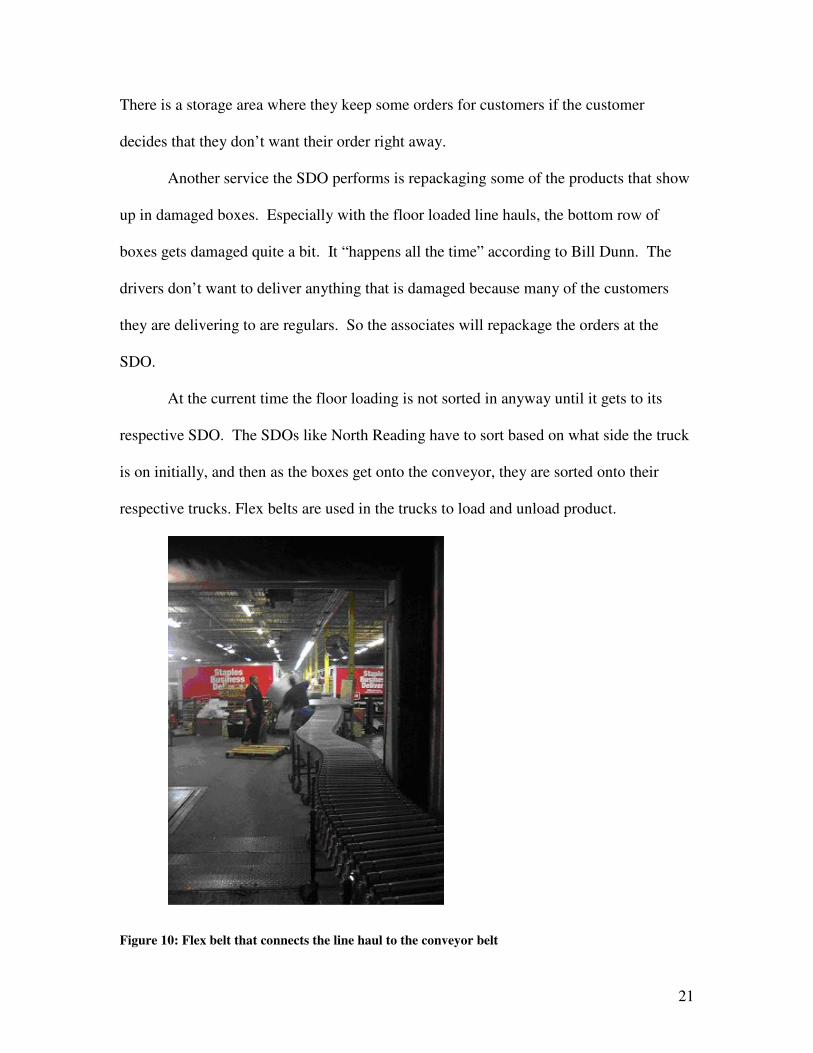
At the current time the floor loading is not sorted in anyway until it gets to its
respective SDO. The SDOs like North Reading have to sort based on what side the truck
is on initially, and then as the boxes get onto the conveyor, they are sorted onto their
respective trucks. Flex belts are used in the trucks to load and unload product.
Figure 10: Flex belt that connects the line haul to the conveyor belt
22
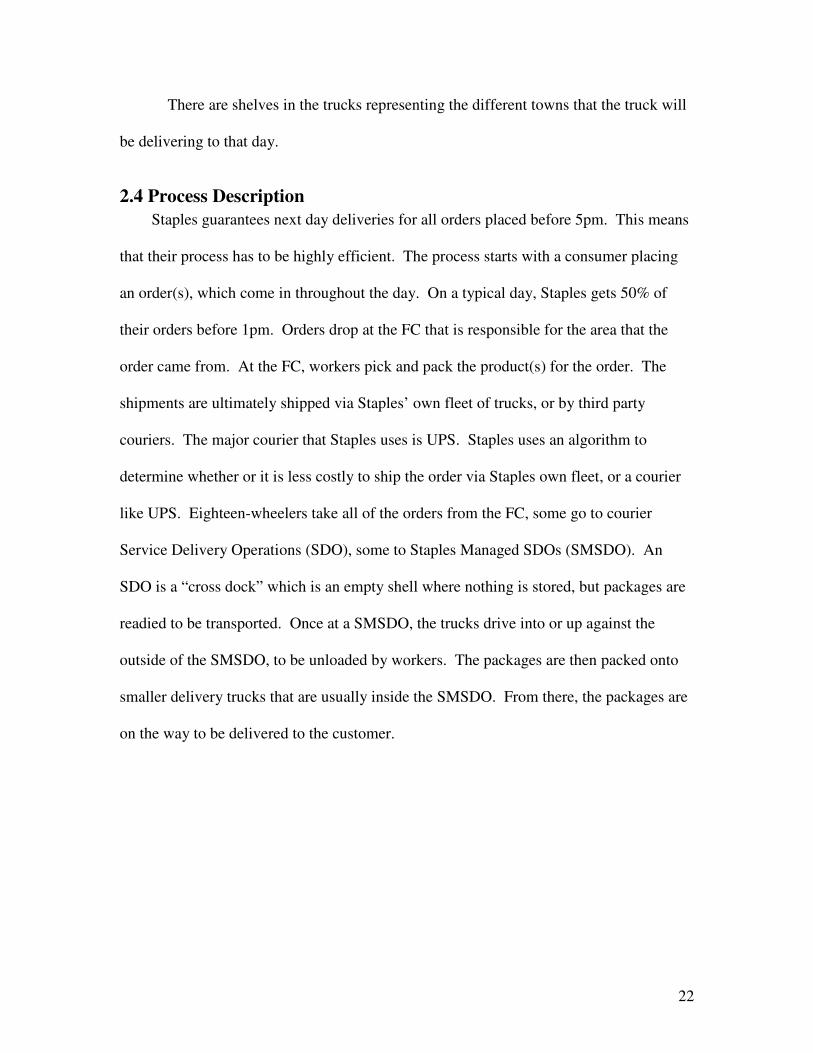
There are shelves in the trucks representing the different towns that the truck will
be delivering to that day.
2.4 Process Description
Staples guarantees next day deliveries for all orders placed before 5pm. This means
that their process has to be highly efficient. The process starts with a consumer placing
an order(s), which come in throughout the day. On a typical day, Staples gets 50% of
their orders before 1pm. Orders drop at the FC that is responsible for the area that the
order came from. At the FC, workers pick and pack the product(s) for the order. The
shipments are ultimately shipped via Staples’ own fleet of trucks, or by third party
couriers. The major courier that Staples uses is UPS. Staples uses an algorithm to
determine whether or it is less costly to ship the order via Staples own fleet, or a courier
like UPS. Eighteen-wheelers take all of the orders from the FC, some go to courier
Service Delivery Operations (SDO), some to Staples Managed SDOs (SMSDO). An
SDO is a “cross dock” which is an empty shell where nothing is stored, but packages are
readied to be transported. Once at a SMSDO, the trucks drive into or up against the
outside of the SMSDO, to be unloaded by workers. The packages are then packed onto
smaller delivery trucks that are usually inside the SMSDO. From there, the packages are
on the way to be delivered to the customer.
23
Figure 11: SDO Diagram
The shipment times are what drive everything in the FC, and the couriers become a
priority in the afternoon into the evening because they are the first shipments to leave the
FC. The departure times (cut times) of the eighteen-wheelers depends on several time
constraints, the amount of time it takes to:
� get to the assigned SMSDO
� unload the eighteen wheelers
� load the smaller delivery trucks
� the amount of time it takes the delivery trucks to get to their assigned
neighborhoods
� the amount of time it takes for the delivery trucks to complete their routes so that
the customers get their orders the next day
Example:
24
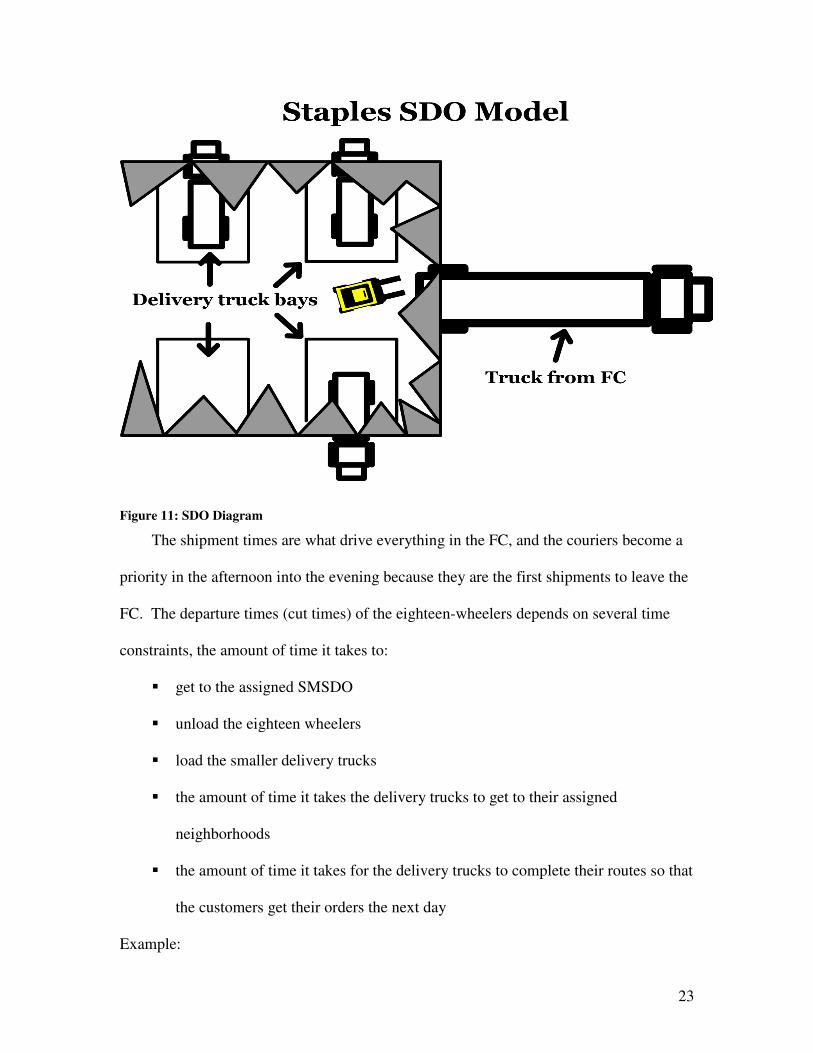
Below is an example of the factors affecting the cut times. If trucks have to leave
an SDO by 7:30am, an SDO takes 2 hours to unload a tractor trailer, and it takes 2 hours
to get from FC to SDO, then that tractor trailer needs to leave an FC by 3:30am.
Figure 12: Outbound process map.
If a package fails to get into the tractor trailer by the cut time, then it is considered
a “leave behind”, and Staples must call that customer and notify them that their package
will not be there the next day (Callery, 04OCT06).
When cut time is approaching for example for UPS shipments workers focus on
picking the UPS packages and putting them in the appropriate truck. In other words UPS
becomes the top priority when its cut time approaches (Plourde, 29AUG06).
There are many different configurations of SMSDOs. Some have conveyor
systems inside so packages can be moved mechanically and put on the appropriate truck.
There are also a varying number of docks to which eighteen-wheelers can drive up to.
Some SMSDO have the delivery trucks inside, some have them outside.
25
3 Literature Review
3.1 Staples Supply Chain
Staples has many vendors that supply them with their products, a list too long to
mention. Since Staples is all over the country, they have contracts with different vendors
in different regions to cut down on shipping costs. This also allows them to be able to
order items and get them in a shorter amount of time than if the supplier was in a
differnet part of the country (ContactCenterWorld, 2005).
Staples customer base is highly segemented and spread. “Staples has an
extremely diverse customer base,” says Devon Whitney-Deal, customer service
development manager at Staples. “The Staples customer service group receives several
thousand inquiries each month. The customer feedback includes questions about products
and services, suggestions, compliments, complaints, and other inquiries”
(ContactCenterWorld, 2005). The company keeps track of their huge and diverse
customner base by utilizing a tool called KANA, a software tool that manages the
information as well as feedback of their customers. Staples customers range from
massive coorporations to individuals looking for small amounts of office supplies. Every
ethinicity, and income level buys from Staples, since it is affordable, and everyone needs
office supplies to conduct business (ContactCenterWorld, 2005)
Staples also employs CommerceHub, which is a “leading supplier of supply chain
integration management solutions for multi-channel retailers” (CommerceHub, 2003).
CommerceHub is a universal connection platform that helps Staples integrate its
suppliers in an efficient manner, reduce its inventory costs, and therefore enhance its
customer service.
26
One can imagine that if a company has many different suppliers, ordering
appropriately can get very challenging, but with the help of CommerceHub, Staples adds
new suppliers and interacts with its past partners effectively. "To meet our stringent
inventory cost reduction goals and customer service requirements, we thoroughly
reviewed several top supplier integration and order management vendors," said William
Golden, Vice President Wholesale Merchandising at Staples, Inc. "CommerceHub clearly
has the technology and team to help us achieve our objectives with our drop-ship
suppliers, and we're very pleased to partner with them" (CommerceHub, 2003). “This
new partnership also validates the industry's trend towards virtually owned inventory"
adds Frank Poore, CEO of CommerceHub.
Staples, like many of today’s companies realize that any inventory that is being
stored in warehouse is not being moved, which means it is costing the company money.
Thus Staples tries to have as little inventory as possible. Staples supply chain works in
unison with the orders they get for their products. As the orders come in, Staples stays
ahead by ordering their own products from their suppliers so that they will have enough
to fill their customers orders. CommerceHub expedites this process so that it is as
efficient as possible with applications that simplify order management and provide real-
time visibility and control over transactions, so Staples can improve their fulfillment
center performance, while reducing costs (CommerceHub, 2003).
3.2 A Description of Logistics and its Significance
The characteristics of a company’s logistical network are very different now than
they were in the past. When discussing logistics, one can break it up into the three
27
general categories of warehousing, materials handling, and packaging. Nowhere are the
differences more apparent than in that of the warehouse operations. The role of the
warehouse used to be as a holding area for goods. Now warehouses hold products for the
least amount of time possible. Companies try to stay ahead of their supply schedule,
while keeping minimal amounts of products for an extended period of time. Holding
goods stops the flow of goods, which costs money (Coyle, 2003).
Warehouses are very important for companies. They have many different
functions that are essential to running a smooth operation. There strategic locations allow
for full truckloads of supplies to be sent reasonably short distances rather than having less
than full truck loads to be sent long distances (which is obviously very inefficient).
Warehouses also centralize goods, which allow firms to have their varying product parts
(product mixing) to be on hand in one place rather than having to fill orders from many
different places. Cross-docking is something that Staples utilizes in their SDOS that
facilitates product mixing. Products are brought to the building by trucks, and then
instead of being put into storage, they are placed on appropriate trucks. Warehouses also
prevent orders from not being filled by having inventory on hand and smooth in case of
transportation delays, strikes, etc (Coyle, 2003).
The basic warehouse and material handling operations are receiving, put-away,
order-picking, shipping, and storage. Receiving involves an inbound carrier that is
supposed to arrive at a pre-determined time and drops the products off on the dock. The
put-away is the process of taking the items and moving them into the storage area.
Order-picking is the process of workers taking out the products ordered and placing them
into a carrying container. Shipping is the last process in which the items are moving.
28
The items are moved from the staging area to the loading dock into a truck for shipment.
The other warehouse operation is storage, where additional inventory is stored in a
specified area of the building (Coyle, 2003).
The role of packaging is very significant as well in the logistics network.
Packaging allows the handlers to identify what the product is inside, and where it is
supposed to go. Packaging is also supposed to allow for safe handling. There are several
other factors that a company has to take into account when deciding on packaging types.
They obviously want a package to be efficiently handled, which means having an
appropriate size, shape and weight. They want the package to be customer friendly, so
the package should be integrated with the customer’s material handling equipment
(Coyle, 2003).
Overall, the logistics network is a very important function of the company
because without it the company wouldn’t b able to move its goods.
3.3 Characteristics of other Companies’ Distribution Processes
As mentioned earlier, Staples SDOs aren’t always equipped with conveyor
systems, which can be very beneficial for the company utilizing them, as Avon Product’s
Inc. found out. Avon ships a plethora of cosmetics, and had been using the same
shipping dock conveyor system for 25 years. The system had trouble with large amounts
of product, and could simply not handle some of the newer packaging mixes. An
upgrade to the system was an obvious need.
Management’s goals in installing a new conveyor system were to upgrade the
technology so that it could handle new packaging mixes, reduce labor costs, and raise its
29
throughput from the current level of 55 packages per minute. Avon used the services of
its long time partner, Tech Conveyor, who were briefed on Avon’s goals, and its
environment. Avon experienced much higher sales during the fourth quarter than any
other quarter so it needed to be especially efficient and not slow down during this time of
year.
The implementation began in earnest soon after Avon approached Tech
Conveyor. Tech put in ArmorStart motor controllers, which can be placed on the
machine it controls; this minimizes space requirements. The new system also included a
DeviceNet network that allows for communication between the workers manning the
controls. Tech Conveyor ended up installing 5,100 feet of new conveyor lines (MHM,
2006).
The results of the new conveyor system were better than Avon could have hoped.
They increased their throughput to 120 packages a minute (from 55), and reduced the
amount of space taken up by the equipment by 60%. These improvements resulted in
fewer workers having to work overtime, a more flexible workplace, and as a result, the
bottom line was helped. The material handling system at Avon is now much more
flexible, efficient, and productive. Avon was so happy with the results, they plan to
install new conveyor systems in their distribution facilities (MHM 2006).
Currently, Staples does not do a lot of sorting within their fulfillment centers.
They sort based on what truck each order should go on, but they don’t place those
packages in any particular order inside the trucks.
A sporting goods company called Sport Chalet used a similar amount of sorting
until recently. The sorting and picking processes of a company determine how fast it is
30
able to get products onto its stores’ shelves. Sport Chalet’s picking and sorting processes
were lacking. "We used to send all footwear— men's, women's and kid's—all together
on a pallet. It was a big hassle at the store level because a lot of it would go to the back
room," recalled Steve Belardi, Vice President of logistics. “They were touching every
carton. It was crazy." (MHM, 2006)
Sport Chalet has more than 40 stored located mostly in California, they are
growing quickly, announcing planes to open 4-8 more stores within the next year. With
$350 million in sales, a figure which has grown by about 10% each year, Sport Chalet
had to do something with their distribution to accommodate the growth. They decided to
centralize several distribution facilities into one, huge 325,000 square foot distribution
center in Ontario, California.
In addition to centralizing its operations, Sport Chalet overhauled its picking and
sorting practices. There goal was to have product shipped and packaged by the
department in the retail store that they would be sold, so that products were ready to be
placed on the shelf once they got to the store. They instructed their 110 permanent
employees and over 60 temps at the distribution center to follow the new set of practices,
which are:
� Computer system at the beginning of the day prioritizes orders for the stores
being picked that day based on truck departure times.
� Items are separated by the department in the store that they will be in
� Workers go around with specially designed carts, six sections, each representing a
different store
31
� The workers follow the info on the “RF” guns which scan boxes and give
information on the destination of the box and the products that it should have in it.
� When a box is full, it is sent down the conveyor, and another box is picked up and
filled with the appropriate products. (MHM, 2006)
The process is called continuous batch picking, and has resulted in higher efficiency, in
fact a 12-13% improvement. "We're very efficient at picking because we're not wasting
much motion. Once we go through the pick path, we're basically picking everything that's
needed for those six stores," says Belardi. "In the old world we had to do six walks up
and down the aisle." (MHM, 2006)
3.4 Process Improvement
Process Improvement is the goal of this project as well as the goal of many
objectives run by companies throughout the world every day.
“In today's global business environment, being efficient and providing quality
products and services are vital to staying competitive. Companies must eliminate
inefficiencies, monitor productivity, and continually improve their operational
performance in order to keep pace” (Hedrick, 2007). There are four components to
operational improvement: optimized processes, labor standards, training, and productivity
tracking software.
Over time, processes tend to grow and those running them don’t change them
because they worked fine before the increased production, why change? Bottlenecks and
delays result from this lack of change, which slows workflow and process times and
drives up costs. Companies don’t achieve optimal productivity levels and have higher
operating cost for that reason.
32
Optimized processes help companies:
• Reduce costs
• Eliminate non-value-added steps
• Raise quality
• Improve workflow
• Increase productivity (Hedrick, 2007)
Setting good and fair labor standards is the next step in process improvement.
Engineered labor standards are a scientific method of providing fair and reasonable
productivity quotas. Creating these standards encompasses measuring different work
functions and using workload information to determine reasonable completion times.
When developed properly, labor standards provide:
• Quantifiable productivity measurement
• Unbiased quotas
• Foundation for effective incentive program (Hedrick, 2007)
To determine and implement labor standards, time studies need to be conducted
with operators that perform their jobs every day. Gained form this are precise time
standards for completing tasks. “Labor standards help companies to measure all workers
on an equal footing and provide management with the means for effective performance
measurement, feedback, and incentives programs” (Hedrick, 2007).
It is important for companies to provide associates with adequate training to
achieve the productivity standards by which they are measured. Proper training helps
33
employees to achieve their productivity quota and provides them with the ability to
sustain the desired level of productivity over time. Training also provides companies
with:
• Quality and productivity improvement
• Consistent results
• Ability to sustain performance (Hedrick, 2007)
Productivity tracking software is used by almost every major manufacturing
company in the United States (including Staples). Now, more than ever, companies are
looking for ways to do more with less. “Effective measurement and reporting are
essential components of any productivity improvement initiative and are the foundation
for effective accountability and incentives programs” (Hedrick, 2007). Many tracking
software packages, allow users to track performance for areas such as productivity,
quality, training, safety, and attendance. Some of the benefits of using productivity
tracking software is:
• Cost reduction
• Time savings
• Performance visibility for multiple facilities and departments
• Quality improvement
• Improved labor scheduling
• Ability to use discipline, rewards and incentives programs (Hedrick, 2007)
34
These solutions deliver improved productivity and quality, reduced costs and increased
profits.
Designing new processes and altering the existing ones is part of today’s business
environment. Companies have to keep changing to stay competitive and to deliver on
their promises to their customers.
Process Improvement is usually applied bottom up: existing processes are
mapped and ways to eliminate waste, re-work, duplication, hand-off are developed from
that. Re-engineering is usually applied top down: setting ambitious processing targets in
support of new business models. The final management decision balances “risk against
deliverables all set within the context of business environmental imperatives”(
Checkland).
3.5 Simulation
“Simulation is a modeling and analysis technique used to evaluate and improve
dynamic systems of all types. It has grown from a relatively obscure technology used
only by a few specialists to a widely accepted tool used by decision makers at all levels in
an organization.” (Harrel, 2000)
Simulation can be an extremely valuable tool for large companies such as Staples,
depending on how effective the simulation is. Different simulation programs, models and
consultation firms offer a variety of services and a corresponding price tag. If you want to
model a process that’s happening inside a manufacturing plant, an AutoCAD plug-in
such as FactoryCAD could do the job adequately. (UGS, 2006) If you want to model the
effect of implementing a new transportation network on a company that operates on a
35
global scale, you would have to invest more time and money for an accurate simulation
(Progress Group, 2006). Choosing the right simulation means finding a service or
product that both meets your expectations for finding possible outcomes and saves you
money in the long run. There are a host of simulation programs and services available to
companies such as Staples, but for the task at hand, we are going to use a program called
Arena.
3.6 Arena
Arena was designed to model systems, which can encompass any group of actions
that are all somehow related to each another. A local supermarket could be its own
system or an entire airport could be a system, it all depends on how many details you
want to include. These systems can be represented in either physical or logical
(mathematical) models (Kelton, 2007).
A physical model is tangible, and somehow simulates the different processes
within a system. Physical models can range from scale models of facilities to simulated
cockpits which serve as flight simulators. A logical model on the other hand, can be a
computer simulation program that does the calculations with mathematical formulas.
Arena would fall into the latter category (Kelton, 2007). These types of programs operate
on a variety of rules, formulas and scenarios that a user can determine in order to achieve
the best simulation for the given system. According to Arena, there are three dimensions
by which simulations can be classified:
• Static vs. Dynamic – time does not play a factor in static, but does in
discrete models.
36
• Continuous vs. Discrete – the state of the system in a continuous system
can vary continuously over time, while a discrete model only has certain
points where changes can occur.
• Deterministic vs. Stochastic – a model with a strict set of inputs is
deterministic, while stochastic models at least have some inputs that are
completely randomized (Kelton, 2007).
Determining which simulation is needed can be determined by looking at the
system that’s being modeled. A system that involves the natural world would be
continuous due to all the random events taking place, while a system of a manmade
facility object such as a warehouse that operates on specific times (start of the work day,
scheduled machine maintenance, etc.) could be discrete (Kelton, 2007).
Arena is extremely flexible and allows for the above scenarios to be implemented
in a system. The program itself is hierarchical: you can do anything from code your own
formulas in C++ at the lowest level to utilize commonly used constructs and templates
for different types of companies at the highest level (Kelton, 2007).
4 Methodology A term:
• visited the Putnam FC and observed operations there while at the same time
hearing about what type of operation was going to be simulated
• reviewed past Staples MQPs paying special attention to the outbound network
• received the student version of Arena and began learning basic modeling
techniques and some of the nuisances of Arena so we would be as prepared as we
could be for modeling the actual process when the time came
37
• Gathered background information on staples, simulation, the ups “doghouse
model” and logistics
B term:
• continued working with student version of Arena while waiting for professional
version to arrive
• Visited the Putnam FC once again for a more focused tour of the outgoing
packages
• Also visited the North Reading SDO
• Gathered data of the Putnam network
• Project scope was changed to a different area of the country (southern California)
and topic (FC synchronization) rather than UPS doghouse model
• Gathered date for the Southern California network and began analyzing the data
sets to determine averages, distributions, or schedules
C Term:
• Continued gathering and analyzing data
• Researched process improvement
• Simulated the baseline model (see section 5 for description) as well as FC
synchronization
• Analyzed the simulation results
5 Simulation and Results
5.1 Baseline Model
A baseline model of the current process by which orders are created, assigned to
delivery routes, processed at the FC, line hauled to SDOs (Hubs), and sorted and loaded
38
by route onto delivery trucks was used to compare against a different scenario of FC
Synchronization (Eddy, 08DEC06).
For all of the inputs in the model, data was accessed and analyzed by the MQP group
or by Jim Callery and Victoria Eddy. Either a distribution, an average, or a schedule was
taken from the analysis and for the averages a standard normal distribution was assigned.
There are many inputs/simulation processes incorporated in the baseline model. They are
as follows:
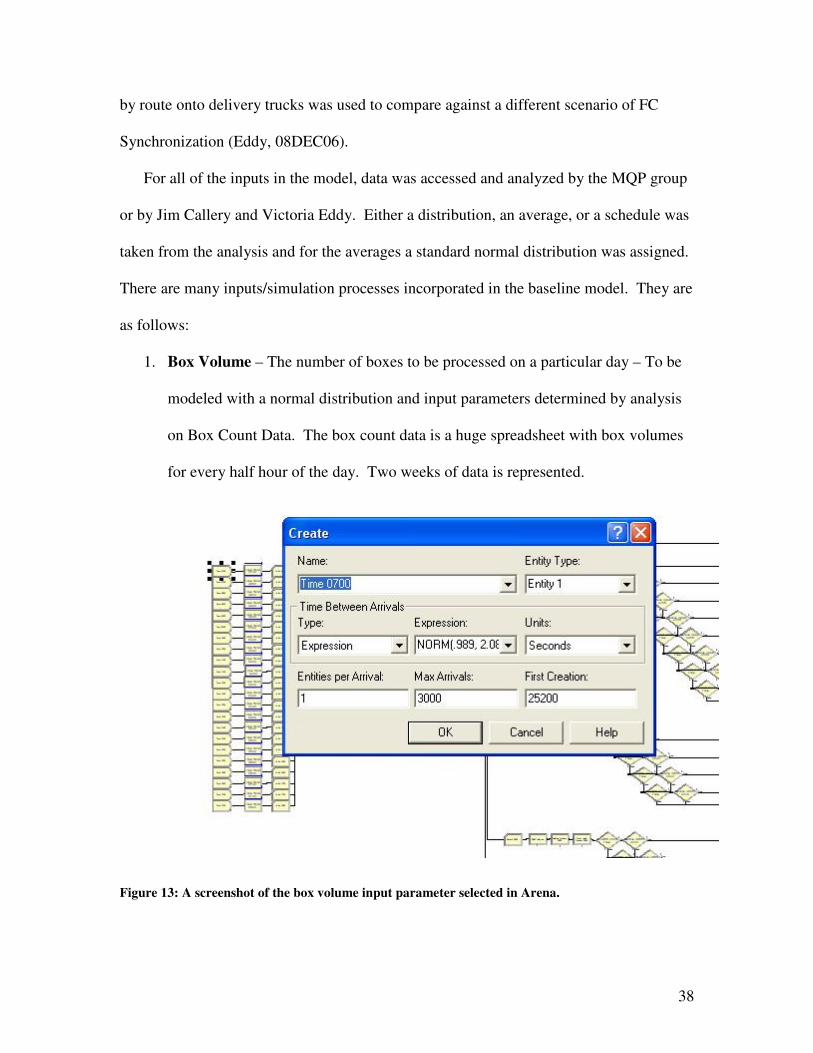
1. Box Volume – The number of boxes to be processed on a particular day – To be
modeled with a normal distribution and input parameters determined by analysis
on Box Count Data. The box count data is a huge spreadsheet with box volumes
for every half hour of the day. Two weeks of data is represented.
Figure 13: A screenshot of the box volume input parameter selected in Arena.
39
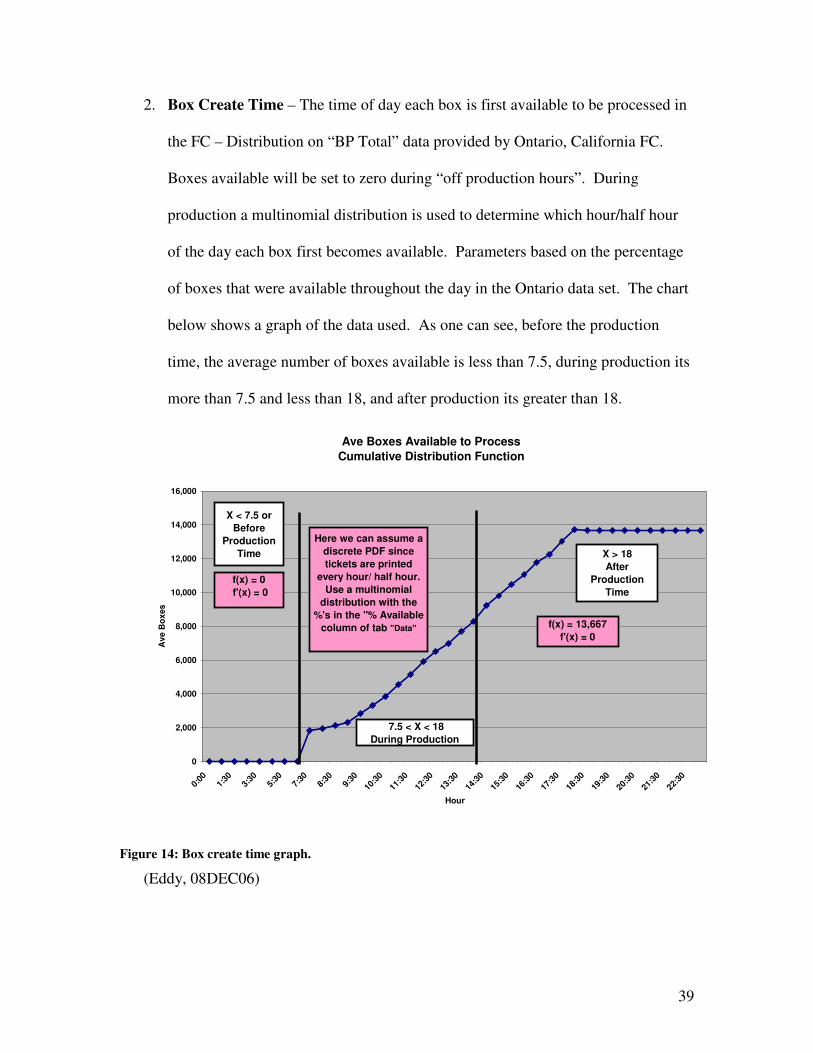
2. Box Create Time – The time of day each box is first available to be processed in
the FC – Distribution on “BP Total” data provided by Ontario, California FC.
Boxes available will be set to zero during “off production hours”. During
production a multinomial distribution is used to determine which hour/half hour
of the day each box first becomes available. Parameters based on the percentage
of boxes that were available throughout the day in the Ontario data set. The chart
below shows a graph of the data used. As one can see, before the production
time, the average number of boxes available is less than 7.5, during production its
more than 7.5 and less than 18, and after production its greater than 18.
Ave Boxes Available to Process
Cumulative Distribution Function
0
2,000
4,000
6,000
8,000
10,000
12,000
14,000
16,000
0:00
1:30
3:30
5:30
7:30
8:30
9:30
10:3
0
11:3
0
12:3
0
13:3
0
14:3
0
15:3
0
16:3
0
17:3
0
18:3
0
19:3
0
20:3
0
21:3
0
22:3
0
Hour
Ave B
ox
es
f(x) = 13,667
f'(x) = 0
X > 18
After
Production
Time
X < 7.5 or
Before
Production
Time
7.5 < X < 18
During Production
f(x) = 0
f'(x) = 0
Here we can assume a
discrete PDF since
tickets are printed
every hour/ half hour.
Use a multinomial
distribution with the
%'s in the "% Available
column of tab "Data"
Figure 14: Box create time graph.
(Eddy, 08DEC06)
40
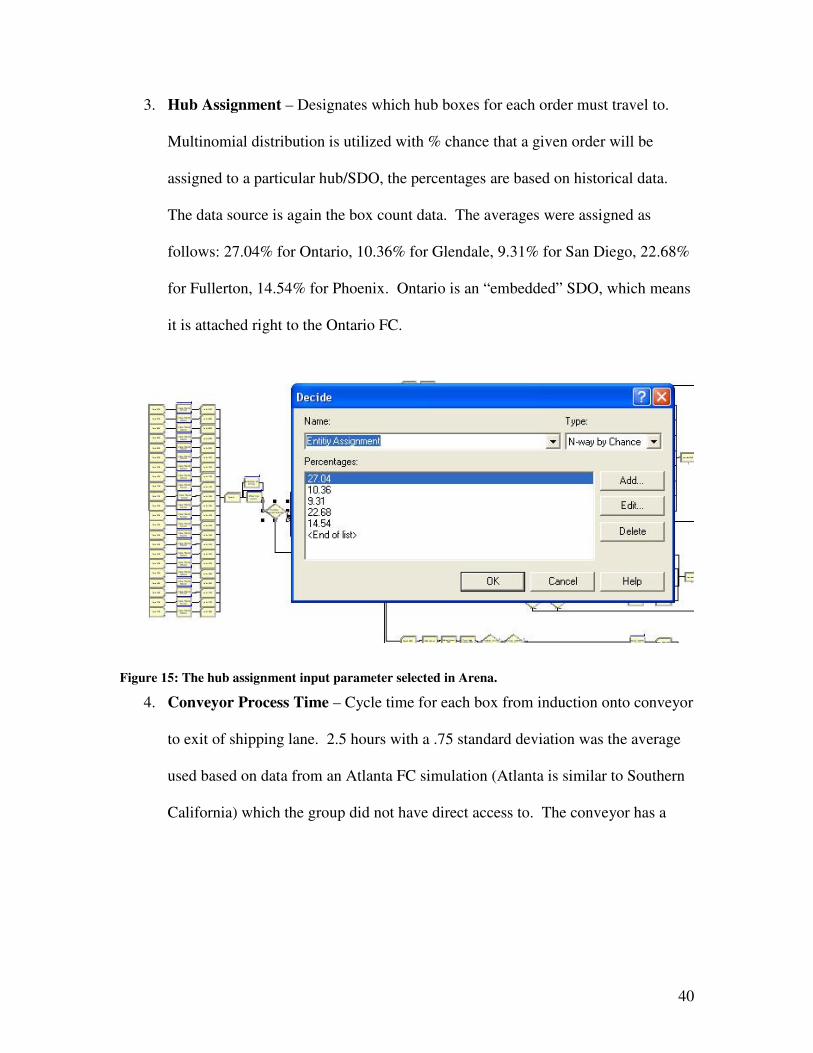
3. Hub Assignment – Designates which hub boxes for each order must travel to.
Multinomial distribution is utilized with % chance that a given order will be
assigned to a particular hub/SDO, the percentages are based on historical data.
The data source is again the box count data. The averages were assigned as
follows: 27.04% for Ontario, 10.36% for Glendale, 9.31% for San Diego, 22.68%
for Fullerton, 14.54% for Phoenix. Ontario is an “embedded” SDO, which means
it is attached right to the Ontario FC.
Figure 15: The hub assignment input parameter selected in Arena.
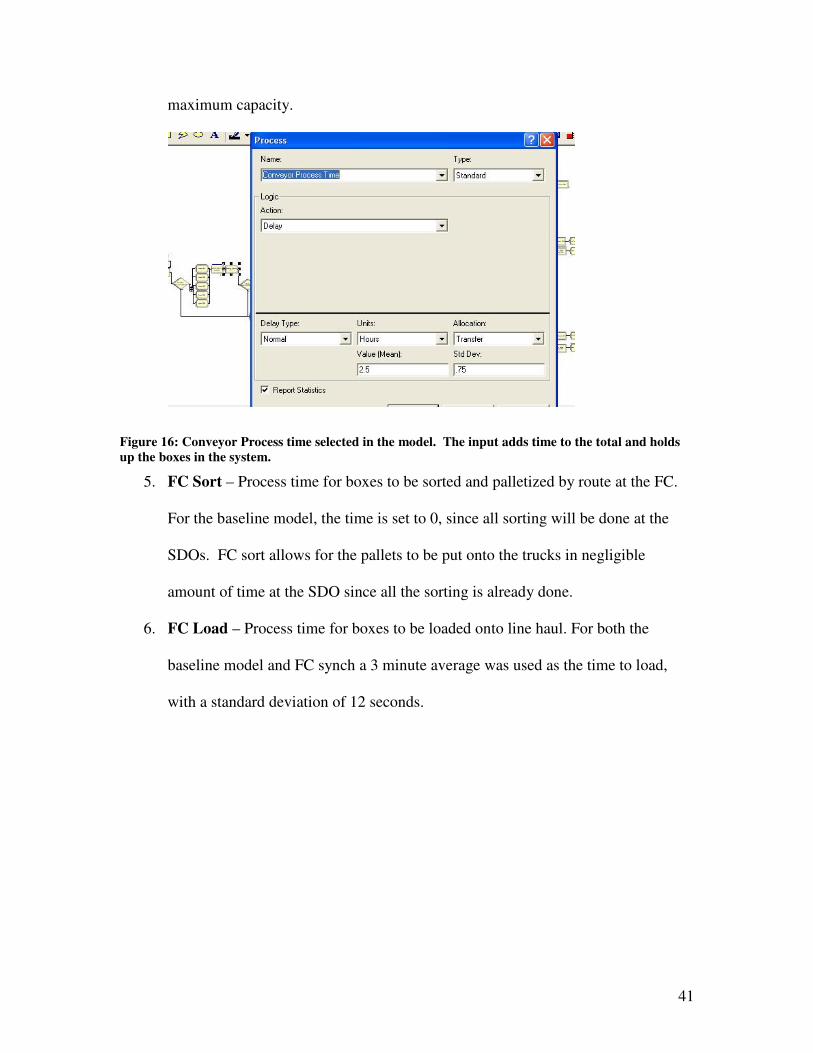
4. Conveyor Process Time – Cycle time for each box from induction onto conveyor
to exit of shipping lane. 2.5 hours with a .75 standard deviation was the average
used based on data from an Atlanta FC simulation (Atlanta is similar to Southern
California) which the group did not have direct access to. The conveyor has a
41
maximum capacity.
Figure 16: Conveyor Process time selected in the model. The input adds time to the total and holds
up the boxes in the system.
5. FC Sort – Process time for boxes to be sorted and palletized by route at the FC.
For the baseline model, the time is set to 0, since all sorting will be done at the
SDOs. FC sort allows for the pallets to be put onto the trucks in negligible
amount of time at the SDO since all the sorting is already done.
6. FC Load – Process time for boxes to be loaded onto line haul. For both the
baseline model and FC synch a 3 minute average was used as the time to load,
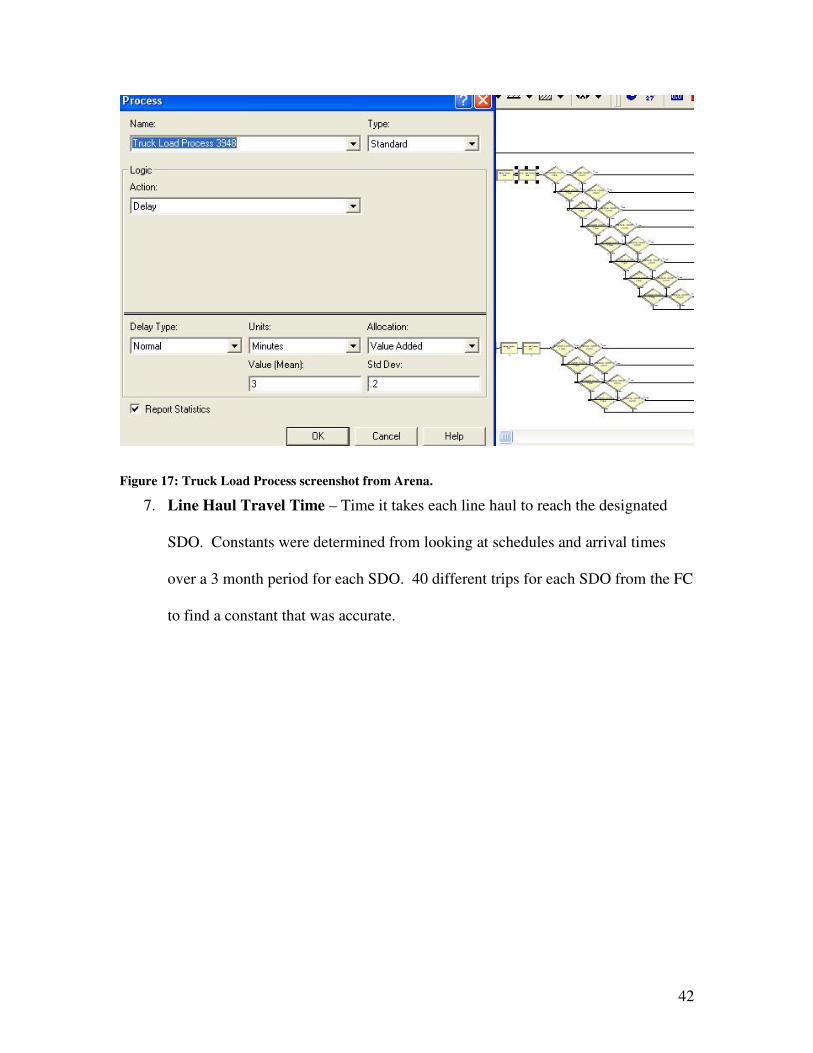
with a standard deviation of 12 seconds.
42
Figure 17: Truck Load Process screenshot from Arena.
7. Line Haul Travel Time – Time it takes each line haul to reach the designated
SDO. Constants were determined from looking at schedules and arrival times
over a 3 month period for each SDO. 40 different trips for each SDO from the FC
to find a constant that was accurate.
43
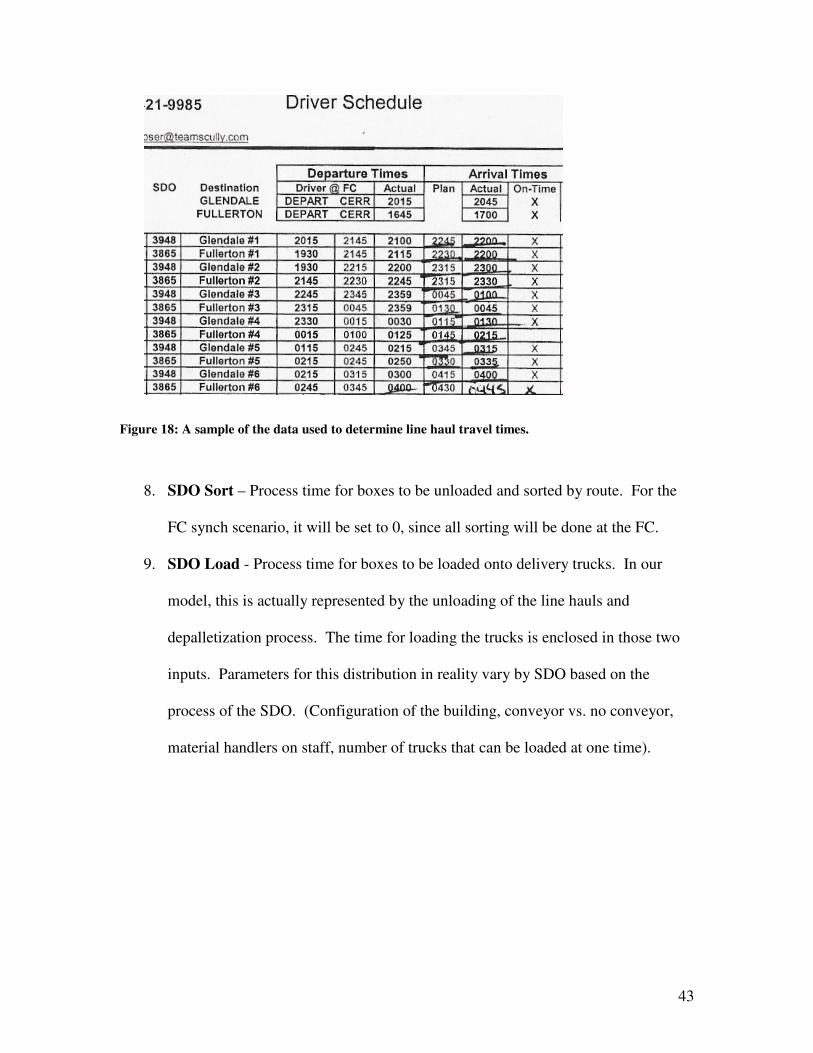
Figure 18: A sample of the data used to determine line haul travel times.
8. SDO Sort – Process time for boxes to be unloaded and sorted by route. For the
FC synch scenario, it will be set to 0, since all sorting will be done at the FC.
9. SDO Load - Process time for boxes to be loaded onto delivery trucks. In our
model, this is actually represented by the unloading of the line hauls and
depalletization process. The time for loading the trucks is enclosed in those two
inputs. Parameters for this distribution in reality vary by SDO based on the
process of the SDO. (Configuration of the building, conveyor vs. no conveyor,
material handlers on staff, number of trucks that can be loaded at one time).
44
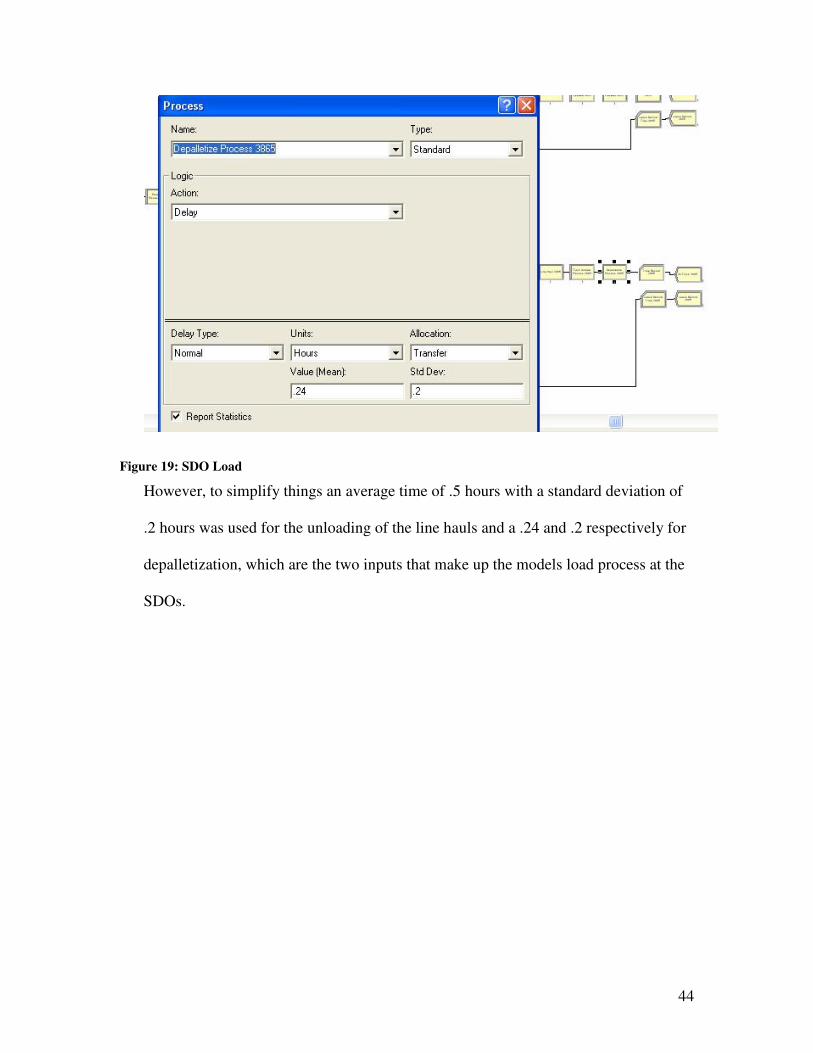
Figure 19: SDO Load
However, to simplify things an average time of .5 hours with a standard deviation of
.2 hours was used for the unloading of the line hauls and a .24 and .2 respectively for
depalletization, which are the two inputs that make up the models load process at the
SDOs.
45
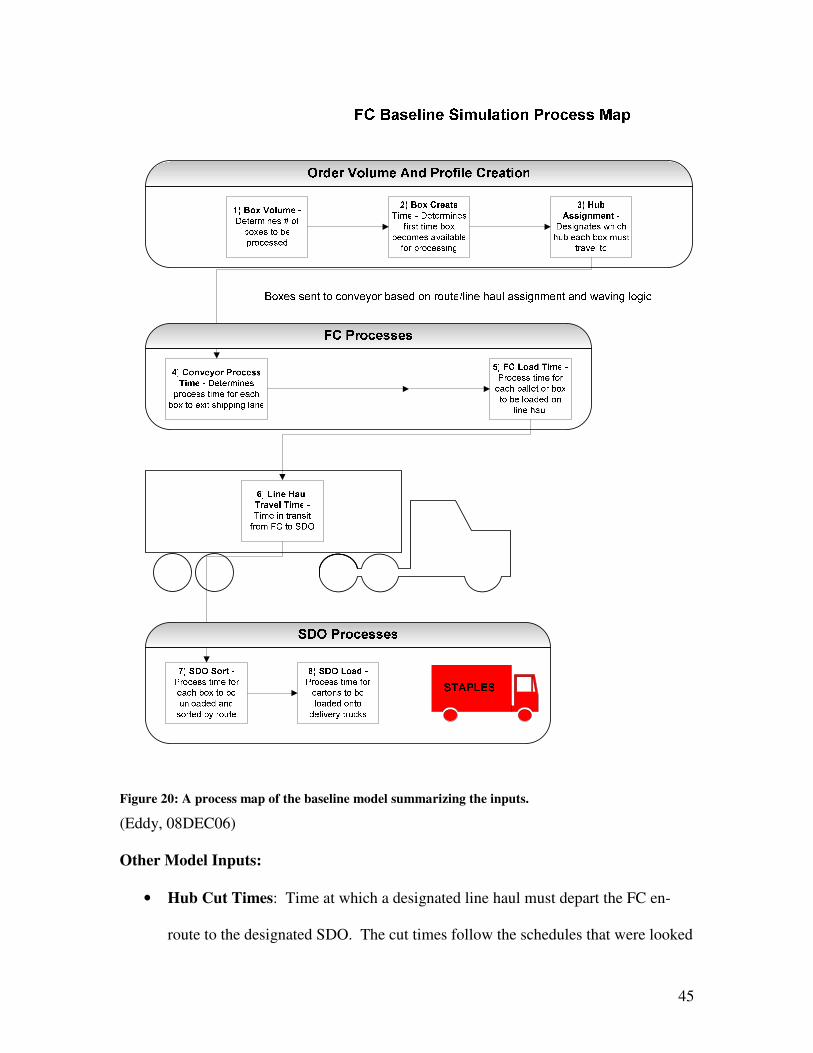
Figure 20: A process map of the baseline model summarizing the inputs.
(Eddy, 08DEC06)
Other Model Inputs:
• Hub Cut Times: Time at which a designated line haul must depart the FC en-
route to the designated SDO. The cut times follow the schedules that were looked
46
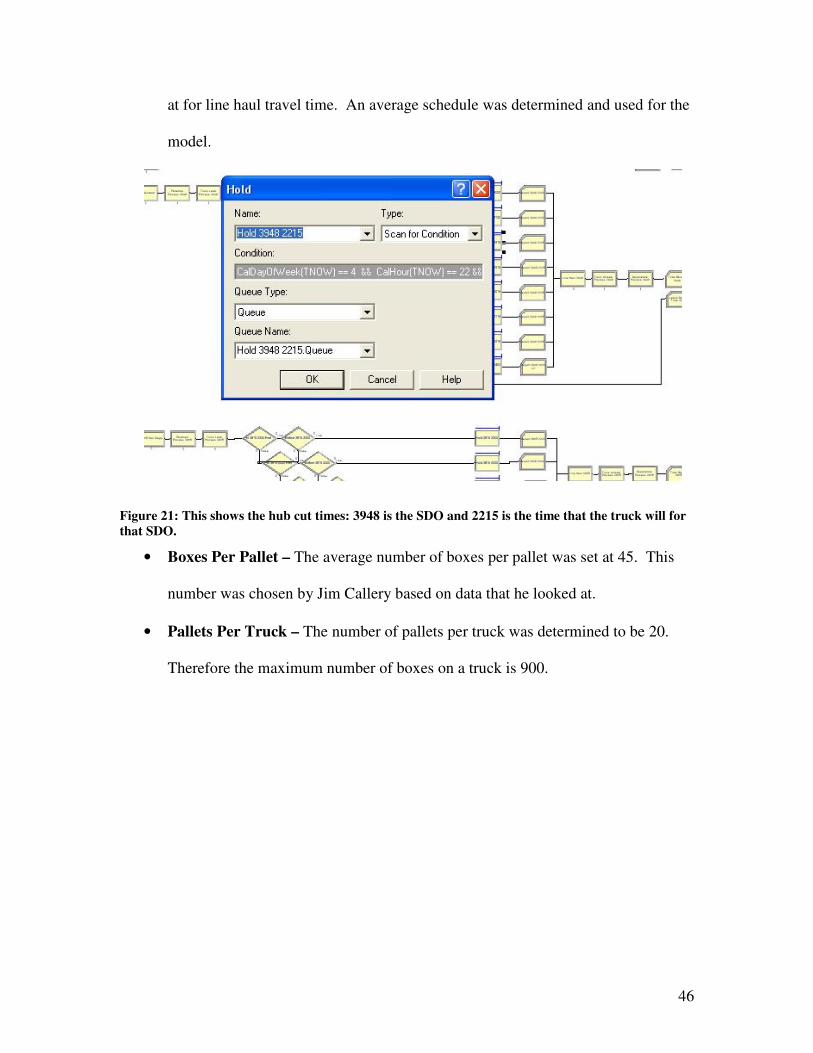
at for line haul travel time. An average schedule was determined and used for the
model.
Figure 21: This shows the hub cut times: 3948 is the SDO and 2215 is the time that the truck will for
that SDO.
• Boxes Per Pallet – The average number of boxes per pallet was set at 45. This
number was chosen by Jim Callery based on data that he looked at.
• Pallets Per Truck – The number of pallets per truck was determined to be 20.
Therefore the maximum number of boxes on a truck is 900.
47
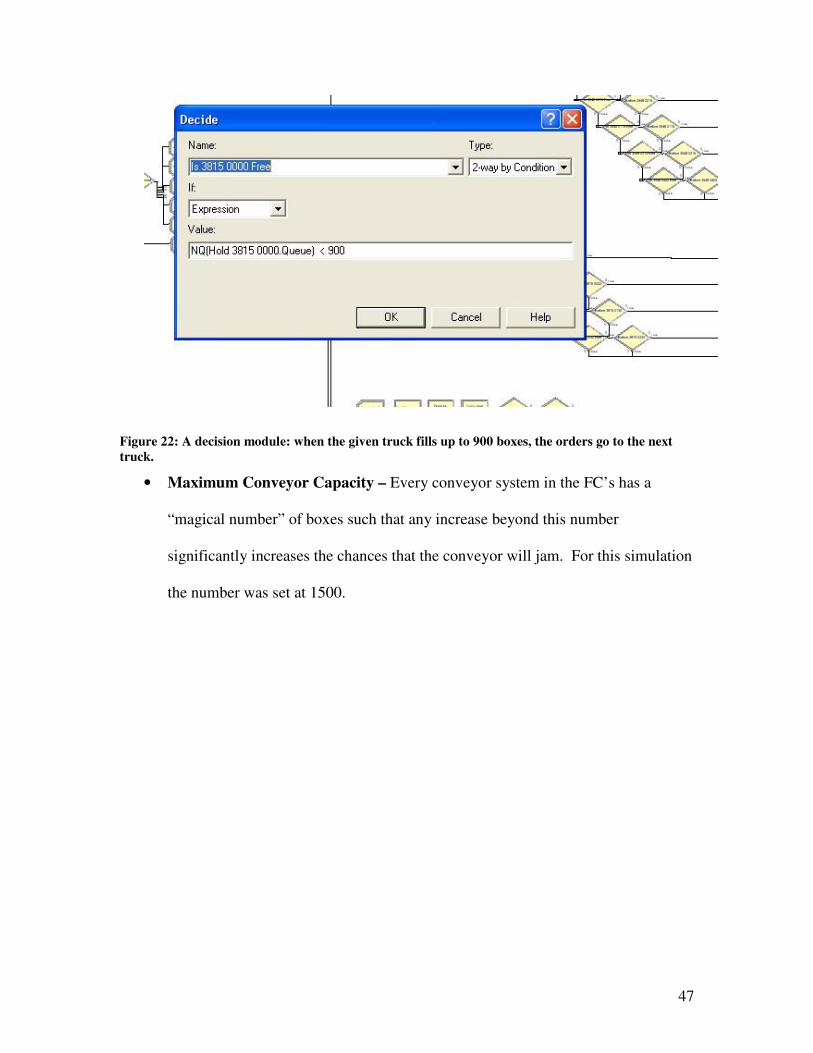
Figure 22: A decision module: when the given truck fills up to 900 boxes, the orders go to the next
truck.
• Maximum Conveyor Capacity – Every conveyor system in the FC’s has a
“magical number” of boxes such that any increase beyond this number
significantly increases the chances that the conveyor will jam. For this simulation
the number was set at 1500.
48
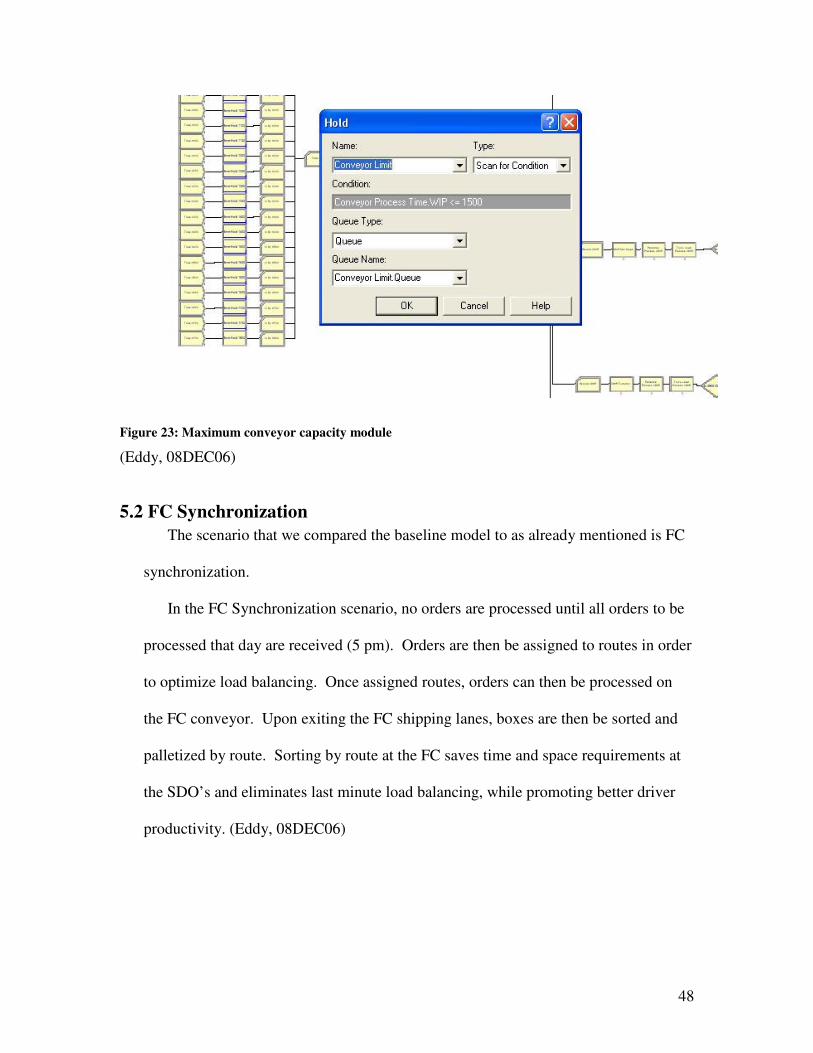
Figure 23: Maximum conveyor capacity module
(Eddy, 08DEC06)
5.2 FC Synchronization
The scenario that we compared the baseline model to as already mentioned is FC
synchronization.
In the FC Synchronization scenario, no orders are processed until all orders to be
processed that day are received (5 pm). Orders are then be assigned to routes in order
to optimize load balancing. Once assigned routes, orders can then be processed on
the FC conveyor. Upon exiting the FC shipping lanes, boxes are then be sorted and
palletized by route. Sorting by route at the FC saves time and space requirements at
the SDO’s and eliminates last minute load balancing, while promoting better driver
productivity. (Eddy, 08DEC06)
49
1) Box Volume -
Determines # of
orders to be
processed
2) Box Create
Time - Determines
first time box
becomes available
for processing
3) Hub
Assignment -
Designates which
hub each box must
travel to
4) Conveyor Process
Time - Determines
process time for each
box to exit shipping lane
5) FC Sort Time -
Process time for
each box to be
sorted and
palletized by route
6) FC Load Time -
Process time for
each pallet or box
to be loaded on
line haul
7) Line Haul
Travel Time -
Time in transit
from FC to SDO
8) SDO Load -
Process time for
cartons to be
loaded onto
delivery trucks
Order Volume And Profile Creation
STAPLES
FC Processes
SDO Processes
FC Synchronization Simulation Process Map
Boxes sent to conveyor based on route/line haul assignment and waving logic
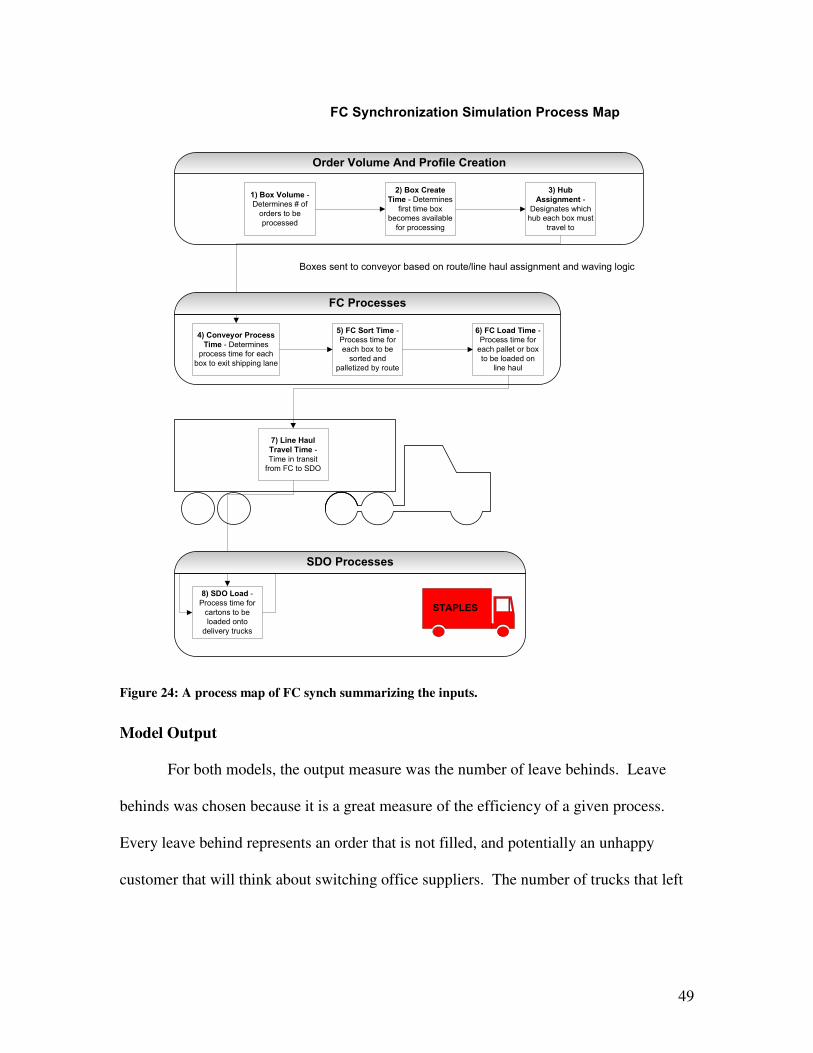
Figure 24: A process map of FC synch summarizing the inputs.
Model Output
For both models, the output measure was the number of leave behinds. Leave
behinds was chosen because it is a great measure of the efficiency of a given process.
Every leave behind represents an order that is not filled, and potentially an unhappy
customer that will think about switching office suppliers. The number of trucks that left
50
on time was considered, but in the end it was decided that all trucks would leave on time
with or without full capacity.
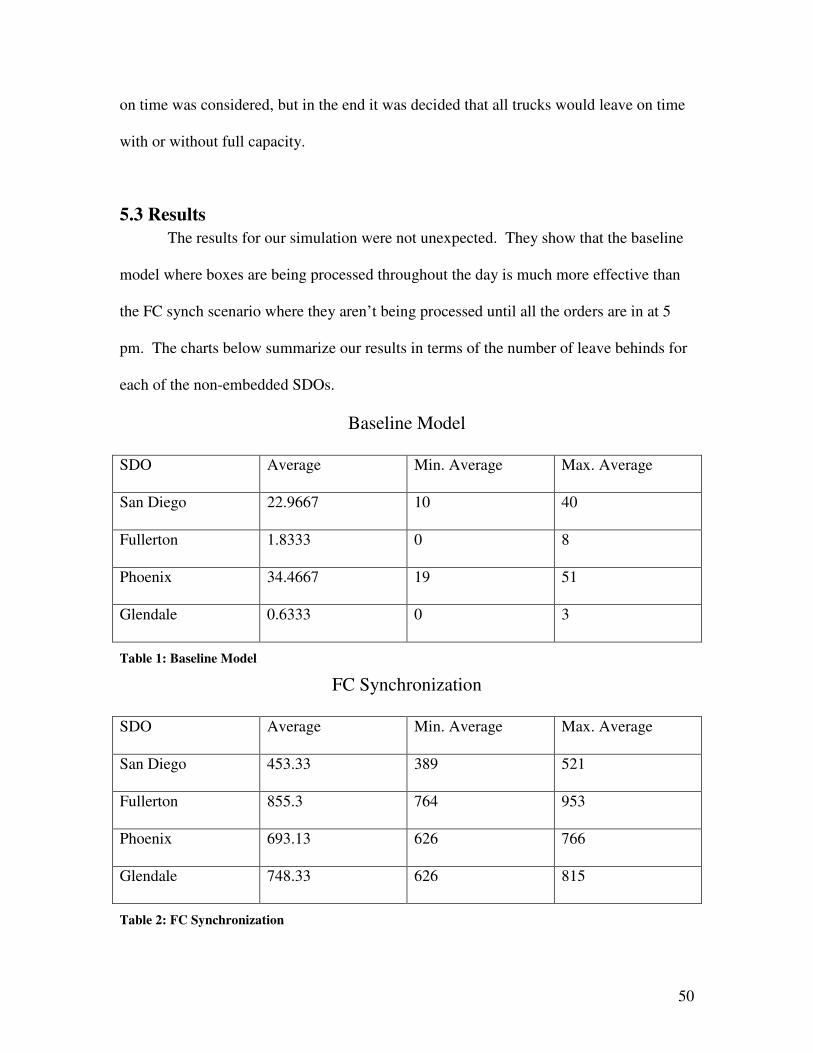
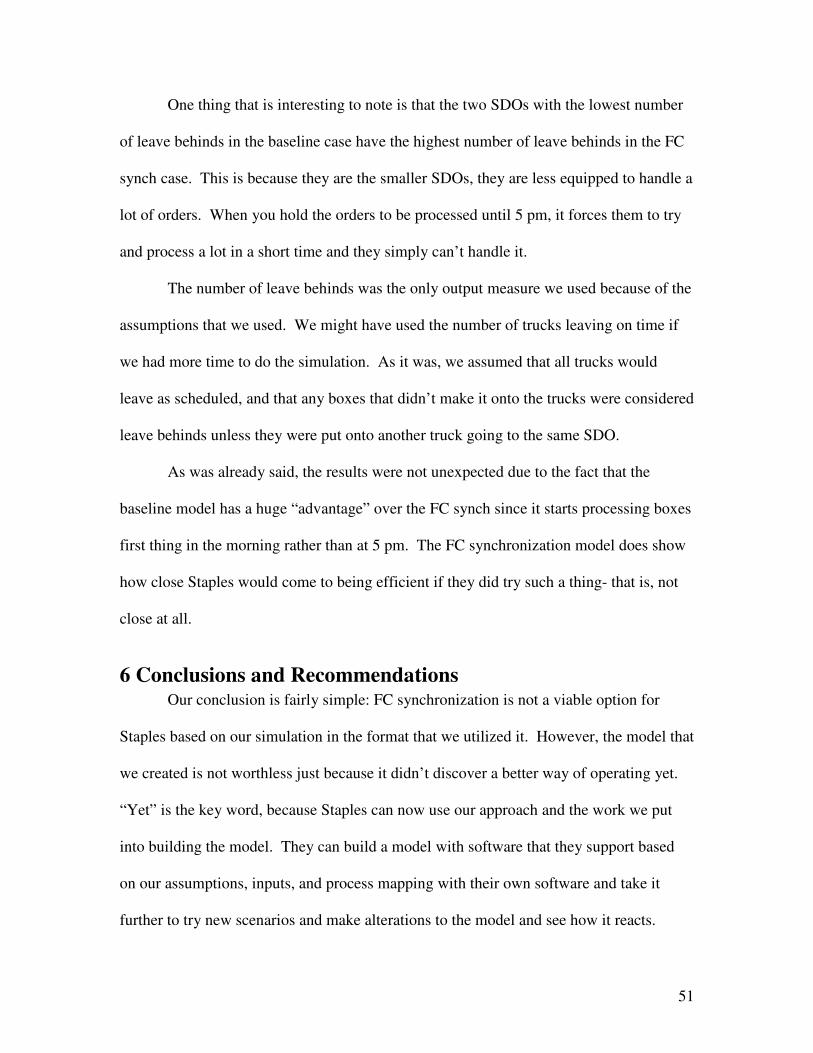
5.3 Results
The results for our simulation were not unexpected. They show that the baseline
model where boxes are being processed throughout the day is much more effective than
the FC synch scenario where they aren’t being processed until all the orders are in at 5
pm. The charts below summarize our results in terms of the number of leave behinds for
each of the non-embedded SDOs.
Baseline Model
SDO Average Min. Average Max. Average
San Diego 22.9667 10 40
Fullerton 1.8333 0 8
Phoenix 34.4667 19 51
Glendale 0.6333 0 3
Table 1: Baseline Model
FC Synchronization
SDO Average Min. Average Max. Average
San Diego 453.33 389 521
Fullerton 855.3 764 953
Phoenix 693.13 626 766
Glendale 748.33 626 815
Table 2: FC Synchronization
51
One thing that is interesting to note is that the two SDOs with the lowest number
of leave behinds in the baseline case have the highest number of leave behinds in the FC
synch case. This is because they are the smaller SDOs, they are less equipped to handle a
lot of orders. When you hold the orders to be processed until 5 pm, it forces them to try
and process a lot in a short time and they simply can’t handle it.
The number of leave behinds was the only output measure we used because of the
assumptions that we used. We might have used the number of trucks leaving on time if
we had more time to do the simulation. As it was, we assumed that all trucks would
leave as scheduled, and that any boxes that didn’t make it onto the trucks were considered
leave behinds unless they were put onto another truck going to the same SDO.
As was already said, the results were not unexpected due to the fact that the
baseline model has a huge “advantage” over the FC synch since it starts processing boxes
first thing in the morning rather than at 5 pm. The FC synchronization model does show
how close Staples would come to being efficient if they did try such a thing- that is, not
close at all.
6 Conclusions and Recommendations Our conclusion is fairly simple: FC synchronization is not a viable option for
Staples based on our simulation in the format that we utilized it. However, the model that
we created is not worthless just because it didn’t discover a better way of operating yet.
“Yet” is the key word, because Staples can now use our approach and the work we put
into building the model. They can build a model with software that they support based
on our assumptions, inputs, and process mapping with their own software and take it
further to try new scenarios and make alterations to the model and see how it reacts.
52
For example, the cut time for all orders could be moved up from 5 pm to 3 pm or
earlier to see if that will decrease the number of leave behinds. 5 pm is the current time
at which Staples guarantees next day delivery. Changing such a time would ultimately
change the demand curve for Staples, and could negatively impact their business. If a
person wants to make an order at 4pm and they can’t get it next day from Staples, but
they can get it from some other company, they could bring their business to that other
company. Therefore we suggest that Staples offer some sort of extra incentive to order
before the chosen cut off time, like a discount. The feasibility of this suggestion would
have to be tested, and surveys should also be taken to gauge the reaction that such a
change would create from the customer base.
There are several other things that Staples could test to see the impact with a
model like ours. One of them is seeing how much increasing the conveyor capacity and
cycle time. In other words increase conveyor productivity, and then calculate if the
benefit is worth upgrading the conveyor or hiring more workers to work it.
Changing the line haul schedule and route waving is another scenario that should
be considered. Changing which routes are processed first at the FC and the schedule of
which hubs/routes the shipping lanes are dedicated to throughout the day can have a great
impact on the number of delivery trucks that are completed by their scheduled departure
time. For example SDO’s with extremely long line haul travel times may need all of
their routes/line hauls processed in the first wave of the FC in order for their delivery
trucks to be completed on time.
The demand curve and cut time are examples of constraints. Our project centered
around simulation, which is often used just as an information tool rather than a step
53
towards implementation. Staples goal for our project turned into them wanting us to
build a functional model for them to be able to use in the future for other considerations.
For this reason, we did not have many constraints in our project. Staples is a giant
company that is doing quite well with tons of capital, so any project that they choose to
take on that will be beneficial for the future for the most part they can afford.
Our project did center around one specific area which was deemed a possibility
for FC synchronization by the people at Staples. However, it is possible that without this
constraint, had we chosen a different region for our simulation, that with a different cut
time, FC synchronization would be a viable option. The Stockton, London and Charlotte
networks were all considered originally when deciding what network would be the most
appropriate to simulate, so another suggestion we would make is for Staples to simulate
these areas as well with different cut off times.
Another decision made for us at the outset of the project was the type of software
we would use. Arena is a highly functional and effective simulation tool, but neither of
us were experts at using it, and neither were any of the people at WPI nor Staples. This
restricted our progress in simulation to a great degree because the only people that we
could ask questions to was each other. We did end up getting a little help from the Arena
people, but that is a delayed process.
We didn’t have any interaction with any of the employees at the SDO and FC we
visited, and we did not consider the limits of their skill, or attention, we simply used
averages for the amount of time for each of their functions with in the network. Had we
more time, we would have factored in how productive workers are at certain times of the
54
day, and under what conditions do they work best. Looking into that would be another
suggestion we would make to Staples.
In conclusion, our main focus was fulfilling the goal that was given to us by
Staples: create a functional model of the current process in Southern California that can
be utilized in the future while testing the theory of FC synchronization. We succeeded in
doing so, now it is up to Staples to take our approach and utilize it to find and implement
measures that would raise efficiency and or cut costs.
55
References Callery, Jim. (20SEP06). Interview at Staples Fulfillment Center. Putnam, CT Callery, Jim. (04OCT06), Staples Meeting. Home Office, Framingham, MA Eddy, Victoria. (08DEC06) Staples Meeting. Home Office, Framingham, MA Staples, Inc. (2006) Milestones & History. http://www.staples.com/sbd/content/about/media/milestones.html Staples, Inc. (2006). Corporate Overview. http://www.staples.com/sbd/content/about/media/overview.html Callery, Jim. (04OCT06), Staples Meeting. Home Office, Framingham, MA Plourde, Larry. (29AUG06). Staples Meeting. Home Office, Framingham, MA Press Release. (2003) CommerceHub Enables Staples to Integrate and Mange Supply Chain http://www.commercehub.com/News/news_pr100102.html Material Handling Management. (2006)Avon More than Doubles Throughput with Conveyor Control Technology. http://www.mhmonline.com/viewStory.asp?nID=5080&pNum=1&CaH=1 Material Handling Management. (2006) Order Picking: First Pick. http://www.mhmonline.com/viewStory.asp?nID=4677&S=1 Harrel, Ghosh, and Bowden. (2000). Simulation Using Promodel. New York, USA. McGraw Hill. UGS. FactoryCAD. (2006) http://www.ugs.com/products/tecnomatix/plant_design/factory_cad.shtml The Progress Group. (2006) http://www.theprogressgroup.com/ Kelton, Sadowski, and Sturrock. (2007) Simulation with Arena. New York, USA. McGraw Hill Higher Education. Worcester Polytechnic Institute. (2006). WPI Projects Program. http://www.wpi.edu/Academics/Projects/ Coyle, John, and Bardi, Edward. (2003) The Management of Business Logistics. Canada. South-Western
56
Hedrick, Andy (2005) Improving Warehouse Productivity and Operational Performance
ContactCenter World (2003) Staples keeps Close Tabs on its Customers