Out of Health expenditure and household budget: Evidence from Egypt , Jordan and Palestine
20
Out of Health expenditure and household budget: Evidence from Egypt , Jordan and Palestine Reham Rizk Department of Economics, British university in Egypt Hala Abou-Ali Department of Economics, Cairo University May 21, 2016 ERF, Cairo
-
Upload
economic-research-forum -
Category
Government & Nonprofit
-
view
226 -
download
1
Transcript of Out of Health expenditure and household budget: Evidence from Egypt , Jordan and Palestine

Out of Health expenditure and household budget: Evidence from
Egypt , Jordan and Palestine
Reham Rizk
Department of Economics, British university in Egypt
Hala Abou-Ali
Department of Economics, Cairo University
May 21, 2016
ERF, Cairo

Outline
• Motivation
• Health care structure in Jordan , Egypt and Palestine
• Survey of the exiting literature
• Data and Methods
• Stylized facts
• Estimation results
• Conclusion

Motivation (1/5) The proportion of out-of-pocket health expenditure is
45.6% of total private health expenditure in MENA (WDI, 2013).
Moreover, public health expenditure in the MENA region accounts about 50% of total health expenditure which constitute about 6% of GDP- it is higher compared to Europe and East Asia and pacific (WDI, 2013).
The main reasons of the presence of high large financial flow of OOP health payment:
First: Medical insurance
Second :Poor Public health facilities
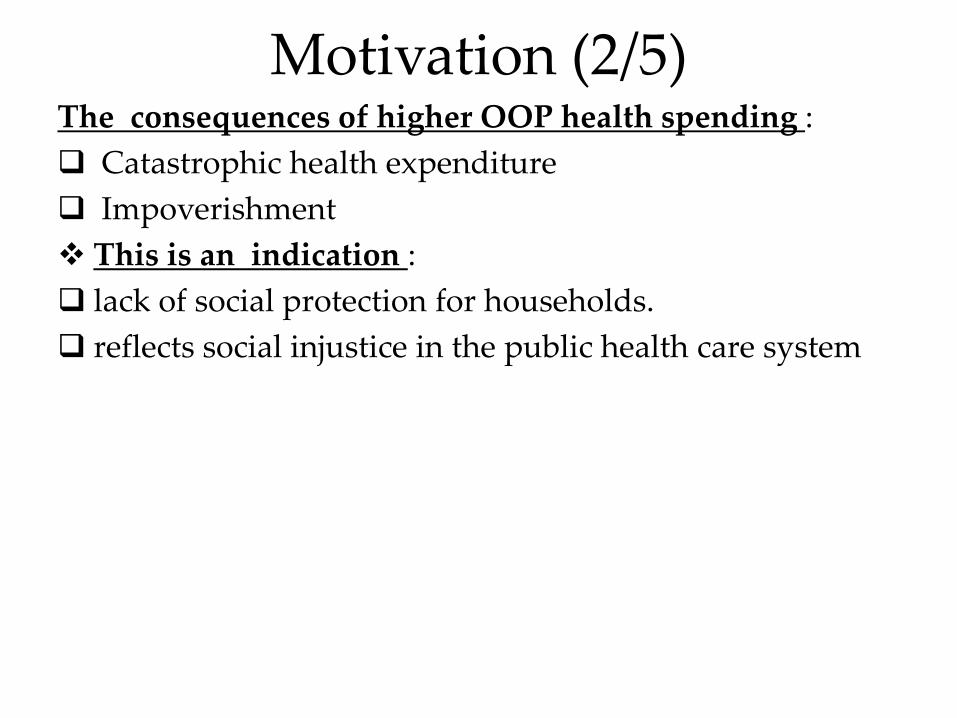
Motivation (2/5) The consequences of higher OOP health spending :
Catastrophic health expenditure
Impoverishment
This is an indication :
lack of social protection for households.
reflects social injustice in the public health care system

Motivation(3/5) Out pocket health expenditure as % of GDP and as % of total health expenditure WHO(2010 )
0
10
20
30
40
50
60
70
Egypt Sudan Tunisia Jordan MENA
2.9 4.4 2.9 2.8 3.1
59.2
64.8
35
24.8
48.1
per
cen
tag
e p
oin
ts
HE, private (% of GDP)
OOPHE (% of total exp
on health)

Motivation (4/5) Public health expenditure as %of GDP and as % of total health expenditure (WHO,2010 )
0
10
20
30
40
50
60
70
Egypt Sudan Tunisia Jordan MENA
1.9 2.1 3.8 5.9
2.7
39.4
32.1
57.1
67.6
46.7
Per
cen
tag
e p
oin
ts
HE public (% of GDP)
HE, public (% of total health
expenditure)

Motivation(5/5) • The purpose of this research paper is two-fold. First, to
assesses the prevalence of out-of-pocket catastrophic health expenditure and pinpoint the factors associated with its risk in Egypt, Jordan, and Palestine.
• Second, to further investigate the poverty impact of out-of –pocket health expenditure in three Arab countries and identify the socio-economic indicators associated with impoverishment.
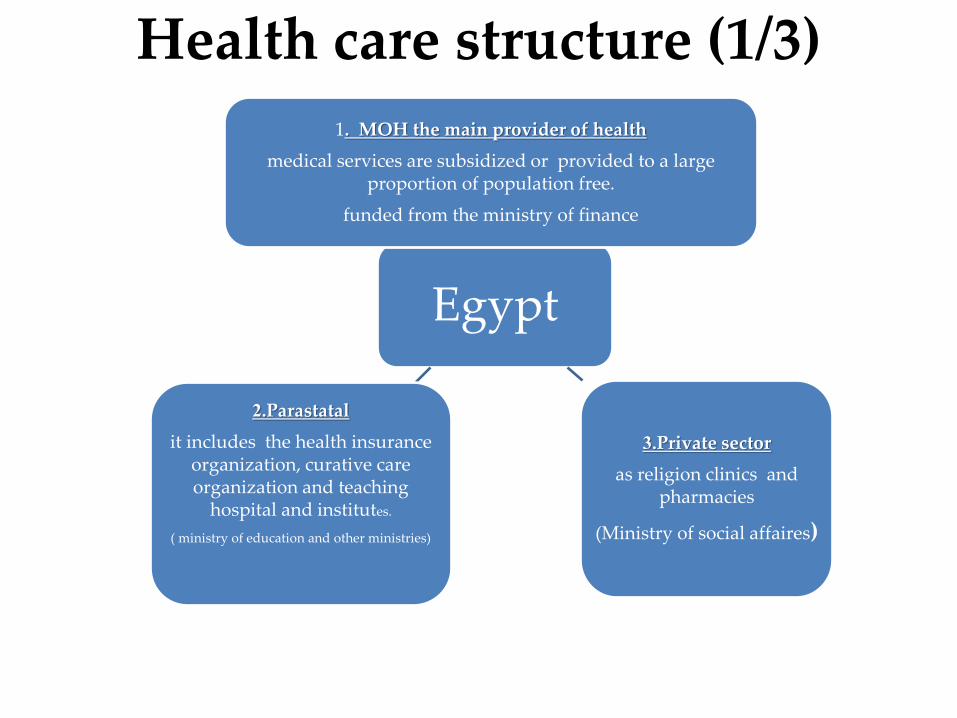
Health care structure (1/3)
Egypt
1. MOH the main provider of health
medical services are subsidized or provided to a large proportion of population free.
funded from the ministry of finance
3.Private sector
as religion clinics and pharmacies
(Ministry of social affaires)
2.Parastatal
it includes the health insurance organization, curative care organization and teaching
hospital and institutes.
( ministry of education and other ministries)

Health care structure (2/3)
Jordan
MOH and Royal
Medical care
Private sector
Donors (UNRWA)

Health care structure (3/3)
Palestine
Ministry of health
Primary health services
Budget state , health insurance and cooperative operations
Private sector
Tertiary health care
NGO’s and UNRWA
(Int’l organizations and donors
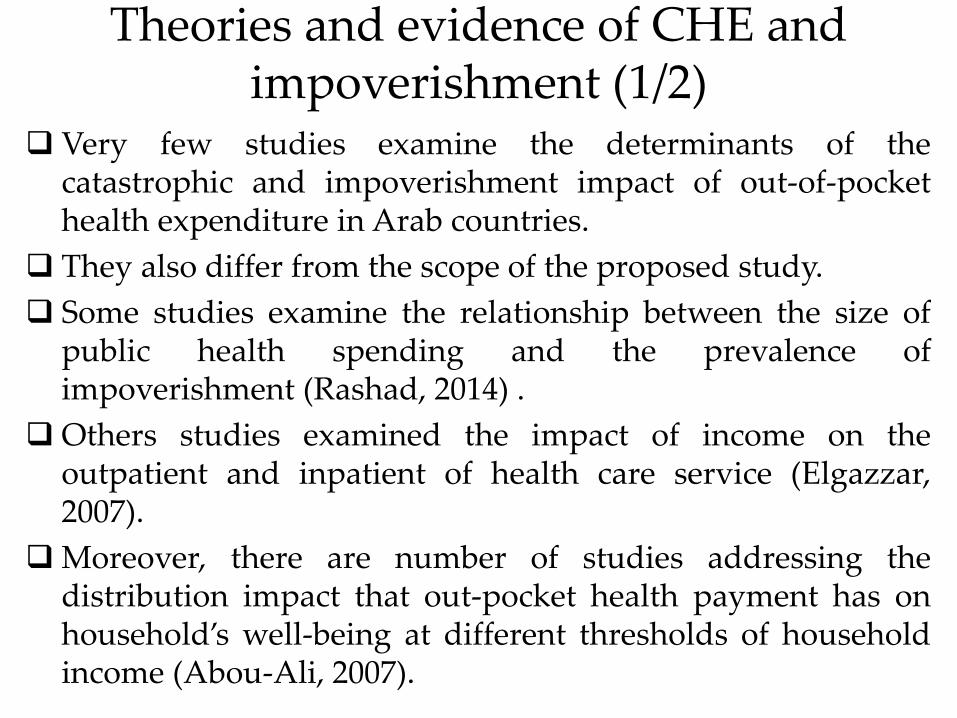
Theories and evidence of CHE and impoverishment (1/2)
Very few studies examine the determinants of the catastrophic and impoverishment impact of out-of-pocket health expenditure in Arab countries.
They also differ from the scope of the proposed study.
Some studies examine the relationship between the size of public health spending and the prevalence of impoverishment (Rashad, 2014) .
Others studies examined the impact of income on the outpatient and inpatient of health care service (Elgazzar, 2007).
Moreover, there are number of studies addressing the distribution impact that out-pocket health payment has on household’s well-being at different thresholds of household income (Abou-Ali, 2007).

Theories and evidence of CHE and impoverishment (2/2)
There are contradicting findings with respect to socio-economic determinants of out-of-pocket health expenditure in developing countries.
Some studies argue that wealthier quintiles spends less compared to poorest quintiles as a percentage of total consumption on health care whereas others showed progressive trend (Makinen et al., 2000; Xu et al. 2003; Minh, et al., 2013; Brown, Hole, & Kilic, 2014; Wagstaff & Doorslaer, 2003).
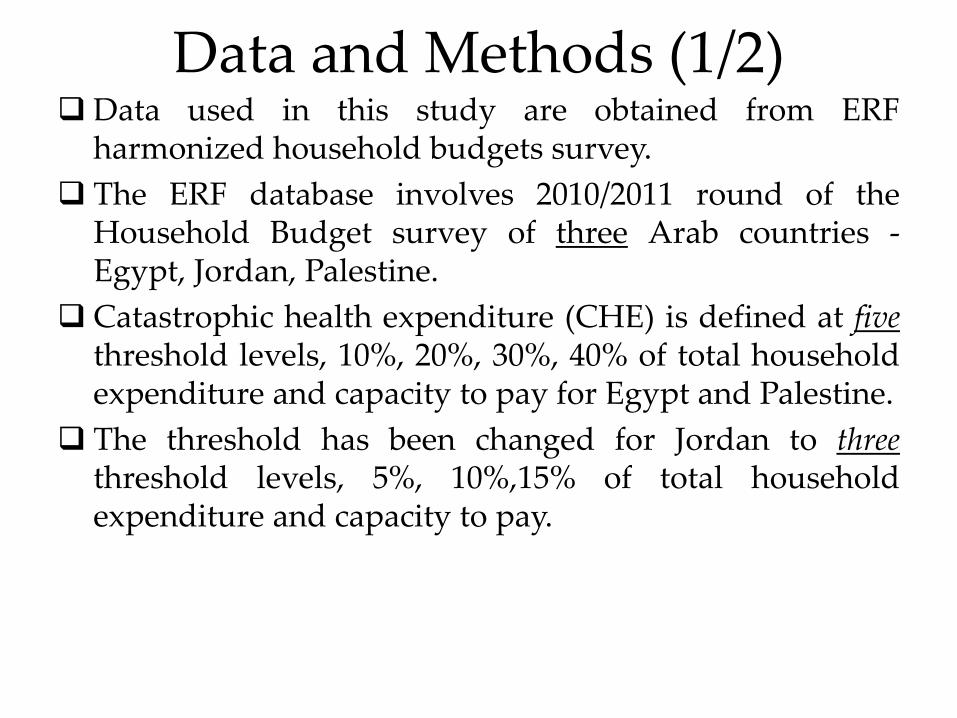
Data and Methods (1/2) Data used in this study are obtained from ERF
harmonized household budgets survey.
The ERF database involves 2010/2011 round of the Household Budget survey of three Arab countries - Egypt, Jordan, Palestine.
Catastrophic health expenditure (CHE) is defined at five threshold levels, 10%, 20%, 30%, 40% of total household expenditure and capacity to pay for Egypt and Palestine.
The threshold has been changed for Jordan to three threshold levels, 5%, 10%,15% of total household expenditure and capacity to pay.
Data and Methods (2/2)
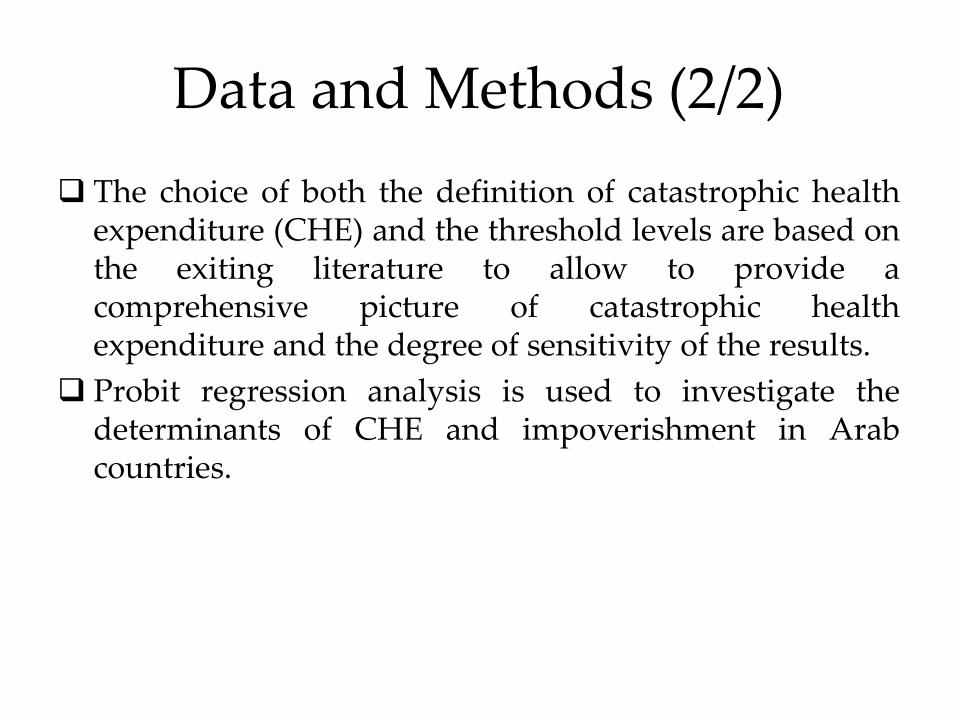
The choice of both the definition of catastrophic health expenditure (CHE) and the threshold levels are based on the exiting literature to allow to provide a comprehensive picture of catastrophic health expenditure and the degree of sensitivity of the results.
Probit regression analysis is used to investigate the determinants of CHE and impoverishment in Arab countries.

Stylized facts (1/2) Table (1): Percentage of households with Catastrophic health expenditure as % of total HE and capacity
to pay
Threshold Egypt 2010
% of total household expenditure % of capacity to pay
10% 19% 26%
20% 5% 11%
30% 2% 5%
40% 1% 6%
Impoverishment 64%
Table (2): Percentage of households with Catastrophic health expenditure as % of total HE and capacity
to pay
Threshold Palestine 2010
% of total household expenditure % of capacity to pay
10% 10% 16%
20% 3.14% 4%
30% 1.10% 2%
40% 1% 3%
Impoverishment 54%
Table (3): Percentage of households with Catastrophic health expenditure as % of total HE and capacity
to pay
Threshold Jordan 2010
% of total household expenditure % of capacity to pay
5% 14.9% 14.9%
10% 5.4% 5.4%
15% 4.3% 7.6%
Impoverishment 58%

Estimation results (1/2) The determinants of impoverishment
omitted group :First quintile Egypt 2010 Jordan 2010 Palestine 2010
2nd quintile 0.372*** 0.141*** 0.160***
-0.01 -0.03 -0.03
3rd quintile 0.491*** 0.215*** 0.301***
-0.01 -0.03 -0.02
4th quintile 0.566*** 0.328*** 0.419***
-0.01 -0.03 -0.02
5th quintile 0.606*** 0.455*** 0.517***
-0.01 -0.02 -0.02
children less than 14 years 0.022*** -0.011 0.039***
-0.01 -0.01 -0.01
Elderly :65+ years 0.060*** 0.057*** -0.015
-0.02 -0.02 -0.02
Household size 0.021*** 0.038*** 0.074***
-0.01 -0.01 -0.01
omitted group: Primary or
less
Secondary 0.091*** 0.073** -0.036
-0.02 -0.03 -0.03
Higher education 0.098*** 0.176*** 0.007
-0.02 -0.03 -0.03
Omitted group : female
male -0.014 0.068* 0.023
-0.02 -0.04 -0.04
Omitted group : rural
urban -0.095*** -0.053** 0.001
-0.02 -0.02 -0.02
Number of Obs. 7627 2784 2796
Log likelihood -2394.90 -1606.85 -1390.6493
.LR chi2 5218.43 (13) 622.89 (13) 1016.8 (13)
Prob>Chi2 0.000 0.000 0.000
Pseudo R square 0.52 0.16 0.2677
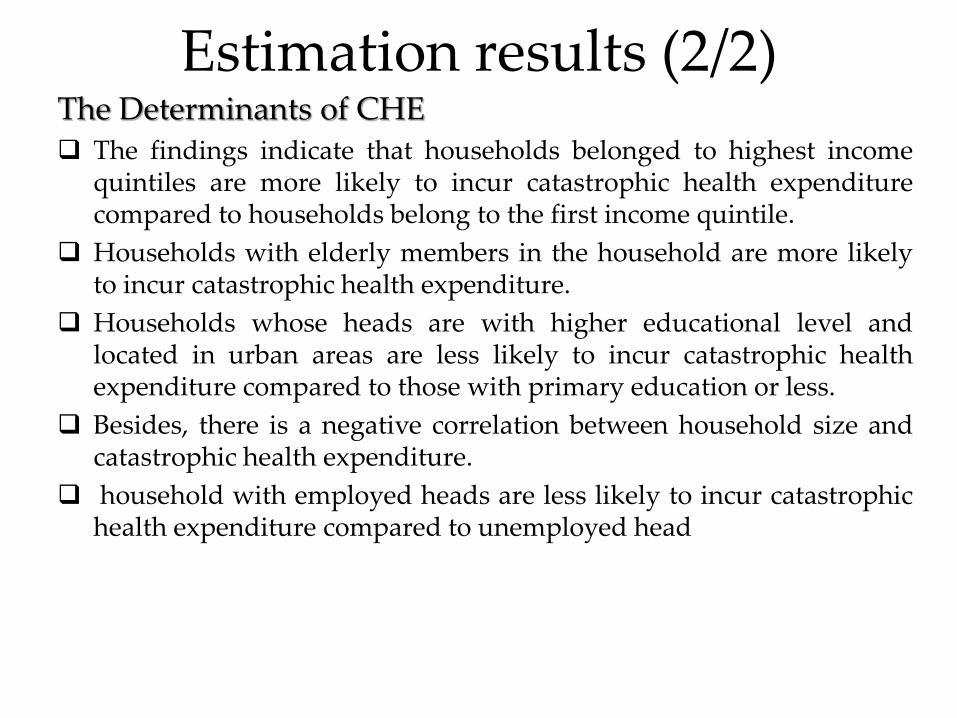
Estimation results (2/2) The Determinants of CHE The findings indicate that households belonged to highest income
quintiles are more likely to incur catastrophic health expenditure compared to households belong to the first income quintile.
Households with elderly members in the household are more likely to incur catastrophic health expenditure.
Households whose heads are with higher educational level and located in urban areas are less likely to incur catastrophic health expenditure compared to those with primary education or less.
Besides, there is a negative correlation between household size and catastrophic health expenditure.
household with employed heads are less likely to incur catastrophic health expenditure compared to unemployed head

Conclusions (1/2) • Our analysis showed that out of pocket health payment
is the highest for Egypt among the MENA countries. According to WHO, the out of pocket health payment for Egypt is about 59% of total health expenditure while, it is 25% for Jordan.
• In comparing between countries with respect to the prevalence of catastrophic health expenditure and impoverishment, Egypt has higher rates of impoverishment compared to Jordan and Palestine.

Conclusion (2/2)
Our results suggest that the poor households are less likely to incur catastrophic health expenditure compared to the non poor households across the selected countries. This result highlighted the vulnerability of the disadvantaged group in terms of demanding health services.
Special attention should be given to the poor in health care reforms in the selected countries whether in terms of improving the quality of health care provided by the public sector or increasing their financial protection.
Households located in rural areas are more likely to incur catastrophic health expenditure compared to urban areas particularly for both Jordan and Egypt.
This implies special attention for health care policies for rural areas in both Jordan and Egypt in terms of both quality and quantity of the health service as well as the social protection.

Questions?
20