OUR STUDENTS - Cherokee County School...
20
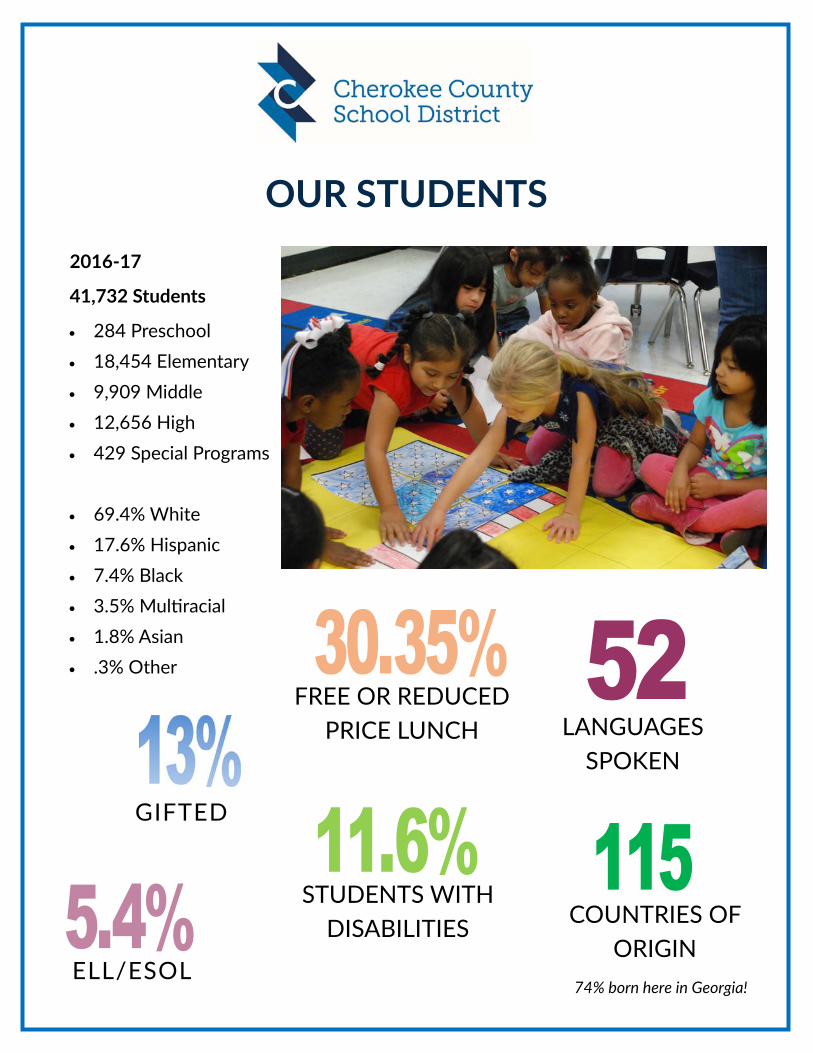
OUR STUDENTS 2016‐17 41,732 Students 284 Preschool 18,454 Elementary 9,909 Middle 12,656 High 429 Special Programs 69.4% White 17.6% Hispanic 7.4% Black 3.5% Mulঞracial 1.8% Asian .3% Other GIFTED FREE OR REDUCED PRICE LUNCH STUDENTS WITH DISABILITIES LANGUAGES SPOKEN ELL/ESOL COUNTRIES OF ORIGIN 74% born here in Georgia!
Transcript of OUR STUDENTS - Cherokee County School...
OUR STUDENTS
2016‐17
41,732 Students
284 Preschool
18,454 Elementary
9,909 Middle
12,656 High
429 Special Programs
69.4% White
17.6% Hispanic
7.4% Black
3.5% Mul racial
1.8% Asian
.3% Other
GIFTED
FREE OR REDUCED PRICE LUNCH
STUDENTS WITH DISABILITIES
LANGUAGES SPOKEN
ELL/ESOL
COUNTRIES OF ORIGIN
74% born here in Georgia!
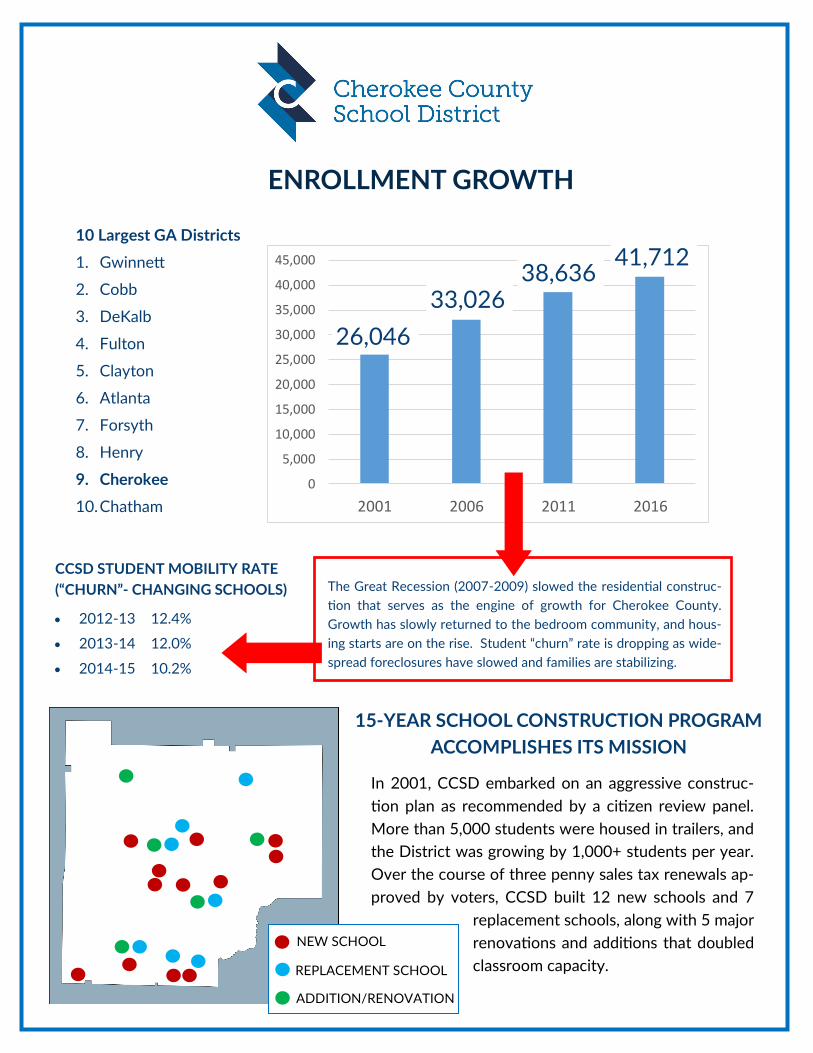
ENROLLMENT GROWTH
0
5,000
10,000
15,000
20,000
25,000
30,000
35,000
40,000
45,000
2001 2006 2011 2016
10 Largest GA Districts
1. Gwinnett
2. Cobb
3. DeKalb
4. Fulton
5. Clayton
6. Atlanta
7. Forsyth
8. Henry
9. Cherokee
10. Chatham
41,712
26,046
33,026 38,636
The Great Recession (2007-2009) slowed the residential construc-
tion that serves as the engine of growth for Cherokee County.
Growth has slowly returned to the bedroom community, and hous-
ing starts are on the rise. Student “churn” rate is dropping as wide-
spread foreclosures have slowed and families are stabilizing.
15-YEAR SCHOOL CONSTRUCTION PROGRAM
ACCOMPLISHES ITS MISSION
In 2001, CCSD embarked on an aggressive construc-
tion plan as recommended by a citizen review panel.
More than 5,000 students were housed in trailers, and
the District was growing by 1,000+ students per year.
Over the course of three penny sales tax renewals ap-
proved by voters, CCSD built 12 new schools and 7
replacement schools, along with 5 major
renovations and additions that doubled
classroom capacity.
NEW SCHOOL
REPLACEMENT SCHOOL
ADDITION/RENOVATION
CCSD STUDENT MOBILITY RATE
(“CHURN”- CHANGING SCHOOLS)
2012-13 12.4%
2013-14 12.0%
2014-15 10.2%
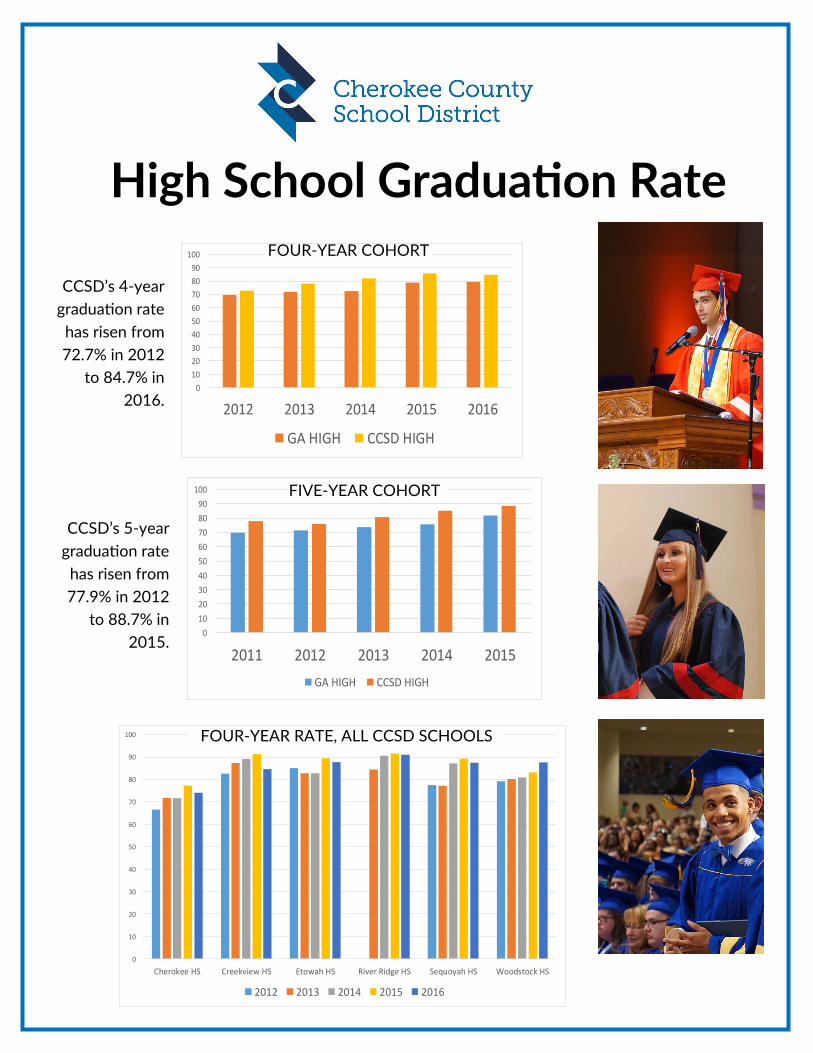
High School Graduation Rate
0
10
20
30
40
50
60
70
80
90
100
2012 2013 2014 2015 2016
GA HIGH CCSD HIGH
FOUR-YEAR COHORT
0
10
20
30
40
50
60
70
80
90
100
2011 2012 2013 2014 2015
GA HIGH CCSD HIGH
FIVE-YEAR COHORT
0
10
20
30
40
50
60
70
80
90
100
Cherokee HS Creekview HS Etowah HS River Ridge HS Sequoyah HS Woodstock HS
2012 2013 2014 2015 2016
FOUR-YEAR RATE, ALL CCSD SCHOOLS
CCSD’s 4-year
graduation rate
has risen from
72.7% in 2012
to 84.7% in
2016.
CCSD’s 5-year
graduation rate
has risen from
77.9% in 2012
to 88.7% in
2015.
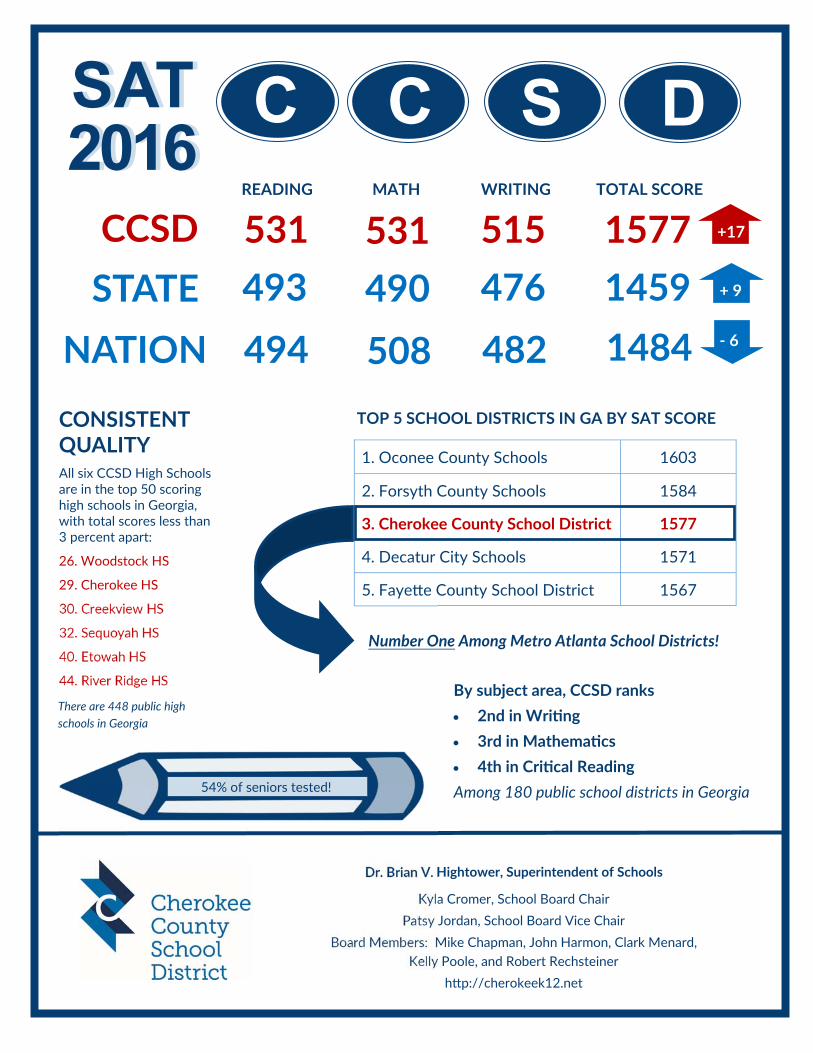
SAT 2016 SAT 2016
READING MATH WRITING TOTAL SCORE
531 515 1577
493 490 476 1459
494 508 482 1484
CCSD
STATE
NATION
C C S D
Dr. Brian V. Hightower, Superintendent of Schools
Kyla Cromer, School Board Chair
Patsy Jordan, School Board Vice Chair
Board Members: Mike Chapman, John Harmon, Clark Menard, Kelly Poole, and Robert Rechsteiner
h p://cherokeek12.net
1. Oconee County Schools 1603
2. Forsyth County Schools 1584
3. Cherokee County School District 1577
4. Decatur City Schools 1571
5. Faye e County School District 1567
TOP 5 SCHOOL DISTRICTS IN GA BY SAT SCORE CONSISTENT QUALITY All six CCSD High Schools are in the top 50 scoring high schools in Georgia, with total scores less than 3 percent apart:
26. Woodstock HS
29. Cherokee HS
30. Creekview HS
32. Sequoyah HS
40. Etowah HS
44. River Ridge HS By subject area, CCSD ranks
2nd in Wri ng
3rd in Mathema cs
4th in Cri cal Reading
Among 180 public school districts in Georgia
531
There are 448 public high schools in Georgia
Number One Among Metro Atlanta School Districts!
54% of seniors tested!
+17
+ 9
‐ 6

23.1
22.6 22.3
23.2 19.3
19.4
19.0
19.9 23.6
17.9
ACT in the ARC
ACT Results for CCSD’s Class of 2016
Dr. Brian V. Hightower, Superintendent of Schools Kyla Cromer, School Board Chair
Patsy Jordan, School Board Vice Chair Board Members: Mike Chapman, John Harmon, Clark Menard, Kelly Poole, and
Robert Rechsteiner h p://cherokeek12.net
CCSD saw a 12% in-crease in the number of students taking the ACT compared to 2015; and, more CCSD students took the ACT in 2016 than took the SAT in 2015.
CCSD RANK
5th Out of 180
Districts
GA RANK
23rd Out of 50
states
The average ACT score for CCSD’s six tradi onal high schools varies by less than 6%, indica ng a consistent quality of educa on and prepara on across the county for all students.
All six CCSD high schools ranked in the top 60 (of more than 400 high schools in Georgia), placing them all in the top 15% statewide; and,
Even the CCSD high school with the low-est score would rank 10th in the State if compared as a school district.
22.7 23.1
2016 2015
CCSD’s 2016 ACT SCORE IS OUR HIGHEST EVER!
Scale: 1‐36
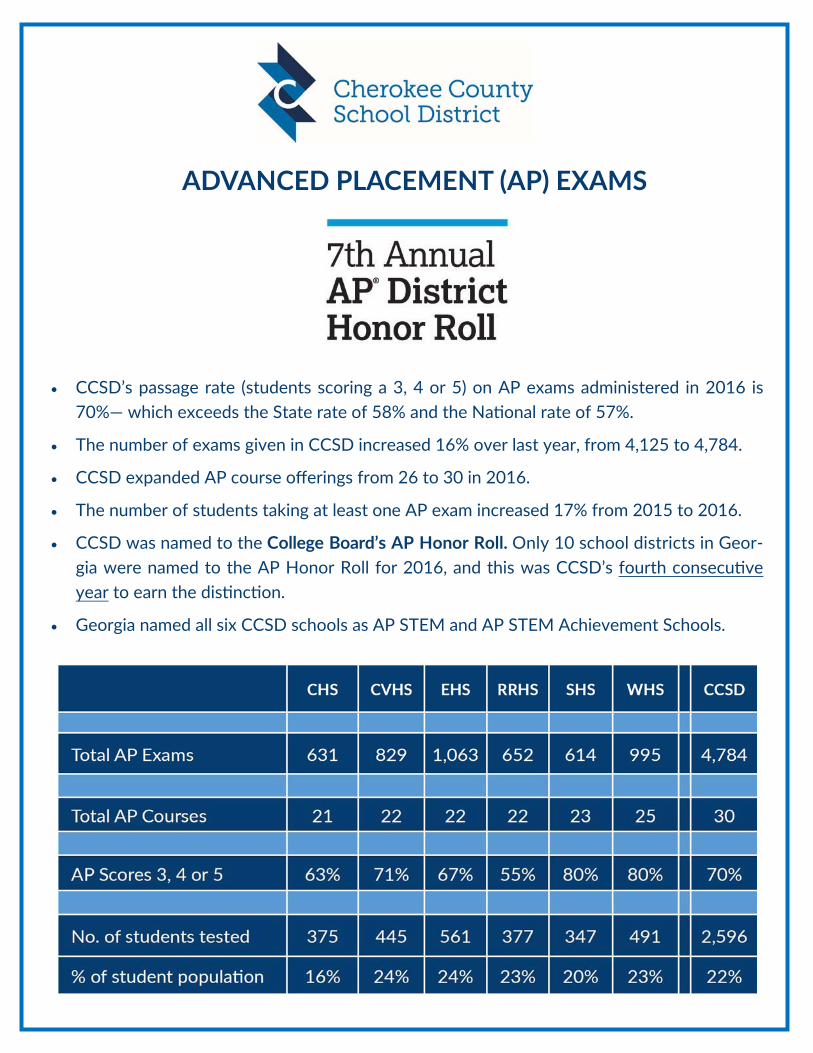
ADVANCED PLACEMENT (AP) EXAMS
CCSD’s passage rate (students scoring a 3, 4 or 5) on AP exams administered in 2016 is 70%— which exceeds the State rate of 58% and the Na onal rate of 57%.
The number of exams given in CCSD increased 16% over last year, from 4,125 to 4,784.
CCSD expanded AP course offerings from 26 to 30 in 2016.
The number of students taking at least one AP exam increased 17% from 2015 to 2016.
CCSD was named to the College Board’s AP Honor Roll. Only 10 school districts in Geor-gia were named to the AP Honor Roll for 2016, and this was CCSD’s fourth consecu ve year to earn the dis nc on.
Georgia named all six CCSD schools as AP STEM and AP STEM Achievement Schools.

2016 GEORGIA MILESTONES RESULTS:
CHEROKEE COUNTY GRADES 3‐5
4TH GRADE MILESTONES
5TH GRADE MILESTONES
3RD GRADE MILESTONES
DEVELOPING LEARNER & ABOVE
GA ELA 69.5% CCSD ELA 77.6% GA MATH 79.6% CCSD MATH 88.4% GA SCI 71.2% CCSD SCI 80.1% GA SS 70.4% CCSD SS 80.4%
DEVELOPING LEARNER & ABOVE
GA ELA 66.8% CCSD ELA 75.5% GA MATH 79.2% CCSD MATH 87.6% GA SCI 75.8% CCSD SCI 83.5% GA SS 75.3% CCSD SS 83.3%
DEVELOPING LEARNER & ABOVE
GA ELA 75.0% CCSD ELA 81.6% GA MATH 74.1% CCSD MATH 83.6% GA SCI 70.3% CCSD SCI 79.5% GA SS 74.6% CCSD SS 82.4%
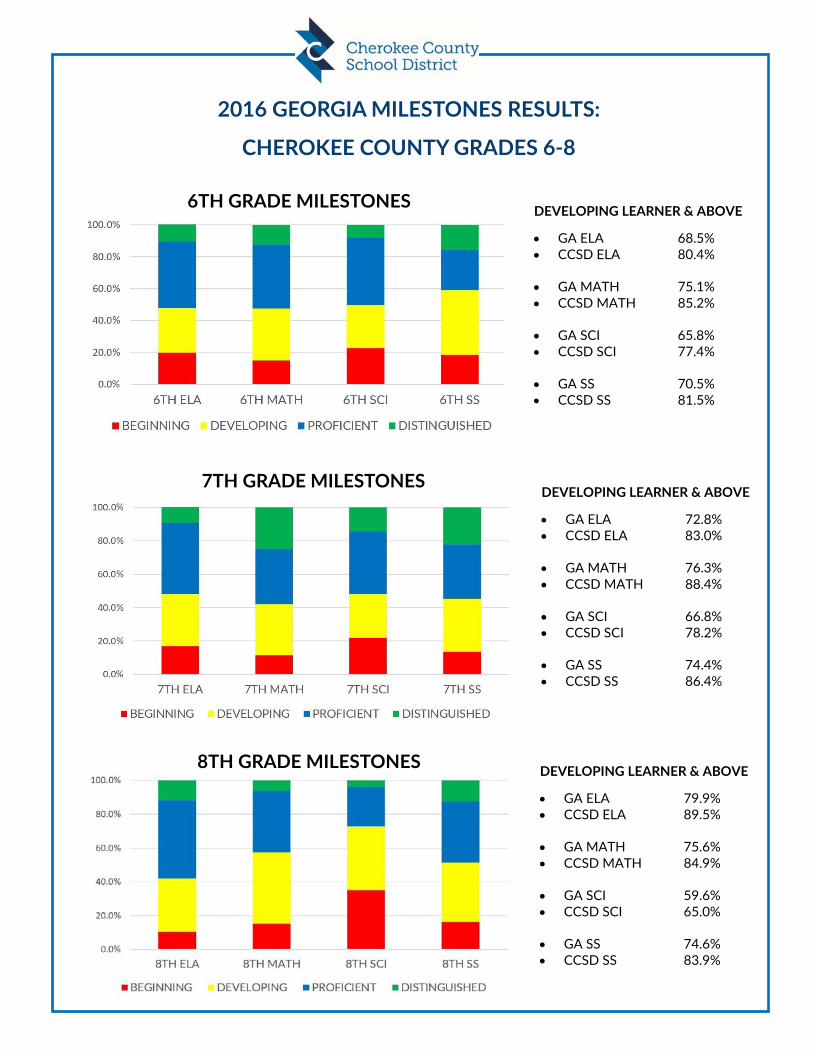
2016 GEORGIA MILESTONES RESULTS:
CHEROKEE COUNTY GRADES 6‐8
7TH GRADE MILESTONES DEVELOPING LEARNER & ABOVE
GA ELA 72.8% CCSD ELA 83.0% GA MATH 76.3% CCSD MATH 88.4% GA SCI 66.8% CCSD SCI 78.2% GA SS 74.4% CCSD SS 86.4%
DEVELOPING LEARNER & ABOVE
GA ELA 68.5% CCSD ELA 80.4% GA MATH 75.1% CCSD MATH 85.2% GA SCI 65.8% CCSD SCI 77.4% GA SS 70.5% CCSD SS 81.5%
DEVELOPING LEARNER & ABOVE
GA ELA 79.9% CCSD ELA 89.5% GA MATH 75.6% CCSD MATH 84.9% GA SCI 59.6% CCSD SCI 65.0% GA SS 74.6% CCSD SS 83.9%
6TH GRADE MILESTONES
8TH GRADE MILESTONES

2016 GEORGIA MILESTONES RESULTS:
END OF COURSE ASSESSMENTS (HIGH SCHOOL)
DEVELOPING LEARNER
& ABOVE
9TH LIT CCSD 87.6% GEORGIA 77.5% AMERICAN LIT CCSD 88.4% GEORGIA 76.4% US HISTORY CCSD 87.9% GEORGIA 76.7% ECONOMICS CCSD 86.7% GEORGIA 72.5%
DEVELOPING LEARNER
& ABOVE
ALGEBRA I CCSD 86.2% GEORGIA 70.0% ANALYTICAL GEOMETRY CCSD 87.0% GEORGIA 70.3% BIOLOGY CCSD 81.1% GEORGIA 68.0% PHYSICAL SCIENCE CCSD 78.8% GEORGIA 65.9%
LANGUAGE ARTS & SOCIAL STUDIES
MATH & SCIENCE

LITERACY: 2016 MILESTONES
READING ON/ABOVE GRADE LEVEL GRADE LEVEL CCSD GEORGIA
3RD GRADE
4TH GRADE
5TH GRADE
6TH GRADE
7TH GRADE
8TH GRADE
9TH GRADE
10TH GRADE
79%
67%
77%
72%
84%
87%
88%
86%
72%
58%
68%
59%
74%
76%
78%
73%
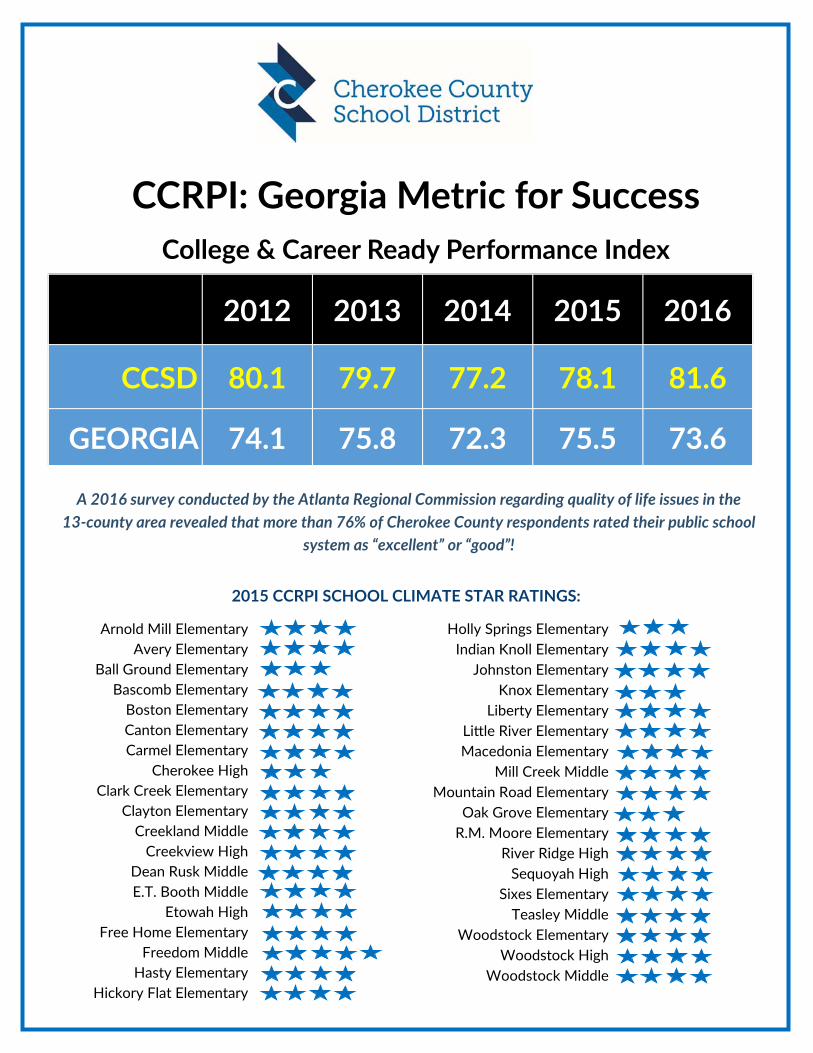
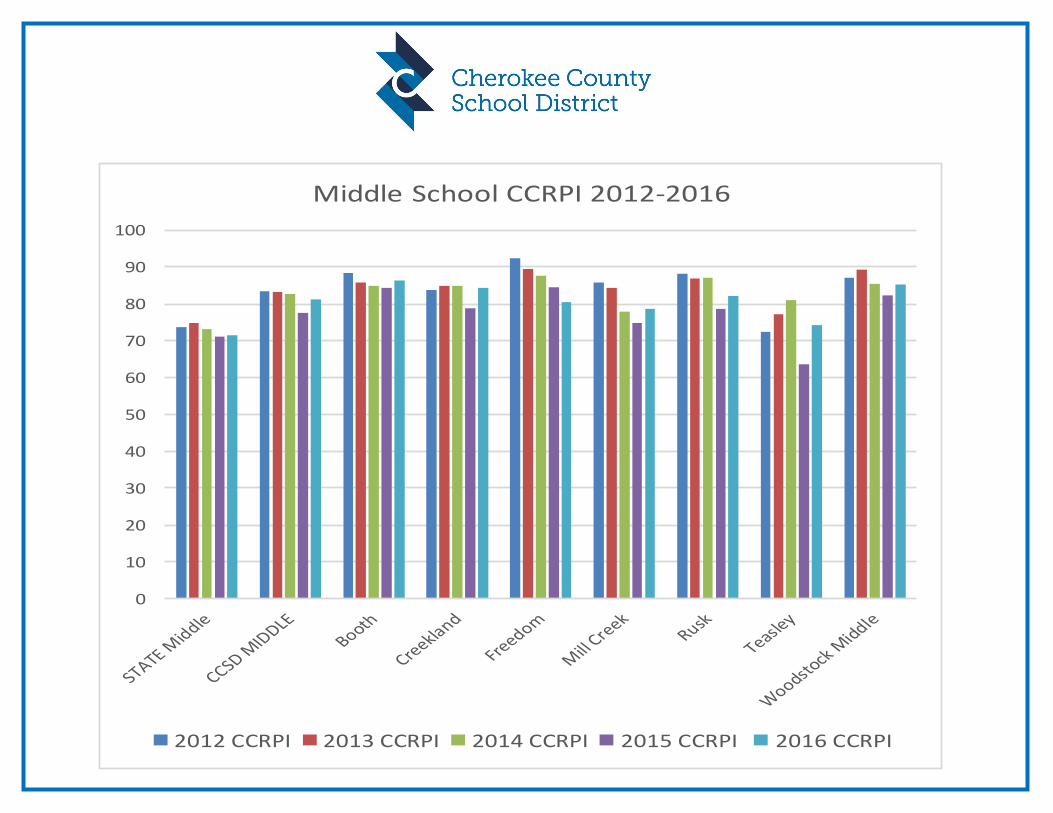
CCRPI: Georgia Metric for Success College & Career Ready Performance Index
2015 CCRPI SCHOOL CLIMATE STAR RATINGS:
2012 2013 2014 2015 2016
CCSD 80.1 79.7 77.2 78.1 81.6
GEORGIA 74.1 75.8 72.3 75.5 73.6
Arnold Mill Elementary Avery Elementary
Ball Ground Elementary Bascomb Elementary
Boston Elementary Canton Elementary Carmel Elementary
Cherokee High Clark Creek Elementary
Clayton Elementary Creekland Middle
Creekview High Dean Rusk Middle E.T. Booth Middle
Etowah High Free Home Elementary
Freedom Middle Hasty Elementary
Hickory Flat Elementary
Holly Springs Elementary Indian Knoll Elementary
Johnston Elementary Knox Elementary
Liberty Elementary Li le River Elementary Macedonia Elementary
Mill Creek Middle Mountain Road Elementary
Oak Grove Elementary R.M. Moore Elementary
River Ridge High Sequoyah High
Sixes Elementary Teasley Middle
Woodstock Elementary Woodstock High
Woodstock Middle
A 2016 survey conducted by the Atlanta Regional Commission regarding quality of life issues in the 13‐county area revealed that more than 76% of Cherokee County respondents rated their public school
system as “excellent” or “good”!
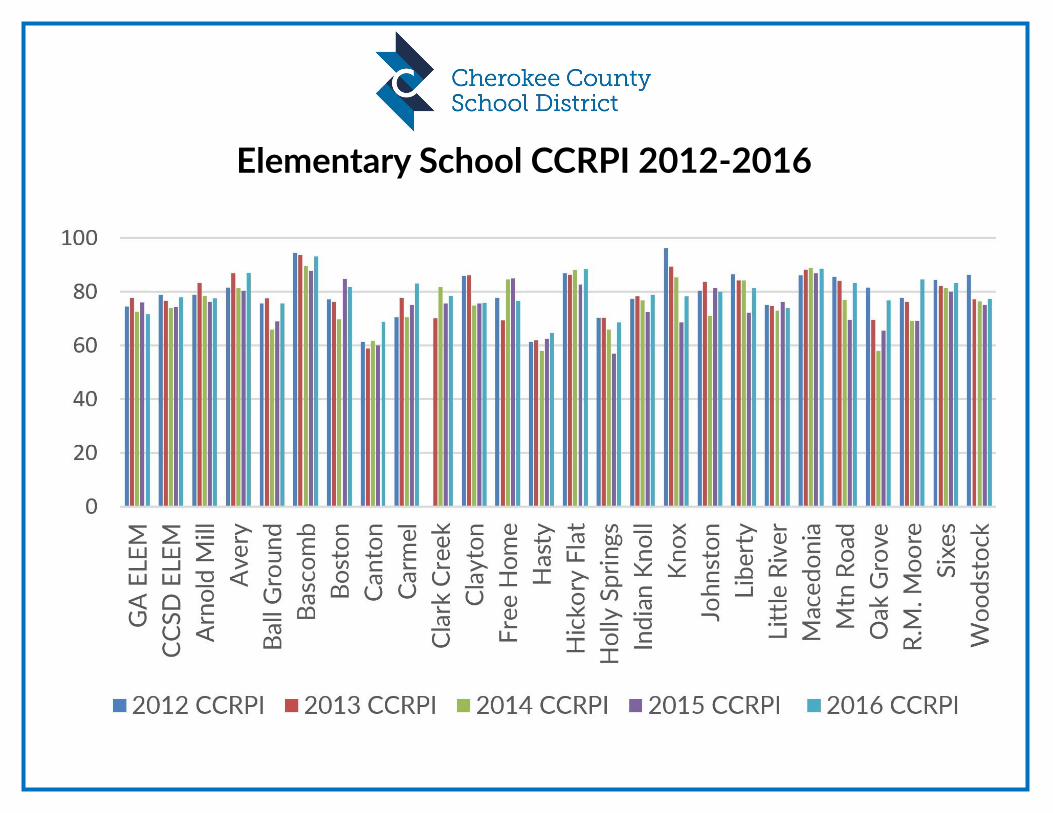
Elementary School CCRPI 2012-2016
0
10
20
30
40
50
60
70
80
90
100
Middle School CCRPI 2012-2016
2012 CCRPI 2013 CCRPI 2014 CCRPI 2015 CCRPI 2016 CCRPI

0
10
20
30
40
50
60
70
80
90
100
STATE HIGH CCSD HIGH Cherokee Creekview Etowah River Ridge Sequoyah WoodstockHigh
High School CCRPI 2012-2016
2012 CCRPI 2013 CCRPI 2014 CCRPI 2015 CCRPI 2016 CCRPI
High School CCRPI 2012-2016

NATIONAL NORM COMPARISONS: 2016 Georgia’s Milestones assessments include norm‐referenced items in all content areas and courses, to complement the criterion‐referenced informa on and to provide a na onal comparison. CCSD students are outperforming their counterparts na onally in 31 of 32 areas according to this metric.
END OF GRADE ASSESSMENTS (GRADES 3‐8)
Na onal Norm is 50th percen le

STUDENT GROWTH PERCENTILES: GRADES 4‐8
Georgia implemented the Student Growth Percen le (SGP) methodology in 2013 with the previous State as-sessments and has con nued those measures with the Milestones assessments, which began in 2015. SGPs de-scribe the amount of growth a student has demonstrat-ed rela ve to academically-similar students from across the state. Growth percen les range from 1 to 99, with lower percen les indica ng lower academic growth and higher percen les indica ng higher academic growth.
CCSD demonstrated increased growth rates in 19 of 20 End of Grade assessment areas from 2015 to 2016 and ranked first or second in Metro Atlanta
for highest growth in all EOG subject areas .
Higher Achievement
Higher Growth
Higher Achievement
Lower Growth
Lower Achievement
Lower Growth
Lower Achievement
Higher Growth
% o
f D
evel
opin
g Le
arne
r &
Abo
ve
Median Student Growth Percen le
Higher Achievement
Higher Growth
Higher Achievement
Lower Growth
Lower Achievement
Lower Growth
Lower Achievement
Higher Growth
2016 ENGLISH/LANG ARTS: ALL GRADES
54 Higher Achievement
Higher Growth
Higher Achievement
Lower Growth
Lower Achievement
Lower Growth
Lower Achievement
Higher Growth
2016 MATH: ALL GRADES
60
Higher Achievement
Higher Growth
Higher Achievement
Lower Growth
Lower Achievement
Lower Growth
Lower Achievement
Higher Growth
2016 SCIENCE: ALL GRADES
55 Higher Achievement
Higher Growth
Higher Achievement
Lower Growth
Lower Achievement
Lower Growth
Lower Achievement
Higher Growth
2016 SOCIAL STUDIES: ALL GRADES
58
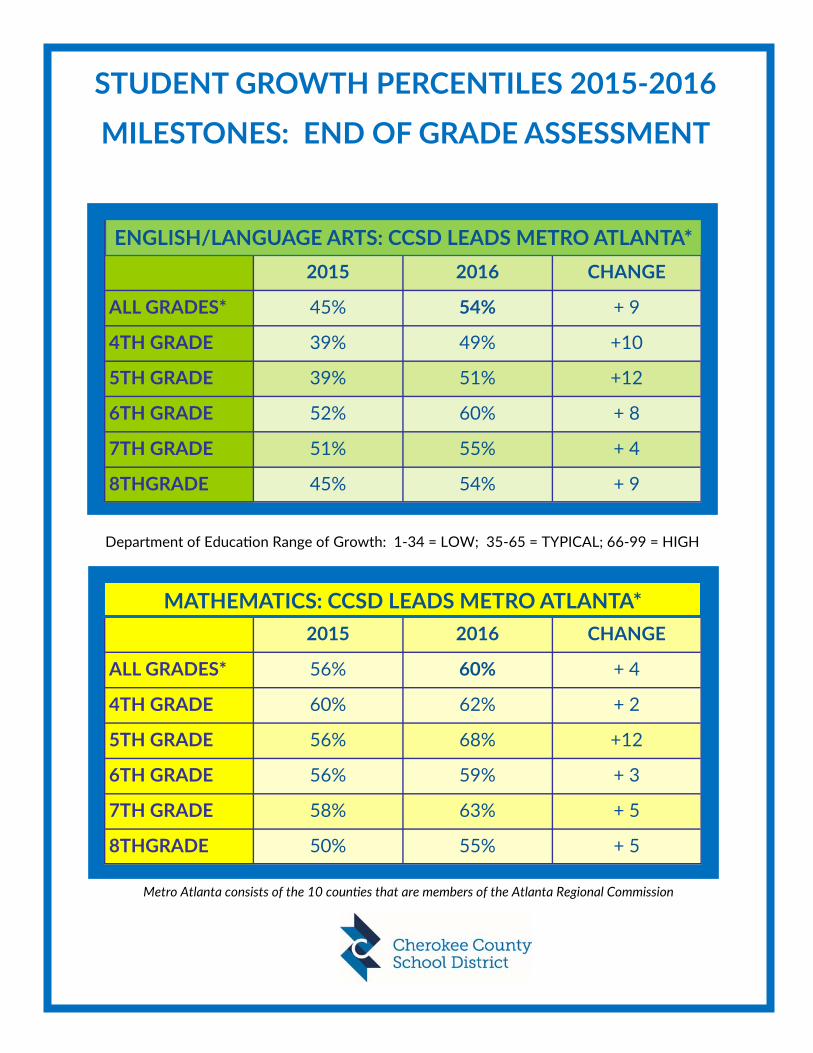
STUDENT GROWTH PERCENTILES 2015‐2016
MILESTONES: END OF GRADE ASSESSMENT
2015 2016 CHANGE
4TH GRADE 39% 49% +10
5TH GRADE 39% 51% +12
6TH GRADE 52% 60% + 8
7TH GRADE 51% 55% + 4
8THGRADE 45% 54% + 9
ALL GRADES* 45% 54% + 9
ENGLISH/LANGUAGE ARTS: CCSD LEADS METRO ATLANTA*
2015 2016 CHANGE
4TH GRADE 60% 62% + 2
5TH GRADE 56% 68% +12
6TH GRADE 56% 59% + 3
7TH GRADE 58% 63% + 5
8THGRADE 50% 55% + 5
ALL GRADES* 56% 60% + 4
MATHEMATICS: CCSD LEADS METRO ATLANTA*
Department of Educa on Range of Growth: 1‐34 = LOW; 35‐65 = TYPICAL; 66‐99 = HIGH
Metro Atlanta consists of the 10 coun es that are members of the Atlanta Regional Commission
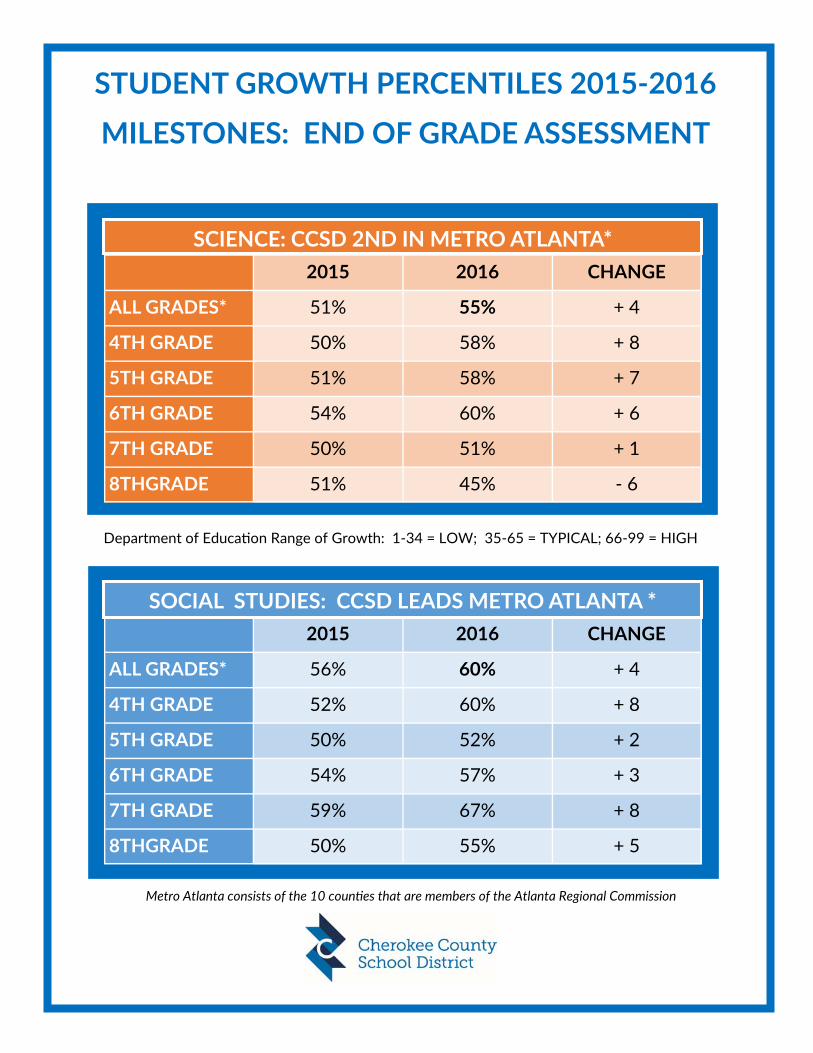
STUDENT GROWTH PERCENTILES 2015‐2016
MILESTONES: END OF GRADE ASSESSMENT
2015 2016 CHANGE
4TH GRADE 50% 58% + 8
5TH GRADE 51% 58% + 7
6TH GRADE 54% 60% + 6
7TH GRADE 50% 51% + 1
8THGRADE 51% 45% ‐ 6
ALL GRADES* 51% 55% + 4
SCIENCE: CCSD 2ND IN METRO ATLANTA*
2015 2016 CHANGE
4TH GRADE 52% 60% + 8
5TH GRADE 50% 52% + 2
6TH GRADE 54% 57% + 3
7TH GRADE 59% 67% + 8
8THGRADE 50% 55% + 5
ALL GRADES* 56% 60% + 4
SOCIAL STUDIES: CCSD LEADS METRO ATLANTA *
Department of Educa on Range of Growth: 1‐34 = LOW; 35‐65 = TYPICAL; 66‐99 = HIGH
Metro Atlanta consists of the 10 coun es that are members of the Atlanta Regional Commission

STUDENT GROWTH PERCENTILES: GRADES 9‐12
Georgia implemented the Student Growth Percen le (SGP) methodology in 2013 with the previous State as-sessments and has con nued those measures with the Milestones assessments, which began in 2015. SGPs de-scribe the amount of growth a student has demonstrat-ed rela ve to academically-similar students from across the state. Growth percen les range from 1 to 99, with lower percen les indica ng lower academic growth and higher percen les indica ng higher academic growth.
CCSD demonstrated increased growth rates in 7 of 8 End of Course assessments from 2015 to 2016
and ranked first or second in Metro Atlanta for highest growth in 5 of 8 subject areas.
Higher Achievement
Higher Growth
Higher Achievement
Lower Growth
Lower Achievement
Lower Growth
Lower Achievement
Higher Growth
% o
f D
evel
opin
g Le
arne
r &
Abo
ve
Median Student Growth Percen le
2016 9TH LIT
Higher Achievement Higher Growth
Higher Achievement
Lower Growth
Lower Achievement
Lower Growth
Lower Achievement
Higher Growth
2016 AM LIT
58 Higher Achievement Higher Growth
Higher Achievement
Lower Growth
Lower Achievement
Lower Growth
Lower Achievement
Higher Growth
58 Higher Achievement Higher Growth
Higher Achievement
Lower Growth
Lower Achievement
Lower Growth
Lower Achievement
Higher Growth
61
2016 ALGEBRA I
Higher Achievement Higher Growth
Higher Achievement
Lower Growth
Lower Achievement
Lower Growth
Lower Achievement
Higher Growth
62
2016 GEOMETRY
2016 BIOLOGY
Higher Achievement Higher Growth
Higher Achievement
Lower Growth
Lower Achievement
Lower Growth
Lower Achievement
Higher Growth
2016 PHYSICAL SCIENCE
53 Higher Achievement Higher Growth
Higher Achievement
Lower Growth
Lower Achievement
Lower Growth
Lower Achievement
Higher Growth
Higher Achievement Higher Growth
Higher Achievement
Lower Growth
Lower Achievement
Lower Growth
Lower Achievement
Higher Growth
58
2016 U.S. HISTORY
Higher Achievement Higher Growth
Higher Achievement
Lower Growth
Lower Achievement
Lower Growth
Lower Achievement
Higher Growth
54
2016 ECONOMICS
53
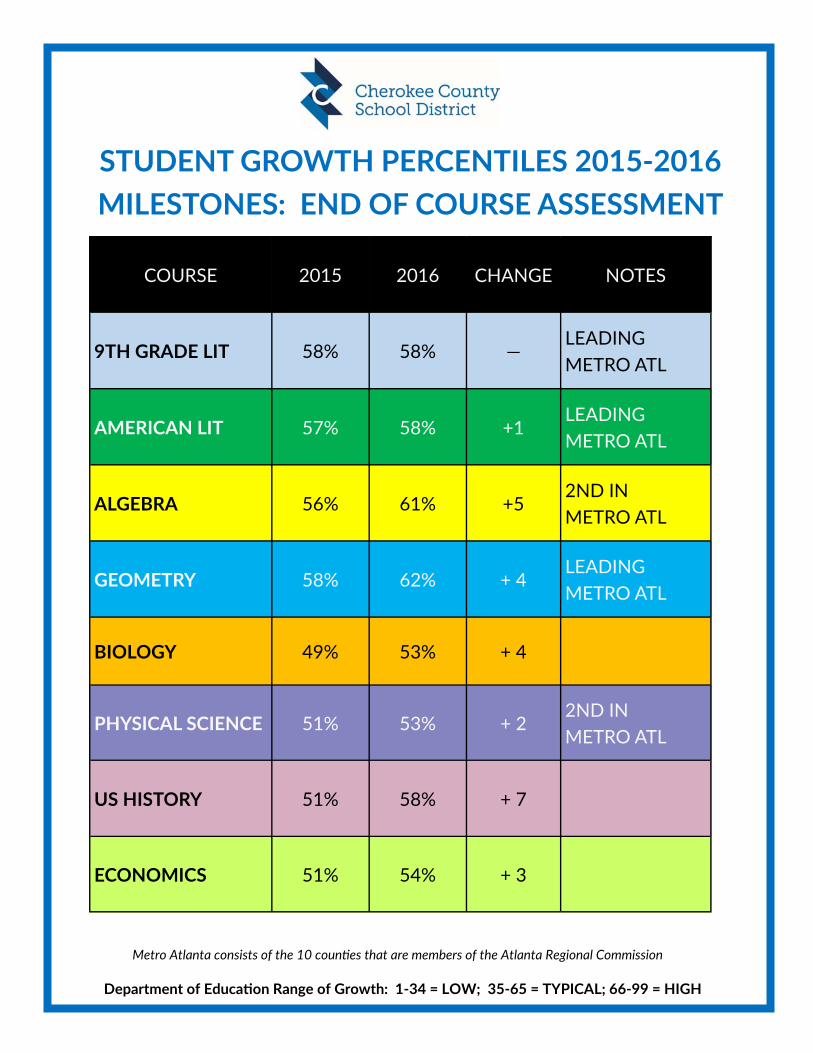
STUDENT GROWTH PERCENTILES 2015‐2016 MILESTONES: END OF COURSE ASSESSMENT
COURSE 2015 2016 CHANGE
9TH GRADE LIT 58% 58% —
AMERICAN LIT 57% 58% +1
ALGEBRA 56% 61% +5
GEOMETRY 58% 62% + 4
BIOLOGY 49% 53% + 4
PHYSICAL SCIENCE 51% 53% + 2
US HISTORY 51% 58% + 7
ECONOMICS 51% 54% + 3
NOTES
LEADING METRO ATL
LEADING METRO ATL
2ND IN METRO ATL
LEADING METRO ATL
2ND IN METRO ATL
Metro Atlanta consists of the 10 coun es that are members of the Atlanta Regional Commission
Department of Educa on Range of Growth: 1‐34 = LOW; 35‐65 = TYPICAL; 66‐99 = HIGH