
Our performance Our market Our strategy bp.com ...
36
06 Our performance 08 Our market 10 Our strategy bp.com/annualreview Annual Review 2009 Meeting the energy demands of today and tomorrow Oil Natural gas Wind Solar Biofuels Efficiency Operating at the energy frontiers How a revitalized BP is driving efficiency, momentum and growth
Transcript of Our performance Our market Our strategy bp.com ...

beyond petroleum®
06 Our performance 08 Our market 10 Our strategy bp.com/annualreview
Annual Review2009
Meeting the energy demands of today and tomorrow Oil Natural gas Wind Solar Biofuels Effi ciency
Operating at the energy frontiersHow a revitalized BP is driving effi ciency, momentum and growth

The Annual Review for the year ended 31 December 2009 includes the summary fi nancial statement (on pages 1-7 and 10-33), which comprises summaries of the Directors’ Report and the Directors’ Remuneration Report and a summary of the information in the consolidated fi nancial statements. The summary fi nancial statement complies with the information requirements under the Companies (Summary Financial Statement) Regulations 2008. It does not contain suffi cient information to allow as full an understanding of the results and the state of affairs of BP and of its policies and arrangements concerning directors’ remuneration as BP Annual Report and Accounts 2009. Shareholders may obtain a copy of BP Annual Report and Accounts 2009 online or on request, free of charge (see page 33). Outside the summarized fi nancial statements (see pages 24-28), references within BP Annual Review 2009 to ‘profi ts’, ‘result’ and ‘return on average capital employed’ are to those measures on a replacement cost basis unless otherwise indicated. The table below reconciles profi t for the year to replacement cost profi t.
For the year ended 31 December $ million
2009 2008 2007
Profi t before interest and taxation 26,426 35,239 32,352Finance costs and net fi nance expense/income relating to pensions and other post-retirement benefi ts (1,302) (956) (741)Taxation (8,365) (12,617) (10,442)Minority interest (181) (509) (324)Profi t for the year attributable to BP shareholders 16,578 21,157 20,845Inventory holding (gains) losses, net of tax (2,623) 4,436 (2,475)Replacement cost profi ta 13,955 25,593 18,370 Exploration and Production 24,800 38,308 27,602Refi ning and Marketing 743 4,176 2,621Other businesses and corporate (2,322) (1,223) (1,209)Consolidation adjustment – unrealized profi t in inventory (717) 466 (220)Replacement cost profi t before interest and taxation 22,504 41,727 28,794Finance costs and net fi nance expense/income relating to pensions and other post-retirement benefi ts (1,302) (956) (741)Taxation on a replacement cost basis (7,066) (14,669) (9,359)Minority interest (181) (509) (324)Replacement cost profi t attributable to BP shareholders 13,955 25,593 18,370Per ordinary share – cents Profi t for the year attributable to BP shareholders 88.49 112.59 108.76 Replacement cost profi t 74.49 136.20 95.85Dividends paid per ordinary share – cents 56.00 55.05 42.30
– pence 36.417 29.387 20.995Dividends paid per American depositary share (ADS) – dollars 3.360 3.303 2.538
a Replacement cost profi t refl ects the replacement cost of supplies. The replacement cost profi t for the year is arrived at by excluding from profi t inventory holding gains and losses and their associated tax effect. Inventory holding gains and losses represent the difference between the cost of sales calculated using the average cost to BP of supplies incurred during the year and the cost of sales calculated on the fi rst-in fi rst-out method, including any changes in provisions where the net realizable value of inventory is lower than its cost. Inventory holding gains and losses, for this purpose, are calculated for all inventories except for those that are held as a part of a trading position and certain other temporary inventory positions. BP uses this measure to assist investors in assessing BP’s performance from period to period. Replacement cost profi t for the group is a non-GAAP measure.
BP p.l.c. is the parent company of the BP group of companies. Unless otherwise stated, the text does not distinguish between the activities and operations of the parent company and those of its subsidiaries. The term ‘shareholder’ in this Annual Review means, unless the context otherwise requires, investors in the equity capital of BP p.l.c., both direct and/or indirect. BP Annual Report and Accounts 2009 and BP Annual Review 2009 may be downloaded from www.bp.com/annualreview. No material on the BP website, other than the items identifi ed as BP Annual Report and Accounts 2009 and BP Annual Review 2009, forms any part of those documents. As BP shares, in the form of ADSs, are listed on the New York Stock Exchange (NYSE), an Annual Report on Form 20-F will be fi led with the US Securities and Exchange Commission (SEC) in accordance with the US Securities Exchange Act of 1934. When fi led, copies may be obtained free of charge (see page 33). BP discloses in its Annual Report on Form 20-F 2009 and on its website at www.bp.com/NYSEcorporategovernancerules signifi cant ways (if any) in which its corporate governance practices differ from those mandated for US companies under NYSE listing standards.
Cautionary statementBP Annual Review 2009 contains certain forward-looking statements, particularly those relating to anticipated energy demand and consumption, global economic recovery, oil and gas prices, global reserves, expected future energy mix, management aims and objectives, strategy, production, refi ning margins, anticipated investment in Alternative Energy, Refi ning and Marketing investments, and reserves increases through technological developments. By their nature, forward-looking statements involve risks and uncertainties because they relate to events and depend on circumstances that will or may occur in the future. Actual results may differ from those expressed in such statements depending on a variety of factors including the timing of bringing new fi elds onstream, future levels of industry product supply, demand and pricing, operational problems, general economic conditions, political stability and economic growth in relevant areas of the world, changes in laws and governmental regulations, exchange rate fl uctuations, development and use of new technology, changes in public expectations and other changes in business conditions, the actions of competitors, natural disasters and adverse weather conditions, wars and acts of terrorism or sabotage, and other factors discussed elsewhere in this document and in BP Annual Report and Accounts 2009.
The registered offi ce of BP p.l.c. is 1 St James’s Square, London SW1Y 4PD, UK. Tel +44 (0)20 7496 4000. Registered in England and Wales No. 102498. Stock exchange symbol ‘BP’.
BP Annual Review 2009
Reconciliation of profi t for the year to replacement cost profi t
BP Annual Review 2009
Information for shareholders
33
Annual general meeting
The 2010 annual general meeting will be held on Thursday, 15 April 2010 at 11.30 a.m. at ExCeL London, One Western Gateway, Royal Victoria Dock, London E16 1XL. A separate notice convening the meeting is distributed to shareholders, which includes an explanation of the items of special business to be considered at the meeting. All resolutions of which notice has been given will be decided on a poll. Ernst & Young LLP have expressed their willingness to continue in offi ce as auditors and a resolution for their reappointment is included in Notice of BP Annual General Meeting 2010.
Dividends
We currently announce dividends on our ordinary shares in US dollars and state an equivalent sterling dividend. The rate of exchange used to determine the sterling amount equivalent is the average of the forward exchange rate in London over the fi ve business days prior to the announcement date. Dividends are normally paid in March, June, September and December. Holders of ordinary shares receive their dividends in sterling; holders of ADSs receive their dividends in US dollars. One ADS represents six ordinary shares. Subject to shareholder approval at the annual general meeting on 15 April, an optional scrip dividend programme, allowing shareholders to choose to receive dividends in the form of new fully paid shares or ADSs in BP p.l.c. instead of cash, will be available for future dividends. If approved, the requirements of the programme mean that there will be certain changes to our current dividend timetable. The programme would replace the company’s current dividend reinvestment plans.
More information
For more information on holding BP shares or ADSs, our investor centre at www.bp.com/investor contains information that you may fi nd helpful regarding your investment in BP. BP Annual Review 2009 contains a summary of certain information in BP Annual Report and Accounts 2009. For a full understanding of the results and state of affairs of BP and of its policies and arrangements concerning directors’ remuneration, please see BP Annual Report and Accounts 2009. To change how you receive shareholder documents, or if you have any queries about the administration of shareholdings, you should contact Equiniti (ordinary and preference shareholders) or JPMorgan (ADS holders). See www.bp.com/shareholderservices for more information.
AcknowledgementsDesign sasdesign.co.ukTypesetting Orb Solutions, LondonPrinting St Ives Westerham Press Ltd, UK, ISO 14001, FSC-certifi ed and CarbonNeutral®
Photography Action Images, Giles Barnard, Stuart Conway,Steven Croston, Jerry Davidson,Richard Davies, Joshua Drake,Damian Gillie, David Gold,Barry Halton, Simon Kreitem,Mark Lawrence, Ian McGregor,Marc Morrison, Aaron Tait,Graham Trott
Paper This Annual Review is printed on FSC-certifi ed Revive Pure White Uncoated. This paper has been independently certifi ed according to the rules of the Forest Stewardship Council (FSC) and was manufactured at a mill that holds ISO 14001 accreditation. The inks used are all vegetable oil based.
© BP p.l.c. 2010
Reports and publications
BP’s reports and publications are available to view online or download from www.bp.com/annualreview.
You can order BP’s printed publications, free of charge, from:
US and CanadaPrecision IRToll-free +1 888 301 2505Fax +1 804 327 [email protected]
UK and Rest of WorldBP Distribution ServicesTel +44 (0)870 241 3269Fax +44 (0)870 240 [email protected]
Annual Report and AccountsRead details of our fi nancial and operating performance in BP Annual Report and Accounts 2009 in print or online.www.bp.com/annualreport
Sustainability ReviewRead the summary BP Sustainability Review 2009 in print or read more online from April 2010.www.bp.com/sustainability

1
BP Annual Review 2009
What’s inside?
BP operates at the frontiers of the energy industry. We use world-class assets, technology, capability and know-how to meet energy needs and deliver long-term value.
The ingenuity and determination of our people have brought new resilience to BP. From deep beneath the ocean to complex refi ning environments, from remote tropical islands to next-generation biofuels – a revitalized BP is driving greater effi ciency, sustained momentumand business growth.
02 Chairman’s letter
04 Group chief executive’s review
06 Our performance
08 Our market
10 Our strategy
12 Our business performance
23 Our fi nancial performance
29 Independent auditor’s statement
30 Summary directors’ remuneration report
32 Board of directors
33 Information for shareholders
Exploration and ProductionStart-up was achieved ahead of schedule at Atlantis Phase 2 – one of many highlights during a year of strong operational performance.
Refi ning and MarketingTexas City illustrates the progress made on safe, reliable and compliant operations, with refi nery availability exceeding 90% in April 2009.
Cover imagesTop Deepwater Gunashli platform,
Azerbaijan sector of the Caspian Sea.Bottom left Seismic imaging vibrator trucks, Libya.Bottom right Texas City refi nery, US.
See page 12
See page 18

2
BP Annual Review 2009
Chairman’s letter
I have joined BP at an exciting and testing time for the energy industry and the wider world. Crisis in the global economy has asked tough questions of everyone. Meanwhile, two long-term issues require our continued attention – the high growth in energy demand expected over coming years, and the complex challenges created by climate change. Naturally, more and more people want to improve their quality of life, and a reliable supply of affordable energy is central to meeting their needs and aspirations. Sharing the benefi ts of energy with communities around the world represents important human progress, but this must be achieved with care. Such pressing matters place BP at the heart of what is important to society. While many of the group’s operations are conducted far from our towns and cities, what we produce is essential to everyday life. I have been here only a short time, but I have already seen in action the remarkable skills and technology that fi nd and extract raw materials and turn them into much-needed energy products. I am particularly impressed by the professionalism and sheer tenacity of the BP people I have met. There is a powerful spirit here. This spirit can be seen clearly within the executive team, under the leadership of Tony Hayward. Their focus on safety, operational performance and culture has produced great results across the group, despite tough market conditions. There is still more to do, and I look forward to working with them as BP moves forward. Our employees have also shown considerable determination over the past 12 months. They have helped to drive a notable and continuing business transformation and I thank them for their commitment.
Carl-Henric Svanberg Chairman26 February 2010
Highlights
BP playing key role in addressing the • energy challenge.
Strong board enhanced by new appointments.•
Powerful spirit among BP people.•
A revitalized BP

3
We will continue to contribute to debate around public policy, and intend to help shape and lead the energy industry of tomorrow. People need BP to keep doing what it does best. I recognize that many institutions and individuals rely on BP for a consistent return on their investment and the board takes seriously its responsibilities in this regard. Our task is to achieve the best balance of our sources and uses of cash, making investments to generate long-term business momentum while managing debt and realizing steady rewards for shareholders. Over the past year we have demonstrated our ability to achieve this despite a very volatile business environment. While we cannot control the price of oil we can control the effi ciency of our own operations, and the improving performance within the group will help us to balance fi nancial priorities. The quarterly dividend, to be paid in March, is 14 cents per share ($0.84 per ADS), the same as a year ago. In sterling terms, the quarterly dividend is 8.679 pence per share, compared with 9.818 pence a year ago. We are now proposing to introduce a scrip dividend programme. For those shareholders who choose to take their dividend in shares, rather than cash, the issuing of scrip shares is an attractive alternative. So, I thank shareholders for their continued support. The group has recently celebrated its centenary and I relish the opportunity to lead the board as we move into a second century. We operate in a fast-moving world full of profound challenges and opportunities, but I see no reason why a fi t and determined BP cannot thrive in this environment and remain at the heart of society for many years to come.
The success of BP today is, in many ways, testament to Peter Sutherland’s unique style in leading the board. As chairman for 12 years and non-executive board director for 14 years, Peter steered the group through many challenges. He leaves a strong BP that is well positioned for further success. As a board, we thank him for his exceptional contribution. We also thank those non-executives who are to leave after the annual general meeting. Sir Ian Prosser departs after 12 years of outstanding service, including 10 years as deputy chairman. Erroll Davis, Jr joined in 1998 and played an important role in key non-executive committees. Sir Tom McKillop joined in 2004 and chose to retire this year, having made a strong impression. I know my fellow board members greatly appreciate their contributions. We are now in the process of appointing experienced and talented newcomers to the board. I have worked closely with colleagues on the nominations committee to select individuals whose skills match the needs of the business while ensuring appropriate independence. As part of our continuing refreshment of the board, I am delighted that Paul Anderson has recently joined the board and that Ian Davis will join in April 2010. Our clear objective as a board is to sustain the success of the group and I can tell you that we will not lack ambition. BP has driven itself back to competitive fi tness; we must ensure we build on the hard work of the past three years and continue to grow a successful and enduring company. We now have the opportunity to plot the group’s future position within a changing energy landscape.
The fi nancial crisis has highlighted concerns about the way in which companies operate. In some cases, levels of trust between boards of directors and shareholders have been impacted. From my early contact with BP shareholders, I understand that the BP board has long been actively engaged in dialogue. I strongly endorse and encourage this and intend to build on such good practice. BP is respected for its leadership on governance and we will keep looking for ways to enhance how we govern and report on the group. Risk remains a key issue for every business, but at BP it is fundamental to what we do. We operate at the frontiers of the energy industry, in an environment where attitude to risk is key. The countries we work in, the technical and physical challenges we take on and the investments we make – these all demand a sharp focus on how we manage risk. We must never shrink from taking on diffi cult challenges, but the board will strive to set high expectations of how risk is managed and remain vigilant on oversight. As is well known, BP responded early to the issue of climate change. The group has made substantial investments in alternative energies and in lower-carbon fossil fuels such as natural gas. We support the low-carbon evolution, but must also continue to produce the high-quality hydrocarbons required by a world with a growing population, growing economies and greater mobility.
BP has driven itself back to competitive fi tness; we must ensure we build on the hard work of the past three years and continue to grow a successful and enduring company.
Our marketRead about key issues affecting the energy market on pages 8-9.

4
BP Annual Review 2009
Group chiefexecutive’s review
Performance has been restored and the group is competitive with the industry once again, so what priorities have you now set for BP?
Our priorities have remained absolutely consistent – safety, people and performance – and you can see the results of this focus with improvements on all three fronts. This year we have increased emphasis on operational effi ciency, with a particular focus on compliance and continuous improvement. Achieving safe, reliable and compliant operations is our number one priority and the foundation stone for good business. This year we achieved a reported recordable injury frequency of 0.34, an improvement of 20% over 2008. In Refi ning and Marketing reported major incidents have been reduced by 90% since 2005. All our operated refi neries and petrochemicals plants now operate on the BP operating management system (OMS), which governs how BP’s operations, sites, projects and facilities are managed. In Exploration and Production 47 of our 54 sites completed the transition to OMS by the end of 2009, and I expect all BP operations to be on OMS by the end of 2010. This represents good progress and we must remain absolutely vigilant.
Why are you putting such strong emphasis on operational effi ciency?
In 2009 we invested $20 billion in our businesses and realized more than $4 billion in cash costb savings, of which approximately 40% related to foreign exchange benefi ts and lower fuel costs. Within an organization of our scale, putting a long-term commitment to effi ciency at the heart of the group is essential to improving earnings, year after year. Our challenge is to maintain a relentless focus on continuous improvement, making today better than yesterday, so that we continue to drive the business forward whatever the market conditions.
What does the focus on effi ciency and continuous improvement mean for your people?
Better performance starts and ends with the actions of individuals and I want to thank our employees for the commitment they showed in 2009. Our performance speaks volumes b Cash costs are a subset of production and manufacturing expenses plus distribution and administration expenses. They represent the substantial majority of the expenses in these line items but exclude associated non-operating items and certain costs that are variable, primarily with volumes (such as freight costs). They are the principal operating and overhead costs that management considers to be most directly under their control although they include certain foreign exchange and commodity price effects.
2009 saw the continuation of diffi cult economic conditions and a volatile energy market, with rising demand for oil in non-OECD countries failing to offset lower levels of consumption in OECD countries. Oil prices began the year at $36.55 per barrel and recovered to $77.67 per barrel in December. Refi ning margins and gas prices fell sharply. Despite these diffi cult conditions, a revitalized BP kept up its momentum and delivered strong operating and fi nancial results while continuing to focus on safe and reliable operations. Replacement cost profi t for the year was $14 billion, with a return on average capital employeda of 11%. a The return on average capital employed on a replacement basis is the ratio of replacement cost profi t before interest expense and minority interest but after tax, to the average of opening and closing capital employed. Capital employed is BP shareholders’ interest, plus fi nance debt and minority interest.
Tony Hayward Group Chief Executive26 February 2010
Highlights
Progress on safe and reliable operations.•
Real momentum in growing our businesses.•
Continued focus on effi ciency and improvement.•
Effi ciency, momentumand growth
about their motivation and skills. The results from our 2009 employee survey confi rm that employee morale is improving as our operational performance improves. We have placed greater emphasis on organizational quality, which is about driving continuous improvement in our leadership and culture, skills and capability, and systems and processes. We have redesigned the way we manage and reward people to incentivize performance. We are simplifying the organization and freeing people to do their jobs. We are placing particular value on deep specialist skills and technical expertise, and are developing and recruiting the excellent professionals we need to ensure a sustainable future for the group.
How is this focus translating into performance in Exploration and Production?
2009 was an outstanding year. Reported production grew by 4% and unit production costs were down by 12%. We are now the largest producer in deepwater fi elds globally. In the Gulf of Mexico we ramped up production at Thunder Horse to more than 300,000 barrels of oil equivalent per day. Production started from Atlantis Phase 2, Dorado and King South. And in September we announced the Tiber discovery, the deepest oil and gas discovery well ever drilled. These successes make us the largest producer and leading resource holder in the deepwater Gulf of Mexico. During the year we also shipped the fi rst cargo of liquefi ed natural gas (LNG)from the Tangguh project in Indonesia, and we brought fi rst gas onstream at Savonette, Trinidad & Tobago, in record time. We also gained access to new resource opportunities in Iraq, Egypt, the Gulf of Mexico, Indonesia, Jordan and onshore US. We entered Iraq through a contract to expand production from the Rumaila fi eld near Basra, one of the largest oil fi elds in the world. Working with partners China National Petroleum Company (CNPC) and the Iraqi State Oil Marketing Organization (SOMO), we intend to grow production in Rumaila from approximately 1 million barrels per day to 2.85 million barrels per day. Overall, 2009 was the 17th consecutive year of delivering reported reserves replacement of more than 100%. Our success in adding reserves and resources gives us confi dence in our ability to grow oil and gas production.
5
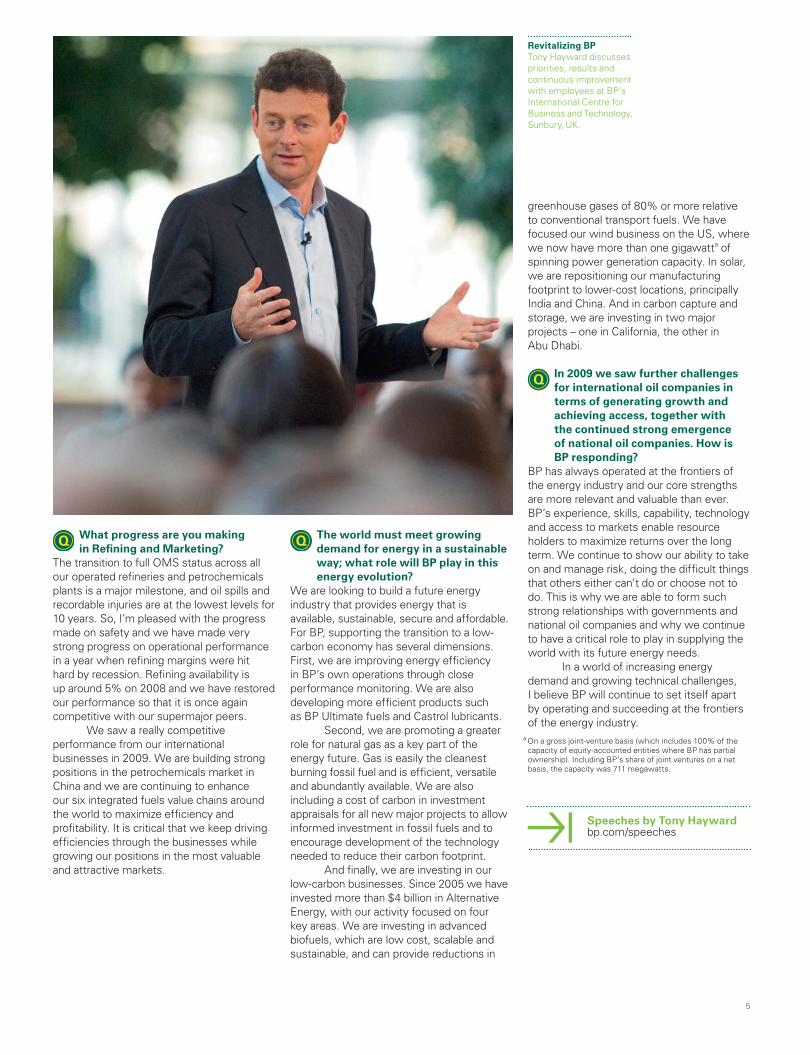
Revitalizing BP Tony Hayward discusses priorities, results and continuous improvement with employees at BP’s International Centre for Business and Technology, Sunbury, UK.
What progress are you making in Refi ning and Marketing?
The transition to full OMS status across all our operated refi neries and petrochemicals plants is a major milestone, and oil spills and recordable injuries are at the lowest levels for 10 years. So, I’m pleased with the progress made on safety and we have made very strong progress on operational performance in a year when refi ning margins were hit hard by recession. Refi ning availability is up around 5% on 2008 and we have restored our performance so that it is once again competitive with our supermajor peers. We saw a really competitive performance from our international businesses in 2009. We are building strong positions in the petrochemicals market in China and we are continuing to enhance our six integrated fuels value chains around the world to maximize effi ciency and profi tability. It is critical that we keep driving effi ciencies through the businesses while growing our positions in the most valuable and attractive markets.
The world must meet growing demand for energy in a sustainable way; what role will BP play in this energy evolution?
We are looking to build a future energy industry that provides energy that is available, sustainable, secure and affordable. For BP, supporting the transition to a low- carbon economy has several dimensions. First, we are improving energy effi ciency in BP’s own operations through close performance monitoring. We are also developing more effi cient products such as BP Ultimate fuels and Castrol lubricants. Second, we are promoting a greater role for natural gas as a key part of the energy future. Gas is easily the cleanest burning fossil fuel and is effi cient, versatile and abundantly available. We are also including a cost of carbon in investment appraisals for all new major projects to allow informed investment in fossil fuels and to encourage development of the technology needed to reduce their carbon footprint. And fi nally, we are investing in our low-carbon businesses. Since 2005 we have invested more than $4 billion in Alternative Energy, with our activity focused on four key areas. We are investing in advanced biofuels, which are low cost, scalable and sustainable, and can provide reductions in
greenhouse gases of 80% or more relative to conventional transport fuels. We have focused our wind business on the US, where we now have more than one gigawatta of spinning power generation capacity. In solar, we are repositioning our manufacturing footprint to lower-cost locations, principally India and China. And in carbon capture and storage, we are investing in two major projects – one in California, the other in Abu Dhabi.
In 2009 we saw further challenges for international oil companies in terms of generating growth and achieving access, together with the continued strong emergence of national oil companies. How is BP responding?
BP has always operated at the frontiers of the energy industry and our core strengths are more relevant and valuable than ever. BP’s experience, skills, capability, technology and access to markets enable resource holders to maximize returns over the long term. We continue to show our ability to take on and manage risk, doing the diffi cult things that others either can’t do or choose not to do. This is why we are able to form such strong relationships with governments and national oil companies and why we continue to have a critical role to play in supplying the world with its future energy needs. In a world of increasing energy demand and growing technical challenges, I believe BP will continue to set itself apart by operating and succeeding at the frontiers of the energy industry.
a On a gross joint-venture basis (which includes 100% of the capacity of equity-accounted entities where BP has partial ownership). Including BP’s share of joint ventures on a net basis, the capacity was 711 megawatts.
Speeches by Tony Haywardbp.com/speeches

Progress in 2009
BP Annual Review 2009
Our performance
Personal safety – reported recordable injury frequency
Process safety – oil spills Number of employeesa
Environment – greenhouse gas emissionsa (million tonnes of carbon dioxide equivalent)
Diversity and inclusion (%)
Employee satisfactiona (%)
Safety People
Reported recordable injury frequency (RIF) measures the number of reported work-related incidents that result in a fatality or injury (apart from minor fi rst aid cases) per 200,000 hours worked. Safety is BP’s number one priority and we constantly seek to improve our performance through our procedures, processes and training programmes. Our workforce RIF, which includes employees and contractors combined, was 0.34 in 2009 – signifi cantly lower than 0.43 in 2008 and 0.48 in 2007.
The overall Employee Satisfaction Index comprises 10 key questions that provide insight into levels of employee satisfaction across a range of topics such as pay. The improved performance in 2009 was underpinned by increases in the categories of ‘trust in management’ and ‘perceptions that BP is being effectively managed and well run’. This refl ects our clear, simple and consistent communication to employees of BP’s business performance and progress against corporate goals.
We report all spills of hydrocarbons greater than or equal to one barrel (159 litres, 42 US gallons). The reduction in the number of oil spills in 2009 follows several years of focus across BP on procedures such as ‘integrity management’ and ‘control of work’, which are core elements of BP’s operating management system.
Employees include all individuals who have a contract of employment with a BP group entity. In 2009 BP total headcount fell by 11,700, refl ecting the transfer of our US convenience retail sites to a franchise model and the progress we have made in making BP a simpler, more effi cient organization.
We report greenhouse gas (GHG) emissions, and emission reductions, on a CO2-equivalent basis including CO2 and methane. This represents all consolidated entities and BP’s share of equity-accounted entities except TNK-BP. The increase in GHG emissions in 2009 was driven primarily by increases in operational activity, in particular higher throughput from our US refi neries, the start-up of our Tangguh LNG project in Indonesia and increased production from deepwater platforms in the Gulf of Mexico.
Each year we record the percentage of women and individuals from countries other than the UK and US among BP’s top 492 leaders (2008 583, 2007 624). BP has maintained the percentage of female and ‘most-of-world’ leaders in 2009 and remains focused on building a more sustainable pipeline of diverse talent for the future.
6
EmployeesContractors
0.150.352007
0.592007
0.352008
0.502008
0.232009
0.43 2009
0.75
0.60
0.45
0.30
5162007
192007
142008
192008
142009
212009
25
20
15
10
WomenNon-UK/US
1003402007
3352008
2342009
500
400
300
200
a The People Assurance Survey conducted in 2006 used a census methodology and targeted the entire BP employee population. Based on the same set of questions, the Pulse Plus Survey, in 2008 and 2009, adopted a sample-based approach, which achieved a representative view of BP.
20662006
592008
652009
100
80
60
40
a As at 31 December.
2598,1002007
92,0002008
80,3002009
125
100
75
50
2063.52007
61.42008
65.02009
100
80
60
40
a See BP Sustainability Review 2009 for more information on how we derive our sustainable GHG reductions.

Reserves replacement ratioa (%) Dividends paid per ordinary share
Refi ning availability (%) Total shareholder returna (%)
Production (thousand barrels of oil equivalent per day) Replacement cost profi t per ordinary share (cents)
Operating cash fl ow ($ billion)
Performance
We report crude oil, natural gas liquids (NGLs) and natural gas produced from subsidiaries and equity-accounted entities. These are converted to barrels of oil equivalent (boe) at 1 barrel of NGL = 1boe and 5,800 standard cubic feet of natural gas = 1boe. Reported production increased by 4% compared with 2008. This refl ected strong performance from our existing assets, the continued ramp-up of production following the start-up of major projects in 2008 and the start-up of a further seven major projects in 2009.
Replacement cost profi t refl ects the replacement cost of supplies. It is arrived at by excluding from profi t inventory holding gains and losses and their associated tax effect.(See footnote a on inside front cover.) Our 2009 results were impacted by lower oil and gas realizations and lower refi ning margins, partly offset by higher production, stronger operational performance and lower costs.
Operating cash fl ow is net cash fl ow provided by operating activities, from the group cash fl ow statement. Operating activities are the principal revenue-generating activities of the group and other activities that are not investing or fi nancing activities. Lower operating cash fl ow in 2009 primarily refl ected lower group profi ts, movements in working capital and a decrease in dividends from jointly controlled entities and associates. These effects were partly offset by decreases in income taxes paid.
Proved reserves replacement ratio (also known as the production replacement ratio) is the extent to which production is replaced by proved reserves additions. The ratio is expressed in oil equivalent terms and includes changes resulting from revisions to previous estimates, improved recovery and extensions, and discoveries. In 2009 we extended our track record for reported reserves replacement of more than 100% to 17 consecutive years. We continue to drive renewal through new access, exploration, targeted acquisitions and a strategic focus on increasing resources from fi elds we currently operate.
This measure shows the total dividend per share paid to ordinary shareholders in the year. The total dividend paid per share in 2009 increased by 2% compared with 2008. We determine the dividend in US dollars as it is the economic currency of BP. In sterling terms, our 2009 dividend was 24% higher than in 2008 due to the strengthening of the dollar relative to sterling.
Refi ning availability represents Solomon Associates’ operational availability, which is defi ned as the percentage of the year that a unit is available for processing after subtracting the annualized time lost due to turnaround activity and all planned mechanical, process and regulatory maintenance downtime. Refi ning availability has increased signifi cantly each year from 2007 to 2009 and is now at the highest level since 2005. This has been a key element in our drive to restore missing revenues in our operations, with the biggest contributor being the restoration of our Texas City refi nery.
Total shareholder return represents the change in value of a shareholding over a calendar year, assuming that dividends are re-invested to purchase additional shares at the closing price applicable on the ex-dividend date. Total shareholder return scores in 2009 refl ect BP’s improving competitive performance as well as a general recovery of global stock markets compared with the low levels seen at the end of 2008.
7
CentsPence
1542.302007
20.9952007
55.052008
29.3872008
56.002009
36.4172009
75
60
45
30
-20
2007 20072008-34.6
2008-15.1
2009 2009
40
20
60
0
ADS basisOrdinary share basis
6.8 33.0 27.614.1
3,2503,8182007
3,8382008
3,9982009
4,250
4,000
3,750
3,500
a Combined basis of subsidiaries and equity-accounted entities, excluding acquisitions and disposals.
301122007
1212008
1292009
150
120
90
60
2082.92007
88.82008
93.62009
100
80
60
40
1024.72007
38.12008
27.72009
50
40
30
20
4095.852007
136.202008
74.49 2009
200
160
120
80
a There is a small change in comparative data due to the exclusion of non-trading days from the average TSR calculation.

Economic environment heavily impacted oil and gas prices.•
Refi ning margins fell sharply.•
Long-term energy demand expected to rise.•
Crude oil prices World oil consumption declined for a second successive year during 2009, with growing demand in non-OECD countries once again more than offset by falling consumption in OECD countries. Dated Brent for the year averaged $61.67 per barrel, about 37% below 2008’s record average of $97.26 per barrel. Prices began the year at their lowest point for 2009 as the world economy grappled with the sharpest downturn in modern economic history. In 2010 we expect oil price movements to continue to be driven by the extent of global economic growth and its resulting implications for oil consumption, and by OPEC production decisions. Natural gas prices Natural gas prices weakened in 2009 and were volatile. The average US Henry Hub First of Month Index fell to $3.99 per million British thermal units (mmBtu) in 2009, a 56% decrease from the record $9.04/mmBtu average seen in 2008. Recession-induced demand declines and strong production caused prices to drop from $6.16/mmBtu at the start of the year to $2.84/mmBtu in September. Reduced imports from Canada, slowing US production growth and cooler temperatures allowed prices to recover to $4.49/mmBtu by year-end. Prices at the UK National Balancing Point similarly fell to an average of 30.85 pence per therm, 47% below the 2008 average price of 58.12 pence per therm. Gas markets in 2010 are expected to follow developments in the global economy, but any price movements are likely to be impacted by signifi cant new LNG capacity as it becomes available.
BP Annual Review 2009
Our marketRefi ning marginsRefi ning margins fell sharply in 2009 as demand for oil products reduced in the wake of the global economic recession and new refi ning capacity came onstream, mostly in Asia Pacifi c. The BP global indicator refi ning margin (GIM)b averaged $4 per barrel last year, down $2.50 per barrel compared with 2008. Refi ning margins are likely to remain under pressure through 2010, with capacity already exceeding demand and additional new capacity expected to come onstream during the year.
Looking aheadRecent economic conditions have weakened global demand for primary energy, but a number of forecasts predict a return to growth in the medium term. Under the International Energy Agency’s (IEA) Reference Scenario, global energy demand is projected to increase by around 40% between 2007 and 2030a. That scenario also projects that fossil fuels will still be satisfying as much as 80% of the world’s energy needs in 2030. At current rates of consumption, the world has enough proved reserves of fossil fuels to meet these requirementsc if investment is permitted to turn those reserves into production capacity. A more diverse mix of energy will also be required to meet this increased demand. Such a mix is likely to include both unconventional fossil fuel resources – such as oil sands, coalbed methane and natural gas produced from shale formations – and renewable energy sources such as wind, biofuels and solar power. Beyond simply meeting growth in overall demand, a diverse mix would also help to provide enhanced national and global energy security while supporting the transition to a lower-carbon economy. Improving the effi ciency of energy use will also play a key role in maintaining energy market balance in the future. Along with increasing supply, we believe the energy industry will be required to make hydrocarbons cleaner and more effi cient to use – particularly in the critical area of power generation, for which the key hydrocarbons are currently coal and gas. We believe that in many countries natural gas has the potential to provide the most signifi cant reductions in carbon emissions from power generation in the shortest time and at the lowest cost. These reductions can be achieved using technology available today. Alternative energies such as wind, solar, wave, tide and geothermal energy have the potential to make a substantial contribution to the transition to a lower-carbon economy but, even in the most aggressive scenario put forward by the IEA, these forms of energy are estimated to meet no more than 5% of total demand in 2030d. a World Energy Outlook 2009. © OECD/IEA 2009, pages 622-623: ’Reference Scenario, World’. b The GIM is the average of regional industry indicator margins weighted for BP’s crude refi ning capacity in each region. See www.bp.com/investors for more information. c BP Statistical Review of World Energy June 2009. This estimate is not based on proved reserves as defi ned by SEC rules. d World Energy Outlook 2009. © OECD/IEA 2009, page 212: ‘World primary energy demand by fuel in the 450 Scenario (Mtoe)’.
Energy markets remained volatile in 2009, refl ecting the dramatic drop in world economic activity early in the year and indications of economic recovery in the second half. Looking ahead, the long-term outlook is one of growing demand for energya, particularly in Asia, alongside challenges for the industry in meeting this demand.
Meeting the world’s energy needs
8
BP Statistical Review of World Energy June 2009bp.com/statisticalreview
How BP is respondingRead about our strategy on pages 10-11.

Crude oil and gas prices, and refi ning margins ($ per barrel of oil equivalent)
Global energy demand by type (billion tonnes of oil equivalent)
Source: Platts/BP.
Source: World Energy Outlook 2009. © OECD/IEA 2009, page 622: ‘Reference Scenario, World’; and pages 196-197; as adapted by BP.
Once again, energy prices followed economic headlines. In the early part of the year crude oil and gas prices clearly refl ected recession, including the decline in global demand for energy. The second half saw oil prices rise in line with the start of economic recovery. Strong production during 2009, together with expected increases in LNG capacity in 2010, served to constrain the recovery in natural gas prices. Refi ning margins fell sharply during the year and, in the fourth quarter, were at the lowest levels for 15 years.
The current IEA reference scenario describes strong long-term growth, with fossil fuels remaining dominant and oil the single largest fuel in the mix. Other renewables will grow rapidly but account for just 2% of total energy demand by 2030. However, this scenario describes a future in which governments have made no change to current energy policies and measures. It is likely that policy responses to climate change, energy security and energy poverty will profoundly affect future outcomes.
World energy consumption (billion tonnes of oil equivalent)
Source: BP Statistical Review of World Energy June 2009.
Range of carbon dioxide emission trajectories (gigatonnes)
Source: World Energy Outlook 2009. © OECD/IEA 2009, page 210: ‘Table 5.4 Domestic CO2 emissions by region in the 450 Scenario (Mt); page 623: ‘Reference Scenario, World’; and page 74; as adapted by BP.
In the IEA’s reference scenario carbon emissions continue to grow, putting the world on a path to greenhouse gas (GHG) concentration levels that many scientists regard as dangerously high. The IEA has developed an alternative case to illustrate the implications of setting a target to stabilize GHG concentrations at 450 parts per million, which it believes would offer a reasonable chance of limiting the rise in global temperature to 2˚C. This alternative case requires strong co-ordinated action to promote energy effi ciency and low-carbon fuels, starting in the OECD but extending rapidly to non-OECD countries.
Oil remained the world’s dominant fuel in 2008, but lost market share to coal and natural gas. According to BP Statistical Review of World Energy June 2009, oil’s share of the world total has fallen from 38.7% to 34.8% over the past decade, while coal, natural gas and hydroelectric generation have all increased.
9
4
8
12
16
20Other renewablesBiomass and wasteCoalHydroelectricityNuclear energyNatural gasOil
1990 2007 2015 2030
40
45
2005
IEA reference scenario450 parts per million policy scenario
202020152010 20302025
25
35
30
120
150
2004
Dated Brent oil priceHenry Hub gas price (First of Month Index)Global indicator refining margin (GIM)
2005 2006 2007 2008 2009
30
90
60
2003
CoalHydroelectricityNuclear energyNatural gasOil
2004 2005 2006 2007 2008
12
14
10
8
6
4
2

Safe, reliable and compliant operations remain fi rst priority. •
Strong emphasis on continuous improvement.•
Exploration and Production remains core vehicle for growth.•
Our strategy is to invest competitively to grow oil and gas production while working to drive performance across the group through enhanced operating effi ciency, capital effi ciency and cost effi ciency. To meet growing world demand, BP is committed to exploring, developing and producing more fossil fuel resources; manufacturing, processing and delivering better and more advanced products; and enabling the transition to a lower-carbon future. We aim to do this while operating safely, reliably and in compliance with the law. We strive to run our business within the discipline of a clear fi nancial framework. In 2009 we improved our overall competitive performance by enhancing operating performance and reducing complexity and costs. Our intention is to generate and sustain business momentum and growth through a rigorous process of continuous improvement and an ongoing focus on safety, people and performance.
Safety, reliability, compliance and continuous improvementSafe, reliable and compliant operations remain the group’s fi rst priority. A key enabler for this is the BP operating management system (OMS), which provides a common framework for all BP operations, designed to achieve consistency and continuous improvement in safety and effi ciency. Alongside mandatory practices to address particular risks, OMS enables each site to focus on the most important risks in its own operations and sets out procedures on how to manage them in accordance with the group-wide framework.
The right people, skills and capability Despite a tight global recruitment market for some of our core technical disciplines, we have been successful in building capacity and getting the right people with the right skills in the right place.
BP Annual Review 2009
Our strategyWe are now going further, strengthening the culture within BP through a commitment to continuous improvement in operations and enhancing the capabilities, technical expertise and organizational quality needed to drive performance.
Enhanced performance and effi ciencyOur strategy aims to create value for shareholders by investing to deliver growth in our Exploration and Production business together with enhanced effi ciency and high-quality earnings and returns throughout our operations. In Exploration and Production our strategy is to invest to grow production safely, reliably and effi ciently by strengthening our portfolio of leadership positions in the world’s most prolifi c hydrocarbon basins, enabled by the development and application of technology and strong relationships based on mutual advantage. We intend to sustainably drive cost and capital effi ciency in accessing, fi nding, developing and producing resources, enabled by deep technical capability and a culture of continuous improvement. In Refi ning and Marketing our strategic focus is on enhancing portfolio quality, integrating activities across value chains and performance effi ciency. We expect to continue building our business around advantaged assets in material and signifi cant energy markets while improving the safety and reliability of our operations. Our objective is to achieve sector-leading levels of performance on a sustainable basis. To achieve this, we need to continue upgrading the manufacturing capabilities within our integrated fuels value chains to achieve the best capacity utilization and margin capture. We continue to explore appropriate opportunities to deploy downstream capital into faster-growing non-OECD markets. We also intend to continue our selective investment in our international businesses, which include petrochemicals and lubricants, where we see potential to deliver strong and sustainable returns. In Alternative Energy we have focused our investments in the areas where we believe we can create the greatest competitive advantage. We have substantial businesses in wind and solar power and are developing advanced biofuels and clean energy technologies such as hydrogen power and carbon capture and storage. We believe that this focused portfolio has the potential to be a material source of value creation for BP in the longer term.
Looking aheadWe intend to play a central role in meeting the world’s continued need for hydrocarbons. We are creating long-term options for the future in new energy technology and low-carbon energy businesses. We are also enhancing our capabilities in natural gas, which is likely to be a vital source of relatively clean energy during the transition to a lower-carbon economy and beyond. We intend to lead and shape this transition while working to achieve sector-leading levels of return for shareholders.
Sustaining momentum and growth
10
The priorities that drove our success in 2009 – safety, people and performance – remain the foundation of our agenda as we build on our momentum and work to further enhance our competitive position.
How we create value
Powerful partnerships grounded in mutual advantage.
Deep technical capability and culture of continuous improvement.
A highly diverse energy portfolio, pioneering energy effi ciency and innovation.

3 UK On the Clair platform in the North Sea. The culture of continuous improvement in our North Sea drilling team helped improve drilling capital effi ciencies in 2009.
4 US Employees in our trading centre, Houston. Our focus on getting the right people with the right skills in the right place is helping to drive effi ciency, momentum and growth.
5 BrazilCane harvest at our Brazilian biofuels joint venture, which completed its fi rst 12 months of operations in 2009. This was a key milestone in a year when BP’s biofuels business was voted Biofuels Corporation of the Year by the World Refi ning Association.
1 2 1 USWe have now restored every major unit at our Texas City refi nery. All BP-operated refi neries and petrochemicals plants are now operating on the BP OMS.
2 China Purifi ed terephthalic acid (PTA) is an essential raw material in the manufacture of plastic bottles and polyester clothes. BP has a very strong manufacturing position in the largest PTA market – China. Our Zhuhai 2 plant is the world’s largest single-train unit and one of the lowest-cost PTA manufacturing units in the world.
54
3

12
2009 was an excellent year for Exploration and Production. We improved personal safety and process safety, grew production and improved effi ciency. We extended our track record for reported reserves replacement to 17 years and made outstanding progress in securing resources to support long-term growth.
Highlights
5% underlying production growth• a, with strong operational performance.
12% reduction in unit production costs. •
17th consecutive year of reported reserves replacement • of more than 100%.
Tiber discovery in the deepwater Gulf of Mexico and three • further discoveries in Block 31 in Angola.
New resource access in Iraq, Jordan, Egypt, Indonesia, • the Gulf of Mexico and onshore US.
Tangguh and six other major projects brought onstream.•
What we doBP’s Exploration and Production business fi nds, develops, produces and transports oil and gas to market. We operate in 30 countries and employ 21,500 people.
Our strategyOur strategy is to invest to grow production safely, reliably and effi ciently by: • Strengthening our portfolio of leadership positions in
the world’s most prolifi c hydrocarbon basins, enabled by the development and application of technology and strong relationships based on mutual advantage.
• Sustainably driving cost and capital effi ciency in accessing, fi nding, developing and producing resources, enabled by deep technical capability and a culture of continuous improvement.
Our performanceMaintaining our focus on safetySafety, both personal and process, remains our highest priority. 2009 brought further improvement in personal safety with the segment’s reported recordable injury frequency improving from 0.43 in 2008 to 0.39 in 2009. We also achieved improvements in the number of process safety-related incidents and a signifi cant reduction in the number of spills. During the year we continued our migration to the BP operating management system (OMS), which provides an increased focus on process safety and continuous improvement. By the end of 2009, 87% of our operating sites had transitioned to OMS. In 2009 a third-party-operated helicopter carrying contractors from BP’s Miller platform crashed in the North Sea, resulting in the tragic loss of 16 lives. In addition, we sustained two fatalities within our own operations. We deeply regret the loss of these lives.
Our fi nancial performance in 20092009 was a successful year, with positive fi nancial and operational momentum despite a backdrop of weaker oil and gas prices. Replacement cost profi t before interest and tax was $24.8 billion – a 35% decrease compared with the record level in 2008. This result was primarily driven by lower oil and gas realizations, offset in part by strong underlying production growth of 5% and improved cost management, which contributed to a 12% reduction in unit production costs. Production from our established centres, including the North Sea, Alaska, North America Gas and Trinidad & Tobago was on plan, with improved operating effi ciency for the segment as a whole. We had strong production growth in the Gulf of Mexico, including excellent performance from Thunder Horse, together with start-ups ahead of schedule for Atlantis Phase 2, Dorado and King South. Production from Egypt and TNK-BP also made a strong contribution to our growth. The reduction in production costs was achieved through a combination of high-grading activity, improved execution effi ciency, capturing the benefi ts of the defl ationary cost environment at the beginning of the year and favourable foreign exchange effects. This was done while maintaining our focus on safety and integrity. We also improved the quality of our procurement and supply-chain management organization, systems and processes, which we expect will help deliver sustained cost effi ciency in the future.
BP Annual Review 2009
Our business performance
Exploration and Production
Andy InglisChief Executive, Exploration and Production
Exploration and Production Results ($ million)
0 5,000 20,000 35,00030,00010,000 15,000 25,000
24,8002009
38,3082008
a Underlying production growth excludes the effect of entitlement changes in our production-sharing agreements (driven by changes in oil and gas prices) and the effect of OPEC quota restrictions.
Replacement cost profi t before interest and tax is our key measure of profi tability. The decrease in 2009, compared with the record level in 2008, was primarily driven by lower oil and gas realizations, offset in part by strong underlying production growth of 5% and improved cost management, which contributed to a 12% reduction in unit production costs.

Deepwater expertiseBP is the leading operator in the deepwater Gulf of Mexico. We are the biggest producer, the leading resource holder and have the largest exploration acreage position. Thunder Horse is now the largest single producing fi eld in the Gulf of Mexico. Fully operational and performing beyond expectations, it has enabled us to grow our Gulf of Mexico production from 240,000 barrels of oil equivalent per day in 2007 to more than 400,000 barrels of oil equivalent per day in 2009. During the year we also started production at three new projects – Atlantis Phase 2, Dorado and King South. 2009 was another year in which our technical capabilities led to exceptional exploration success. The Tiber oil discovery saw us execute the deepest oil and gas discovery well ever. With new discoveries, successful start-ups, effi cient operations and a strong portfolio of new projects, we are exceptionally well placed to sustain our success in the deepwater Gulf of Mexico over the long term.
Images1 Operations on the Thunder Horse platform,
Gulf of Mexico.2 Drilling riser on the Thunder Horse platform.3 The drillship Transocean Discoverer Enterprise.4 Atlantis platform, Gulf of Mexico.
1
32
4

14
Pakistan
Indonesia
EgyptJordan Iraq
Angola
Gulf of Mexico
Texas
Canada
BP Annual Review 2009Our business performance
We started up the Tangguh LNG project in 2009, with the fi rst LNG cargo shipped from West Papua in Indonesia to South Korea just over four years after fi nal project sanction. Tangguh is a major new resource to global energy markets, adding around 7.6 million tonnes of LNG for export per year. Located more than 3,000 kilometres east of the Indonesian capital Jakarta, hundreds of miles from the nearest major city, and accessible only by air or sea, the project faced environmental, social and technical challenges. It was nevertheless delivered in record time and is now one of the world’s most sophisticated and effi cient LNG projects. Its success is a tribute to the close co-operation throughout its development between BP, the Government of Indonesia, regulators, partners, contractors and the local communities in Papua. In Trinidad we started production from Savonette. Here, gas will supply Atlantic LNG’s liquefaction plant for export as LNG to international markets, as well as the domestic market. The Savonette platform is the fourth in a series of normally unmanned installations developed using an effi cient, standardized approach to platform design and construction. Through TNK-BP we saw the start-up of another two projects in Russia, in the northern hub of Kamennoye and in the Urna and Ust-Tegus fi elds in the Uvat area. Also in 2009 we saw the full benefi t of our 2008 start-ups, including Thunder Horse in the Gulf of Mexico, and the Saqqara and Taurt fi elds in Egypt.
Developing fl agship technologiesDeveloping and applying new technology is the key to increasing recovery from our resource base and operating safely and more effi ciently. Technology also affords us a competitive advantage when bidding for new access opportunities. We focus on technologies with the potential to have the greatest impact on our business – we call them fl agship technologies – and we prioritize our research and development and technology investments here. We have 10 fl agship technologies and consider that each has the potential to add more than 1 billion barrels of oil equivalent of additional reserves.
Transforming potential into productionIn 2009 we operated more enhanced oil recovery projects in conventional oil fi elds than any of our major competitors and this helped us retain our industry-leading track record on reported reserves replacement. Our know-how and technologies are enabling us to maximize new resources and reawaken signifi cant, well-established fi elds such as Samotlor in Russia and now Rumaila in Iraq. Some 60% of BP’s oil production is supported by water fl ooding – the technique of using water to help push oil out of reservoirs. By developing new technologies to increase recovery beyond conventional water fl ooding, such as Bright Water™ and LoSal™, we have the potential to shift today’s technical limit and further improve recovery factors. We have now performed 38 Bright Water™ treatments in Alaska, Argentina and Pakistan, which have delivered an increase of more than 9 million barrels to our recoverable volumes at a development cost of less than $6 per barrel.
Growing our resource base Our oil and gas resource base provides the foundation for future growth. Each year we set out to replace more reserves of oil and gas than we produced in the previous 12 months. 2009 was the 17th consecutive year we achieved this, delivering reported reserves replacement of 129%. We continue to drive renewal through new access, exploration, targeted acquisitions and a strategic focus on increasing resources from fi elds we currently operate. In 2009 our exploration track record continued with the Tiber discovery in the deepwater Gulf of Mexico, three further discoveries in the ultra deepwater Block 31 in Angola, and in Canada, where we discovered natural gas with the Ellice J27 well. We were also successful in accessing substantial new resource opportunities in Iraq (Rumaila), Egypt, the Gulf of Mexico, Indonesia (Sanga Sanga coalbed methane and, subject to Government of Indonesia approval, West Papua Blocks I and III) and Jordan. We also acquired new resources, adding to our shale gas portfolio with a transaction to access acreage in the Eagle Ford Shale in south Texas, which provides the potential for further growth of our North America Gas business.
Project start-upsIn 2009 we brought seven major projects onstream. We continue to grow our position and leverage our experience as the largest producer in the Gulf of Mexico, starting up three projects ahead of schedule, including the second phase of Atlantis.
Exploration success in 2009 has created the basis for an exciting future. We drilled the deepest oil and gas discovery well ever to make the Tiber discovery in the deepwater Gulf of Mexico. We are setting world records for land 3D seismic data acquisition rates in Libya and acquired the most northerly 3D survey on the planet, in Canada. We continued to build interests in the Gulf of Mexico, Egypt, Indonesia, Pakistan and in US shale gas, and we made major new entries into Iraq and Jordan.
Exploration discoveriesNew access
Exploration discoveries and access success in 2009

A new spirit We continue to drive effi ciency into every part of our business. Improving capital effi ciency in our projects and our worldwide drilling operations illustrates our progress. In 2009, for example, we achieved a BP record launch-to-production time of 18 months with the Savonette project, in Trinidad & Tobago. This is the fourth of our ‘clone’ platforms, which follow a standardized design that optimizes the effi ciency of each new platform. Meanwhile, the culture of continuous improvement in our North Sea drilling team helped to move drilling performance from fourth quartile in 2007 to fi rst quartile in 2008a, and generated additional drilling capital effi ciencies in 2009. New technology is being deployed in the North Sea too, with conductor splitting technology alone doubling the number of wells we can drill from one platform. As BP North Sea Wells vice president Morty Denholm expresses it: “Our people are now really motivated and looking forward to delivering even better performance next year.”
a BP Drilling and Completions Global Benchmarking.
Images1 Our Eastern Trough Area Project platform,
North Sea.2 Atlantic LNG facility, Trinidad & Tobago.3 Operations on the Harding platform, North Sea.4 Cassia platform, Trinidad & Tobago.
33 4
211
2

2
4
3
OMS at the front lineBP’s operating management system (OMS) provides us with a systematic framework for safe, reliable and effi cient operations. Throughout 2009 OMS helped us to deliver continuous improvement in how we manage our people, processes, plant and performance. From onshore facilities to offshore platforms, a total of 47 exploration and production operating sites completed their transition to OMS by the end of 2009, with the remaining seven sites on track to transition to OMS in 2010. North America Gas has led the way, with all 16 of its sites already up and running on OMS. Ultimately, OMS is about helping BP people identify and eliminate defects and deliver tangible improvements at the front line, day after day after day. In the words of Mike Rees, production foreman at our Whitney Canyon facility: “The OMS process of identifying gaps, establishing priorities, setting targets and assigning accountabilities has streamlined our annual business planning process and is driving improvements into our system.” OMS represents a step-change in operational management, but there is no fi nishing line. As each site transitions to OMS its focus switches to driving continuous improvement.
Images1 Central gas facility, Prudhoe Bay, Alaska.2 Rhourde El Baguel oil fi eld, Algeria.3 Drilling operations at the Arkoma Basin,
Oklahoma, US.4 Permian Basin, Texas, US.
1

17
10,511
7,781
Liquids c
Natural gas
Unconventional thinkingNatural gas is the cleanest burning fossil fuel. It will play an important role on the pathway to a low-carbon future, especially in power generation. In the US there has been a revolution in the natural gas business in the past few years with the introduction of new technologies to produce unconventional gas – ‘unconventional’ because the gas is in rock formations whose geology makes production particularly diffi cult. BP is an industry leader in the technical innovation required to produce unconventional gas. In the US we have successfully developed and trialled a range of pioneering technologies, including new approaches to fi nding and producing the gas – from advanced imaging to hydraulic fracturing and multilateral drilling. By applying our proven know-how and technologies we have also been able to access signifi cant new resources in Oman and Jordan, and extend the life of our established fi elds in Algeria. Through pushing the limits of what is possible, we are helping to unlock one of the world’s most valuable natural resources.
BP Annual Review 2009Our business performance
These technologies cover every stage in the exploration and production process, from seismic imaging to advanced control systems, and we are industry leaders in many of these areas. Through enhanced oil recovery technologies, we are pushing recovery factors to new limits. By increasing the overall recovery factor from our fi elds by 1%, we believe we can add 2 billion barrels of oil equivalent to our reserves.
Investing in people It is essential that we have the right people in the right roles and a pipeline of highly capable and talented individuals for the future. We build and renew our talent pool through our global graduate programme, and in 2009 recruited more than 300 graduates. We support career development within Exploration and Production through 10-year-career road maps to professional excellence. From 2010 our new Exploration and Production learning centre in Houston, US, will provide a comprehensive learning curriculum of technical training.
Looking aheadIn 2010 we aim to use the momentum generated in 2009 to continue to improve operational, cost and capital effi ciency, while ensuring we maintain our priorities of safe, reliable and effi cient operations. We intend to continue to focus on building personnel and technological capability for the future. We believe our portfolio of assets is strong and well positioned to compete and grow in a range of external conditions and we will continue to grow our resource base and build people and technological capability for the future. Also in 2010, we intend to create a centralized developments organization to deliver our major projects. By bringing our project expertise into one team, we expect to continue our drive for improved capital effi ciency by fully optimizing our project designs and improving project execution.
E&P in more detailbp.com/whatwedo
Our marketRead about key issues affecting our market on pages 8-9.
Seismic shift Each new major discovery, like Tiber in the deepwater Gulf of Mexico in 2009, underlines the exceptional value we gain from our investment in advanced seismic technology. BP-developed technologies such as the wide azimuth towed streamer (WATS) – which uses multiple sound sources to generate richer data – are enabling us to discover reservoirs previously obscured by features such as sub-sea salt. Advanced technologies are also enabling us to generate far more accurate images of new and existing reservoirs, so we can place wells in the best locations to maximize recovery and effi ciency. As we survey at scale, costs are critical. Our proprietary independent simultaneous sweeping (ISS)a technique – pioneered in Oman in 2008 and deployed in Libya in 2009 – has made large-scale land surveys fast and affordable. While seismic surveying often takes place in tough terrain, from deserts to deepwater, the frontiers of data processing can be equally challenging. Our high-performance super-computing centre uses 3,000 terabytes of disk to organize and analyse survey data, 24 hours a day. This combination of higher-quality and lower-cost surveying with powerful processing is enabling us to achieve a seismic shift in exploration.
a ISS is a new technique developed by BP geophysicists. It enables us to survey up to 30 square kilometres of desert each day.
Total net proved reserves 2009 a b
(million barrels of oil equivalent)
a Combined basis of subsidiaries and equity-accounted entities, on a basis consistent with general industry practice.
b On 31 December 2008 the SEC published a revision of Rule 4-10 (a) of Regulation S-X for the estimation of reserves. These revised rules form the basis of the 2009 year-end estimation of proved reserves and the application of the technical aspects resulted in an immaterial increase of less than 1% to BP’s total proved reserves.
c Crude oil, condensate and natural gas liquids.
2009 was our 17th consecutive year of delivering reported reserves replacement of more than 100%.

18
BP Annual Review 2009Our business performance
Refi ning and Marketing
Iain ConnChief Executive, Refi ning and Marketing
Refi ning and Marketing Results ($ million)
In 2009 the replacement cost profi t before interest and tax was heavily impacted by non-operating itemsa and the signifi cantly weaker refi ning environment. These adverse factors were partly offset by greatly improved operational performance and a reduction in costs of more than 15%b.
What we doOur Refi ning and Marketing business is responsible for the supply and trading, refi ning, manufacturing, marketing and transportation of crude oil, petroleum, petrochemicals products and related services to wholesale and retail customers. We market our products in more than 80 countries and have a particularly strong presence in Europe and North America. We also manufacture and market our products across Australasia, in China and other parts of Asia, Africa and Central and South America.
Our marketRefi ning margins fell sharply in 2009 as demand for oil products contracted in the wake of the global economic recession and new refi ning capacity was completed, mostly in Asia. During 2009 distillate inventories were consistently above the top of the range of the past fi ve years. Gasoline inventories grew steadily and were generally at or slightly above the average level of the past fi ve years. Overall, this led to an excess of supply over demand for oil products. As a result, the BP global indicator refi ning margin – a broad measure of refi ning profi tability – averaged $4 per barrel in 2009, down $2.50 per barrel compared with 2008. This margin decline had a signifi cant adverse impact on our fi nancial performance. In our international businesses, we saw a decline in demand for lubricants due to the fi nancial crisis. During the year we saw a partial recovery in the demand for our petrochemicals products.
Our strategy Our purpose is to be the product- and service-led arm of BP, focused on fuels, lubricants, petrochemicals products and related services. We aim to be excellent in the markets we choose to be in – those that allow BP to serve the major energy markets of the world. We are in pursuit of competitive returns and enduring growth, as we serve customers and promote BP and our brands through quality products. Key to our continued success is holding a portfolio of quality, effi cient, integrated positions and accessing available growth.
Our performance In 2007 we identifi ed that our fi nancial performance lagged that of competitors. Our objective was to restore performance over a period of three to four years by focusing on achieving safe, reliable and compliant operations, restoring missing revenues and delivering sustainable competitive returns and cash fl ows. Our 2009 performance has benefi ted from the fundamental improvements we have made – and continue to make – across the business. This includes measures taken to restore the availability of our refi ning system, reduce costs and simplify the organization.
In 2009 Refi ning and Marketing continued to drive forward its transformation, achieving a strong performance while maintaining its focus on safe, reliable and compliant operations. This refl ects the fundamental improvements we have made to the business, which is now able to compete and win despite tough market conditions.
Highlights
Overall performance again competitive with peers.•
All our operated refi neries and petrochemicals plants now • on BP’s operating management system (OMS).
Operational performance signifi cantly improved, with both • refi ning availability and throughput up.
Costs reduced by more than 15%• b across the segment.
International businesses performing well and extending • positions in emerging markets.
Integrated fuels value chains (FVCs) delivering benefi ts • from simplifi cation.
0 1,000 3,0002,000 4,000
7432009
4,1762008
Refi ning throughput
Refi ning throughput measures the average number of barrels per day we process through our refi neries. In 2009 we increased our refi ning throughput by 132,000 barrels per day. This is the equivalent of adding a medium-sized refi nery to our portfolio.
2.3million
barrels per day a Non-operating items are charges and credits arising in consolidated entities that
BP discloses separately because it considers such disclosures to be meaningful and relevant to investors. See footnote b on page 23 for more information.
b Based on Refi ning and Marketing’s share of production and manufacturing expenses plus distribution and administration expenses.

Connected, simplifi ed, competitiveEstablish one set of targets, priorities and processes for the entire regional organization, from refi ning to logistics, marketing, supply, trading and service stations. That was the clear but immense task facing our Australia and New Zealand (ANZ) business back in 2001, when performance failed to match expectation. In response, teams worked together to start to simplify decision-making, integrate planning between assets and clarify accountability, with the aim of creating our fi rst integrated fuels value chain (FVC). An independent but 100%-owned back-offi ce organization was formed to enhance customer service and reduce costs. Complex internal transfers were scrapped and our focus was on overall value-chain profi tability. These decisive actions have transformed the ANZ business, with fi nancial performance improving considerably since the creation of the FVC. We are winning in a fast-growing regional market. We are also better positioned to address energy security, given the complexity that comes from Australia’s dispersed population and demand, and the distance from supply sources. The ANZ turnaround is proving an invaluable example as we move to fully integrated FVCs across our six geographies worldwide.
Images1 BP supply ship at Texas City refi nery, US.2 BP truck at Whinstanes Terminal, Australia.3 ampm service station, US.4 Texas City refi nery, US.
1
2 3
4

Liquid innovationFrom cars to ships, from steel mills to oil rigs – advanced lubricants are an essential element across industry and transport. NASA even used a Castrol fl uid in a Mars probe. Given the global challenge of increasing energy effi ciency while reducing emissions, lubricants are set to play an even more important role. You will already fi nd teams at our technology centres helping to design and test the engines of tomorrow. By combining technical know-how with distinctive branding, deep customer relationships and a global supply chain, BP has established itself as a key player in the lubricants market. We are now focused on enhancing our position as a high-performance brand and organization. In 2009 this meant continuing to prioritize the pursuit of industry-leading product innovation and effi ciency to ensure that we provide the best possible value to our customers. We have the strongest brand loyalty in the lubricants category across our core marketsa and we have extended our position in China, India, Brazil and Russia, with almost 30% of income generated from emerging markets in 2009. Our challenge now is to sustain success in a fast-changing market. a Millward Brown.
Images1 Castrol lubricants dealership, Vietnam.2 Loading marine fuels, Netherlands.3 Castrol brand packaging, in-store.4 Castrol sponsorship, 2010 FIFA World Cup™.
1
2 3
4
Photo
by
Act
ion
Imag
es
3

21
BP Annual Review 2009Our business performance
We believe our overall performance has now returned to being competitive with our supermajor peers, but that there is signifi cant potential for further performance improvements. Safety remains our top priority – both process and personal safety. By the end of 2009, all our operated refi neries and petrochemicals plants were operating on the BP OMS. Within our US refi neries, we continue to implement the recommendations of the BP US Refi neries Independent Safety Review Panel (Baker Panel) and regulatory bodies. This has helped us to reduce the number of reported major incidents by 90% since 2005. We have also reduced the number of oil spills and the recordable injury frequency in our workforce to the lowest levels for 10 years, and there were no workforce fatalities associated with our operations in 2009. Replacement cost profi t before interest and tax was $0.7 billion for 2009, compared with $4.2 billion in 2008 despite refi ning margins being down $2.50 per barrel. The result was heavily impacted by a one-off, non-operating charge of $1.6 billion to write off all the segment’s goodwill relating to BP’s 2000 ARCO acquisition. This resulted from our annual review of goodwill as required under International Financial Reporting Standards and refl ects the prevailing weak refi ning environment that, together with a review of future margin expectations in the FVC, has led to a reduction in the expected future cash fl ows. Despite this, our fi nancial performance benefi ted from improved operational performance and costs being more than 15%b lower than 2008 levels. In our international businesses, performance was better than in 2008, driven by lower costs. Our focus on operations delivered signifi cant performance improvements in 2009. Refi ning availabilitya for the year was 93.6%, up around 5% from 2008. Average throughputs were up by 132,000 barrels per day in 2008, up more than 6%. 2009 also saw further signifi cant improvements at Texas City, with a steady ramp-up of production and increasing Solomon availability each quarter. The site is now operating at its highest availability level since 2004.
Looking aheadIn 2010, although demand has stabilized, we expect the challenging economic environment to continue, with weak demand for products and pressure on margins. In response, we will continue to focus on delivering safe, reliable and compliant operations, improving the performance of our integrated FVCs businesses – particularly in the US – and driving further cost effi ciencies across all our businesses. We intend to maintain investment at 2009 levels, with the largest single investment being the Whiting refi nery modernization project, which will strengthen our Midwest FVC.
Refi ning availability measures the readiness of our refi neries to refi ne crude oil into fuels. In 2009 we increased our refi ning availabilitya by around fi ve percentage points to 93.6%. This improvement enabled us to capture more of the available margin.
Refi ning availability (%)
0 20 6040 80
93.62009
88.8 2008
R&M in more detailbp.com/whatwedo
Restoration complete, improvement continuesBP’s refi ning business is on a journey to become, and remain, the safest and most competitive in the industry. Since the shutdown in 2005, the Texas City refi nery has undergone a major transformation with 275,000 feet of piping inspected, 27 miles of steam system renovated and 200 temporary structures removed. All major units are now fully restored, and, during April 2009, the site’s Solomon refi ning availabilitya exceeded 90% for the fi rst time in four years. To achieve this transformation, the refi nery has invested more than 60 million work-hours and both replaced retired staff and added new positions, with a total of 1,000 new employees during this period. As important as the physical rebuild of the site is the cultural change that has been achieved, refl ecting a relentless focus on safe, reliable and compliant operations. Process and personal safety metrics continue to show marked improvements and the site has completed the transition to the BP OMS four months ahead of schedule. Activities are prioritized with a focus on continuing progress toward being the leader in process safety and implementing the Baker Panel recommendations. Despite this signifi cant progress, we have further to go in rebuilding relationships with our regulators, and we are committed to doing so.
SECCO upgrades to meet demand in ChinaIn 2009 our SECCO joint venture with Sinopec expanded its capacity by 25%, creating China’s largest ethylene cracker, capable of producing 1.3 million tonnes of ethylene per year. The plant’s exceptional scale and effi ciency enables it to meet strong demand growth competitively in the heart of the world’s largest market – China.
a Refi ning represents Solomon Associates’ operational availability, which is defi ned as the percentage of the year that a unit is available for processing after subtracting the annualized time lost due to turnaround activity and all planned mechanical, process and regulatory maintenance downtime.
b Based on Refi ning and Marketing’s share of production and manufacturing expenses plus distribution and administration expenses.

22
BP Annual Review 2009Our business performance
Alternative Energy made good progress in 2009, focusing on four key businesses that we believe have the potential to be a material source of low-carbon energy and are aligned with BP’s core capabilities.
Highlights
Announced $55 million in biofuels joint ventures. •
279 megawatts (MW) of wind power capacity added.•
Solar power sales up 25%. •
Funding and regulatory approvals for hydrogen power projects.•
What we doAlternative Energy comprises BP’s low-carbon businesses and future growth options outside oil and gas. We are focused on four key businesses with the potential to be viable, large-scale and long-term – biofuels, wind, solar, and hydrogen power and carbon capture and storage (CCS). Since 2005 we have invested more than $4 billion in Alternative Energy, in line with our commitment to invest $8 billion by 2015.
Our performanceBP continues to invest throughout the entire biofuels value chain, from sustainable feedstocks that minimize pressure on food supplies through to the development of the advantaged fuel molecule biobutanol. We now have our fi rst joint-venture ethanol refi nery, in Brazil, and a second joint-venture facility is under construction in the UK. In 2009 we announced a $45-million investment in a joint venture with Verenium, which plans to construct a facility to produce lignocellulosic bioethanol in Florida, US. We also announced a $10-million multi-year agreement with Martek Biosciences Corporation to establish proof of concept for large-scale microbial biodiesel production through the fermentation of sugars. Our wind business has focused its operations in the US, where we have a very strong portfolio and see the most attractive opportunities. In 2009 we added a further 279MW of capacity with the construction of two wind farms – Fowler Ridge II in Indiana and Titan I in South Dakota. This, together with the start of commercial operations at other facilities during 2009, took our total capacity in commercial operation to 711MW (1,237MW gross) – an increase of 65% over 2008. BP’s solar business increased unit sales by 25% over 2008 despite a challenging solar market, with weak demand in the fi rst half of the year and a signifi cant decrease in module sales prices of about 40%. During 2009 we continued to restructure manufacturing activities to reduce unit cost and increase competitiveness. BP has also played a leading role in the CCS industry for more than 10 years, and today focuses on full-scale projects and a continuing programme of research and technology development. Our 400MW Hydrogen Power Abu Dhabi project, with partner Masdar, made progress during 2009 after its environment and social impact assessment was fully approved by Abu Dhabi’s environmental regulator, an important project milestone. BP and Rio Tinto continue to develop the Hydrogen Energy California 250MW power project with CCS, which secured $308 million of Department of Energy funding during 2009.
a Net wind capacity is the sum of the rated capacities of the assets/turbines that have entered into commercial operation, including BP’s share of equity-accounted entities.
Net rated wind capacity at year-end (megawatts)a
Images1 Fowler Ridge II wind farm, Indiana, US.2 Tropical BioEnergia biofuels joint venture, Brazil.
Alternative Energy
1
2
0 200100 400300 500 600 700
7112009
432 2008

23
BP Annual Review 2009
Our fi nancial performance
As a result of the much weaker environment, our return on average capital employed on a replacement cost basisc was lower, at 11%, compared with 22% in 2008. Based on profi t after inventory holding gains and losses, the fi gure was 13% (2008 18%). Finance costs reduced in 2009 to $1,110 million, compared with $1,547 million in 2008, largely due to lower interest rates. Net fi nance expense relating to pensions and other post-retirement benefi ts was $192 million in 2009, compared with an income of $591 million in 2008. The year-on-year change primarily refl ects a reduction in the expected return on pension plan assets. In 2009 the corporate tax charge on replacement cost profi t was $7,066 million, compared with $14,669 million in 2008. Taxation on profi t including inventory holding gains and losses was $8,365 million in 2009, compared with $12,617 million in 2008. The group earns income in many countries and, on average, pays taxes at rates higher than the UK statutory rate of 28%. In 2009 the effective rate on a replacement cost basis was 33%, compared with 36% in 2008. This decrease in the effective tax rate refl ects a higher proportion of income from associates and jointly controlled entities (where tax is included in the pre-tax group profi t), foreign exchange effects and changes to the geographical mix of the group’s income. Capital expenditure and acquisitions amounted to $20,309 million in 2009, compared with $30,700 million in 2008. In 2008 this included $4,731 million in respect of our transaction with Husky Energy Inc. and $3,667 million in respect of our purchase of shale gas assets from Chesapeake Energy Corporation. Net cash provided by operating activities for the year ended 31 December 2009 was $27,716 million, compared with $38,095 million for 2008. In addition to lower profi ts for the year, the reduction in net cash was adversely affected by movements in working capital and a decrease in dividends from jointly controlled entities and associates. These effects were partly offset by decreases in income taxes paid.Net cash used in investing activities was $18,133 million in 2009, compared with $22,767 million in 2008, refl ecting a decrease in capital expenditure and acquisitions and an increase in disposal proceeds. We use net debtd as a measure of fi nancial gearing. Net debt was $26,161 million at the end of 2009, an increase of $1,120 million compared with 2008. We believe that a net debt ratio (net debt to net debt plus equity) of 20-30% provides an
Byron Grote Chief Financial Offi cer26 February 2010
Highlights
Lower realizations and margins impacted profi t.•
Strong operating performance partly offset • weaker environment.
Distribution balanced in favour of dividends.•
Scrip dividend programme proposed.•
Results As a result of signifi cantly lower oil and gas realizations and weaker refi ning margins, in 2009 replacement cost profi t for the year fell to $13,955 million, compared with $25,593 million in 2008. The continued underlying business momentum from production growth, improved operational performance and lower costs partly offset the impact of this weaker environment. Profi t after inventory holding gains and lossesa in 2009 was $16,578 million, compared with $21,157 million in 2008. Our profi t for 2009 also included a net post-tax charge for non-operating itemsb of $1,067 million, which compared with a net charge of $796 million in 2008.
effi cient capital structure and the appropriate level of fi nancial fl exibility. The net debt ratio was 20% at the end of 2009, compared with 21% at the end of 2008, so we are at the lower end of our target band. Dividends and other distributions to shareholdersThe total dividend paid to BP shareholders in 2009 was $10,483 million, compared with $10,342 million for 2008. The dividend paid per share was 56 cents, an increase of 2% compared with 2008. In sterling terms, the dividend increased 24% due to the strengthening of the dollar relative to sterling. We determine the dividend in US dollars because it is the economic currency of BP. Our aim is to strike the right balance for our shareholders between current returns via the dividend, sustained investment for long-term growth in our business and prudent gearing. During 2008 we rebalanced our distributions away from share buybacks in favour of dividends. In 2009 no share buybacks took place. Subject to shareholder approval at the annual general meeting on 15 April 2010, we intend to introduce an optional scrip dividend programme. This would enable shareholders to choose to receive dividends in the form of new fully paid ordinary shares in BP p.l.c. in lieu of cash. The scrip dividend programme would be available for future dividends, and would replace the company’s current dividend reinvestment plans.
Strong operational delivery
Our fi nancial performanceRead about our key measures of progress on pages 6-7.
a Inventory holding gains and losses represent the difference between the cost of sales calculated using the average cost to BP of supplies incurred during the year and the cost of sales calculated on the fi rst-in fi rst-out method, including any changes in provisions where the net realizable value of the inventory is lower than its cost.
b Non-operating items are charges and credits arising in consolidated entities that BP discloses separately because it considers such disclosures to be meaningful and relevant to investors. The main categories of non-operating items included here are: impairments; gains or losses on sale of fi xed assets and the sale of businesses; environmental remediation costs; restructuring, integration and rationalization costs; and changes in the fair value of embedded derivatives. These disclosures are provided in order to enable investors better to understand and evaluate the group’s fi nancial performance. Tax on non-operating items is calculated using the effective tax rate on group profi t. In 2009 no tax credit has been calculated on the goodwill impairment in Refi ning and Marketing because the charge is not tax deductible.
c The return on average capital employed on a replacement basis is the ratio of replacement cost profi t before interest expense and minority interest but after tax, to the average of opening and closing capital employed. Capital employed is BP shareholders’ interest, plus fi nance debt and minority interest.
d Net debt equals fi nance debt, including the fair value of associated derivative fi nancial instruments that are used to hedge foreign exchange and interest rate risks relating to fi nance debt, for which hedge accounting is claimed, less cash and cash equivalents.

24
BP Annual Review 2009Our fi nancial performance
Group income statementFor the year ended 31 December $ million
Note 2009 2008 2007
Sales and other operating revenues 239,272 361,143 284,365 Earnings from jointly controlled entities – after interest and tax 1,286 3,023 3,135 Earnings from associates – after interest and tax 2,615 798 697 Interest and other income 792 736 754 Gains on sale of businesses and fi xed assets 2,173 1,353 2,487 Total revenues and other income 246,138 367,053 291,438 Purchases 163,772 266,982 200,766 Production and manufacturing expenses 23,202 26,756 24,225 Production and similar taxes 3,752 8,953 5,703 Depreciation, depletion and amortization 12,106 10,985 10,579 Impairment and losses on sale of businesses and fi xed assets 2,333 1,733 1,679 Exploration expense 1,116 882 756 Distribution and administration expenses 14,038 15,412 15,371 Fair value (gain) loss on embedded derivatives (607) 111 7 Profi t before interest and taxation 2 26,426 35,239 32,352 Finance costs 1,110 1,547 1,393 Net fi nance expense (income) relating to pensions and other post-retirement benefi ts 192 (591) (652)Profi t before taxation 25,124 34,283 31,611 Taxation 8,365 12,617 10,442 Profi t for the year 16,759 21,666 21,169 Attributable to BP shareholders 16,578 21,157 20,845 Minority interest 181 509 324 16,759 21,666 21,169 Earnings per share – cents Profi t for the year attributable to BP shareholders Basic 4 88.49 112.59 108.76 Diluted 4 87.54 111.56 107.84

25
Group statement of comprehensive incomeFor the year ended 31 December $ million
2009 2008 2007
Profi t for the year 16,759 21,666 21,169 Currency translation differences 1,826 (4,362) 1,887 Exchange gain on translation of foreign operations transferred to gain or loss on sale of businesses and fi xed assets (27) – (147)Actuarial (loss) gain relating to pensions and other post-retirement benefi ts (682) (8,430) 1,717 Available-for-sale investments marked to market 705 (994) 200 Available-for-sale investments – recycled to the income statement 2 526 (91)Cash fl ow hedges marked to market 652 (1,173) 155 Cash fl ow hedges – recycled to the income statement 366 45 (74)Cash fl ow hedges – recycled to the balance sheet 136 (38) (40)Taxation 525 2,946 (276)Other comprehensive income 3,503 (11,480) 3,331 Total comprehensive income 20,262 10,186 24,500 Attributable to BP shareholders 20,137 9,752 24,152 Minority interest 125 434 348 20,262 10,186 24,500
Group statement of changes in equity $ million
2009 2008 2007
BP BP BP shareholders’ Minority Total shareholders’ Minority Total shareholders’ Minority Total equity interest equity equity interest equity equity interest equity
At 1 January 91,303 806 92,109 93,690 962 94,652 84,624 841 85,465 Total comprehensive income 20,137 125 20,262 9,752 434 10,186 24,152 348 24,500 Dividends (10,483) (416) (10,899) (10,342) (425) (10,767) (8,106) (227) (8,333)Repurchase of ordinary share capital – – – (2,414) – (2,414) (7,997) – (7,997)Share-based payments (net of tax) 721 – 721 617 – 617 1,017 – 1,017Changes in associates’ equity (43) – (43) – – – – – –Minority interest buyout (22) (15) (37) – (165) (165) – – –At 31 December 101,613 500 102,113 91,303 806 92,109 93,690 962 94,652
BP Annual Review 2009Our fi nancial performance

26
BP Annual Review 2009Our fi nancial performance
Group balance sheet At 31 December $ million
2009 2008
Non-current assets Property, plant and equipment 108,275 103,200 Goodwill 8,620 9,878 Intangible assets 11,548 10,260 Investments in jointly controlled entities 15,296 23,826 Investments in associates 12,963 4,000 Other investments 1,567 855 Fixed assets 158,269 152,019 Loans 1,039 995 Other receivables 1,729 710 Derivative fi nancial instruments 3,965 5,054 Prepayments 1,407 1,338 Deferred tax assets 516 – Defi ned benefi t pension plan surpluses 1,390 1,738 168,315 161,854 Current assets Loans 249 168 Inventories 22,605 16,821 Trade and other receivables 29,531 29,261 Derivative fi nancial instruments 4,967 8,510 Prepayments 1,753 3,050 Current tax receivable 209 377 Cash and cash equivalents 8,339 8,197 67,653 66,384 Total assets 235,968 228,238 Current liabilities Trade and other payables 35,204 33,644 Derivative fi nancial instruments 4,681 8,977 Accruals 6,202 6,743 Finance debt 9,109 15,740 Current tax payable 2,464 3,144 Provisions 1,660 1,545 59,320 69,793 Non-current liabilities Other payables 3,198 3,080 Derivative fi nancial instruments 3,474 6,271 Accruals 703 784 Finance debt 25,518 17,464 Deferred tax liabilities 18,662 16,198 Provisions 12,970 12,108 Defi ned benefi t pension plan and other post-retirement benefi t plan defi cits 10,010 10,431 74,535 66,336 Total liabilities 133,855 136,129 Net assets 102,113 92,109 Equity Share capital 5,179 5,176 Reserves 96,434 86,127 BP shareholders’ equity 101,613 91,303 Minority interest 500 806 Total equity 102,113 92,109
The summary fi nancial statement on pages 1-7 and 10-33 was approved and signed by the chairman and group chief executive on 26 February 2010 having been duly authorized to do so by the board of directors.
C-H Svanberg ChairmanDr A B Hayward Group Chief Executive

27
BP Annual Review 2009Our fi nancial performance
Group cash fl ow statementFor the year ended 31 December $ million
2009 2008 2007
Operating activities Profi t before taxation 25,124 34,283 31,611 Depreciation and other similar non-cash charges 12,859 11,750 10,118 Earnings from equity-accounted entities, less dividends received (898) (93) (1,359) Net charge for interest and other fi nance expense, less net interest paid 338 (357) (611) Share-based payments 450 459 420 Net operating charge for pensions and other post-retirement benefi ts, less contributions and benefi t payments for unfunded plans (887) (173) (404) Net charge for provisions, less payments 650 (298) (92) Movements in working capital (3,596) 5,348 (5,902) Income taxes paid (6,324) (12,824) (9,072)Net cash provided by operating activities 27,716 38,095 24,709Net cash used in investing activities (18,133) (22,767) (14,837)Net cash used in fi nancing activities (9,551) (10,509) (9,035)Currency translation differences relating to cash and cash equivalents 110 (184) 135Increase in cash and cash equivalents 142 4,635 972Cash and cash equivalents at beginning of year 8,197 3,562 2,590Cash and cash equivalents at end of year 8,339 8,197 3,562
Notes1 Presentation of the fi nancial statementsThese summarized fi nancial statements represent an abridged version of the fi nancial statements in BP Annual Report and Accounts 2009, which have been prepared in accordance with International Financial Reporting Standards (IFRS) as issued by the International Accounting Standards Board (IASB) and IFRS as adopted for use by the European Union (EU). IFRS as adopted for use by the EU differs in certain respects from IFRS as issued by the IASB; however, the differences have no impact on the group’s consolidated fi nancial statements for the years presented. Comparative fi gures in the income statement have been restated to include amounts previously reported as production and manufacturing expenses of $2,427 million for 2008 and $1,690 million for 2007, which we believe are more appropriately classifi ed as production taxes. There was no effect on the group profi t for the year or the group balance sheet.
2 Analysis of replacement cost profi t before interest and tax and reconciliation to profi t before tax
$ million
2009 2008 2007
By business Exploration and Production 24,800 38,308 27,602 Refi ning and Marketing 743 4,176 2,621 Other businesses and corporate (2,322) (1,223) (1,209) 23,221 41,261 29,014Consolidation adjustment (717) 466 (220)Replacement cost profi t before interest and taxa 22,504 41,727 28,794By geographical area US 2,806 10,678 5,581 Non-US 19,698 31,049 23,213Replacement cost profi t before interest and taxa 22,504 41,727 28,794Inventory holding gains (losses) 3,922 (6,488) 3,558Profi t before interest and tax 26,426 35,239 32,352Finance costs 1,110 1,547 1,393Net fi nance expense (income) relating to pensions and other post-retirement benefi ts 192 (591) (652)Profi t before tax 25,124 34,283 31,611
a Replacement cost profi t refl ects the replacement cost of supplies. The replacement cost profi t for the period is arrived at by excluding from profi t inventory holding gains and losses and their associated tax effect. Replacement cost profi t for the group is not a recognized GAAP measure.

28
3 Dividends pence per share cents per share $ million
2009 2008 2007 2009 2008 2007 2009 2008 2007
Dividends announced and paid Preference shares 2 2 2 Ordinary shares March 9.818 6.813 5.258 14.000 13.525 10.325 2,619 2,553 2,000 June 9.584 6.830 5.151 14.000 13.525 10.325 2,619 2,545 1,983 September 8.503 7.039 5.278 14.000 14.000 10.825 2,620 2,623 2,065 December 8.512 8.705 5.308 14.000 14.000 10.825 2,623 2,619 2,056 36.417 29.387 20.995 56.000 55.050 42.300 10,483 10,342 8,106 Dividend announced per ordinary share, payable in March 2010 8.679 – – 14.000 – – 2,626 – –
The group does not account for dividends until they have been paid. The accounts for the year ended 31 December 2009 do not refl ect the dividend announced on 2 February 2010 and payable in March 2010; this will be treated as an appropriation of profi t in the year ended 31 December 2010.
4 Earnings per ordinary shareBasic earnings per ordinary share amounts are calculated by dividing the profi t for the year attributable to ordinary shareholders by the weighted average number of ordinary shares outstanding during the year. The average number of shares outstanding excludes treasury shares and the shares held by the Employee Share Ownership Plans and includes certain shares that will be issuable in the future under employee share plans. For the diluted earnings per share calculation, the weighted average number of shares outstanding during the year is adjusted for the number of shares that are potentially issuable in connection with employee share-based payment plans using the treasury stock method.
5 Capital expenditure and acquisitions $ million
2009 2008
By business Exploration and Production 14,896 22,227 Refi ning and Marketing 4,114 6,634 Other businesses and corporate 1,299 1,839 20,309 30,700By geographical area US 9,865 16,046 Non-US 10,444 14,654 20,309 30,700
6 Directors’ remuneration $ million
2009 2008 2007
Total for all directors Emoluments 19 19 26 Gains made on the exercise of share options 2 1 2 Amounts awarded under incentive schemes 2 – 10
Emoluments These amounts comprise fees paid to the non-executive chairman and the non-executive directors and, for executive directors, salary and benefi ts earned during the relevant fi nancial year, plus bonuses awarded for the year. Ex gratia superannuation payments of $3 million were included in 2007. Also included was compensation for loss of offi ce of $1 million in 2008 and $1 million in 2007.Pension contributions Three executive directors participated in a non-contributory pension scheme established for UK employees by a separate trust fund to which contributions are made by BP based on actuarial advice. Two US executive directors participated in the US BP Retirement Accumulation Plan during 2009.Offi ce facilities for former chairmen and deputy chairmen It is customary for the company to make available to former chairmen and deputy chairmen, who were previously employed executives, the use of offi ce and basic secretarial facilities following their retirement. The cost involved in doing so is not signifi cant.More information Details of individual directors’ remuneration are given in the directors’ remuneration report on pages 30-31.
BP Annual Review 2009Our fi nancial performance

29
To the members of BP p.l.c.We have examined the summary fi nancial statement for the year ended 31 December 2009 set out on pages 1-7 and 10-33.
Respective responsibilities of directors and auditorsThe directors are responsible for preparing BP Annual Review 2009 in accordance with applicable United Kingdom law. Our responsibility is to report to you our opinion on the consistency of the summary fi nancial statement within BP Annual Review 2009 with the consolidated fi nancial statements, the Directors’ Remuneration Report and the Directors’ Report, and its compliance with the relevant requirements of Section 428 of the Companies Act 2006 and the regulations made thereunder. We also read the other information contained in BP Annual Review 2009 and consider the implications for our report if we become aware of any apparent misstatements or material inconsistencies with the summary fi nancial statement. The other information comprises only ‘Our market’ on pages 8-9. We conducted our work in accordance with Bulletin 2008/3 issued by the Auditing Practices Board. Our reports on the consolidated and parent company fi nancial statements contained within BP Annual Report and Accounts 2009 describe the basis of our opinions on those fi nancial statements, the Directors’ Remuneration Report and the Directors’ Report.
OpinionIn our opinion the summary fi nancial statement is consistent with the consolidated fi nancial statements, the Directors’ Report and the Directors’ Remuneration Report of BP p.l.c. for the year ended 31 December 2009 and complies with the applicable requirements of Section 428 of the Companies Act 2006, and the regulations made thereunder.
Ernst & Young LLPStatutory auditorLondon26 February 2010
Directors’ statement
The auditor has issued unqualifi ed reports on the consolidated and parent company fi nancial statements, the auditable part of the Directors’ Remuneration Report and on the consistency of the Directors’ Report with those fi nancial statements. Their report on the consolidated and parent company fi nancial statements and the auditable part of the Directors’ Remuneration Report contained no statement under Sections 498(2) or 498(3) of the Companies Act 2006.
BP Annual Review 2009
Independent auditor’s statement
Crude oil productiona
thousand barrels per day (net of royalties)
2009 2008 2007
US 665 538 513Europe 208 216 252Russia 840 826 832Rest of World 822 821 817 2,535 2,401 2,414
Natural gas productiona
million cubic feet per day (net of royalties)
2009 2008 2007
US 2,316 2,157 2,174Europe 634 782 797Russia 601 564 451Rest of World 4,934 4,831 4,721 8,485 8,334 8,143
a Includes BP’s share of production of equity-accounted entities.
Estimated net proved reserves
2009 2008 2007
Crude oil reserves (million barrels) Subsidiaries 5,658 5,665 5,492 Equity-accounted entities 4,853 4,688 4,581Natural gas reserves (billion cubic feet) Subsidiaries 40,388 40,005 41,130 Equity-accounted entities 4,742 5,203 3,770
Refi nery throughputs thousand barrels per day
2009 2008 2007
US 1,238 1,121 1,064Europe 755 739 758Rest of World 294 295 305 2,287 2,155 2,127Refi ning availability 93.6% 88.8% 82.9%
Oil sales volumes thousand barrels per day
2009 2008 2007
US 1,426 1,460 1,533Europe 1,504 1,566 1,633Rest of World 630 685 640Total marketing sales 3,560 3,711 3,806Trading/supply sales 2,327 1,987 1,818Total refi ned product sales 5,887 5,698 5,624Crude oil 1,824 1,689 1,885Total oil sales 7,711 7,387 7,509
Chemicals production thousand metric tonnes
2009 2008 2007
Total chemicals production 12,391 12,518 14,028
Supplementary information

30
BP Annual Review 2009
Summary directors’remuneration report
In a volatile year for the world economy, the BP executive team produced excellent results. While salaries were frozen for all directors in 2009, the variable performance-related pay refl ected the impressive achievements of the year and the turnaround of performance over the past three years. The details of executive director remuneration are set out in the table on the opposite page. The remuneration committee sets the measures and targets for the annual bonus element of variable pay at the beginning of the year, based on the strategy and annual plan accepted by the board. The strategy is built around safety, people and performance. The measures included key safety measures (15% of bonus), staff numbers and survey results to refl ect the people priorities (15%) and a set of fi nancial and operational targets to measure performance (70%). Nearly all
Dr D S Julius Chairman Remuneration Committee26 February 2010
Highlights
Targets exceeded, some substantially.•
Rewards refl ect achievements.•
Remuneration policy review completed.•
An excellent year
targets were exceeded, some substantially, with particularly strong performance on cost reduction, exploration success, production start-ups and refi ning performance. This overall excellent performance was also refl ected in the market, where BP shareholders recorded the highest total shareholder return (TSR) of all the oil majors for the year. The other element of variable pay is awarded in shares based on BP’s performance over three years, compared with the other oil majors. Following the process approved by shareholders in the Executive Directors’ Incentive Plan (EDIP), the committee fi rst reviews the three-year TSR of BP compared with its peers and then considers a set of underlying business metrics, again in comparison with peers. When there is a difference between the two comparisons, the committee decides which level of vesting best represents BP’s relative three-year performance. This year the TSR result was tightly clustered and sensitive to calculation methodology. For example, based on a three-month averaging of endpoints, BP came fourth whereas on a one-month averaging it came second. On underlying metrics, BP ranked fi rst on four of the six reviewed (production growth, earnings per share growth, change in return on average capital employed and free cash fl ow) and second or third on the others (Refi ning and Marketing earnings per barrel and net income growth). Following the process set out in the EDIP, the committee judged BP to be tied for third place and thus shared the vesting outcome for third and fourth place to result in a vesting of 17.5% of the maximum award.
Summary of future remuneration components
Salary • Normally reviewed mid-year (no increases in 2009). Current salaries: Dr Hayward £1,045,000, Mr Conn £690,000, Mr Dudley $1,000,000, Dr Grote $1,380,000, Mr Inglis £690,000.
Bonus • On-target bonus of 150% of salary and maximum of 225% of salary based on performance relative to targets set at start of year relating to fi nancial and operational metrics.
Deferred bonus • One-third of actual bonus awarded as shares with three-year deferral,and match with ability to voluntarily defer an additional one-third. • All deferred shares matched one-for-one, both subject to an assessment
of safety and environmental performance over the three-year period.Performance shares • Following EDIP renewal, award of shares of up to 5.5 times salary
for group chief executive, 4.75 times for the chief executive of Exploration and Production, and 4 times for other executive directors.
• Vesting after three years based on performance relative to other oil majors.
• Three-year retention period after vesting before release of shares. Pension • Final salary scheme appropriate to home country of executive.
During the year the committee conducted a full review of BP’s remuneration policy, and particularly the EDIP, which is being put before shareholders for renewal this year. We consulted with a number of our shareholders, reviewed the actual experience with applying EDIP rules over the past fi ve years and considered recent developments in the marketplace. Overall we concluded that the basic structure of the EDIP remains appropriate, but that some rebalancing of elements is warranted. The key change we propose is to require a portion of the annual bonus to be deferred, paid in shares and matched after three years subject to an assessment of safety and environmental sustainability over the three-year period. This change would place more focus on the long term, highlight the importance of safety and build a larger equity stake for executives that we believe aligns their interests well with shareholders. To balance this additional bonus element, we propose to reduce the maximum award of performance shares in the renewed EDIP so as to maintain the current quantum of total remuneration. These changes are summarized in the table below. It has been an excellent year for BP and its shareholders. In determining annual and long-term awards, the committee has recognized the very real achievements of the executive team. For the future, we believe our revised EDIP provides a sound framework with which to competitively reward our top executives for continued success in this long-term business.

31
This graph shows the growth in value of a hypothetical £100 holding in BP p.l.c. ordinary shares over fi ve years, relative to the FTSE 100 Index (of which the company is a constituent). The values of the hypothetical £100 holdings at the end of the fi ve-year period were £141.75 and £134.58 respectively.
BP Annual Review 2009Summary directors’ remuneration report
Historical TSR performanceRemuneration of non-executive directors in 2009a
£ thousand
2008 2009
P D Sutherland 600 600A Burgmans 90 93Sir William Castell 108 115C B Carroll 93 90G Davidb 100 118E B Davis, Jr 105 105D J Flint 90 85Dr D S Julius 110 105Sir Ian Prosser 170 165C-H Svanbergc n/a 30Directors leaving the board in 2009 Sir Tom McKillop 95 33
a This information has been subject to audit. b Also received £4,166 for serving as a member of BP’s technology advisory committee. c Appointed on 1 September 2009.
While fees were held at 2008 levels, in 2009 actual fees paid to non-executive directors were affected by changes in committee membership and the number of transatlantic meetings for which an attendance allowance was paid. In 2009 the chairman reviewed non-executive director remuneration taking into account the review completed in 2008. The chairman made a recommendation to the board (which was agreed) to maintain the 2008 structure until a further review in 2010.
Val
ue o
f hy
poth
etica
l £100 h
old
ing
250
200
150
100
50
04 05 06 07 08 09
FTSE 100BP
Summary of annual remuneration of executive directors in 2009a
Annual remuneration Long-term remuneration
Share element of EDIP
2006-2008 plan 2007-2009 plan 2009-2011 (vested in Feb 2009) (vested in Feb 2010) plan
Annual Non-cash benefi ts Potential Salaryb performance bonus and other emoluments Total Actualc Actualc maximum (thousand) (thousand) (thousand) (thousand) shares Valued shares Valuee performance 2008 2009 2008 2009 2008 2009 2008 2009 vested (thousand) vested (thousand) shares f
Dr A B Hayward £998 £1,045 £1,496 £2,090 £15 £23 £2,509 £3,158 66,136 £336 147,985 £852 1,182,540
I C Conn £670 £690 £871 £1,104 £45 £46 £1,586 £1,840 66,136 £336 95,697 £551 780,816
R W Dudley g h n/a $750 n/a $1,125 n/a $304i n/a $2,179 n/a n/a n/a n/a 539,634
Dr B E Groteg $1,340 $1,380 $1,742 $2,070 $8 $8 $3,090 $3,458 80,231 $603 101,502e $933 992,928
A G Inglis £670 £690 £1,173 £1,311 £212 £216 j i £2,055 £2,217 54,994 £279 83,859 £483 780,816
Amounts shown are in the currency received by executive directors. Annual bonuses are shown in the year they were earned.
a This information has been subject to audit. b Figures show the total salary received during the calendar year. The last salary increase was in July 2008. c Includes shares representing reinvested dividends received on the shares that vested at the end of the performance period. d Based on market price on vesting date (£5.08 per share/$45.13 per ADS). e Based on market price on vesting date (£5.76 per share/$55.17 per ADS). f Maximum potential shares that could vest at the end of the three-year period depending on performance. g Dr Grote and Mr Dudley hold shares in the form of ADSs. The above number refl ects calculated equivalent in ordinary shares. h Refl ects remuneration received by Mr Dudley since appointment as executive director on 6 April 2009. i This amount includes costs of London accommodation and any tax liability thereon. j In addition to this amount, under a tax equalization arrangement, BP discharged a US tax liability arising from the participation by Mr Inglis in the UK pension scheme amounting to $90,314.

32
BP Annual Review 2009
Board of directors
Carl-Henric Svanberg ChairmanChairman of the chairman’s and the nomination committees and attends meetings of the remuneration committee
Executive directors
Dr Anthony B Hayward Group Chief Executive
Iain C Conn Chief Executive, Refi ning and Marketing
Robert W Dudley Managing Director,Asia and the Americas
Dr Byron E Grote Chief Financial Offi cer
Andrew G Inglis Chief Executive, Exploration and Production
Changes to the boardMr C-H Svanberg was appointed as a director and chairman designate on 1 September 2009 and appointed chairman on 1 January 2010 on the retirement of Mr P D Sutherland. Mr P Anderson was appointed as a director on 1 February 2010. Sir Tom McKillop resigned as a director on 16 April 2009. At the company’s 2009 annual general meeting the following directors retired, offered themselves for election/ re-election and were duly elected/re-elected: Mr A Burgmans; Mrs C B Carroll; Sir William Castell; Mr I C Conn; Mr G David; Mr E B Davis, Jr; Mr R W Dudley; Mr D J Flint; Dr B E Grote; Dr A B Hayward; Mr A G Inglis; Dr D S Julius; Sir Ian Prosser and Mr P D Sutherland. Mr I E L Davis has been appointed as a director with effect from 2 April 2010. All the directors, including Mr Davis, will offer themselves for election/re-election at the company’s 2010 annual general meeting.
Company secretaryDavid Jackson (57) was appointed company secretary in 2003. A solicitor, he is a director of BP Pension Trustees Limited and a member of the Listing Authorities Advisory Committee.
Non-executive directors
Sir Ian ProsserDeputy ChairmanMember of the chairman’s, the nomination and the remuneration committees and chairman of the audit committee
Paul AndersonMember of the chairman’s and the safety, ethics and environment assurance committees
Antony Burgmans, KBEMember of the chairman’s, the remuneration and the safety, ethics and environment assurance committees
Cynthia B Carroll Member of the chairman’s and the safety, ethics and environment assurance committees
Sir William Castell, LVOMember of the chairman’s and the nominations committees and chairman of the safety, ethics and environment assurance committee
George David Member of the chairman’s, the audit and the remuneration committees
Erroll B Davis, JrMember of the chairman’s, the audit and the safety, ethics and environment assurance committees
Douglas J Flint, CBEMember of the chairman’s and the audit committees
Dr DeAnne S Julius, CBEMember of the chairman’s and the nomination committees and chairman of the remuneration committee

The Annual Review for the year ended 31 December 2009 includes the summary fi nancial statement (on pages 1-7 and 10-33), which comprises summaries of the Directors’ Report and the Directors’ Remuneration Report and a summary of the information in the consolidated fi nancial statements. The summary fi nancial statement complies with the information requirements under the Companies (Summary Financial Statement) Regulations 2008. It does not contain suffi cient information to allow as full an understanding of the results and the state of affairs of BP and of its policies and arrangements concerning directors’ remuneration as BP Annual Report and Accounts 2009. Shareholders may obtain a copy of BP Annual Report and Accounts 2009 online or on request, free of charge (see page 33). Outside the summarized fi nancial statements (see pages 24-28), references within BP Annual Review 2009 to ‘profi ts’, ‘result’ and ‘return on average capital employed’ are to those measures on a replacement cost basis unless otherwise indicated. The table below reconciles profi t for the year to replacement cost profi t.
For the year ended 31 December $ million
2009 2008 2007
Profi t before interest and taxation 26,426 35,239 32,352Finance costs and net fi nance expense/income relating to pensions and other post-retirement benefi ts (1,302) (956) (741)Taxation (8,365) (12,617) (10,442)Minority interest (181) (509) (324)Profi t for the year attributable to BP shareholders 16,578 21,157 20,845Inventory holding (gains) losses, net of tax (2,623) 4,436 (2,475)Replacement cost profi ta 13,955 25,593 18,370 Exploration and Production 24,800 38,308 27,602Refi ning and Marketing 743 4,176 2,621Other businesses and corporate (2,322) (1,223) (1,209)Consolidation adjustment – unrealized profi t in inventory (717) 466 (220)Replacement cost profi t before interest and taxation 22,504 41,727 28,794Finance costs and net fi nance expense/income relating to pensions and other post-retirement benefi ts (1,302) (956) (741)Taxation on a replacement cost basis (7,066) (14,669) (9,359)Minority interest (181) (509) (324)Replacement cost profi t attributable to BP shareholders 13,955 25,593 18,370Per ordinary share – cents Profi t for the year attributable to BP shareholders 88.49 112.59 108.76 Replacement cost profi t 74.49 136.20 95.85Dividends paid per ordinary share – cents 56.00 55.05 42.30
– pence 36.417 29.387 20.995Dividends paid per American depositary share (ADS) – dollars 3.360 3.303 2.538
a Replacement cost profi t refl ects the replacement cost of supplies. The replacement cost profi t for the year is arrived at by excluding from profi t inventory holding gains and losses and their associated tax effect. Inventory holding gains and losses represent the difference between the cost of sales calculated using the average cost to BP of supplies incurred during the year and the cost of sales calculated on the fi rst-in fi rst-out method, including any changes in provisions where the net realizable value of inventory is lower than its cost. Inventory holding gains and losses, for this purpose, are calculated for all inventories except for those that are held as a part of a trading position and certain other temporary inventory positions. BP uses this measure to assist investors in assessing BP’s performance from period to period. Replacement cost profi t for the group is a non-GAAP measure.
BP p.l.c. is the parent company of the BP group of companies. Unless otherwise stated, the text does not distinguish between the activities and operations of the parent company and those of its subsidiaries. The term ‘shareholder’ in this Annual Review means, unless the context otherwise requires, investors in the equity capital of BP p.l.c., both direct and/or indirect. BP Annual Report and Accounts 2009 and BP Annual Review 2009 may be downloaded from www.bp.com/annualreview. No material on the BP website, other than the items identifi ed as BP Annual Report and Accounts 2009 and BP Annual Review 2009, forms any part of those documents. As BP shares, in the form of ADSs, are listed on the New York Stock Exchange (NYSE), an Annual Report on Form 20-F will be fi led with the US Securities and Exchange Commission (SEC) in accordance with the US Securities Exchange Act of 1934. When fi led, copies may be obtained free of charge (see page 33). BP discloses in its Annual Report on Form 20-F 2009 and on its website at www.bp.com/NYSEcorporategovernancerules signifi cant ways (if any) in which its corporate governance practices differ from those mandated for US companies under NYSE listing standards.
Cautionary statementBP Annual Review 2009 contains certain forward-looking statements, particularly those relating to anticipated energy demand and consumption, global economic recovery, oil and gas prices, global reserves, expected future energy mix, management aims and objectives, strategy, production, refi ning margins, anticipated investment in Alternative Energy, Refi ning and Marketing investments, and reserves increases through technological developments. By their nature, forward-looking statements involve risks and uncertainties because they relate to events and depend on circumstances that will or may occur in the future. Actual results may differ from those expressed in such statements depending on a variety of factors including the timing of bringing new fi elds onstream, future levels of industry product supply, demand and pricing, operational problems, general economic conditions, political stability and economic growth in relevant areas of the world, changes in laws and governmental regulations, exchange rate fl uctuations, development and use of new technology, changes in public expectations and other changes in business conditions, the actions of competitors, natural disasters and adverse weather conditions, wars and acts of terrorism or sabotage, and other factors discussed elsewhere in this document and in BP Annual Report and Accounts 2009.
The registered offi ce of BP p.l.c. is 1 St James’s Square, London SW1Y 4PD, UK. Tel +44 (0)20 7496 4000. Registered in England and Wales No. 102498. Stock exchange symbol ‘BP’.
BP Annual Review 2009
Reconciliation of profi t for the year to replacement cost profi t
BP Annual Review 2009
Information for shareholders
33
Annual general meeting
The 2010 annual general meeting will be held on Thursday, 15 April 2010 at 11.30 a.m. at ExCeL London, One Western Gateway, Royal Victoria Dock, London E16 1XL. A separate notice convening the meeting is distributed to shareholders, which includes an explanation of the items of special business to be considered at the meeting. All resolutions of which notice has been given will be decided on a poll. Ernst & Young LLP have expressed their willingness to continue in offi ce as auditors and a resolution for their reappointment is included in Notice of BP Annual General Meeting 2010.
Dividends
We currently announce dividends on our ordinary shares in US dollars and state an equivalent sterling dividend. The rate of exchange used to determine the sterling amount equivalent is the average of the forward exchange rate in London over the fi ve business days prior to the announcement date. Dividends are normally paid in March, June, September and December. Holders of ordinary shares receive their dividends in sterling; holders of ADSs receive their dividends in US dollars. One ADS represents six ordinary shares. Subject to shareholder approval at the annual general meeting on 15 April, an optional scrip dividend programme, allowing shareholders to choose to receive dividends in the form of new fully paid shares or ADSs in BP p.l.c. instead of cash, will be available for future dividends. If approved, the requirements of the programme mean that there will be certain changes to our current dividend timetable. The programme would replace the company’s current dividend reinvestment plans.
More information
For more information on holding BP shares or ADSs, our investor centre at www.bp.com/investor contains information that you may fi nd helpful regarding your investment in BP. BP Annual Review 2009 contains a summary of certain information in BP Annual Report and Accounts 2009. For a full understanding of the results and state of affairs of BP and of its policies and arrangements concerning directors’ remuneration, please see BP Annual Report and Accounts 2009. To change how you receive shareholder documents, or if you have any queries about the administration of shareholdings, you should contact Equiniti (ordinary and preference shareholders) or JPMorgan (ADS holders). See www.bp.com/shareholderservices for more information.
AcknowledgementsDesign sasdesign.co.ukTypesetting Orb Solutions, LondonPrinting St Ives Westerham Press Ltd, UK, ISO 14001, FSC-certifi ed and CarbonNeutral®
Photography Action Images, Giles Barnard, Stuart Conway,Steven Croston, Jerry Davidson,Richard Davies, Joshua Drake,Damian Gillie, David Gold,Barry Halton, Simon Kreitem,Mark Lawrence, Ian McGregor,Marc Morrison, Aaron Tait,Graham Trott
Paper This Annual Review is printed on FSC-certifi ed Revive Pure White Uncoated. This paper has been independently certifi ed according to the rules of the Forest Stewardship Council (FSC) and was manufactured at a mill that holds ISO 14001 accreditation. The inks used are all vegetable oil based.
© BP p.l.c. 2010
Reports and publications
BP’s reports and publications are available to view online or download from www.bp.com/annualreview.
You can order BP’s printed publications, free of charge, from:
US and CanadaPrecision IRToll-free +1 888 301 2505Fax +1 804 327 [email protected]
UK and Rest of WorldBP Distribution ServicesTel +44 (0)870 241 3269Fax +44 (0)870 240 [email protected]
Annual Report and AccountsRead details of our fi nancial and operating performance in BP Annual Report and Accounts 2009 in print or online.www.bp.com/annualreport
Sustainability ReviewRead the summary BP Sustainability Review 2009 in print or read more online from April 2010.www.bp.com/sustainability

beyond petroleum®
06 Our performance 08 Our market 10 Our strategy bp.com/annualreview
Annual Review2009
Meeting the energy demands of today and tomorrow Oil Natural gas Wind Solar Biofuels Effi ciency
Operating at the energy frontiersHow a revitalized BP is driving effi ciency, momentum and growth


