Our partnership begins at a very exciting time for ...
29
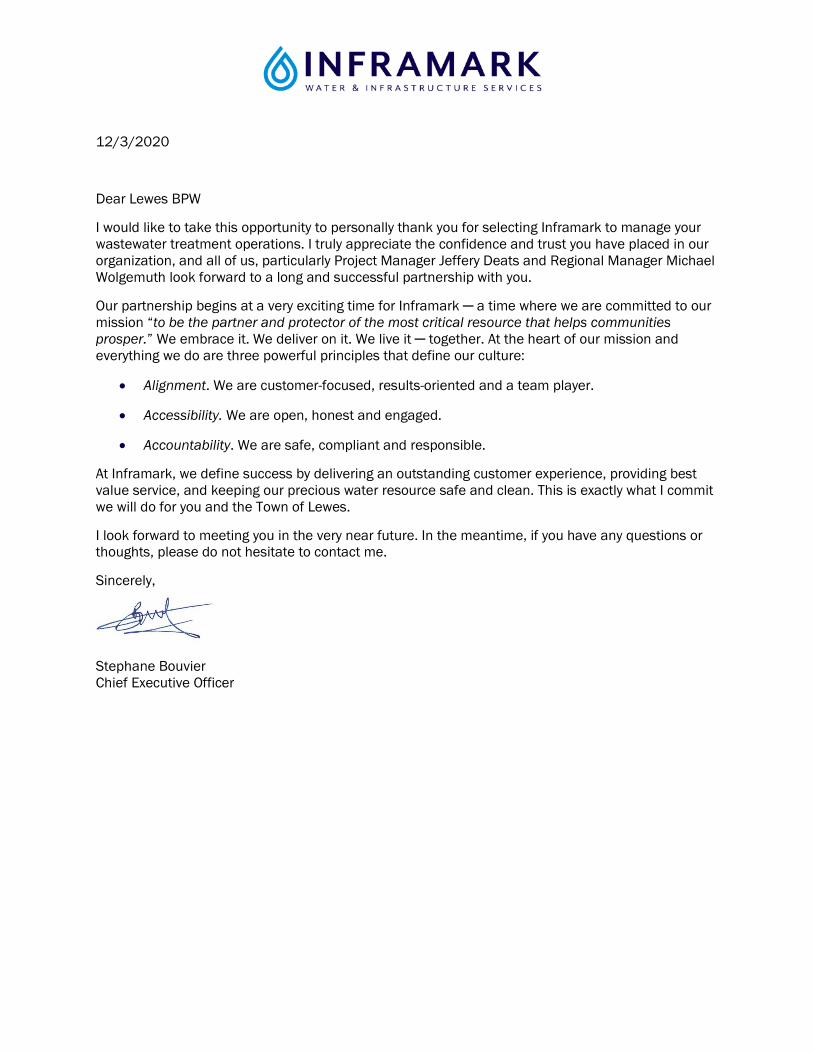
12/3/2020 Dear Lewes BPW I would like to take this opportunity to personally thank you for selecting Inframark to manage your wastewater treatment operations. I truly appreciate the confidence and trust you have placed in our organization, and all of us, particularly Project Manager Jeffery Deats and Regional Manager Michael Wolgemuth look forward to a long and successful partnership with you. Our partnership begins at a very exciting time for Inframark ─ a time where we are committed to our mission “to be the partner and protector of the most critical resource that helps communities prosper.” We embrace it. We deliver on it. We live it ─ together. At the heart of our mission and everything we do are three powerful principles that define our culture: Alignment. We are customer-focused, results-oriented and a team player. Accessibility. We are open, honest and engaged. Accountability. We are safe, compliant and responsible. At Inframark, we define success by delivering an outstanding customer experience, providing best value service, and keeping our precious water resource safe and clean. This is exactly what I commit we will do for you and the Town of Lewes. I look forward to meeting you in the very near future. In the meantime, if you have any questions or thoughts, please do not hesitate to contact me. Sincerely, Stephane Bouvier Chief Executive Officer
Transcript of Our partnership begins at a very exciting time for ...
12/3/2020
Dear Lewes BPW
I would like to take this opportunity to personally thank you for selecting Inframark to manage your wastewater treatment operations. I truly appreciate the confidence and trust you have placed in our organization, and all of us, particularly Project Manager Jeffery Deats and Regional Manager Michael Wolgemuth look forward to a long and successful partnership with you.
Our partnership begins at a very exciting time for Inframark ─ a time where we are committed to our mission “to be the partner and protector of the most critical resource that helps communities prosper.” We embrace it. We deliver on it. We live it ─ together. At the heart of our mission and everything we do are three powerful principles that define our culture:
Alignment. We are customer-focused, results-oriented and a team player.
Accessibility. We are open, honest and engaged.
Accountability. We are safe, compliant and responsible.
At Inframark, we define success by delivering an outstanding customer experience, providing best value service, and keeping our precious water resource safe and clean. This is exactly what I commit we will do for you and the Town of Lewes.
I look forward to meeting you in the very near future. In the meantime, if you have any questions or thoughts, please do not hesitate to contact me.
Sincerely,
Stephane Bouvier Chief Executive Officer
LEWES BPW
Howard Seymour Water Reclamation Plant
November 2020 Management, Operations & Maintenance Report
December 3, 2020

Monthly O&M Report Page 2
Summary
Inframark staff started shadowing personnel from the former operator on October 19, 2020 in preparation to take over operation and maintenance of the plant November 1, 2020. As of November 1st, our staff were in place and mostly onboarded. During November, local staff were supported by Inframark Regional Manager, Michael Wolgemuth and remotely by our network of support staff. New employees completed online safety training specific to the hazards at the BPW’s wastewater facilities. Additional classroom and practical trainings were completed prior to operating equipment or entering confined spaces. Please find details related to operation and maintenance of the WWTP and pump stations within this report.
Critical Issues
Covid. Inframark is following CDC recommendations to ensure undisrupted service to the BPW and the Lewes community. We are communicating with our teams daily to ensure employees with primary or secondary exposure are staying home until receiving a negative test. So far, we have had little impact across our projects
Inframark has retained an additional DE Class 4 licensed operator to work part-time to address DNREC’s concern over having one DE licensed operator at the facility. The gentleman started on December 2, 2020 and will be working weekends through at least the end of January. DNREC has facilitated an emergency exam to allow our two additional operators to move forward with the Delaware licensing process. Inframark also employees a DE Class 4 licensed operator at one of our southeast PA facilities that would be available as a backup if needed. Our Regional Manager, Michael Wolgemuth, had applied for reciprocity in March of 2020 but has not received a definitive response from DNREC as to whether it will be granted.
Noteworthy Events
Inframark engineer onsite to help in asset assessment activities at pump stations.
Inframark support lab specialist onsite to develop lab procedures and train operators on proper laboratory testing procedures.
Four Inframark team members from our Elkton MD project came down for a day to help with housekeeping at the WWTP.
A Kubota service representative was onsite to diagnose issues with the digester membrane system not running in Auto. He also evaluated further repairs needed to bring equipment back to specifications.
Monthly O&M Report Page 3
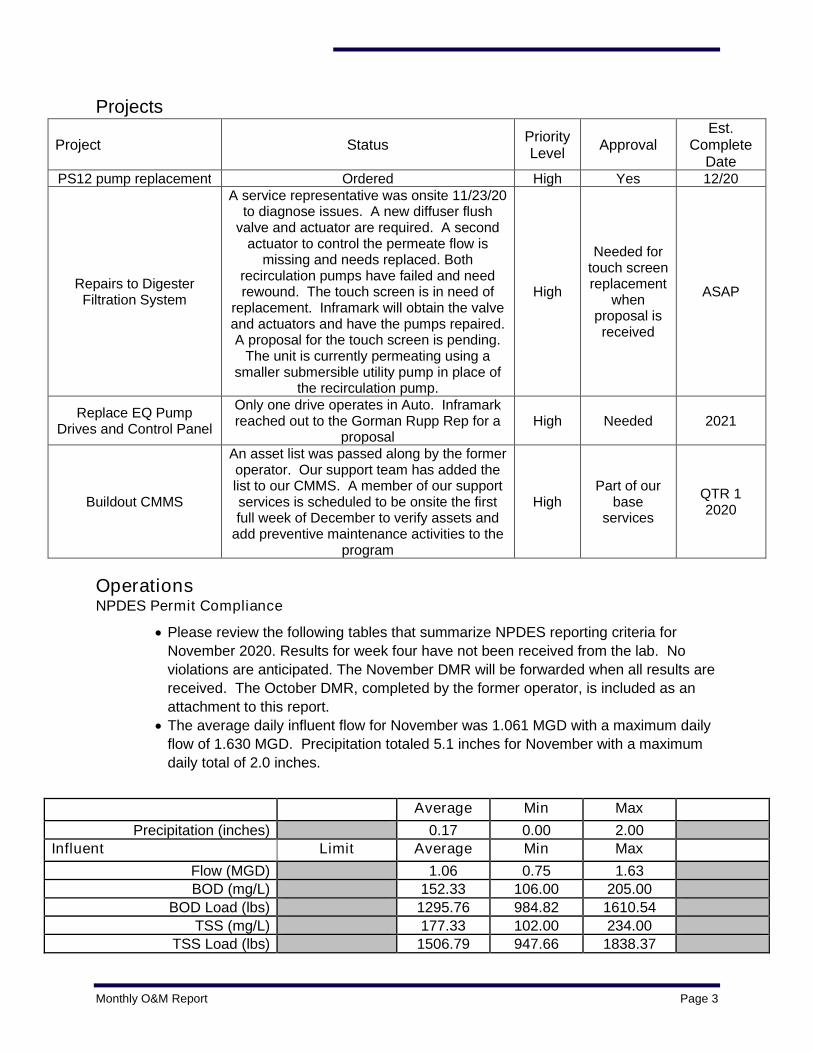
Projects
Project Status Priority Level
Approval Est.
Complete Date
PS12 pump replacement Ordered High Yes 12/20
Repairs to Digester Filtration System
A service representative was onsite 11/23/20 to diagnose issues. A new diffuser flush
valve and actuator are required. A second actuator to control the permeate flow is
missing and needs replaced. Both recirculation pumps have failed and need rewound. The touch screen is in need of
replacement. Inframark will obtain the valve and actuators and have the pumps repaired. A proposal for the touch screen is pending.
The unit is currently permeating using a smaller submersible utility pump in place of
the recirculation pump.
High
Needed for touch screen replacement
when proposal is received
ASAP
Replace EQ Pump Drives and Control Panel
Only one drive operates in Auto. Inframark reached out to the Gorman Rupp Rep for a
proposalHigh Needed 2021
Buildout CMMS
An asset list was passed along by the former operator. Our support team has added the list to our CMMS. A member of our support services is scheduled to be onsite the first full week of December to verify assets and
add preventive maintenance activities to the program
High Part of our
base services
QTR 1 2020
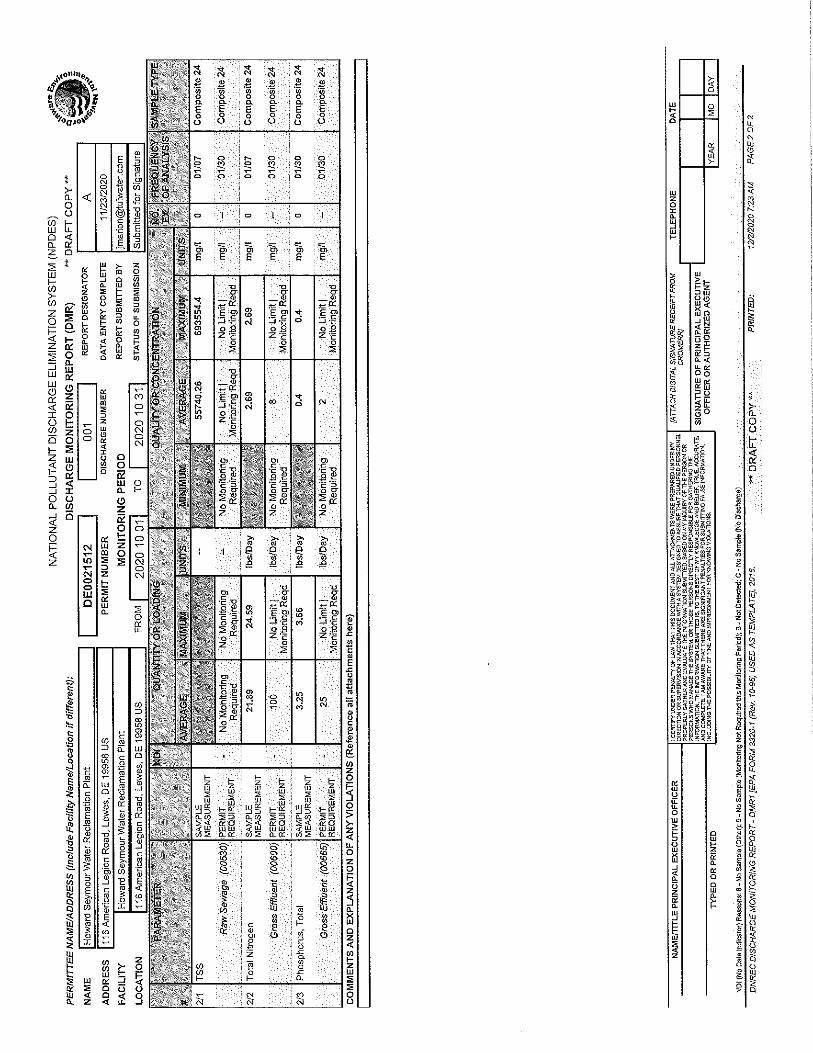
Operations NPDES Permit Compliance
Please review the following tables that summarize NPDES reporting criteria for
November 2020. Results for week four have not been received from the lab. No
violations are anticipated. The November DMR will be forwarded when all results are
received. The October DMR, completed by the former operator, is included as an
attachment to this report.
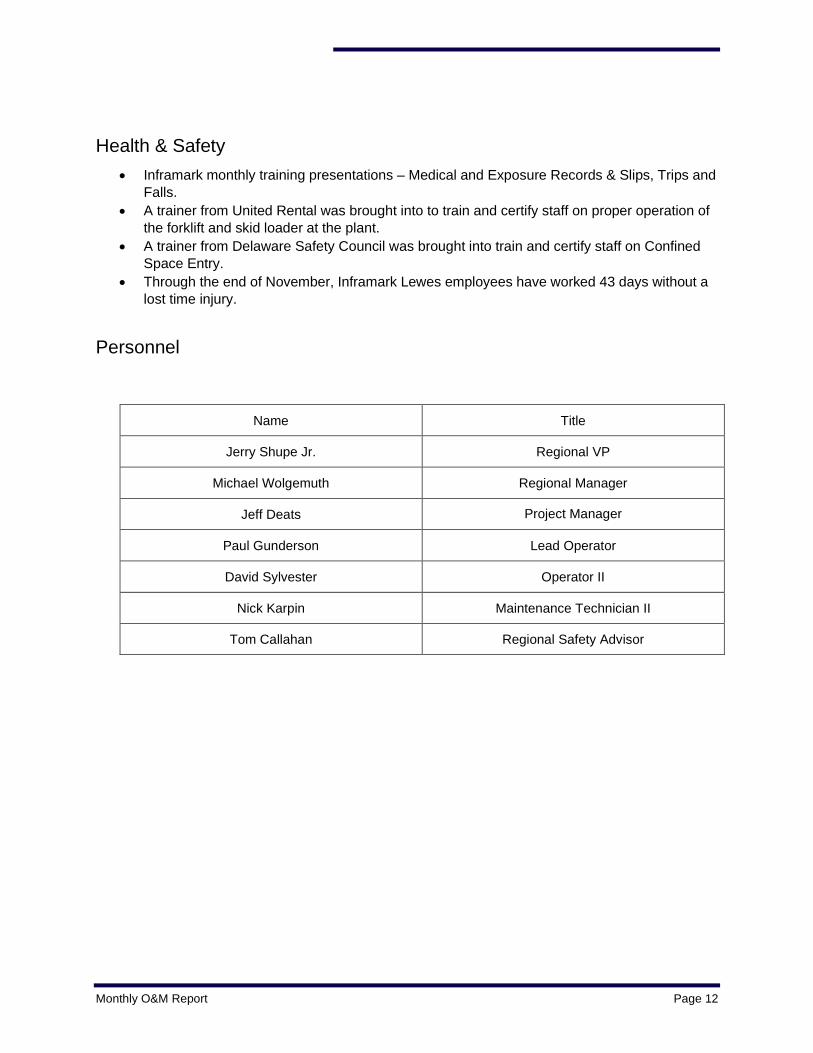
The average daily influent flow for November was 1.061 MGD with a maximum daily
flow of 1.630 MGD. Precipitation totaled 5.1 inches for November with a maximum
daily total of 2.0 inches.
Average Min Max
Precipitation (inches) 0.17 0.00 2.00 Influent Limit Average Min Max
Flow (MGD) 1.06 0.75 1.63 BOD (mg/L) 152.33 106.00 205.00
BOD Load (lbs) 1295.76 984.82 1610.54
TSS (mg/L) 177.33 102.00 234.00 TSS Load (lbs) 1506.79 947.66 1838.37
Monthly O&M Report Page 4
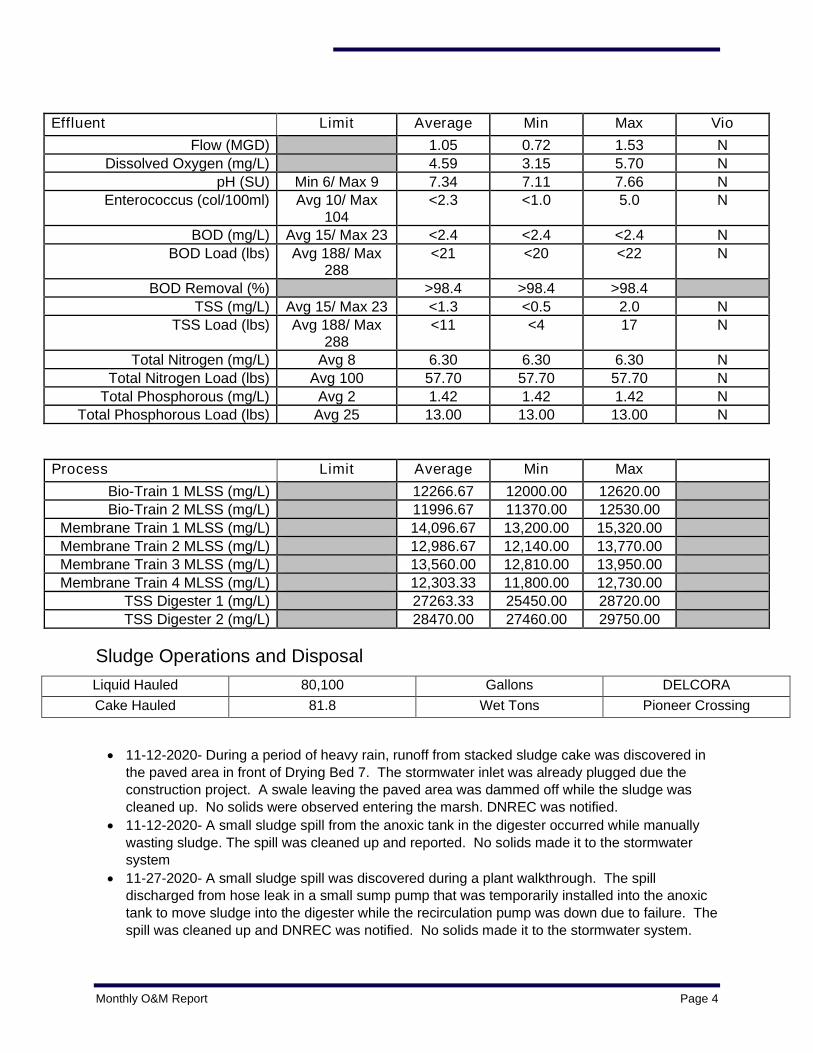
Effluent Limit Average Min Max Vio
Flow (MGD) 1.05 0.72 1.53 N
Dissolved Oxygen (mg/L) 4.59 3.15 5.70 N
pH (SU) Min 6/ Max 9 7.34 7.11 7.66 N Enterococcus (col/100ml) Avg 10/ Max
104<2.3 <1.0 5.0 N
BOD (mg/L) Avg 15/ Max 23 <2.4 <2.4 <2.4 N
BOD Load (lbs) Avg 188/ Max 288
<21 <20 <22 N
BOD Removal (%) >98.4 >98.4 >98.4
TSS (mg/L) Avg 15/ Max 23 <1.3 <0.5 2.0 N TSS Load (lbs) Avg 188/ Max
288<11 <4 17 N
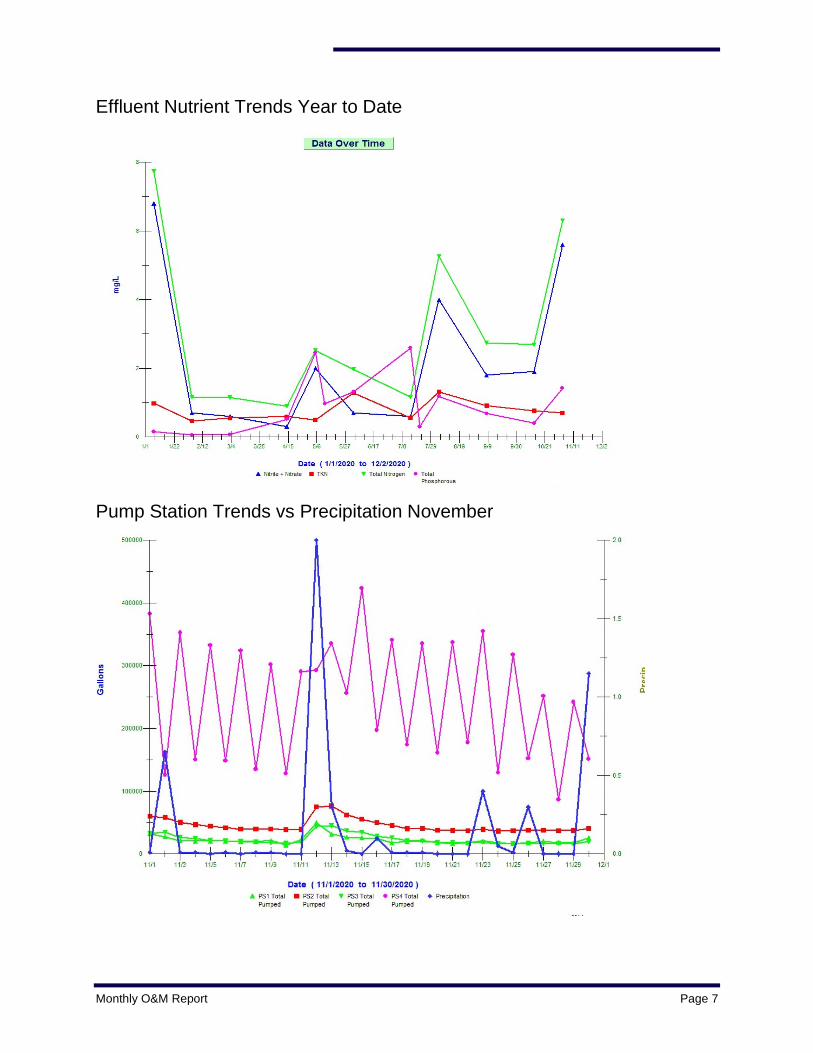
Total Nitrogen (mg/L) Avg 8 6.30 6.30 6.30 N
Total Nitrogen Load (lbs) Avg 100 57.70 57.70 57.70 N
Total Phosphorous (mg/L) Avg 2 1.42 1.42 1.42 N Total Phosphorous Load (lbs) Avg 25 13.00 13.00 13.00 N
Process Limit Average Min Max
Bio-Train 1 MLSS (mg/L) 12266.67 12000.00 12620.00 Bio-Train 2 MLSS (mg/L) 11996.67 11370.00 12530.00
Membrane Train 1 MLSS (mg/L) 14,096.67 13,200.00 15,320.00
Membrane Train 2 MLSS (mg/L) 12,986.67 12,140.00 13,770.00 Membrane Train 3 MLSS (mg/L) 13,560.00 12,810.00 13,950.00
Membrane Train 4 MLSS (mg/L) 12,303.33 11,800.00 12,730.00 TSS Digester 1 (mg/L) 27263.33 25450.00 28720.00
TSS Digester 2 (mg/L) 28470.00 27460.00 29750.00
Sludge Operations and Disposal
Liquid Hauled 80,100 Gallons DELCORA
Cake Hauled 81.8 Wet Tons Pioneer Crossing
11-12-2020- During a period of heavy rain, runoff from stacked sludge cake was discovered in the paved area in front of Drying Bed 7. The stormwater inlet was already plugged due the construction project. A swale leaving the paved area was dammed off while the sludge was cleaned up. No solids were observed entering the marsh. DNREC was notified.
11-12-2020- A small sludge spill from the anoxic tank in the digester occurred while manually wasting sludge. The spill was cleaned up and reported. No solids made it to the stormwater system
11-27-2020- A small sludge spill was discovered during a plant walkthrough. The spill discharged from hose leak in a small sump pump that was temporarily installed into the anoxic tank to move sludge into the digester while the recirculation pump was down due to failure. The spill was cleaned up and DNREC was notified. No solids made it to the stormwater system.

Monthly O&M Report Page 5
Zenon Membrane Report During the month of November, we have been having issues related to air in the membrane
trains. Low flows and false turbidity spikes have caused several shutdowns and alarms. Inframark has been working with Zenon to mitigate these issues.
A three-day training provided by Zenon has been scheduled for the first full week of January.
Included for your review are Zenon’s Biweekly Reports
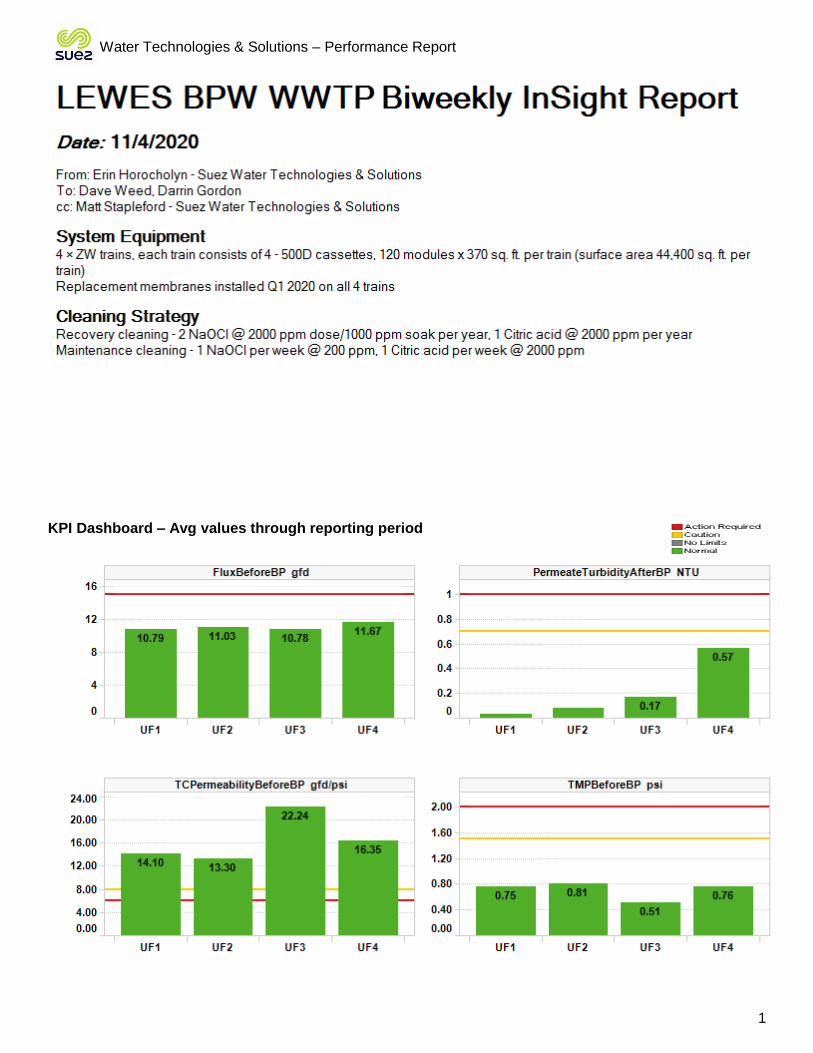
Water Technologies & Solutions – Performance Report
1
KPI Dashboard – Avg values through reporting period

Water Technologies & Solutions – Performance Report
2
Plant Summary
Overall, the plant operated well. Max flux was hit from Oct 28 – Nov 1; during these periods TMPs and permeabilities were impacted but all KPIs returned to normal levels once flow receded.
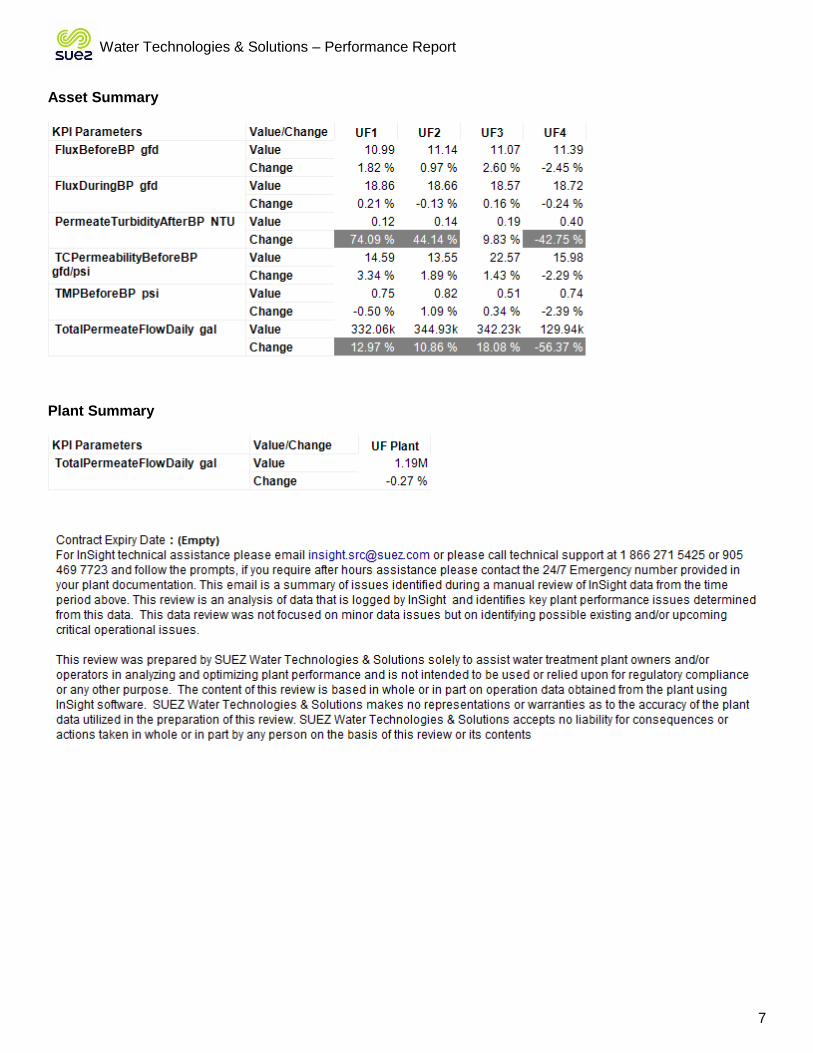
• Daily permeate production averaged 1.1 MGD. Flow peaked on Oct 29 at 1.6 MGD. Average daily production by train was 287 kgal for UF1, 306 kgal for UF2, 283 kgal for UF3, and 199 kgal for UF4
• Flux averages ranged from 10.78 – 11.67 gfd. Even flux between trains is beneficial for even wear across the membrane trains over time. Max flux was hit in this reporting period, during which TMP rose and permeabilities were suppressed. KPI values returned to regular trends once flow decreased
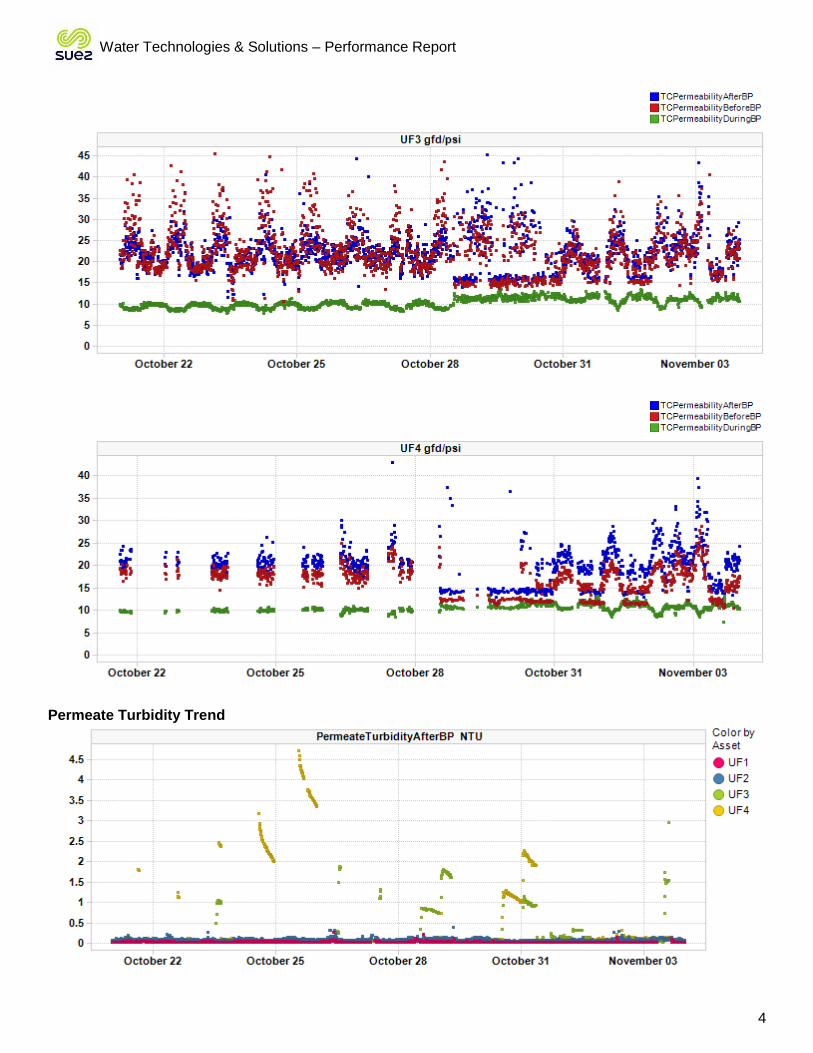
• TC permeability BBP was good on all trains, and excellent on trains UF3 and UF4. UF1 and UF2 averaged 14.10 and 13.30 gfd/psi respectively. UF3 and UF4 averaged 22.24 and 16.35 gfd/psi respectively. For reference, TC permeability BBP is considered good above 8 gfd/psi
• Average TMP was great on all trains. UF1 and UF2 averaged 0.75 and 0.81 psi, while UF3 and UF4 averaged 0.51 and 0.76 psi. There was a 12 – 26% rise in TMP across all trains. For reference, excellent TMP is below 1.0 psi
• Maintenance clean (MC) design specifies 1 hypo/chlorine MC and 1 citric acid MC per week, per train
o UF1, UF2, and UF3 had 4 MCs over the past 2 weeks, meeting design
o UF4 had 5 MCs over the past 2 weeks, exceeding design which is fine
• Permeate turbidity ABP was below 0.10 NTU on all trains except UF3 and UF4. UF1 averaged 0.03 NTU, UF2 averaged 0.09 NTU. UF3 averaged 0.17 NTU (+70%). UF4 averaged high at 0.57 NTU (+36%)
high flux
low TCP
high TMP
high
flux
low
TCP
high
TMP

Water Technologies & Solutions – Performance Report
3
• UF4 had two major turbidity spikes in this reporting period on Oct 24 and 25. The peak values were 3.2 and 4.7 NTU respectively. For reference, excellent turbidity is less than 0.1 NTU, and good turbidity less than approximately 0.3 NTU
Acronyms: TC = temperature corrected, BBP = before backpulse, ABP = after backpulse, RC = recovery clean, MC = maintenance clean, TMP = trans membrane pressure
TC Permeability Trends By Train
Turbidity spikes on UF4
Water Technologies & Solutions – Performance Report
4
Permeate Turbidity Trend

Water Technologies & Solutions – Performance Report
5
Before BPTMP Trend
Before BP Flux Trend
Daily Permeate Flow
Water Technologies & Solutions – Performance Report
6
Asset Summary
Plant Summary

Water Technologies & Solutions – Performance Report
1
KPI Dashboard – Avg values through reporting period
Water Technologies & Solutions – Performance Report
2
Plant Summary
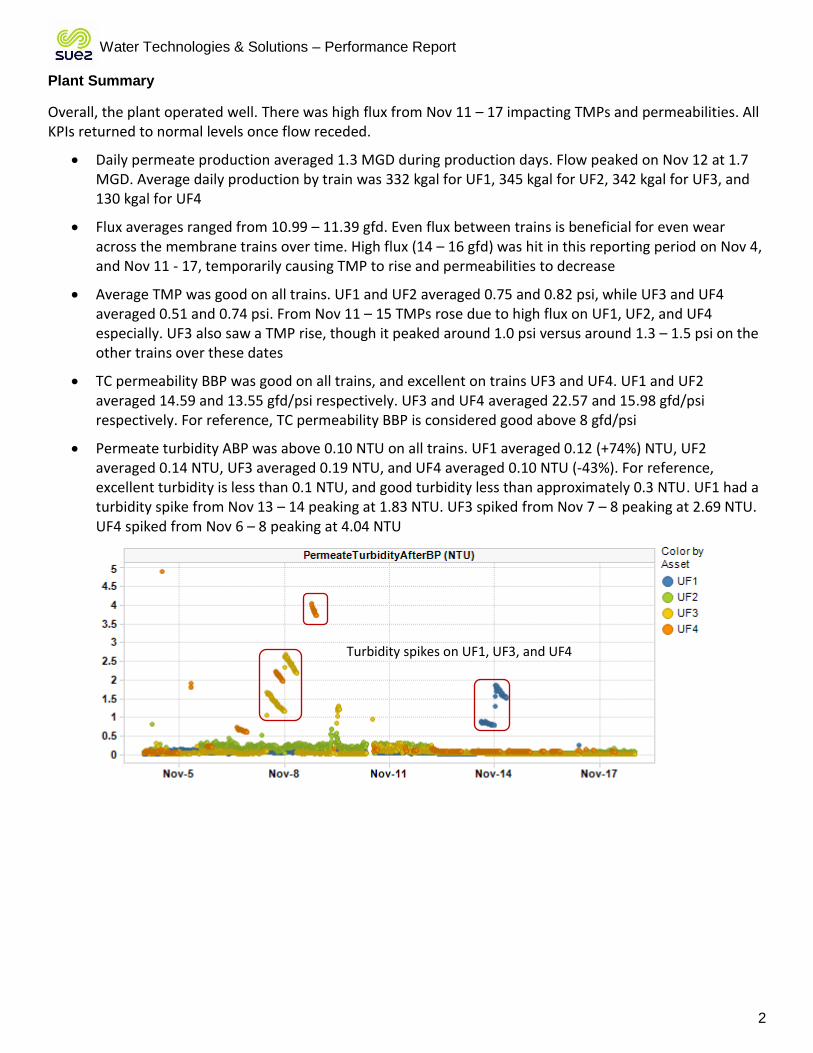
Overall, the plant operated well. There was high flux from Nov 11 – 17 impacting TMPs and permeabilities. All KPIs returned to normal levels once flow receded.
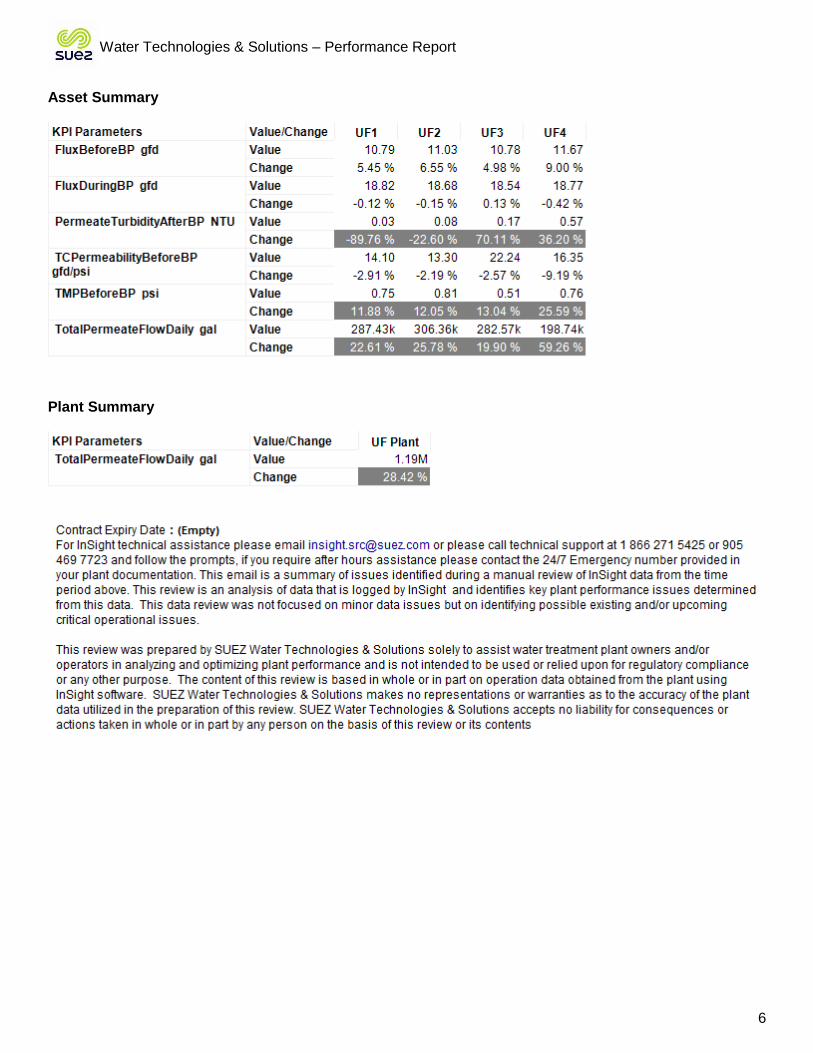
• Daily permeate production averaged 1.3 MGD during production days. Flow peaked on Nov 12 at 1.7 MGD. Average daily production by train was 332 kgal for UF1, 345 kgal for UF2, 342 kgal for UF3, and 130 kgal for UF4
• Flux averages ranged from 10.99 – 11.39 gfd. Even flux between trains is beneficial for even wear across the membrane trains over time. High flux (14 – 16 gfd) was hit in this reporting period on Nov 4, and Nov 11 - 17, temporarily causing TMP to rise and permeabilities to decrease
• Average TMP was good on all trains. UF1 and UF2 averaged 0.75 and 0.82 psi, while UF3 and UF4 averaged 0.51 and 0.74 psi. From Nov 11 – 15 TMPs rose due to high flux on UF1, UF2, and UF4 especially. UF3 also saw a TMP rise, though it peaked around 1.0 psi versus around 1.3 – 1.5 psi on the other trains over these dates
• TC permeability BBP was good on all trains, and excellent on trains UF3 and UF4. UF1 and UF2 averaged 14.59 and 13.55 gfd/psi respectively. UF3 and UF4 averaged 22.57 and 15.98 gfd/psi respectively. For reference, TC permeability BBP is considered good above 8 gfd/psi
• Permeate turbidity ABP was above 0.10 NTU on all trains. UF1 averaged 0.12 (+74%) NTU, UF2 averaged 0.14 NTU, UF3 averaged 0.19 NTU, and UF4 averaged 0.10 NTU (-43%). For reference, excellent turbidity is less than 0.1 NTU, and good turbidity less than approximately 0.3 NTU. UF1 had a turbidity spike from Nov 13 – 14 peaking at 1.83 NTU. UF3 spiked from Nov 7 – 8 peaking at 2.69 NTU. UF4 spiked from Nov 6 – 8 peaking at 4.04 NTU
Turbidity spikes on UF1, UF3, and UF4

Water Technologies & Solutions – Performance Report
3
• Maintenance clean (MC) design specifies 1 hypo/chlorine MC and 1 citric acid MC per week, per train
o UF1, UF2, and UF4 had 4 MCs (2 hypo, 2 citric) over the past 2 weeks, meeting design
o UF3 had 5 MCs (3 hypo, 2 citric) over the past 2 weeks, exceeding design which is fine
o In the following plot, the black dots indicate when an MC occurred (1 = citric, 0 = hypo). UF2 is presented below, and other UF trains are comparable. Zooming into the data, there is no large performance impact on TMP or permeability for individual MCs, either hypo or citric. This is normal for plants with low baseline TMP. Even without a decrease in TMP (and the resulting rise in permeability), regular MCs are beneficial for train longevity, as MCs will still remove thin layers of foulant which can turn irreversible over time and shorten membrane lifespan. Citric MCs are specifically important for this function as inorganic foulant layers are more prone to becoming irreversible over time than organic foulant layers. However regular hypo MCs are also important so they can remove biological growth early, as established bacterial/fungal/algal colonies are harder to remove from the fibers to restore performance
o MC and RC optimization usually occurs after the first year of operation for new membranes so there is a historical baseline for data-based decisions. For the two new membrane trains, it’s recommended to leave the cleaning at default frequency for at least the first year. The older two trains can be modified if desired, such as changing MC duration and frequency first, then looking into potential changes in temperature, concentration, and pH
Acronyms: TC = temperature corrected, BBP = before backpulse, ABP = after backpulse, RC = recovery clean, MC = maintenance clean, TMP = trans membrane pressure
1 = citric MC
0 = hypo MC

Water Technologies & Solutions – Performance Report
4
TC Permeability Trends By Train

Water Technologies & Solutions – Performance Report
5
Permeate Turbidity Trend
Before BPTMP Trend

Water Technologies & Solutions – Performance Report
6
Before BP Flux Trend
Daily Permeate Flow
Water Technologies & Solutions – Performance Report
7
Asset Summary
Plant Summary

Monthly O&M Report Page 6
Trends Influent vs Precipitation Trend Year to Date
Effluent Biological Contaminants Trend Year to Date
Monthly O&M Report Page 7
Effluent Nutrient Trends Year to Date
Pump Station Trends vs Precipitation November

Monthly O&M Report Page 8

Monthly O&M Report Page 9

Monthly O&M Report Page 10

Monthly O&M Report Page 11
Maintenance & Repair
Replaced CV-3537-3 solenoid valve Membrane Train 3 turbidimeter
Torqued all MBR air piping couplings to manufacture’s specifications
Replaced AV-3494-3 air relief valve Membrane Train 3
Received a report of a high level at pump station on Monroe St. Alarm not working. Freemire & Associates onsite to diagnose and repair issue.
Harry Caswell onsite at PS 12 to repair force main.
Keystone onsite to replace PLC in Filter Control Room
PS 12 pump sent to Hills for evaluation. Repair was not cost effective. Staff received approval from BPW to purchase a new pump.
Replaced the Anoxic Mixer on side 2 with a spare due to a seal fail alarm. Mixer sent to Hills for repair evaluation.
Replaced failed Digester membrane recirculation pump with a spare. The spare pump failed the next day. Installed a utility submersible pump until pumps are repaired.
Afterhours Alarm Callouts
10/31/2020 Low Flow Back-pulse Train 3 11/3/2020 Train 3 low flow shutdown 11/4/2020 Train 3 low flow shutdown 11/13/2020 High EQ Level 11/26/2020 High Level Trains 1,2,3,4 11/28/2020 Train 1 High Turbidity 11/29/2020 Process Blower C Low Flow
Financial Update
Caps Monthly Cap November 2020Contract Year to
DateRemaining Balance
Maintenance Cap $7,500 $ 8,500 $ 8,500 $81,500
Maintenance Expenditures
Vendor Description Expense
Harry Caswell, Inc. Repair to LEWES Pump Station #12. Sawcut 8x8 paving, remove, excavate down to force main. Replace up to 6' force main and one 90. Backfill replace paving and camera existing force main.
$8,500
Monthly O&M Report Page 12
Health & Safety
Inframark monthly training presentations – Medical and Exposure Records & Slips, Trips and Falls.
A trainer from United Rental was brought into to train and certify staff on proper operation of the forklift and skid loader at the plant.
A trainer from Delaware Safety Council was brought into train and certify staff on Confined Space Entry.
Through the end of November, Inframark Lewes employees have worked 43 days without a lost time injury.
Personnel
Name Title
Jerry Shupe Jr. Regional VP
Michael Wolgemuth Regional Manager
Jeff Deats Project Manager
Paul Gunderson Lead Operator
David Sylvester Operator II
Nick Karpin Maintenance Technician II
Tom Callahan Regional Safety Advisor