Our newly developed Simple Cognitive test can be … Cognitive test...International Conference on...
14
International Conference on Alzheimer’s Disease 2010 SessionDate: Monday, July 12,2010 Poster #: P2-123 Our newly developed Simple Cognitive test can be also used by computer or paper Hirokazu Nagata, PhD of internal medicine, Hirokazu Nagata, PhD of internal medicine, Hirokazu Nagata, PhD of internal medicine, Hirokazu Nagata, PhD of internal medicine, Yasuo Yamamoto, Ryuichi S Yasuo Yamamoto, Ryuichi S Yasuo Yamamoto, Ryuichi S Yasuo Yamamoto, Ryuichi Sakaguchi akaguchi akaguchi akaguchi Social welfare corporation Social welfare corporation Social welfare corporation Social welfare corporation Akeainosato Akeainosato Akeainosato Akeainosato-kai, kai, kai, kai, Tsu, Japan. Tsu, Japan. Tsu, Japan. Tsu, Japan. http://www.brain-riha.jp/ http://www.akeai.or.jp/ E-mail [email protected]
Transcript of Our newly developed Simple Cognitive test can be … Cognitive test...International Conference on...

International Conference on Alzheimer’s Disease 2010
SessionDate: Monday, July 12,2010 Poster #: P2-123
Our newly developed Simple
Cognitive test can be also used
by computer or paper
Hirokazu Nagata, PhD of internal medicine, Hirokazu Nagata, PhD of internal medicine, Hirokazu Nagata, PhD of internal medicine, Hirokazu Nagata, PhD of internal medicine,
Yasuo Yamamoto, Ryuichi SYasuo Yamamoto, Ryuichi SYasuo Yamamoto, Ryuichi SYasuo Yamamoto, Ryuichi Sakaguchiakaguchiakaguchiakaguchi
Social welfare corporationSocial welfare corporationSocial welfare corporationSocial welfare corporation AkeainosatoAkeainosatoAkeainosatoAkeainosato----kai, kai, kai, kai,
Tsu, Japan.Tsu, Japan.Tsu, Japan.Tsu, Japan.
http://www.brain-riha.jp/
http://www.akeai.or.jp/
E-mail [email protected]

AimAimAimAim:::: Simple Cognitive test (SC-test) is our newly developed test
for early detection of cognitive function's decline. It was examined
whether the same evaluation would be obtained also by computer
or paper.
Methods:Methods:Methods:Methods: In SC-test, figures are located in 8 lines. A reference
figure is at the left end of each line. There are 9 types of figures,
which are combination of three shapes (star, quadrilateral,
triangle) and three colors (blue, yellow, red). In three minutes, a
testee chooses the figures in which both of shape and color are
different from the reference figure. In this test, full mark is 50
points. Points are subtracted when figures are chosen by mistake.
We can use this test by computer or paper. In this study, it was
examined whether there is a difference between paper and
computer(with touch panel monitor). Candidates were 18 persons
of day rehabilitation users.
In order to have experience, the tests by paper and computer
were done on the 1st time, and these were not adopted as data.
The 2nd time of tests were performed after 2 to 33 days from the
1st time, and we used paper in the morning, computer in the
afternoon. The 3rd time of tests were performed after 4 to 10 days
from the 2nd time, and we used computer in the morning, paper in
the afternoon.

Afternoon
1111stststst time time time time
for experience
2222ndndndnd time time time time
for data 3333rdrdrdrd time time time time
for data 2~33 days 4~10 days
Morning Morning Afternoon
Paper Computer with
touch panel
Computer with
touch panel
Paper
ResultsResultsResultsResults::::
The average age of 18 persons of day rehabilitation users is 79.4
(±7.37) year-old. The average point from 35 data by paper test is
20.49(±11.53). The average point from 35 data by computer test
is 20.71(±11.33).
The procedure of data acquirement.The procedure of data acquirement.The procedure of data acquirement.The procedure of data acquirement.
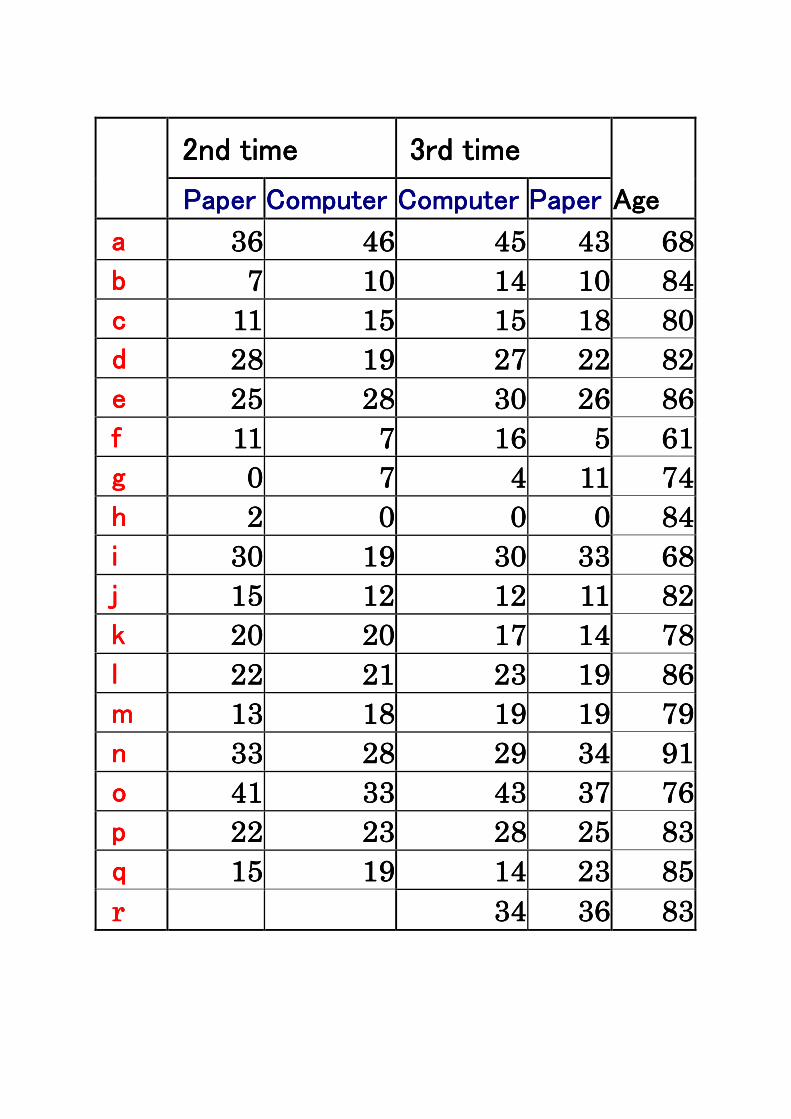
2nd time2nd time2nd time2nd time 3rd time3rd time3rd time3rd time
Paper Paper Paper Paper CCCComputeromputeromputeromputer ComputerComputerComputerComputer PaperPaperPaperPaper AgeAgeAgeAge
a a a a 36363636 46464646 45454545 43434343 68686868
b b b b 7777 10101010 14141414 10101010 84848484
c c c c 11111111 15151515 15151515 18181818 80808080
d d d d 28282828 19191919 27272727 22222222 82828282
e e e e 25252525 28282828 30303030 26262626 86868686
f f f f 11111111 7777 16161616 5555 61616161
g g g g 0000 7777 4444 11111111 74747474
h h h h 2222 0000 0000 0000 84848484
i i i i 30303030 19191919 30303030 33333333 68686868
j j j j 15151515 12121212 12121212 11111111 82828282
k k k k 20202020 20202020 17171717 14141414 78787878
l l l l 22222222 21212121 23232323 19191919 86868686
m m m m 13131313 18181818 19191919 19191919 79797979
n n n n 33333333 28282828 29292929 34343434 91919191
o o o o 41414141 33333333 43434343 37373737 76767676
p p p p 22222222 23232323 28282828 25252525 83838383
q q q q 15151515 19191919 14141414 23232323 85858585
r r r r 34343434 36363636 83838383

The line graph of SCThe line graph of SCThe line graph of SCThe line graph of SC----test datatest datatest datatest data
for parallel forms refor parallel forms refor parallel forms refor parallel forms reliabilityliabilityliabilityliability....
0
5
10
15
20
25
30
35
40
45
50
Paper Computer
ab
cd
ef
ghI
jk
lm
nop
qa'
b'c'
d'e'f'
g'h'
i'j'
k'l'm'
n'o'
p'q'
r'

The line graph of SCThe line graph of SCThe line graph of SCThe line graph of SC----test datatest datatest datatest data
for testfor testfor testfor test----retest reliability.retest reliability.retest reliability.retest reliability.
0
5
10
15
20
25
30
35
40
45
50
PointPointPointPoint
a
b
c
d
e
f
g
h
i
j
k
l
m
n
o
p
q
2222ndndndnd time 3 time 3 time 3 time 3rdrdrdrd time time time time
paper computer computer paper
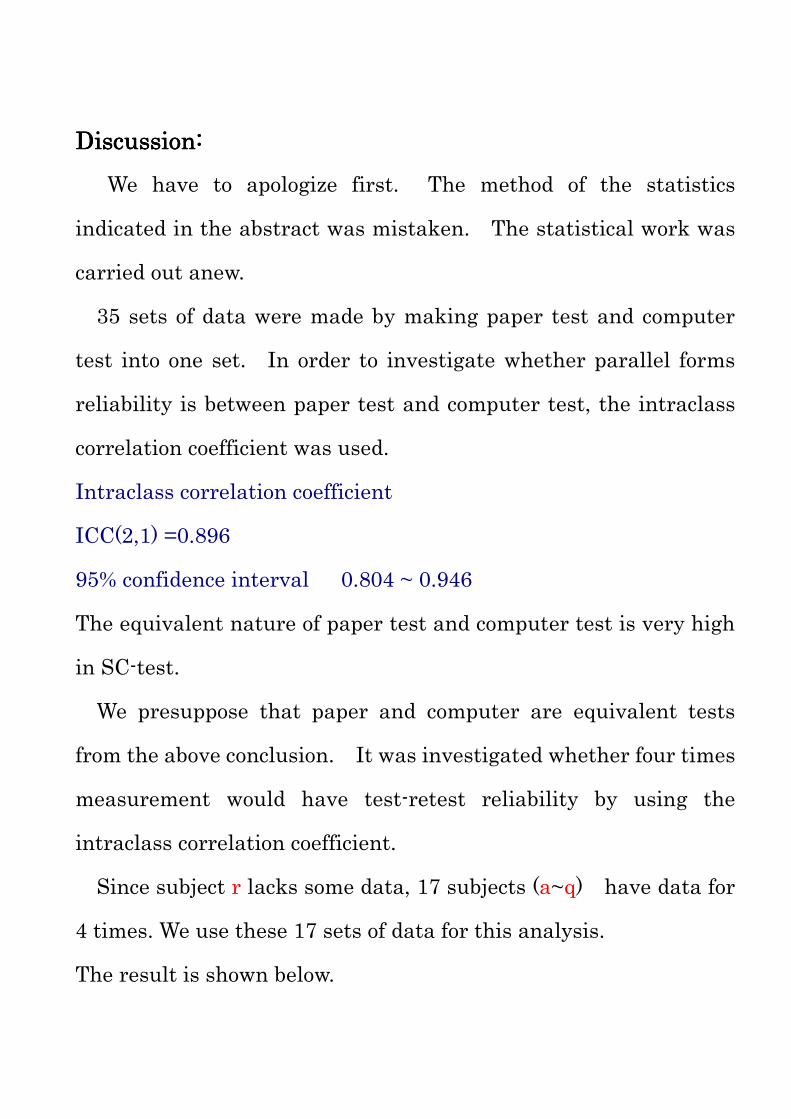
Discussion: Discussion: Discussion: Discussion:
We have to apologize first. The method of the statistics
indicated in the abstract was mistaken. The statistical work was
carried out anew.
35 sets of data were made by making paper test and computer
test into one set. In order to investigate whether parallel forms
reliability is between paper test and computer test, the intraclass
correlation coefficient was used.
Intraclass correlation coefficient
ICC(2,1) =0.896
95% confidence interval 0.804 ~ 0.946
The equivalent nature of paper test and computer test is very high
in SC-test.
We presuppose that paper and computer are equivalent tests
from the above conclusion. It was investigated whether four times
measurement would have test-retest reliability by using the
intraclass correlation coefficient.
Since subject r lacks some data, 17 subjects (a~q) have data for
4 times. We use these 17 sets of data for this analysis.
The result is shown below.

Intraclass correlation coefficient
ICC(1,1) =0.905
95% confidence interval 0.817 ~ 0.960
It turns out that there is strong test-retest reliability in SC-test
from this result.
Conclusion: Conclusion: Conclusion: Conclusion: SC-test can be done also by paper or computer, and
an equal result is obtained. And test-retest reliability is also high.
We have already reported that SC-test detects an early decline of
cognitive function. And this time it turned out that SC-test is
very convenient because paper and computer can be use similarly. In order to record progress of cognitive function’s decline or to
carry out self-diagnosis, it is good to use a computer. The other
hand, it is good to use paper for testing many persons at once.
You can download the computer program and the PDF You can download the computer program and the PDF You can download the computer program and the PDF You can download the computer program and the PDF
document of document of document of document of SCSCSCSC----testtesttesttest from the following site from the following site from the following site from the following site for for for for freefreefreefree....
(((( SCSCSCSC----test test test test computer program supports Windows 98, XP, computer program supports Windows 98, XP, computer program supports Windows 98, XP, computer program supports Windows 98, XP,
Vista and 7.Vista and 7.Vista and 7.Vista and 7. TTTThis program corresponds to the ASCII his program corresponds to the ASCII his program corresponds to the ASCII his program corresponds to the ASCII
keyboardkeyboardkeyboardkeyboard and touch panel. and touch panel. and touch panel. and touch panel. ))))
http://www.akeai.or.jp/http://www.akeai.or.jp/http://www.akeai.or.jp/http://www.akeai.or.jp/
((((Please download newest program from this site.Please download newest program from this site.Please download newest program from this site.Please download newest program from this site.))))
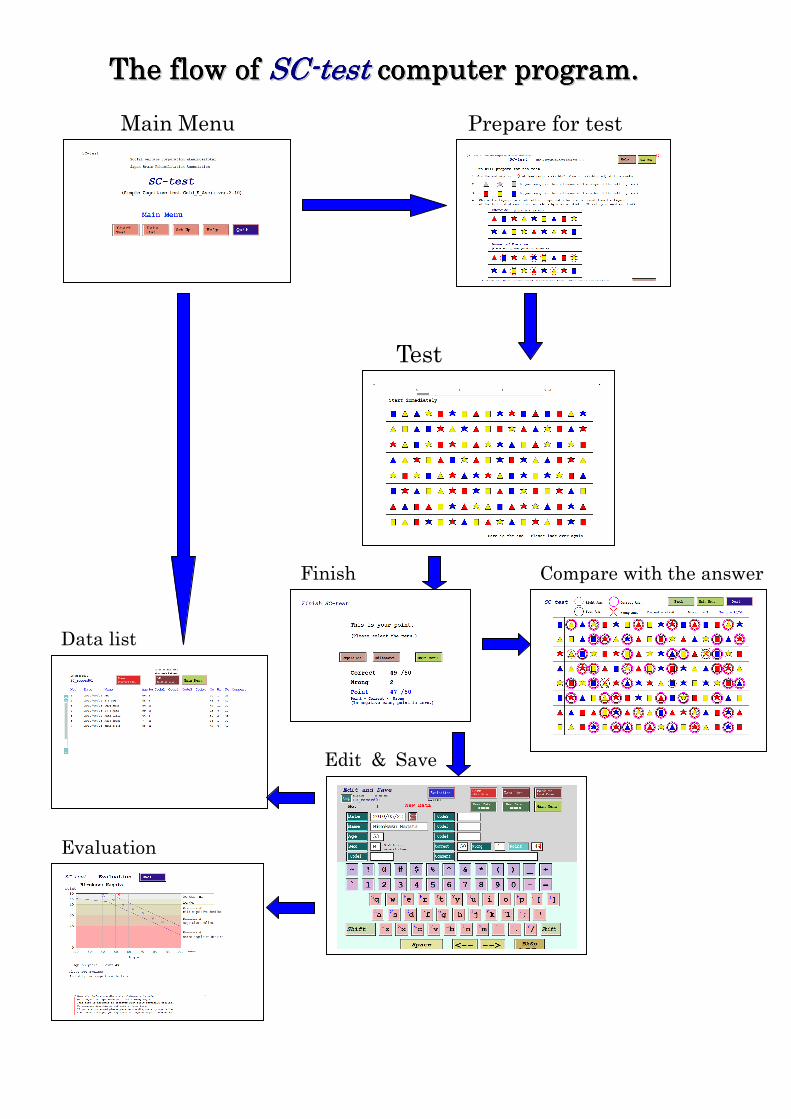
Edit & Save
Prepare for test
Data list
Evaluation
Finish
Main Menu
Test
Compare with the answer
TTTTTTTThhhhhhhheeeeeeee fffffffflllllllloooooooowwwwwwww ooooooooffffffff SSSSSSSSCCCCCCCC--------tttttttteeeeeeeesssssssstttttttt ccccccccoooooooommmmmmmmppppppppuuuuuuuutttttttteeeeeeeerrrrrrrr pppppppprrrrrrrrooooooooggggggggrrrrrrrraaaaaaaammmmmmmm........

The PDF document is also The PDF document is also The PDF document is also The PDF document is also preparedpreparedpreparedprepared for for for for SCSCSCSC----testtesttesttest. . . .

Already reported information about SCAlready reported information about SCAlready reported information about SCAlready reported information about SC----test test test test
(Nippon Ronen Igakkai Zasshi 2010; 47: 235-242)
A simple cognitive test which detects early decline in cognitive A simple cognitive test which detects early decline in cognitive A simple cognitive test which detects early decline in cognitive A simple cognitive test which detects early decline in cognitive
functionfunctionfunctionfunction
Yasuo Yamamoto, Ryuichi Sakaguchi, Hirokazu NagataYasuo Yamamoto, Ryuichi Sakaguchi, Hirokazu NagataYasuo Yamamoto, Ryuichi Sakaguchi, Hirokazu NagataYasuo Yamamoto, Ryuichi Sakaguchi, Hirokazu Nagata
Social welfare corporation AkeainosatSocial welfare corporation AkeainosatSocial welfare corporation AkeainosatSocial welfare corporation Akeainosatokaiokaiokaiokai
AbstractAbstractAbstractAbstract
Aim:Aim:Aim:Aim: The aim of this study was to examine our new cognitive test which detects early decline
in cognitive function.
Methods:Methods:Methods:Methods: Our newly developed Simple Cognitive test (SC-test) takes 3 minutes, during
which participants choose the figures in which both the shape and color are different from
the figure on the left end of each line. The top score is 50 points. In a normal control study,
the SC-test was given to 271 nursing home staff. We gave the Mini Mental State
Examination (MMSE), Frontal Assessment Battery (FAB) and SC-test, to 114 participants in
day-rehabilitation (Day group).
Results:Results:Results:Results: For the normal candidates, most young participants obtained nearly full marks. The
average mark of those aged 18 to 29 was 48.1 (±3.40) points, while that for those 60 to 69 was
36.2(±11.6) points. The average age of the Day group was 80.2 (±6.2), the MMSE average
score was 23.8 (±4.3) points, the average FAB score was 11.2 (±3.5) points and the average on
the SC-test was 13.1 (±11.5) points. The correlation coefficient between the SC-test and
MMSE was r=0.569 (p=4.17×10⁻¹¹), while that of the FAB was r=0.664(p=6.661×10⁻¹⁶). In
the 3-dimensional scatter chart of the three tests, despite near full marks on MMSE, people
who obtained low scores on the FAB test also had low scores on the SC-test.
Conclusions:Conclusions:Conclusions:Conclusions: The SC-test is very simple to use, and it has very high sensitivity and specificity
regarding early decline in cognitive function, especially frontal lobe function.

The histogram of SC-test according to age in normal candidates.
(A horizontal axis is point and vertical axis is the number of people.)
The histogram of SC-test, MMSE and FAB in Day group.
(A horizontal axis is point and vertical axis is the number of people.)

The two-dimensional scatter chart between each test in Day group.
The three-dimensional scatter chart of three tests in Day group.
(SC-test)=1.51*(MMSE)-22.8
r=0.569 (p=4.17*10-11)
(SC-test)=2.21*(FAB)-11.7
r=0.664(p=6.66*10-16)
(MMSE)=0.872*(FAB)+14.0
r=0.695(p=2.20*10-16)
(SC-test)=0.550*(MMSE)+1.74*(FAB)-19.4
R=0.681, adjusted R=0.674(p=9.9*10-16)

Age 18-29 30-39 40-49 50-59 60-69
Whole Number of data 93 57 41 55 25
Average of age 24.7 33.5 45.3 54.9 63
Average of SC-test 48.1 47.5 45.7 40.4 36.2
Standard deviation 3.4 5.22 5.52 10.2 11.6
Male Number of data 32 30 4 6 4
Average of age 25.4 32.6 42.3 55.7 65
Average of SC-test 48.9 47 48.8 43.7 39.3
Standard deviation 1.83 6.01 1.64 5.93 7.56
Female Number of data 61 27 37 49 21
Average of age 24.3 34.6 45.6 54.8 62.6
Average of SC-test 47.8 48.1 45.4 40 35.6
Standard deviation 3.92 4.09 5.69 10.5 12.1
Man-and-woman
difference of SC-test Welch t-test p-value 0.067 0.41 0.027 0.257 0.503
Allotment Average Average/Allotment Correlation coefficient
p-value
M-1 5 3.97 0.794 0.327 3.87×10⁻⁴
M-2 5 4.12 0.824 0.466 1.71×10⁻⁷
M-3 3 2.98 0.993 0.014 8.83×10⁻¹
M-4 5 2.53 0.506 0.418 3.70×10⁻⁶
M-5 3 2.14 0.713 0.267 4.11×10⁻³
M-6 2 1.96 0.980 0.231 1.33×10⁻²
M-7 1 0.877 0.877 0.155 9.88×10⁻²
M-8 3 2.71 0.903 0.169 7.21×10⁻²
M-9 1 0.921 0.921 0.246 8.42×10⁻³
M-10 1 0.711 0.711 0.274 3.22×10⁻³
M-11 1 0.842 0.842 0.326 4.06×10⁻⁴
Analysis of SC-test according to sex and to age in normal candidate.
Correlation with SC-test and low rank item of MMSE in Day group.