Our Manufacturing Fix? · Plant & Eqpt Expense 520,000$ 25% lower 390,000$ ... 5% interest rate....
33
Our Manufacturing Fix? Presentation of Dr. Daniel Luria Research Director Michigan Mfg Technology Center at the EARN Conference St. Louis September 13, 2006
Transcript of Our Manufacturing Fix? · Plant & Eqpt Expense 520,000$ 25% lower 390,000$ ... 5% interest rate....

Our Manufacturing Fix?
Presentation of Dr. Daniel LuriaResearch Director
Michigan Mfg Technology Centerat the
EARN ConferenceSt. Louis
September 13, 2006

© 2006 MMTC Performance Benchmarking Service2
US Mfg Crisis: Expect No Action
02000400060008000
1000012000140001600018000
US MfgJobs (000)
Jun-98Sep-05
• Loss of 3.5 million mfg jobs since mid-1998 widely bemoaned, inciting roughly zero response
• Elite consensus on free trade, legacy cost pain, risks of pushing structural health & pension changes
• China-bashing just for show: • “China” is also US MNCs.• Perfect circle: Asians keep
our rates low; we refinance and shop at Wal-Mart.

© 2006 MMTC Performance Benchmarking Service3
Crisis: An Opening for Many Bad Agendas
• Cut business taxes• Roll back regulations• Raise healthcare co-pays• Terminate retiree health insurance
coverage• Become a “right-to-work” state• Forget about manufacturing (“It’s
all going to China”):• High-tech sectors• Knowledge-intensive jobs• Life sciences• Nanotechnology• Homeland security

© 2006 MMTC Performance Benchmarking Service4
About Those “Knowledge-Intensive” Jobs …(Some Michigan Data)
"Knowledge Work" Sector Employs … But Also …
Michigan Jobs 7/03
Michigan Jobs 7/06 Change
Information Services Systems Analysts
Help Desk Jockeys
68,300 67,400 -1.3%
Financial Services Financial Advisors
Your State Farm Agent's Janitor
214,000 217,500 1.6%
Professional, Scientific, & Technical Services Scientists Meter Readers 245,400 247,900 1.0%
Education & Health Services
Professors Nursing Home Attendants
552,500 575,300 4.1%
1,080,200 1,108,100 2.6%
Take away health insurance from 150,000 auto workers and retirees, and there’s no growth.

© 2006 MMTC Performance Benchmarking Service5
So Think about Companies, not Sectors
• 80% of the companies with 20+ employees that will be in business in 2010 are in business here now.
• Every sector has good and bad companies.• Richer regions have more good, and fewer bad, ones.• Getting richer means helping more companies get
good.• Manufacturing matters the most because of its large
out-of-region exports and its large multiplier effects from in-region purchasing. Policy could encourage both, but seldom does.
© 2006 MMTC Performance Benchmarking Service6
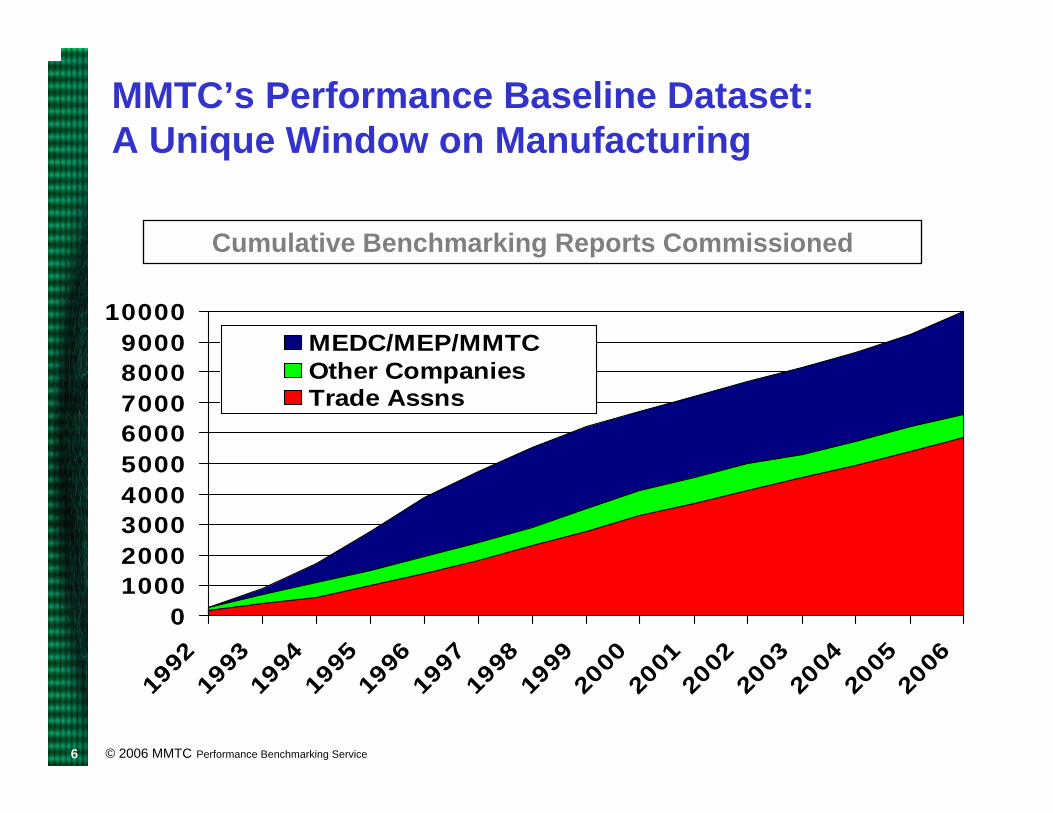
0100020003000400050006000700080009000
10000
1992
1993
1994
1995
1996
1997
1998
1999
2000
2001
2002
2003
2004
2005
2006
MEDC/MEP/MMTCOther CompaniesTrade Assns
Cumulative Benchmarking Reports Commissioned
MMTC’s Performance Baseline Dataset:A Unique Window on Manufacturing

© 2006 MMTC Performance Benchmarking Service7
Sectoral Variation Among Auto SuppliersSector Metric 25th Median 75th 90th
VA/FTE 54,687$ 74,249$ 89,316$ 125,177$ 1.7Good 1st Time 97.00% 98.58% 99.64% 99.97% 47.3Employee Turnover 31.6% 17.1% 8.3% 0.0% infiniteVA/FTE 36,199$ 53,331$ 72,492$ 112,053$ 2.1Good 1st Time 93.19% 96.66% 99.10% 99.46% 6.2Employee Turnover 37.4% 31.9% 10.4% 5.5% 5.8VA/FTE 54,034$ 64,012$ 84,529$ 112,439$ 1.8Good 1st Time 94.19% 97.00% 98.80% 99.85% 20.0Employee Turnover 46.3% 23.2% 11.7% 0.0% infiniteVA/FTE 59,235$ 67,625$ 82,117$ 105,566$ 1.6Good 1st Time 90.00% 95.50% 98.50% 99.40% 7.5Employee Turnover 27.0% 17.9% 9.7% 0.0% infiniteVA/FTE 66,621$ 90,271$ 141,286$ 226,168$ 2.5Good 1st Time 88.57% 96.17% 98.80% 99.90% 38.3Employee Turnover 37.3% 16.3% 9.1% 5.3% 3.1VA/FTE 30,567$ 43,007$ 69,929$ 91,577$ 2.1Good 1st Time 92.25% 95.41% 98.08% 99.44% 8.2Employee Turnover 47.1% 28.3% 11.7% 5.6% 5.1
Dies, Molds, Prototypes
Machine Tools
Electricals / Electronics
90th vs. Median
Percentile Cutpoint
Stamping
Molding
Machined Parts
Variance within sector swamps variance between sectors, even for firms serving the same customers.

© 2006 MMTC Performance Benchmarking Service8
No shop is “best,” but one metric is key:
VALUE-ADDEDFTE
Value-Added = Sales – PurchasesFTE = Employee Annual Hrs / 2080

© 2006 MMTC Performance Benchmarking Service9
Middle Third Upper ThirdLower Third
0
2000
0
4000
0
6000
0
8000
0
1000
00
1200
00
1400
00
1600
00
1800
00
2000
00
Source: Performance Benchmarking Service
Top third on VA/FTE:
60% with EBIT > 10%
80% with wage >= $750/week
VA/FTE: worst shop in top 10% twice as productive as median shop

© 2006 MMTC Performance Benchmarking Service10
The Three Manufacturing’s
Attention is quite properly on job and income threats to workers and retirees at Delphi, GM, Deere, etc. – high-pay, high-productivity, big & deep supply chains
Much of the rest of “manufacturing”is far less worthy of attention:• Lower-pay jobs• Lower productivity• Failure to export from state• Few links to rest of economy
via lack of in-region purchases
0
10
20
30
40
50
60
% of Mfg Jobs
Bigs
GoodSmallsOtherSmalls

© 2006 MMTC Performance Benchmarking Service11
What’s a “Good Small”? How About This?:
• Company (not just plant) < 500 employees• Value-Added / FTE > average for its industry• Avg. Hourly Wage >= 3 * Federal Minimum Wage• Hourly Worker Payroll + Benefits >= 0.5 * Value-Added• Healthcare Coverage for >= 85% of Hourly Workers• Employer Healthcare Premium >= $5,000 / Covered
Worker• Employees Using Computers >= 67% of Employees• Employee Turnover Rate < 20%
Why should any public tax or training moneybe spent on any manufacturer that doesn’t
meet these criteria?

© 2006 MMTC Performance Benchmarking Service12
The Power of Common Definition and Data
• What if every firm seeking public support had to be audited for “good small” status?
• What if a multi-state region used a common definition and measurement tool?
• What if EARN groups adopted the approach, helped collect (or demand the collection of) the data, and publicized giveaways to firms that don’t measure up?

© 2006 MMTC Performance Benchmarking Service13
Supporting Good Smalls …and Growing More of Them
1. Get Clear: Measure to determine “compliance” and to identify performance deficits
Address Deficits2. Get Lean: Attack waste in the plant and office3. Get Busy: Use lower costs to quote for growth; look for
more customers in more markets
The RecipeTake the actions that will close the cost gap, & theninvest savings in reducedexposure to price-based
competition.

© 2006 MMTC Performance Benchmarking Service14
Thinking About Offshore Competition …Comparing a US manufacturer to alow-wage offshore competitor
US Assumption About Offshore OffshoreFTE Employees 70.0 1/4 as productive 324.3Annual Payroll per FTE 32,422$ 1/10 as expensive 3,242$ Annual Fringes per FTE 5,721$ 1/20 as expensive 286$ COGS Labor 2,670,000$ 1,144,083$ Purchased Material & Svcs 3,910,000$ 10% cheaper per unit 3,831,800$ Utilities 400,000$ 10% cheaper per MMBTU 416,910$ Plant & Eqpt Expense 520,000$ 25% lower 390,000$
Total COGS 7,500,000$ 5,782,793$
Cost of Goods Sold (COGS)

© 2006 MMTC Performance Benchmarking Service15
Thinking About Offshore Competition …
US Assumption About Offshore OffshoreFTE Employees 10 2/3 as productive 15Annual Payroll per FTE 53,550$ 1/2 as expensive 26,775$ Annual Fringes per FTE 9,450$ 1/4 as expensive 2,363$ SG&A Labor 630,000$ 437,063$ Purchased Services 350,000$ 10% cheaper per unit 262,500$ Utilities 20,000$ 10% cheaper per MMBTU 18,000$
Total SG&A 1,000,000$ 717,563$
Selling, General, & Administrative Expense (SG&A)

© 2006 MMTC Performance Benchmarking Service16
Thinking About Offshore Competition …
COGS 7,500,000$ 5,782,793$ SG&A 1,000,000$ 717,563$ Interest Expense:Inventory 49,498$ 76,330$ Receivables 61,250$ 61,250$
Own-Country Cost 8,610,748$ 6,637,936$ Import Costs:Duty & Freight -$ 8% of Own-Country Cost 531,035$ Logistics & Oversight -$ $100,000 + 1% of Own-Country Cost 166,379$ Time on the Water -$ 1/12 year x 5% of Own-Country Cost 27,658$
Landed Cost 8,610,748$ 7,363,008$ Landed Cost Index 116.95 100.00
Memo: VA/FTE 66,500$ 16,125$
Total Landed Cost
5% interest rate

© 2006 MMTC Performance Benchmarking Service17
Thinking About Offshore Competition …
Initiative Value ChangeMemo: Baseline 116.95
Reduce Waste 10% 116.70 -0.25Reduce Material Cost 10% 112.63 -4.32Reduce Pay 10% 113.12 -3.83Reduce Fringes 10% 116.27 -0.67Increase Productivity 10% 112.44 -4.50Devalue US Dollar 10% 106.54 -10.41
Cuts FTE heads from 70 to 73Raises offshore costs
Payoff to US Initiatives
Cuts material cost (and maybe weight)Cuts labor costs
(but may increase turnover)
Impact of InitiativeLanded Cost Index
Cuts labor, capital, & material cost
Productivity growth and product redesign to remove material cost have to be the focus.

© 2006 MMTC Performance Benchmarking Service18
Not All US Manufacturers Doomed by Low-Wage Country Firms’ Lower Average Landed Cost
Unit Cost
% o
f Man
ufac
ture
rs Lowest-Cost
Lowest-Cost U.S.: better than “China”median
U.S. Mfrs within striking distance of “China” median
“China”U.S.
Higher Lower
100 75

© 2006 MMTC Performance Benchmarking Service19
Get More Good Smalls Lean
Recipe Known, Execution Uneven, Motivation Irrelevant• 5S• Value stream mapping• Standardized work• Visual controls• Pull systems• Kanbans• Work balancing• Quick changeover• Total predictive maintenance• Poka-yoka (error-proofing)• Cellular manufacturing• Kaizen events

© 2006 MMTC Performance Benchmarking Service20
Lean Works on Many Productivity Levers.
Often, the largest opportunities are in the office, not the plant.

© 2006 MMTC Performance Benchmarking Service21
But Lean is Only a Ticket to the Game.
• Lean manufacturing is a theory and a set of tools, not a conspiracy.
• By reducing non-value-added activity, it reduces labor requirements per unit.
• Unless the capacity freed up by lean can be used to make more output, jobs will be lost (& customers may pocket most of the cost reduction).
Also need:Low-cost, repeatable interventions re: product redesignA way to get more good small manufacturers busy
With calls for changes in national trade policy unheeded, the only real levers are state and regional.

© 2006 MMTC Performance Benchmarking Service22
Time is Money: A Year (8760 Hrs) in the Life of a Machine
0
1000
2000
3000
4000
5000
6000
Running Waiting
More Orders
Setup
Maintenance
Approval
ToolingMaterial
(much lower in capital goods)

© 2006 MMTC Performance Benchmarking Service23
Rx: Import Substitution
• More in-region manufacturers have to get goodenough to start (or go back to) making things now imported by sharply cutting costs via productivity and material design-out.
• State government should consider:• Building a trade bloc with OH, IN, IL, WI, &
southern Ontario• Conditioning tax breaks & training packages on high
in-region purchasing

© 2006 MMTC Performance Benchmarking Service24
Job 3: Get Good Smalls Busy
Only Busy Lean Companies Make Good Money:• Fixed cost absorption math • Lean companies not thrown out of control by higher
volume because pull systems can’t be flooded.• With production pulled by customer demand, the
best lean companies can make money with more, but smaller, orders.
How do we get more good small manufacturers busier?

© 2006 MMTC Performance Benchmarking Service25
Get Busy at What the World Buys from Us
• Despite great differences in industry mix, five Upper Great Lakes states share:• Common key export sectors (equipment, auto
parts)• Large intra-state trade in related inputs• Huge intra-regional trade in related inputs• A common (if mistaken) reputation for being
high-wage, high-tax, & union-friendly
… and hence, perhaps, a common fate that justifies common action

© 2006 MMTC Performance Benchmarking Service26
Defining a Region?
County-level location coefficients show exaggerated jobshare in “equipment” and auto parts in Michigan + Ohio + Wisconsin + (Illinois + 20 Iowa edge counties + metro St. Louis) + (Indiana + metro Louisville) + metro Buffalo.
ITA data on exports shows exaggerated – but declining -- share of exports in “machinery” and auto parts from the East North Central region (MI, OH, WI, IL, IN).
Custom REMI runs show exaggerated intra-region purchasing by “equipment” and auto parts companies … but also large and fast-growing imports from upper Southeast and offshore.
Were the data available, southern Ontario would probably prove to be part of this region as well.

© 2006 MMTC Performance Benchmarking Service27
Principles of Trade-Based Economic Development
• Better jobs = more income, so advantage good smalls• Advantage companies (facilities, really) that:
1. Bring in other people’s money by exportingbeyond the state and, especially, the region.
2. Keep our income here by purchasing more inputs within the state or, next best, the rest of the region. This includes tying incentives to large firms to their in-region purchasing.
3. Meet “good small” criteria and purchase from in-region suppliers that also comply.
• Reduce energy imports via conservation and substituting made-in-region alternatives

© 2006 MMTC Performance Benchmarking Service28
Region Imports Twice the “Equipment” It Did in 1996 & What It Makes Has a Twice the Out-of-Region Content …

© 2006 MMTC Performance Benchmarking Service29
“Equipment” + Auto Parts Imports Total $74 Billion, Costing Our Region ~1.3 Million Jobs

© 2006 MMTC Performance Benchmarking Service30
Energy Imports are the Region’s Largest Income Leakage, even Larger than “Equipment” & Auto Parts.
Fuel Type UnitEstimated Regional
Consumption
Estimated Regional
Production
Estimated Regional Imports
Estimated 2004 Region
Cost
Projected 2006 Region Cost
Petroleum Products
millions of gallons
42,335 1,058 41,277 51,595,869$ 74,298,051$
Natural Gas
thousands of cubic
feet (MCF)3,692,663 364,647 3,328,016 29,502,186$ 44,253,279$
Coal millions of short tons
253 90 163 4,222,121$ 4,222,121$
Total 85,320,175$ 122,773,450$
Great Lakes Bloc Energy Leakages
Source: MMTC analysis of EIA data
… but beware of subsidies masquerading as inducements to “energy independence.”

© 2006 MMTC Performance Benchmarking Service31
A Near-Term Agenda?
• Measure & score “500” smaller state mfrs with 50-499 employees in 2007; identify “150” good ones for future targeting.
• Identify common problems among these “good smalls” to permit economies of scale in solving them.
• Pressure major OEMs to share their supplier data, asking what’s needed to do more in-region.
• Condition any extraordinary state support on the provision of this information, en route to conditioning such support on job quality and growing in-region purchasing.
• Build analytic capacity in the state and region through partnership with MEPs, universities, etc.
© 2006 MMTC Performance Benchmarking Service32
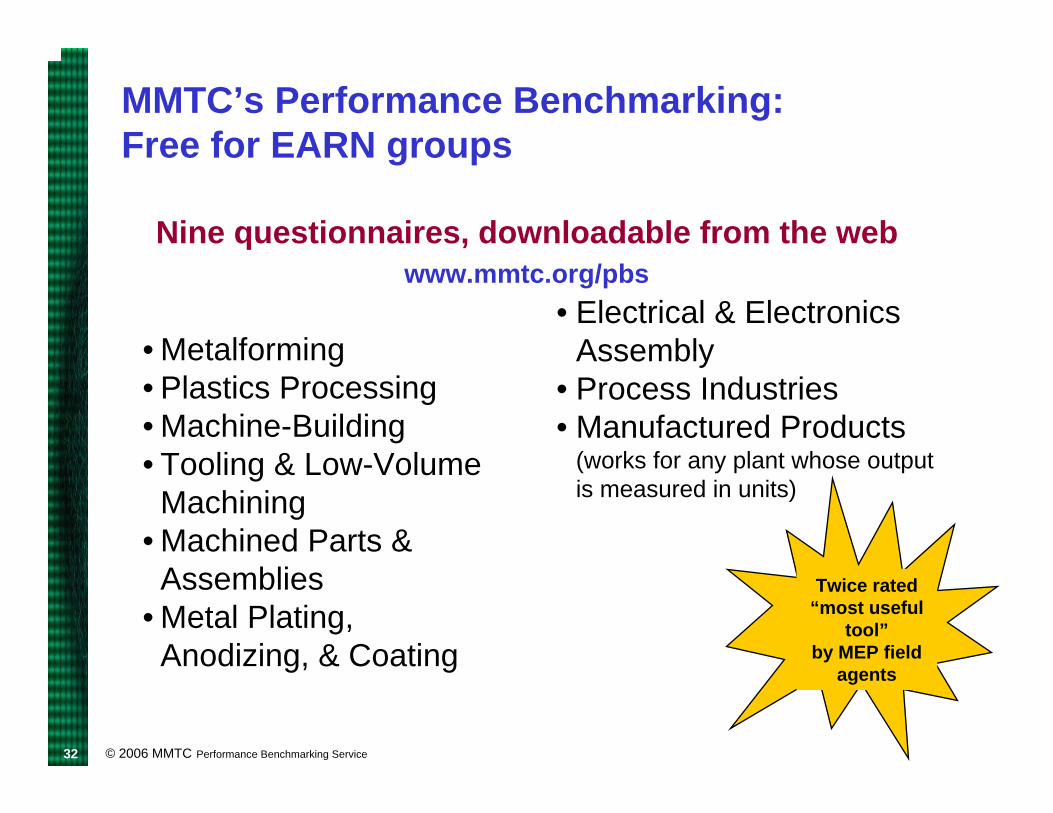
MMTC’s Performance Benchmarking:Free for EARN groups
Nine questionnaires, downloadable from the webwww.mmtc.org/pbs
• Metalforming• Plastics Processing• Machine-Building• Tooling & Low-Volume
Machining• Machined Parts &
Assemblies• Metal Plating,
Anodizing, & Coating
• Electrical & Electronics Assembly
• Process Industries• Manufactured Products
(works for any plant whose output is measured in units)
Twice rated “most useful
tool”by MEP field
agents

© 2006 MMTC Performance Benchmarking Service33
A Slightly Longer-Term Agenda
• Condition servicing of OEMs on their growth in in-region purchasing.
• Use State purchasing power to set an example and provide initial traction for buying here.
• Tie discounts on training, technical assistance, etc. to in-region purchasing and beyond-region exporting.
• Convert energy challenges into an opportunity toreduce region’s energy imports and attach its good smalls to alternative energy OEMs.