Our Environment in Hot Water: Comparing Water … · See Diagrams 1 and 2 for pictures of tank and...
28
LBNL-4602E Our Environment in Hot Water: Comparing Water Heaters, A Life Cycle Approach Comparing Tank and Tankless Water Heaters in California Alison Lu, James McMahon, Eric Masanet, Jim Lutz Energy Analysis Department Lawrence Berkeley National Laboratory One Cyclotron Road Berkeley, CA 94720 August 2008 This work was supported by the Assistant Secretary for Energy Efficiency and Renewable Energy, Office of Building Technology, State, and Community Programs, of the U.S. Department of Energy under Contract No. DE- AC02-05CH11231.
Transcript of Our Environment in Hot Water: Comparing Water … · See Diagrams 1 and 2 for pictures of tank and...
LBNL-4602E
Our Environment in Hot Water:
Comparing Water Heaters,
A Life Cycle Approach
Comparing Tank and Tankless
Water Heaters in California
Alison Lu, James McMahon, Eric Masanet, Jim Lutz Energy Analysis Department Lawrence Berkeley National Laboratory One Cyclotron Road Berkeley, CA 94720
August 2008 This work was supported by the Assistant Secretary for Energy Efficiency and Renewable Energy, Office of Building Technology, State, and Community Programs, of the U.S. Department of Energy under Contract No. DE-AC02-05CH11231.
DISCLAIMER
This document was prepared as an account of work sponsored by the United States Government. While this document is believed to contain correct information, neither the United States Government nor any agency thereof, nor The Regents of the University of California, nor any of their employees, makes any warranty, express or implied, or assumes any legal responsibility for the accuracy, completeness, or usefulness of any information, apparatus, product, or process disclosed, or represents that its use would not infringe privately owned rights. Reference herein to any specific commercial product, process, or service by its trade name, trademark, manufacturer, or otherwise, does not necessarily constitute or imply its endorsement, recommendation, or favoring by the United States Government or any agency thereof, or The Regents of the University of California. The views and opinions of authors expressed herein do not necessarily state or reflect those of the United States Government or any agency thereof or The Regents of the University of California.
Our Environment in Hot Water: Comparing Water Heaters A Life Cycle Approach Comparing Tank and Tankless Water Heaters in California
Alison Lu, James McMahon, Eric Masanet, Jim Lutz
Lawrence Berkeley National Laboratory Berkeley, California
August 13, 2008
1
ABSTRACT
Our Environment in Hot Water: Comparing Water Heaters A Life Cycle Approach Comparing Tank and Tankless Water Heaters in California
ALISON LU (Yale University, New Haven, CT 06520) JAMES MCMAHON, ERIC
MASANET, JIM LUTZ (Lawrence Berkeley National Laboratory, Berkeley, CA 94720)
Residential water heating is a large source of energy use in California homes. This
project took a life cycle approach to comparing tank and tankless water heaters in
Northern and Southern California. Information about the life cycle phases was calculated
using the European Union’s Methodology study for EcoDesign of Energy-using Products
(MEEUP) and the National Renewable Energy Laboratory’s Life Cycle Inventory (NREL
LCI) database. In a unit-to-unit comparison, it was found that tankless water heaters
would lessen impacts of water heating by reducing annual energy use by 2800 MJ/year
(16% compared to tank), and reducing global warming emissions by 175 kg CO2
eqv./year (18% reduction). Overall, the production and combustion of natural gas in the
use phase had the largest impact. Total waste, VOCs, PAHs, particulate matter, and
heavy-metals-to-air categories were also affected relatively strongly by manufacturing
processes. It was estimated that tankless water heater users would have to use 10 more
gallons of hot water a day (an increased usage of approximately 20%) to have the same
impact as tank water heaters. The project results suggest that if a higher percentage of
Californians used tankless water heaters, environmental impacts caused by water heating
would be smaller.
2
INTRODUCTION
Water heating is the third largest source of energy use in homes [1]. The typical
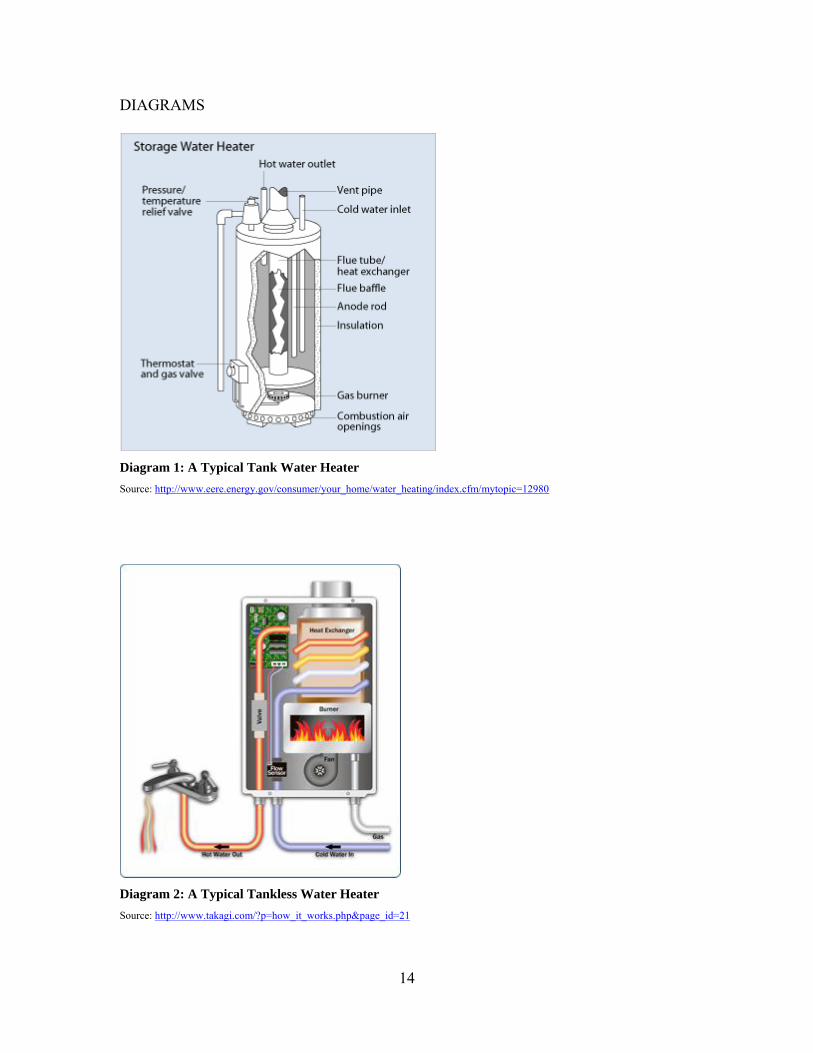
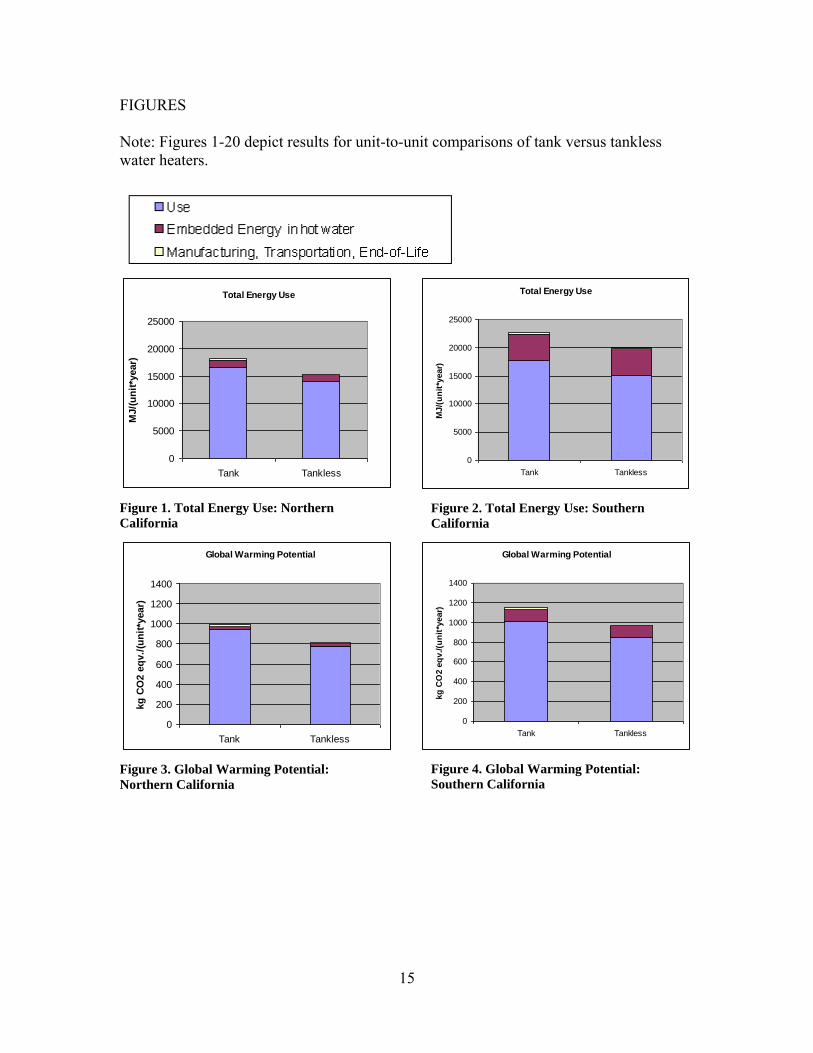
water heater storage tank wastes energy to continuous heating. Much of the wasted energy comes from standby losses, which are defined as the heat lost when the standing hot water in the tank cools down again. This project looked into the potential energy savings of tankless water heaters versus standard tank water heaters in California homes. Tankless water heaters, also known as instantaneous or demand water heaters, heat the cold water as it flows through a heating unit, eliminating the need for hot water storage. See Diagrams 1 and 2 for pictures of tank and tankless water heaters, respectively.
Tankless water heaters are claimed to be about 30% more efficient than standard storage water heaters [2]. However, they are not popular in the U.S., making up only 2% of the national market share for water heaters because of high initial costs for both the units and installation [3]. An analysis based on the principles of life cycle assessment (LCA) compared and evaluated the impacts of these two types of water heaters on the environment. Goal and Intended Use
This analysis explored the environmental impact if California homes were to switch from tank to tankless water heaters. The goal of this study was to evaluate environmental impacts of tank and tankless water heaters across life cycle phases (manufacturing, use, embedded energy in hot water delivered, transportation and recycling) with a geographical focus on California. Because water heaters have such a high saturation in California households, the information provided can inform many different stakeholders within the state. For example, California homeowners and contractors will be able to make more educated decisions when deciding between a tank and tankless hot water heating system. Scope and Boundaries The scope of this analysis was limited to California for several reasons. First, most water heaters in California fueled by natural gas [4]. Therefore, a comparison between a baseline, 40-gallon gas-fired water heater with a baseline gas-fired instantaneous tankless water heater is applicable to the majority of California residences.
The life-cycle environmental impact categories calculated in this report were: total primary energy use, total waste, global warming potential (GWP), acidification, volatile organic compounds (VOCs), heavy metals to air and water, polycyclic aromatic hydrocarbons (PAHs), particulate matter, and eutrophication. NOx emissions was also included in the unit-to-unit comparison, but was considered separately. More details for NOx emissions are included later in this report. The functional unit was the number of gallons of hot water delivered per year for twelve years. In Northern California, it was 18408 gallons/year. Southern California residences tended to use slightly more water, 19876 gallons/year. For more specific information on hot water use, see Table 5.

3
METHODOLOGY
In this analysis, we wanted to account for all of the environmental impacts of each life cycle phase. Information to do this was taken from multiple sources. In the end, these values were added up to give the impact of each environmental impact category for each type of water heater. Eco-design of Water Heaters and Methodology study for Ecodesign of Energy-using Products (MEEUP)
Much of the information used for the manufacturing and end-of-life phase was obtained from a report entitled “Eco-design of Water Heaters,” by Van Holsteijn en Kemna, a private consulting firm based in the Netherlands for the European Commission, DG Transport and Energy. Specific information about this report can be found at http://www.ecohotwater.org/index.html [5].
One of the tools that were used for the Eco-design report was a spreadsheet that allowed the user to input a given amount of a certain material, and the spreadsheet would calculate the impacts of certain environmental impact categories given the chosen inputs. This spreadsheet was used to calculate the manufacturing and disposal phase impacts in this analysis. The environmental impact categories calculated by the MEEUP spreadsheet were the environmental impacts that were analyzed throughout the project. However, there were some categories in the spreadsheet which were negligible, and thus excluded from analysis (ozone depletion and persistent organic pollutants). In this report, this spreadsheet is herein referred to as the MEEUP spreadsheet tool. National Renewable Energy Laboratory (NREL) Database In estimating the environmental impacts associated with the use and transportation phases of the water heater lifecycle, we used life cycle inventory (LCI) data from the NREL LCI database [6]. The information from this database provided us with the amount of various emissions and particles associated with electricity, natural gas, and diesel fuel production and use. Data on the specific mix of fuels used in generating electricity in were obtained from the U.S. EPA eGrid database [7]. Life-cycle impact analysis (LCIA) characterization factors from the MEEUP methodology report were used to translate the transportation and use phase LCI data into the following environmental impacts: acidification, heavy-metals-to-air, heavy-metals-to-water, and eutrophication. In other words, the emissions that contributed to each impact category were taken from the NREL database and adjusted for the weights in the MEEUP methodology so that the units and environmental impact categories would be uniform. For GWP, characterization factors from the EPA’s Tool for the Reduction and Assessment of Chemical and Other Environmental Impacts (TRACI) were used. For VOCs, PAHs, and NOx, the data was taken straight from the NREL amounts, because the NREL database provides specific results for these categories.
4
Northern California versus Southern California Because California has such differences in terrain, water usage, climate and other factors, the decision to split up Northern and Southern California seemed like the method that would most accurately reflect these differences.
Household samples from the 2001 U.S. Department of Energy Residential Energy Consumption Survey (DOE RECS) [8] from the Northern California region and Southern California region were separated based on the RECS weather station. The “Northern California” region roughly coincided with the PG&E service area, and the “Southern California” region roughly coincided with the SCE and SDG&E service areas. This separation was important considering electricity use. The factors of natural gas, however, were the same throughout the state regardless of utility.
The California Residential Appliance Saturation Study was used to find the number of tank and tankless water heaters in each region [4].
Northern and Southern California use different fuel mixes when generating electricity. The data for these impacts came from eGRID and the NREL LCI database [7]. Manufacturing Phase
The “Eco-design of Water Heaters” report contained the only published bill of materials on water heaters that was available for public use. Even though this bill of materials was collected from water heaters in Europe, the sizes and dimensions were comparable to those of water heaters in the United States. In Task 5 of this report, the major parts of the water heater were broken down for both storage-type water heaters and tankless water heaters. The tankless water heater data were derived from a down-scaling of a gas-fired low temperature boiler, corrected for the weight of typical tankless water heaters [9]. The weights of each listed material were then entered into the provided MEEUP spreadsheet tool to get the environmental impacts.
Use Phase
Most of the emphasis of this project was put on the use-phase, where 90% of primary energy consumption takes place [1].
The data collected in order to calculate hot water usage patterns was taken from the DOE RECS. From this data, the information for California households was isolated and separated into Northern and Southern California. This data provided the monthly hot water draw and energy usage for household samples, considering climate and regional differences. The factors that influence the amount of hot water and natural gas used varies from season to season. Therefore, the weighted average inlet temperature, ambient temperature and number of gallons used were determined for each four seasons. Spring considered the months of March, April and May, Summer-June, July, August, Fall-September, October, November, and Winter-December, January and February.
There was no data available on whether or not hot water usage patterns vary from tank to tankless customers. Because of this, in the unit-to-unit comparisons, it was assumed that residents would use the same amount of hot water regardless of water heater type. In a hypothetical scenario, the number of gallons of hot water used for tankless water heaters was then increased to see where the environmental impacts would be
5
comparable to a tank water heater with the original hot water usage taken from the DOE RECS.
To calculate the energy used by tank water heaters, we used the equations in chapter 9 in the 2001 Department of Energy Water Heater Rulemaking Technical Support Document [10].
Energy usage for tankless water heaters depend on draw patterns and time between draws. However, due to the dearth of information on tankless water heater usage, there was no simple equation that could be applied that would take draw patterns into account. Therefore, we used a simple enthalpy equation to calculate the heat required to bring the number of gallons of water up to outlet temperature. The heat energy was then divided by the energy factor of tankless water heaters, derated by 8.8% to make up for the lack of information on draw patterns. This 8.8% derating was taken from a report, “Field and Laboratory Testing of Tankless Gas Water Heater Performance” in which the authors analyzed the actual efficiency of tankless water heaters, weighting hot water draw volume and differentiating between cold starts and hot starts [11]. For more information about the equations used, see Appendix A.
Unlike most gas-fired tank water heaters, tankless water heaters also consume electricity. After looking through various product specifications, it was assumed that a tankless water heater would consume 2 watt-hours in stand-by mode and 50 watt-hours in on-mode. The on-mode electricity consumption was calculated by taking the numbers of BTUs per day, and dividing this by the burner size to get the hours per day the unit is in on-mode. However, most burners in tankless water heaters modulate with draw patterns and temperature settings. Because there was no data to find an equation that would take these factors into account, a fixed burner rate was assumed at 80,000 BTU/hour, approximately half of the burner’s full capacity. Embedded Energy: Electricity Usage Associated with Water Treatment Also included in the life cycle were the environmental impacts associated with treatment, pumping, distribution, etc of water for residential uses, or, in other words, the embedded energy in each gallon of hot water delivered by the water heaters. The embedded energy calculations were also separated by Northern and Southern California for several reasons. First, fuel mixes for generating electricity differ between utilities, and so environmental impacts of consuming electricity are different between north and south. Also, water distribution in Southern California is a lot more energy intensive due to the natural terrain. A recent study suggests that it takes 4000 kWh/MG (million gallons) in Northern California and 12700 kWh/MG in Southern California [12]. Transportation Phase The main manufacturers of water heaters listed the locations of their water heater manufacturing facilities on their websites (see Table 6). For tank water heaters, the main facilities were located in the United States [13,14,15,16]. It was assumed that the main mode of transportation was a diesel fueled combination truck. It was found that most tankless units are made abroad, either in Japan or Portugal [17,18,19,20]. The main mode of transportation for tankless water heaters was assumed to be a residual-oil-fueled ocean freighter.
6
For Northern California, it was assumed that the water heater was transported to San Francisco. For Southern California, it was assumed that the water heaters were transported to Long Beach. The distances from the manufacturing facilities to these end destinations were calculated. The number of water heaters in Northern versus Southern California and information about market share in the United States were used to create weighted averages for the distance traveled for the water heaters [21]. There was no information for market share of tankless water heaters, and so it was assumed that 90% came from Japan (Rinnai, Takagi and Noritz factory locations), and 10% came from Portugal (Bosch factory location). The life cycle inventory data for both types of transportation were then taken from NREL for each environmental impact category and were multiplied by the distance and weight of the unit.
Recycling Phase
Also built into the MEEUP spreadsheet tool were environmental impacts for recycling of the materials used to make water heaters. Data from the spreadsheet were used to calculate the environmental impacts of the given amount of material in each type of water heater. Results The unit comparisons show impacts of either a tank or tankless water heater on a per year basis. Impacts for the manufacturing, transportation and end-of-life were then divided by the lifetime of 12 years because those phases only occur once throughout the lifetime. A lifetime of 12 years was chosen because that was the given lifetime for tank type water heaters in the DOE RECS [9]. Tankless water heaters are said to last longer, however because there was no published evidence of this fact, the lifetime of the tankless water heaters were assumed to be the same. California Gas-Fired Water Heater Impact To get a general sense of what the impacts were for all of the households in California that have either a gas-fired tank or tankless water heater, the per unit life-cycle impacts were multiplied by the assumed population of gas-fired water heaters in California. The data for the current saturation of gas-fired tank and tankless water heaters was found in the California Residential Appliance Saturation Study. From this information, it was found that 7,289,417 households in California had gas-fired water heaters, and about 2% of this population has a tankless one in 2003 [4]. The percentage of the households with tank or tankless water heaters was then changed to create different scenarios to see the potential impact savings at each scenario. Scenario A was defined as if 10% of the population had tankless the rest of the population had tank (90%). Scenario B was 50% tank, 50% tankless, and Scenario C was 100% tankless, 0% tank. Tankless Water Usage One of the most important uncertainties about tankless water heaters is whether or not hot water usage patterns will change. Will tankless water heaters cause people to use
7
more gallons of hot water because they are advertised as being able to provide endless amounts? After getting the results for the unit-to-unit comparisons, water usage for tankless water heaters was increased to find at what point hot water usage would have to increase to have about the same levels of impact as tank water heaters on a per unit basis. Other Life Cycle Phases
Maintenance was not included in the overall life cycle analysis because it was considered a relatively minor phase of the total life cycle. Also, we did not find accurate information about tank or tankless water heater maintenance. Also, some tankless water heaters require installation of larger gas pipes and new venting. Installation materials were not included because they depend on factors that vary widely from house to house (water heater location, climate, house layout), and so one generalization was not assumed.
RESULTS
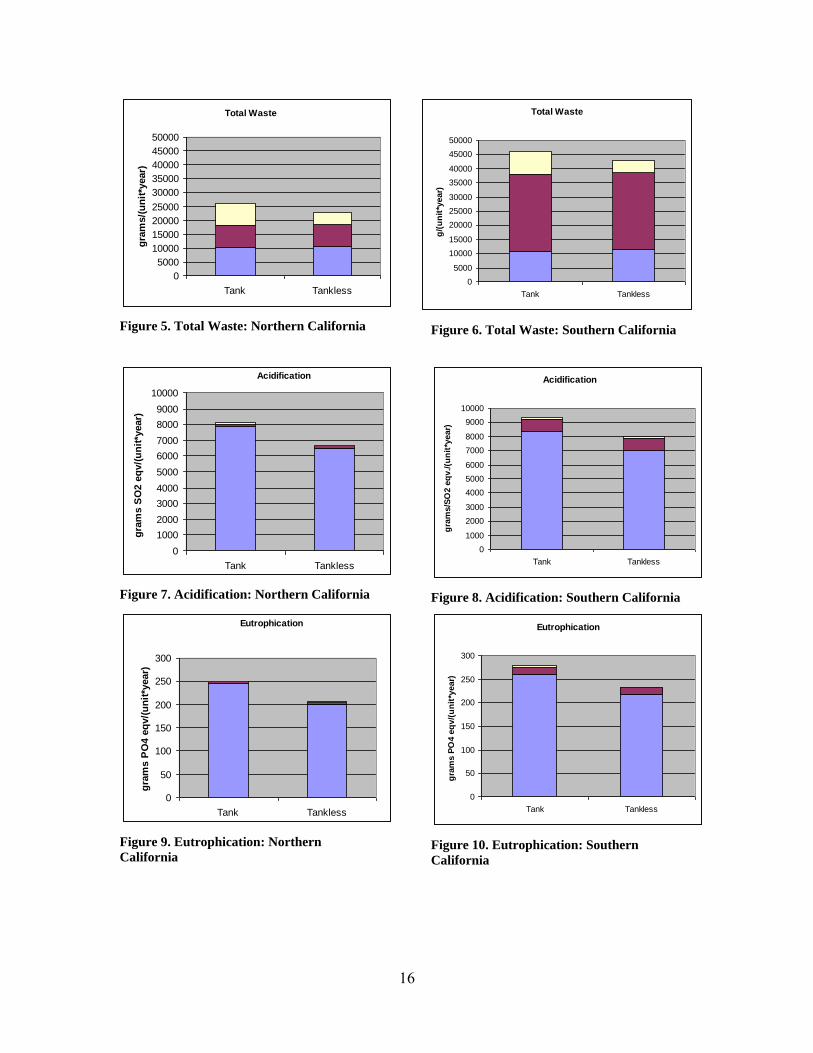
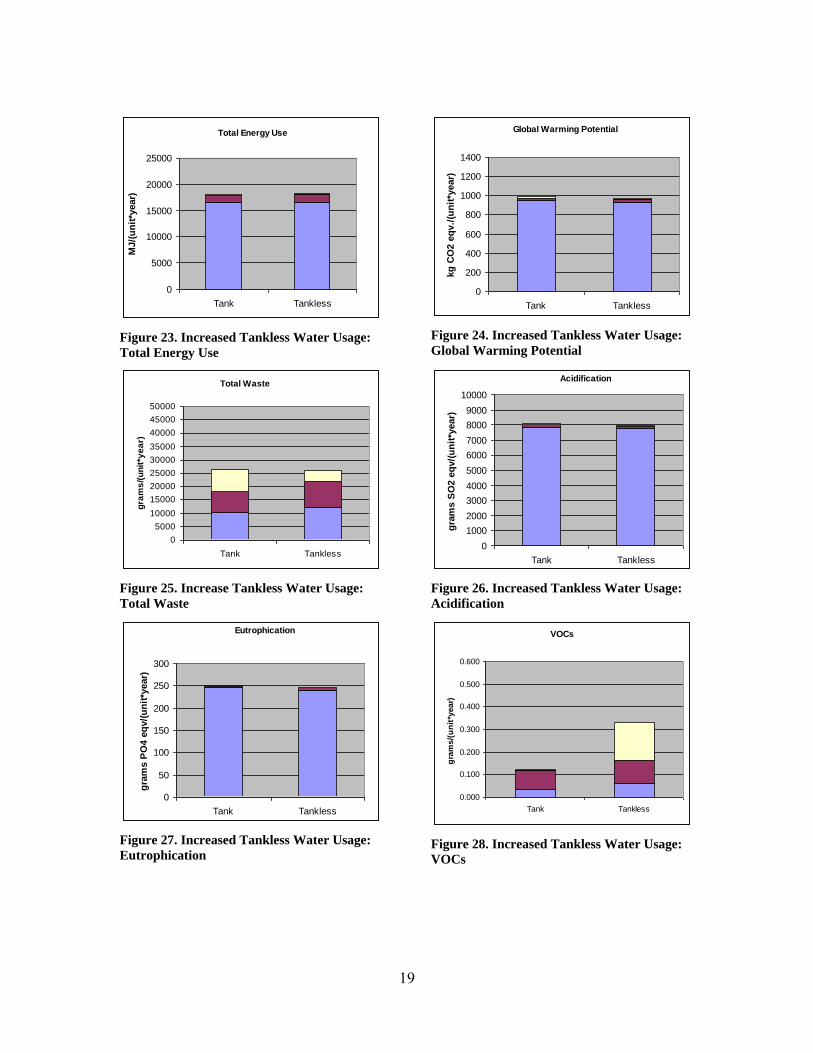
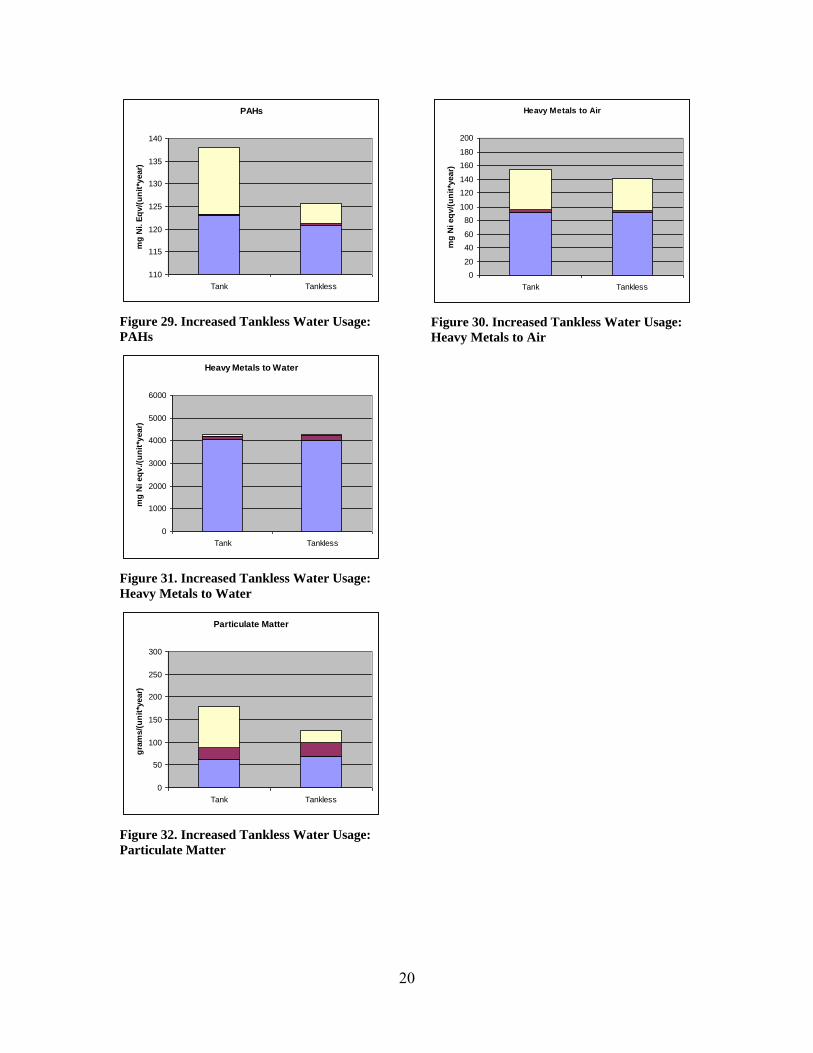
Figures 1 through 20 show graphs of a unit-to-unit comparison of tank and tankless water heaters in Northern California and Southern California across the environmental impact categories that were considered in this analysis. The bars in the graphs are also split up between three categories. The first category was the use phase, which accounted for most of the environmental impact. The second was embedded energy in the hot water of the use phase, which was the next largest polluter. The third was the aggregate of the data from manufacturing, transportation, and end-of-life phases. Table 1 shows a further breakdown of the unit-to-unit comparison with the specific values of each environmental impact. Figures 21-22 show unit-to-unit comparisons of NOx emissions. However, there was no NOx emissions data available for manufacturing or end-of-life phases because it was not one of the categories calculated by the MEEUP spreadsheet tool. NOx emissions for the other life cycle phases (embedded energy in hot water, use and transportation) were included in this report because NOx emissions is a concern for California air quality. Figures 23-32 show unit-to-unit comparisons with an increase of 10 gallons of hot water a day for tankless water heaters in Northern California. Hot water usage for tank water heaters was kept constant. Because usage patterns might vary between users with tank and tankless hot water users, we wanted to know how much hot water tankless water heater users would need to use to have the same levels of impact. Table 2 shows the results for today’s current environmental impacts due to water heating in California and for the three different scenarios. Table 3 then takes the impacts from the scenarios and subtracts them from today’s impacts to get a better understanding of how much could be saved by switching over to tankless water heaters in California homes. Percentage savings are found in Table 4. DISCUSSION
8
Unit-to-unit comparisons
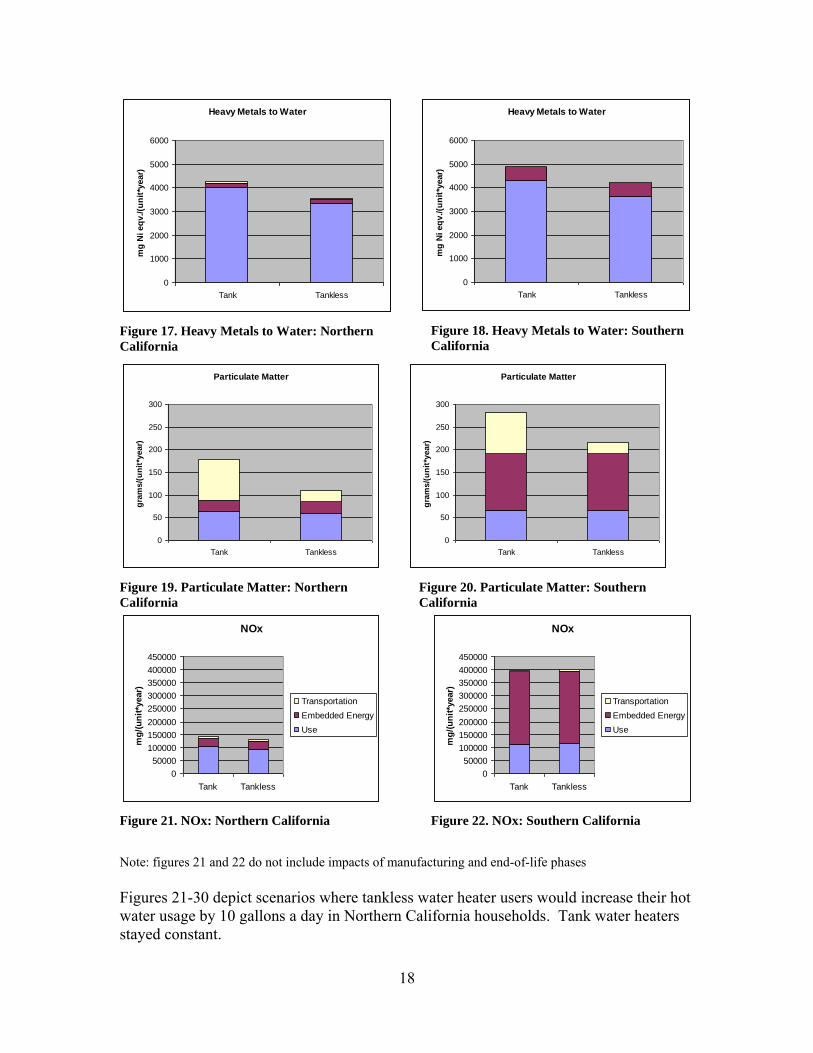
Northern California versus Southern California and Embedded Energy Southern California water tanks had a larger impact than that of their Northern Californian counterparts. This is mainly because the water-use cycle in Southern California is a lot more energy intensive than in Northern California. In this analysis, embedded energy is basically the amount of electricity used to treat the hot water households use. Factors of environmental impacts of the fuel mixes from Northern and Southern California were then multiplied by the amount of energy required to deliver water to households. From this we can see the categories where electricity usage has the most impact. For example, Figures 11 and 12 show results for VOC emissions. Because the fraction of the total impacts of these categories of embedded energy in water is large, we can see that electricity generates a proportionately larger amount of VOCs. Manufacturing Phase Tank water heaters seemed to have a bigger impact in the manufacturing phase than tankless water heaters. However, this assumed that environmental impacts scaled with materials mass. Tank water heaters being more massive, it would indicate that its manufacturing is more energy intensive. More work is needed on this phase to determine more accurate results. Use Phase Generally, the use phase accounted for the greatest share of environmental impacts for each water heater type. This was mostly due to the amount of natural gas that each type of water heater uses throughout its lifetime. A more detailed analysis of each environmental impact follows. Total Energy Use Figures 1 and 2 show total energy use of tank versus tankless water heaters. As expected, when considering the total energy use category, the use phase of each type of water heater had the largest impact of all life cycle phases. Global Warming Potential Figures 3 and 4 illustrate the global warming potential of each type of water heater. Similar to total energy use, much of the global warming impact comes from the use phase, from the carbon dioxide and methane emitted during production and combustion of natural gas. Total Waste Figures 5 and 6 show total waste generation. The embedded energy related impact is larger for this category, especially in Southern California. This is because electricity generation creates a relatively large amount of waste. There is also waste generated in manufacturing, especially from the steel used in both types of water heaters. Acidification
9
Figures 7 and 8 show the results of acidification. As shown, the largest contributor to acidification is from natural gas usage in the use phase. In a breakdown of the NREL life cycle inventory, most of the SO2, HF and HCl that cause acidification came from the production of the natural gas, not the combustion. Eutrophication Figures 9 and 10 show eutrophication. These results look very similar to those of acidification in that the production of natural gas affects total eutrophication the most. VOCs Figures 11 and 12 show results for VOC emissions. According to the MEEUP spreadsheet results, there are VOCs produced when making electronics. Because tank type water heaters do not have electronics, there were no VOC emissions for the manufacturing phase. Also, VOCs are produced in electricity production, so tankless water heaters also have slightly higher VOC impacts during the use phase also. PAHs Figures 13 and 14 show results for PAH emissions. The PAHs from tank water heaters in the manufacturing lifecycle come mainly from the production of the polyurethane insulation. Other sources in manufacturing in both types of tank came from metals production. Heavy Metals to Air When looking at Figures 15 and 16, one can see that much of the heavy metals to air comes from the manufacturing phase. This is due to the heavy metals to air emitted during the manufacturing phase. Metal is a large component of both tank and tankless water heaters. Particulate Matter Figures 19 and 20 show results for particulate matter emissions. As shown by the graph, the manufacturing, transportation, and end-of-life phases seem to have a relatively large impact. It was suggested that much of the particulate matter is generated while producing plastics and polyurethane. NOx Emissions Figures 21 and 22 show great differences between Northern California and Southern California. The discrepancy mainly came from the difference in embedded energy. According to the NREL LCI data, electricity generation in Southern California produces 1110 mg NOx/kWh, and 433 mg NOx/kWh in Northern California. Because electricity generation also produces NOx, since tankless water heaters use electricity, their use phase impact is almost the same. In Southern California it is even slightly higher, because of the higher NOx emissions rate from electricity generation. Transportation and End-of-Life As expected, the transportation and end-of-life impacts were not as pronounced as the rest of the life cycle phases, because they only occur once, whereas in the use phase,
10
natural gas is combusted everyday throughout a water heater’s life time. Information on detailed breakdown of these life cycle phases can be found in Table 1. Tankless Water Usage
A tankless water heater unit used about 2.6 million less BTUs a year compared to a tank unit. Using the same enthalpy equation, this difference would heat about 10 more gallons of water each day. Figures 21-30 show what the impacts would be if tankless water heater users used 10 more gallons of hot water a day than the 50.47 gallons per day used by their tank water heater counterparts. In these figures, the use phases are almost equal to each other. Therefore, a residence with a tankless water heater would have to use about 3,650 more gallons of hot water each year in order to have approximately the same environmental impacts as a residence with a tank water heater. The tankless water heater also had increased embedded energy impacts compared to the tank due to the energy required to provide for 3,650 more gallons of hot water to the household. California’s Population with gas-fired water heaters
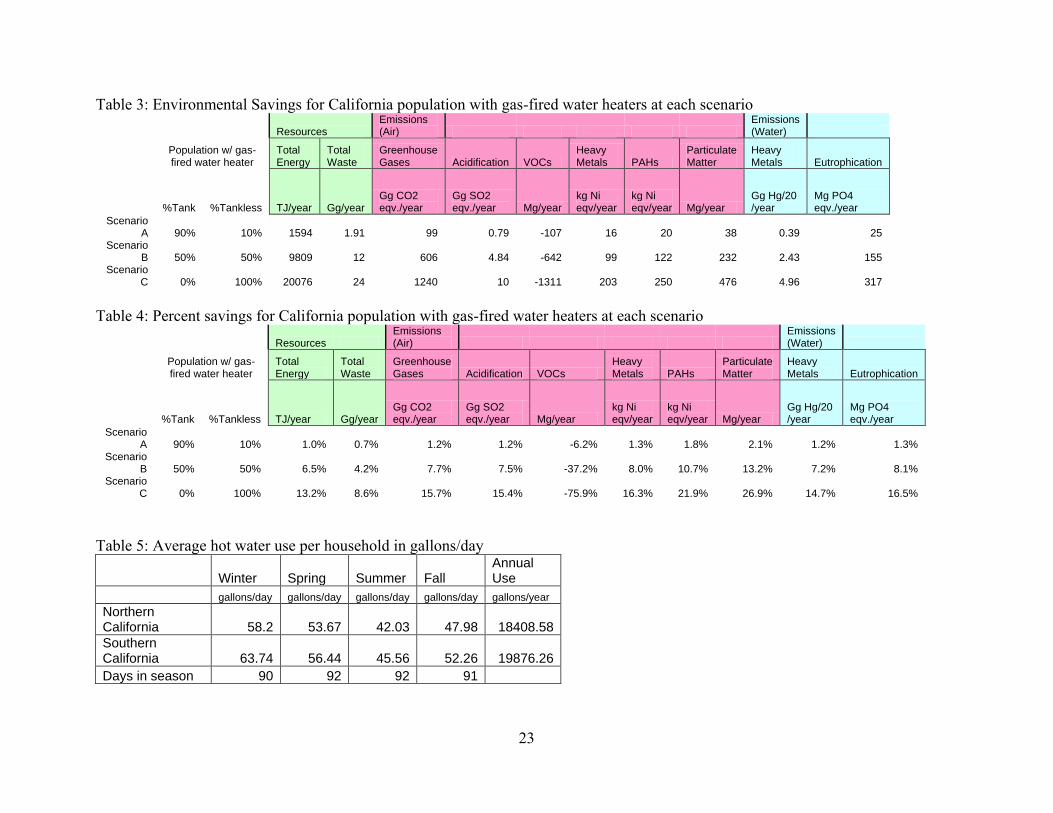
Table 2 shows the environmental impacts of water heating in California of the people with either tank or tankless gas-fired water heaters. Row 1 shows the California’s current situation. Subsequent rows show what the environmental impacts would be if a higher percentage of this population switched to tankless water heaters from tank water heaters. Table 2 suggests that if more people made this switch, the population would lessen the environmental impacts of water heating. Because California has such a large population, energy usage would be reduced and emissions would also decline. Table 3 shows the amount of energy saved or emissions abated in each scenario. VOC emission was the only category in which the values were negative. This is due to the VOCs emitted during manufacturing of electronics, which would increase if the number of tankless water heater increased. CONCLUSION
While the results suggest that tankless water heaters are more environmentally friendly, the barriers to entry for tankless water heaters in the United States market remain high. High installation and retrofitting costs continue to deter consumers from buying tankless water heaters. Although tankless water heaters may make sense environmentally, the case for them is less sound economically. There is also uncertainty as to whether tankless water heaters will cause use pattern changes. Hopefully when there is accurate data on tankless water heater usage, we will be able to make a more educated decision when choosing tank versus tankless water heaters. This report however, does provide us with a better understanding of the environmental impacts associated with gas-fired water heating in California. This information is
11
valuable because it will give consumers an idea of the impacts of an everyday appliance, enabling them to make decisions that help the environment. ACKNOWLEDGEMENTS This project was supported by the United States Department of Energy and Lawrence Berkeley National Laboratory as a part of the Berkeley Laboratory Undergraduate Research program.
12
REFERENCES [1 ] U.S. Department of Energy, “Market Technology and Assessment” in Water Heating
Rulemaking Technical Support Document, December 2000. [2] D. Hewitt, J. Pratt, and G. Smith, Tankless Gas Water Heaters: Oregon Market
Status, December 6, 2005. [Online]. Available: http://www.energytrust.org/library/reports/051206_TanklessGasWaterHeaters.pdf. [Accessed: July, 2008] [3] Davis Energy Group Inc, Residential Feasibility Assessment of Gas Tankless Water
Heaters in PG&E Service Territory. Davis Energy Group, Inc, March 25, 2004 [4] California Statewide Residential Appliance Saturation Study. KEMA. [Online]. Available: http://websafe.kemainc.com/RASSWEB/DesktopDefault.aspx?tabindex=1&tabid=6. [Accessed August, 2008] [5] R. Kemna, M van Elburg, W. Li, R. van Holsteijn, Preparatory Study on Eco-Design
of Water Heaters, Van Holstein en Kemna BV, The Netherlands, September 30, 2007. [Online]. Available: http://www.ecohotwater.org/index.html [Accessed: July, 2008] [6] National Renewable Energy Laboratory. U.S. Life-cycle Inventory Database. [Online]. Available: http://www.nrel.gov/lci/. [Accessed: August, 2008]. [7] U.S. Environmental Protection Agency. eGRID. [Online] Available: http://www.epa.gov/cleanenergy/energy-resources/egrid/index.html [Accessed: August, 2008] [8] Energy Information Administration, Residential Energy Consumption Survey, 2001. [Online]. Available: http://www.eia.doe.gov/emeu/recs/contents.html. [Accessed: June 2008] [9] R. Kemna, M van Elburg, W. Li, R. van Holsteijn, “Preparatory Study on Eco-Design
of Water Heaters”, Task 5 Report, Definition of Basecase, Van Holstein en Kemna BV, The Netherlands, September 30, 2007. [Online]. Available: http://www.ecohotwater.org/index.html [Accessed: July, 2008] [10] U.S. Department of Energy, “Life-Cycle Cost Analysis” in Water Heating
Rulemaking Technical Support Document, December 2000. [11] Davis Energy Group Inc, Field and Laboratory Testing of Tankless Gas Water
Heater Performance. Davis Energy Group, Inc, April 7, 2006. [12] California Energy Commission. California’s Water-Energy Relationship. November 2005. [Online]. Available: http://www.energy.ca.gov/2005publications/CEC-700-2005-011/CEC-700-2005-011-SF.PDF. [Accessed: July, 2008]
13
[13] Rheem, “Rheem Manufacturing Company Historical Time Line,” Rheem Water
Heating . [Online]. Available: http://www.ashraemadison.org/company_histories/rheem_history.pdf [Accessed: April 2009] [14] A.O. Smith, “Worldwide Facilities,” A.O. Smith Water Heaters, 2008. [Online]. Available: http://www.hotwater.com/company/facilities.html [Accessed: July, 2008] [15] American Water Heaters, “About Us,” American Water Heaters, 2008. [Online]. Available: http://www.americanwaterheater.com/About.aspx [Accessed: July 2008] [16] Bradford White Corporation, “Welcome to Bradford White,” About Bradford White, 2005. [Online]. Available: http://www.bradfordwhite.com/about.asp [Accessed: July 2008] [17] Rinnai America Corp., “Rinnai’s Expanding Global Network,” Rinnai, 2005. [Online]. Available: http://www.rinnai.us/Rinnai/Content/about_rinnai/rinnai_worldwide.aspx [Accessed: July, 2008] [18] Takagi Industrial Co. USA Inc, “Takagi Japan Company Info,” Takagi Industrial
Co. USA Inc Homepage, 2007. [Online] Available: http://www.takagi.com/web2003/b02.htm [Accessed: July 2008] [19] Noritz Corporation, “Factory,” Noritz. [Online]. Available: http://www.noritzglobal.com/corp/factory/ [Accessed: July, 2008] [20] BuildersSquare Inc, “Bosch Tankless Hot Water Heater,” BuildersSquare, 2000. [Online]. Available: http://www.builderssquare.com/xp_10263604-Bosch_Tankless_Hot_Water_Heater_125FX_NG.aspx [Accessed: July, 2008] [21] Appliance Magazine, Vol. 64, No.9. “30th Annual Portrait of the U.S. Appliance Industry.” Canon Communications: Los Angeles, CA. September, 2007.
14
DIAGRAMS
Diagram 1: A Typical Tank Water Heater
Source: http://www.eere.energy.gov/consumer/your_home/water_heating/index.cfm/mytopic=12980
Diagram 2: A Typical Tankless Water Heater
Source: http://www.takagi.com/?p=how_it_works.php&page_id=21
15
FIGURES Note: Figures 1-20 depict results for unit-to-unit comparisons of tank versus tankless water heaters.
Total Energy Use
0
5000
10000
15000
20000
25000
Tank Tankless
MJ/(
un
it*y
ear)
Figure 1. Total Energy Use: Northern
California
Total Energy Use
0
5000
10000
15000
20000
25000
Tank Tankless
MJ/(
un
it*y
ear)
Figure 2. Total Energy Use: Southern
California
Global Warming Potential
0
200
400
600
800
1000
1200
1400
Tank Tankless
kg
CO
2 e
qv./
(un
it*y
ear)
Figure 3. Global Warming Potential:
Northern California
Global Warming Potential
0
200
400
600
800
1000
1200
1400
Tank Tankless
kg
CO
2 e
qv./(u
nit
*year)
Figure 4. Global Warming Potential:
Southern California
16
Total Waste
0
5000
10000
15000
20000
25000
30000
35000
40000
45000
50000
Tank Tankless
gra
ms/(
un
it*y
ear)
Figure 5. Total Waste: Northern California
Total Waste
0
5000
10000
15000
20000
25000
30000
35000
40000
45000
50000
Tank Tankless
g/(
un
it*y
ear)
Figure 6. Total Waste: Southern California
Acidification
0
1000
2000
3000
4000
5000
6000
7000
8000
9000
10000
Tank Tankless
gra
ms S
O2 e
qv/(
un
it*y
ear)
Figure 7. Acidification: Northern California
Acidification
0
1000
2000
3000
4000
5000
6000
7000
8000
9000
10000
Tank Tankless
gra
ms/S
O2 e
qv./(u
nit
*year)
Figure 8. Acidification: Southern California
Eutrophication
0
50
100
150
200
250
300
Tank Tankless
gra
ms P
O4 e
qv/(
un
it*y
ear)
Figure 9. Eutrophication: Northern
California
Eutrophication
0
50
100
150
200
250
300
Tank Tankless
gra
ms P
O4 e
qv/(
un
it*y
ear)
Figure 10. Eutrophication: Southern
California

17
VOCs
0.000
0.100
0.200
0.300
0.400
0.500
0.600
Tank Tankless
gra
ms/(
un
it*y
ear)
Figure 11. VOCs: Northern California
VOCs
0.000
0.100
0.200
0.300
0.400
0.500
0.600
Tank Tankless
gra
ms/(
un
it*y
ear)
Figure 12. VOCs: Southern California
PAHs
0
20
40
60
80
100
120
140
160
Tank Tankless
mg
Ni. E
qv/(
un
it*y
ear)
Figure 13. PAHs: Northern California
PAHs
0
20
40
60
80
100
120
140
160
Tank Tankless
mg
Ni eq
v./(u
nit
*year)
Figure 14. PAHs: Southern California
Heavy Metals to Air
0
20
40
60
80
100
120
140
160
180
200
Tank Tankless
mg
Ni eq
v/(
un
it*y
ear)
Figure 15. Heavy Metals to Air: Northern
California
Heavy Metals to Air
0
20
40
60
80
100
120
140
160
180
200
Tank Tankless
mg
Ni eq
v./(u
nit
*year)
Figure 16. Heavy Metals to Air: Southern
California
18
Heavy Metals to Water
0
1000
2000
3000
4000
5000
6000
Tank Tankless
mg
Ni eq
v./(u
nit
*year)
Figure 17. Heavy Metals to Water: Northern
California
Heavy Metals to Water
0
1000
2000
3000
4000
5000
6000
Tank Tankless
mg
Ni eq
v./(u
nit
*year)
Figure 18. Heavy Metals to Water: Southern
California
Particulate Matter
0
50
100
150
200
250
300
Tank Tankless
gra
ms/(
un
it*y
ear)
Figure 19. Particulate Matter: Northern
California
Particulate Matter
0
50
100
150
200
250
300
Tank Tankless
gra
ms/(
un
it*y
ear)
Figure 20. Particulate Matter: Southern
California
NOx
0
50000
100000
150000
200000
250000
300000
350000
400000
450000
Tank Tankless
mg
/(u
nit
*year)
Transportation
Embedded Energy
Use
Figure 21. NOx: Northern California
NOx
0
50000
100000
150000
200000
250000
300000
350000
400000
450000
Tank Tankless
mg
/(u
nit
*year)
Transportation
Embedded Energy
Use
Figure 22. NOx: Southern California
Note: figures 21 and 22 do not include impacts of manufacturing and end-of-life phases Figures 21-30 depict scenarios where tankless water heater users would increase their hot water usage by 10 gallons a day in Northern California households. Tank water heaters stayed constant.
19
Total Energy Use
0
5000
10000
15000
20000
25000
Tank Tankless
MJ/(
un
it*y
ear)
Figure 23. Increased Tankless Water Usage:
Total Energy Use
Global Warming Potential
0
200
400
600
800
1000
1200
1400
Tank Tankless
kg
CO
2 e
qv./
(un
it*y
ear)
Figure 24. Increased Tankless Water Usage:
Global Warming Potential
Total Waste
0
5000
10000
15000
20000
25000
30000
35000
40000
45000
50000
Tank Tankless
gra
ms
/(u
nit
*ye
ar)
Figure 25. Increase Tankless Water Usage:
Total Waste
Acidification
0
1000
2000
3000
4000
5000
6000
7000
8000
9000
10000
Tank Tankless
gra
ms S
O2 e
qv/(
un
it*y
ear)
Figure 26. Increased Tankless Water Usage:
Acidification
Eutrophication
0
50
100
150
200
250
300
Tank Tankless
gra
ms P
O4 e
qv/(
un
it*y
ear)
Figure 27. Increased Tankless Water Usage:
Eutrophication
VOCs
0.000
0.100
0.200
0.300
0.400
0.500
0.600
Tank Tankless
gra
ms/(
un
it*y
ear)
Figure 28. Increased Tankless Water Usage:
VOCs
20
PAHs
110
115
120
125
130
135
140
Tank Tankless
mg
Ni. E
qv/(
un
it*y
ear)
Figure 29. Increased Tankless Water Usage:
PAHs
Heavy Metals to Air
0
20
40
60
80
100
120
140
160
180
200
Tank Tankless
mg
Ni eq
v/(
un
it*y
ear)
Figure 30. Increased Tankless Water Usage:
Heavy Metals to Air
Heavy Metals to Water
0
1000
2000
3000
4000
5000
6000
Tank Tankless
mg
Ni eq
v./(u
nit
*year)
Figure 31. Increased Tankless Water Usage:
Heavy Metals to Water
Particulate Matter
0
50
100
150
200
250
300
Tank Tankless
gra
ms/(
un
it*y
ear)
Figure 32. Increased Tankless Water Usage:
Particulate Matter
21
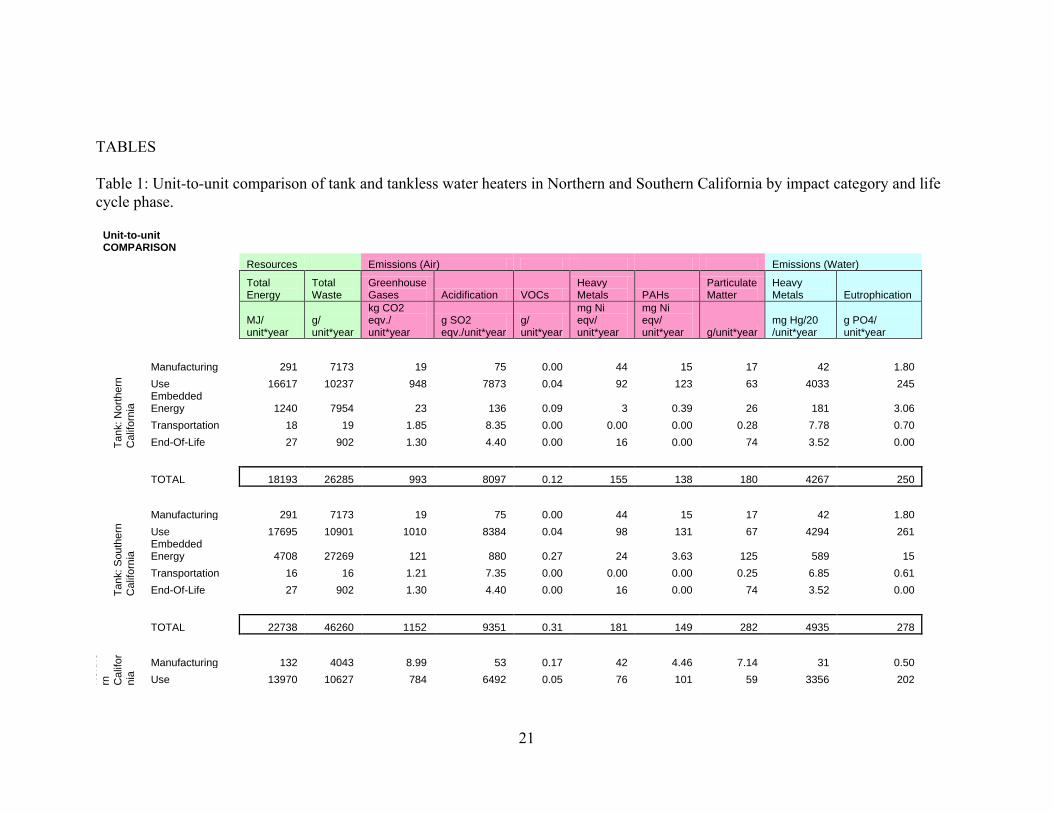
TABLES Table 1: Unit-to-unit comparison of tank and tankless water heaters in Northern and Southern California by impact category and life cycle phase.
Unit-to-unit COMPARISON
Resources Emissions (Air) Emissions (Water)
Total Energy
Total Waste
Greenhouse Gases Acidification VOCs
Heavy Metals PAHs
Particulate Matter
Heavy Metals Eutrophication
MJ/ unit*year
g/ unit*year
kg CO2 eqv./ unit*year
g SO2 eqv./unit*year
g/ unit*year
mg Ni eqv/ unit*year
mg Ni eqv/ unit*year g/unit*year
mg Hg/20 /unit*year
g PO4/ unit*year
Tank: N
ort
hern
Calif
orn
ia
Manufacturing 291 7173 19 75 0.00 44 15 17 42 1.80
Use 16617 10237 948 7873 0.04 92 123 63 4033 245 Embedded Energy 1240 7954 23 136 0.09 3 0.39 26 181 3.06
Transportation 18 19 1.85 8.35 0.00 0.00 0.00 0.28 7.78 0.70
End-Of-Life 27 902 1.30 4.40 0.00 16 0.00 74 3.52 0.00
TOTAL 18193 26285 993 8097 0.12 155 138 180 4267 250
Tank: S
outh
ern
Calif
orn
ia
Manufacturing 291 7173 19 75 0.00 44 15 17 42 1.80
Use 17695 10901 1010 8384 0.04 98 131 67 4294 261 Embedded Energy 4708 27269 121 880 0.27 24 3.63 125 589 15
Transportation 16 16 1.21 7.35 0.00 0.00 0.00 0.25 6.85 0.61
End-Of-Life 27 902 1.30 4.40 0.00 16 0.00 74 3.52 0.00
TOTAL 22738 46260 1152 9351 0.31 181 149 282 4935 278
Tankle
ss:
Nort
he
rn
Calif
or
nia
Manufacturing 132 4043 8.99 53 0.17 42 4.46 7.14 31 0.50
Use 13970 10627 784 6492 0.05 76 101 59 3356 202

22
Embedded Energy 1240 7954 23 136 0.09 2.77 0.39 26 181 3.06
Transportation 3.73 3.90 0.29 6.11 0.00 0.00 0.00 0.20 1.64 0.15
End-Of-Life 7.29 244 0.30 1.25 0.00 4.18 0.00 19 0.74 0.00
TOTAL 15352 22872 816 6688 0.31 125 106 111 3570 205
Tankle
ss: S
ou
thern
Calif
orn
ia
Manufacturing 132 4043 8.99 53 0.17 42 4.46 7.14 31 0.50
Use 15070 11334 848 7026 0.05 83 109 66 3611 218 Embedded Energy 4708 27269 121 880 0.27 24 3.63 125 589 15
Transportation 3.91 4.09 0.31 6.41 0.00 0.00 0.00 0.21 1.72 0.15
End-Of-Life 7.29 243.58 0.30 1.25 0.00 4.18 0.00 19 0.74 0.00
TOTAL 19922 42894 978 7966 0 153 117 217 4234 233
Table 2: Impacts of total California population with gas-fired water heater
Resources Emissions (Air)
Emissions (Water)
Population w/ gas-fired water heater
Total Energy
Total Waste
Greenhouse Gases Acidification VOCs
Heavy Metals PAHs
Particulate Matter
Heavy Metals Eutrophication
%Tank %Tankless TJ/year Gg/year Gg CO2 eqv./year
Gg SO2 eqv./year Mg/year
kg Ni eqv/year
kg Ni eqv/year Mg/year
Gg Hg/20 /year
Mg PO4 eqv./year
Today 98% 2% 152001 279 7898 64 1728 1244 1195 1766 34 1922 Scenario
A 90% 10% 150406 277 7799 63 1835 1227 1175 1728 33 1897 Scenario
B 50% 50% 142192 267 7292 59 2370 1144 1073 1533 31 1768 Scenario
C 0% 100% 131924 255 6657 54 3039 1040 945 1290 29 1605 Note: TJ-terajoules, Gg-gigagrams, Mg-megagrams
23
Table 3: Environmental Savings for California population with gas-fired water heaters at each scenario Resources
Emissions (Air)
Emissions (Water)
Population w/ gas-fired water heater
Total Energy
Total Waste
Greenhouse Gases Acidification VOCs
Heavy Metals PAHs
Particulate Matter
Heavy Metals Eutrophication
%Tank %Tankless TJ/year Gg/year Gg CO2 eqv./year
Gg SO2 eqv./year Mg/year
kg Ni eqv/year
kg Ni eqv/year Mg/year
Gg Hg/20 /year
Mg PO4 eqv./year
Scenario A 90% 10% 1594 1.91 99 0.79 -107 16 20 38 0.39 25
Scenario B 50% 50% 9809 12 606 4.84 -642 99 122 232 2.43 155
Scenario C 0% 100% 20076 24 1240 10 -1311 203 250 476 4.96 317
Table 4: Percent savings for California population with gas-fired water heaters at each scenario
Resources Emissions (Air)
Emissions (Water)
Population w/ gas-fired water heater
Total Energy
Total Waste
Greenhouse Gases Acidification VOCs
Heavy Metals PAHs
Particulate Matter
Heavy Metals Eutrophication
%Tank %Tankless TJ/year Gg/year Gg CO2 eqv./year
Gg SO2 eqv./year Mg/year
kg Ni eqv/year
kg Ni eqv/year Mg/year
Gg Hg/20 /year
Mg PO4 eqv./year
Scenario A 90% 10% 1.0% 0.7% 1.2% 1.2% -6.2% 1.3% 1.8% 2.1% 1.2% 1.3%
Scenario B 50% 50% 6.5% 4.2% 7.7% 7.5% -37.2% 8.0% 10.7% 13.2% 7.2% 8.1%
Scenario C 0% 100% 13.2% 8.6% 15.7% 15.4% -75.9% 16.3% 21.9% 26.9% 14.7% 16.5%
Table 5: Average hot water use per household in gallons/day
Winter Spring Summer Fall Annual Use
gallons/day gallons/day gallons/day gallons/day gallons/year
Northern California 58.2 53.67 42.03 47.98 18408.58
Southern California 63.74 56.44 45.56 52.26 19876.26
Days in season 90 92 92 91

24
Table 6: Information about tank and tankless water heater manufacturing locations Distance Traveled to California
Manufacturer Market Share [19] Facility Location Northern California (miles) Southern California (miles)
Tank Rheem-Ruud 36.9%
Montgomery
AL[13] 1881 1509
AO Smith 22.8% Ashland, TN [14] 2302 2014
Bradford
White 13.8% Middleville, MI [16] 2299 2196
American
Water Heater 13.5% Johnson City, TN [15] 2588 2300
State
Industries 13.5% Ashland, TN [14] 2302 2014
AO Smith/ State
Industries 12.4% Ashland, TN [14] 2302 2014
Average Distance Traveled:
2279 2007
Northern California (nautical miles)
Southern California (nautical miles)
Tankless Noritz 30% Akashi, Japan [19] 4822 5137
Rinnai 30% Japan [17] 4822 5137
Takagi 30% Japan [18] 4822 5137
Bosch 10% Portugal [20] 7915 7581
Average Distance Traveled:
5131.3 5381 Note: [ ] refers to reference number in reference section and the websites where the appropriate information was found

25
Appendix A Equations Used for Calculations Tank Water Use
[9]
[9]
Variables: Qin = total water heater energy consumption (Btu/day) RE = recovery efficiency, set at 0.76 Pon = rated input power (Btu/hr), set constant at 40,000 BTU/hr UA = standby heat-loss coefficient (Btu/hr-oF) Ttank = thermostat setpoint temperature (oF), set constant at 120oF Tin = inlet water temperature (oF) Tamb = temperature of the air surrounding the water heater (oF) vol = volume of hot water drawn in 24 hours (gal/day) den = density of stored water, set constant at 8.29 lb/gal Cp = specific heat of stored water, set constant at 1.000743 Btu/lb-oF EF = energy factor, set at 0.58 Tankless Water Use
EF)T(T*C*mass
Q inlettankp
Mass = mass of water (lbs) Cp = specific heat of stored water, set constant at 1.000743 Btu/lb-oF Ttank = thermostat setpoint temperature (oF), set constant at 120oF Tin = inlet water temperature (oF) Q = heat required to heat water (BTU) EF = efficiency factor, set at 0.745 Results
yearper useLife-of-Endtiontransportaingmanufactur
yearper totalcycle life Elifetime
EEEE