
OULU 2014 ACTAjultika.oulu.fi/files/isbn9789526204789.pdf · Groundwater discharge from the esker...
100
UNIVERSITATIS OULUENSIS ACTA C TECHNICA OULU 2014 C 491 Pekka M. Rossi INTEGRATED MANAGEMENT OF GROUNDWATER AND DEPENDENT ECOSYSTEMS IN A FINNISH ESKER UNIVERSITY OF OULU GRADUATE SCHOOL; UNIVERSITY OF OULU, FACULTY OF TECHNOLOGY; WATER RESOURCES AND ENVIRONMENTAL ENGINEERING RESEARCH GROUP; VALUE DOCTORAL PROGRAMME C 491 ACTA Pekka M. Rossi
Transcript of OULU 2014 ACTAjultika.oulu.fi/files/isbn9789526204789.pdf · Groundwater discharge from the esker...
ABCDEFG
UNIVERSITY OF OULU P .O. B 00 F I -90014 UNIVERSITY OF OULU FINLAND
A C T A U N I V E R S I T A T I S O U L U E N S I S
S E R I E S E D I T O R S
SCIENTIAE RERUM NATURALIUM
HUMANIORA
TECHNICA
MEDICA
SCIENTIAE RERUM SOCIALIUM
SCRIPTA ACADEMICA
OECONOMICA
EDITOR IN CHIEF
PUBLICATIONS EDITOR
Professor Esa Hohtola
University Lecturer Santeri Palviainen
Postdoctoral research fellow Sanna Taskila
Professor Olli Vuolteenaho
University Lecturer Veli-Matti Ulvinen
Director Sinikka Eskelinen
Professor Jari Juga
Professor Olli Vuolteenaho
Publications Editor Kirsti Nurkkala
ISBN 978-952-62-0477-2 (Paperback)ISBN 978-952-62-0478-9 (PDF)ISSN 0355-3213 (Print)ISSN 1796-2226 (Online)
U N I V E R S I TAT I S O U L U E N S I SACTAC
TECHNICA
U N I V E R S I TAT I S O U L U E N S I SACTAC
TECHNICA
OULU 2014
C 491
Pekka M. Rossi
INTEGRATED MANAGEMENT OF GROUNDWATER AND DEPENDENT ECOSYSTEMSIN A FINNISH ESKER
UNIVERSITY OF OULU GRADUATE SCHOOL;UNIVERSITY OF OULU, FACULTY OF TECHNOLOGY;WATER RESOURCES AND ENVIRONMENTAL ENGINEERING RESEARCH GROUP;VALUE DOCTORAL PROGRAMME
C 491
ACTA
Pekka M. R
ossi
C491etukansi.kesken.fm Page 1 Tuesday, May 6, 2014 11:54 AM


A C T A U N I V E R S I T A T I S O U L U E N S I SC Te c h n i c a 4 9 1
PEKKA M. ROSSI
INTEGRATED MANAGEMENT OF GROUNDWATER AND DEPENDENT ECOSYSTEMS IN A FINNISH ESKER
Academic dissertation to be presented with the assent ofthe Doctoral Training Committee of Technology andNatural Sciences of the University of Oulu for publicdefence in the OP-Pohjola auditorium (L6), Linnanmaa, on6 June 2014, at 12 noon
UNIVERSITY OF OULU, OULU 2014

Copyright © 2014Acta Univ. Oul. C 491, 2014
Supervised byProfessor Bjørn KløveDocent Timo P. Karjalainen
Reviewed byProfessor Marie LarocqueDoctor Helen K. French
ISBN 978-952-62-0477-2 (Paperback)ISBN 978-952-62-0478-9 (PDF)
ISSN 0355-3213 (Printed)ISSN 1796-2226 (Online)
Cover DesignRaimo Ahonen
JUVENES PRINTTAMPERE 2014
OpponentProfessor Harri Koivusalo

Rossi, Pekka M., Integrated management of groundwater and dependentecosystems in a Finnish esker. University of Oulu Graduate School; University of Oulu, Faculty of Technology; WaterResources and Environmental Engineering Research group; VALUE Doctoral ProgrammeActa Univ. Oul. C 491, 2014University of Oulu, P.O. Box 8000, FI-90014 University of Oulu, Finland
Abstract
Groundwater, a key part of the hydrological cycle, is under increasing pressure from different landuses and changing climate. However, less attention has been paid to integrated groundwatermanagement than surface waters. This thesis combined hydrological and socio-economic researchfor the case study of the Rokua esker aquifer in order to update current concepts of groundwatermanagement. The Rokua area contains groundwater-dependent lakes and a periodic water leveldecline has raised concerns about the future of these lakes. Peatland drainage in the vicinity of theaquifer has been accused of changing the aquifer conditions.
Groundwater discharge from the esker aquifer to drained peatland was studied to identifyrelevant hydrological processes for groundwater-surface water interactions. The results revealeda connection between the aquifer and the peatland whereby groundwater can enter the ditchesthrough seepage or preferential flow.
Modeling was used to determine critical factors in the management of the esker aquifer-peatland system. The results showed that climate and land use can affect esker groundwater, whilepeatland drainage in the vicinity can have similar impacts to groundwater abstraction and drought.Peatland restoration by filling in drainage ditches could possibly restore the aquifer groundwaterlevels. However, for the Rokua aquifer, which will possibly experience less severe dry periods inthe future, extensive drainage restoration is currently too major, uncertain, and expensive ameasure relative to the expected benefits.
Multi-criteria decision analysis was used to identify ways of facilitating stakeholderinvolvement and learning in groundwater management. The results obtained with thisparticipatory process confirmed that it can foster learning on complicated groundwater issues andcollaboration in a process encompassing disputes and diverse interests. The decision analysisprocess led to the initiation of dialogue on more integrated management, where the preferences ofall stakeholders were discussed and taken into account.
Overall, this thesis shows how different aspects of aquifer management, such as land use,climate, ecological and economic values, and stakeholder preferences, can all be taken intoaccount using a combined method which reduces the mistrust between opposing interests throughresearch and information, resulting in more robust future planning.
Keywords: aquifer discharge area, drainage, groundwater management, groundwatermodelling, multi-criteria decision analysis, peat, preferential flow, uncertainty


Rossi, Pekka M., Pohjavesien ja pohjavedestä riippuvien ekosysteemien kokonais-valtainen hallinta. Oulun yliopiston tutkijakoulu; Oulun yliopisto, Teknillinen tiedekunta; Vesi- ja ympäristö-tekniikan tutkimusryhmä; VALUE tohtoriohjelmaActa Univ. Oul. C 491, 2014Oulun yliopisto, PL 8000, 90014 Oulun yliopisto
Tiivistelmä
Pohjaveteen, hydrologisen kierron avainosaan, kohdistuu kasvavia paineita eri maankäytönmuodoista ja ilmastonmuutoksesta. Pohjaveden hallintaan ei kuitenkaan ole kiinnitetty tarvitta-vaa huomiota. Tässä väitöstyössä yhdistettiin hydrologista ja sosioekonomista tutkimusta Roku-an harjualueella pohjaveden hallintakonseptin päivittämiseksi. Rokuan alueella on useita pohja-vedestä riippuvaisia järviä, joiden vedenpinta on kausittain laskenut voimakkaasti. Pintojen las-ku on kasvattanut paikallisten huolta järvien tilasta. Harjua ympäröivät metsäojitetut turvemaat,ja ojituksia on syytetty pohjaveden tilan ja sitä kautta myös järvien tilan heikkenemisestä.
Työn ensimmäisessä osassa tutkittiin pohjaveden hydrologisia purkautumisprosesseja harjunpohjavesiesiintymästä ojitetulle suoalueelle. Tulokset osoittivat hydraulisen yhteyden akviferinja turvemaan välillä: pohjavesi pääsi purkautumaan metsäojiin joko suotautumalla tai turpeenkaksoishuokoisuusrakenteiden kautta.
Seuraavassa vaiheessa työtä pohjavesimallinnusta käytettiin määrittämään kriittisiä pohjave-den tilaan vaikuttavia tekijöitä pohjavesi-turvemaa-systeemissä. Mallinnustulosten perusteellaniin ilmasto kuin maankäyttökin vaikuttavat kumpikin suoraan pohjaveden pinnankorkeudentilaan. Turvemaiden ojituksilla pohjavesialueella voi olla samoja vaikutuksia pohjaveden pin-nankorkeuden tasoihin kuin pohjaveden otolla tai kuivilla kausilla. Turvemaiden ennallistaminenojia täyttämällä voi osittain palauttaa vedenpinnan tasoja pohjavesialueella. Rokuan harjualueentapauksessa suuren mittakaavan oja-alueiden ennallistaminen todettiin kuitenkin liian epävar-maksi ja kalliiksi toimenpiteeksi hyötyihin nähden, varsinkin jos kuivien kausien vaikutus suu-rilla harjualueilla heikkenee tulevaisuudessa sademäärien kasvun myötä.
Työn kolmannessa osassa käytettiin monitavoitearviointia eri sidosryhmien osallistamiseen jaoppimiseen pohjavesien hallinnassa. Osallistavasta prosessista saadut tulokset vahvistivat, ettämenetelmää voidaan käyttää oppimisen edesauttamiseen vaikeissa pohjavesiasioissa sekä yhteis-työn muodostamiseen ristiriitaisessa ja monimutkaisessa tapauksessa. Monitavoitearvioinninprosessi johti keskustelun avaukseen yhtenäisemmän suunnittelun puolesta, joka ottaa huomi-oon eri sidosryhmien näkökulmat ja tuo ne osaksi keskustelua.
Tämä väitöstyö osoitti miten eri pohjavesialueen hallintaan tarvittavat näkökulmat, kutenmaankäyttö, ilmasto, ekologiset ja ekonomiset arvot, sekä sidosryhmien mielipiteet voidaankaikki ottaa huomioon yhdistämällä eri metodeja. Näin tutkimuksella ja informoinnilla vähenne-tään epäluottamusta eri intressitahojen välillä ja luodaan pohja vakaammalle pohjavesialueidentulevaisuuden suunnittelulle.
Asiasanat: epävarmuusanalyysi, kaksoishuokoisuus, mallinnus, monitavoitearviointi,ojitus, pohjavesien hallinta, pohjavesien purkautumisalue, turve


To aunt Leena Matinheikki

8

9
Acknowledgements
This study was financed by the doctoral programme VALUE, EU Seventh
framework programme GENESIS (contract number 226536) and the Academy of
Finland project AQVI (project number 128377). Support was also provided by
Maa- ja vesitekniikan tuki r.y., Thule doctoral programme, Finnish Foundation for
Technology (TES), Sven Hall Foundation, Tauno Tönning Research Foundation
and Olvi Foundation. My highest gratitude and acknowledgements for the
financial support of my thesis go for all the above.
I give my most sincere recognitions to my main supervisor, Prof. Bjørn Kløve.
This work has been the once-in-a-lifetime learning experience for me. The
amount of information I have received on groundwater and hydrology is beyond
humbling. Thank you for the possibility to work on interesting subjects and thank
you for the advices either when I was a student, diploma thesis worker or doing
my PhD work. I also give my gratitude to my second supervisor Timo P.
Karjalainen from Thule institute. Thank you for teaching a guy with a more
technical background to see from a broader perspective. I also would like to thank
my pre-examiners Prof. Marie Larocque and Dr. Helen K. French for valuable
comments. I’d also like to thank Dr. Mary McAfee for language check of my
thesis.
My big hand goes to all you people in Water Resources and Environmental
Engineering Research Group. Coffee break and lunch discussions have been the
essence of this work! Especially thank you for Pertti of all the great cooperation,
the interesting dialogue on research issues and on the other important subjects e.g.
the random gig chosen for the weekend. I would like to acknowledge all the
people who have helped me in the field, planning with the articles or other part of
the thesis research: Riku, Elina, Tuomo R., Paavo, Tuomo P., Virve, Anna-Kaisa,
Jarkko, Mikko for the geophysics, Helena, Aarne, Kalle, Manuel, Hong, Hannu,
Tapio S and Tero. John Doherty I especially would like to thank for making me
understand modeling so much more.
Thank you to the Centre for Economic Development, Transport and the
Environment for all the collaboration with Rokua studies, Geological Survey of
Finland for the collaboration on geological research, both Metsäkeskus and
Metsähallitus helping on forestry issues, Humanpolis Oy for the cooperation and
the high interest on our studies and Turveruukki on expertise on Petäikönsuo area.

10
Thank you for all the people of Rokua area for the cooperation. This work
could have not been done without your commitment and interest on groundwater.
You’ve brought this study a long way ahead. Thank you all the people in VALUE
doctoral programme from the fruitful meetings around Finland. Thank you to all
the people in GENESIS for the great international collaboration! Thank you for
all my friends for keeping the extra-curricular time so much more interesting, all
the way through the studies. And a Big Thank You goes for my family, Liisa,
Helge and Maija for everything and especially for helping me to find the right
road on my studies and career.
Travel, discuss and change your thoughts with people around you as much as
you can. You’ll never stop learning. Punk, over and out:
Change of ideas, change of ideas,
What we need now is a change of ideas.
Greg Graffin - Change of Ideas, 1989

11
List of symbols and abbreviations
C Concentration
Ca Calcium
Con Conductance
DAI Decision analysis interviews
DEM Digital elevation model
E.C. Electrical conductivity
ET0 Reference evaporation
FAO Food and Agriculture Organization of the United Nations
FMI Finnish Meteorological Institute
GCM Global climate model
GPR Ground penetrating radar
gw Groundwater
kpeat Hydraulic conductivity of a peat
l Model cell length
LIDAR Light detection and ranging
MAVT Multi-attribute value theory
MCDA Multi-criteria decision analysis
MCA Multi-criteria analysis
NSMC Null-space Monte Carlo
P Precipitation
Q Discharge
SDM Structured decision making
SiO2 Silicon dioxide
SRES A1B Special Report on Emissions Scenarios A1B
SWE Snow water equivalent
SYKE Finnish Environmental Institute
b Thickness of a peat below a ditch
w Width of a ditch

12

13
List of original publications
This thesis is based on the following original publications, which are referred to
in the text by their Roman numerals:
I Rossi PM, Ala-aho P, Ronkanen A-K & Kløve B (2012) Groundwater-surface water interaction between an esker aquifer and a drained fen. Journal of Hydrology 432–433 (2012): 52–60.
II Rossi PM, Ala-aho P, Doherty J & Kløve B (2014) Impact of peatland drainage and restoration on esker groundwater resources: modeling future scenarios for management. Hydrogeology Journal. DOI 10.1007/s10040-014-1127-z.
III Karjalainen TP, Rossi PM, Ala-aho P, Eskelinen R, Reinikainen K, Kløve B, Pulido-Velazquez M & Yang H (2013) A decision analysis framework for stakeholder involvement and learning in groundwater management. Hydrology and Earth System Sciences 17: 5141–5153.
The author’s contribution to publications I-III:
I Designed the study with Pertti Ala-aho and Bjørn Kløve, conducted the field
work with Pertti Ala-aho. Analyzed the results and wrote the paper with co-
authors.
II Designed the study and conducted the field work with Pertti Ala-aho,
analyzed the study results with the co-authors. John Doherty and Bjørn Kløve
critically commented on all versions of the manuscript.
III Designed the study with Timo P. Karjalainen and Kalle Reinikainen.
Conducted the decision analysis interviews and meetings with Timo P.
Karjalainen and Pertti Ala-aho. Wrote the paper with the co-authors.

14

15
Contents
Abstract
Tiivistelmä
Acknowledgements 9
List of symbols and abbreviations 11
List of original publications 13
Contents 15
1 Introduction 17
1.1 Modeling as a groundwater management tool ........................................ 19
1.2 Participatory analyses supporting management ...................................... 20
1.3 Outline and aims of this study ................................................................. 21
2 Hydrogeology of eskers and surrounding peatlands 25
3 Description of the Rokua esker study area 29
4 Materials and methods 33
4.1 Groundwater-surface water interaction of a peatland discharge
area (I) ..................................................................................................... 33
4.2 Modeling future management scenarios (II) ........................................... 37
4.2.1 Calibration and uncertainty analysis using PEST ......................... 41
4.2.2 Land use change and climate variability scenarios ....................... 43
4.3 Decision analysis framework (III) .......................................................... 46
4.3.1 Stakeholder analysis and structuring the value tree ...................... 49
4.3.2 Development of alternatives and impact assessment .................... 50
4.3.3 Decision analysis interviews ........................................................ 55
5 Results and discussion 57
5.1 Groundwater-surface water interaction between an esker aquifer
and a drained fen (I) ................................................................................ 57
5.1.1 Groundwater exfiltration in drained fens ...................................... 63
5.1.2 Sand aquifer response to rain events and to
evapotranspiration ........................................................................ 64
5.2 Impact of peatland drainage and restoration on esker aquifer –
future model scenarios (II) ...................................................................... 66
5.2.1 Model calibration and analysis ..................................................... 66
5.2.2 Land use change and climate variability ...................................... 69
5.2.3 Impact of model scenarios ............................................................ 72
5.3 Decision analysis framework (III) .......................................................... 75
5.3.1 Importance of the objectives ........................................................ 75

16
5.3.2 Desirability of the alternatives ...................................................... 76
5.3.3 Viewpoints of different stakeholders ............................................ 77
5.3.4 Evaluation of the approach ........................................................... 79
5.3.5 Findings from the decision analysis process................................. 81
6 Conclusions and future recommendations 83
References 87
Original publications 95

17
1 Introduction
Water resources management is recognizably a challenging task worldwide. River
catchment management, restoration of eutrophic lakes, and agricultural irrigation
in arid regions are just a few examples of areas where expertise in hydrology,
ecology, economics, and many other fields is needed to build coherent plans for
the future.
Management of groundwater resources poses even more challenges.
Groundwater reserves are usually not directly visible and their status is therefore a
more abstract concept than the condition of a lake or the discharge volume of a
river. However, groundwater is one of the main freshwater sources in the world.
Globally, groundwater is currently facing increasing pressure from land use and
water abstraction, and there is evidence of dramatic changes in aquifer water
resources (Wada et al. 2010). As the groundwater is usually out of sight, public
awareness of groundwater resources, groundwater-dependent ecosystems, and
problems related to pollution and declining groundwater levels is surprisingly
poor (Kløve et al. 2011b, Kløve et al. 2011c).
Demystification of groundwater through research started in the 19th century
(e.g., Darcy 1856) and groundwater research is nowadays one of the cornerstones
of hydrological cycle studies (Freeze & Cherry 1979). The management of
groundwater evolved as problems of overexploitation, contamination, and
ecosystem deterioration started to arise (e.g., depletion of aquifer resources or
salinization of coastal aquifers). However, the legal status of groundwater can still
be quite ambiguous, as in the United States (Narasimhan 2009), and therefore
more information and research is needed. In the European Union (EU), the Water
Framework Directive (European Commission 2000) defines groundwater as part
of river basins. Member states are required to prepare plans for achieving good
ecological status in all waters within the EU by 2015. This includes groundwater,
generating a need for good groundwater management practices.
As is the case globally, groundwater is also an important water resource in
Finland. It is the main source of potable water, with 580 000 m3 of groundwater
and 120 000 m3 of artificial groundwater delivered daily by municipal
waterworks to consumers (Britschgi et al. 2009). Artificial groundwater is
produced by enhancing groundwater recharge through pumping surface water
from a lake or a river to an aquifer for example using sprinklers or seepage wells.
In 2012, there were 6040 classified groundwater areas in Finland, with an average
size of 3.7 km2. These groundwater areas consist of two different parts: a recharge

18
area, where rainwater seeps into water-bearing soil (usually sand or gravel),
creating new groundwater, and a groundwater protection area surrounding the
recharge area. The latter is a legally established zone to restrict or limit potentially
harmful land use practices such as industry or agriculture near groundwater
resources. The groundwater formations of Finland are mostly unconfined sand
and gravel glaciofluvial esker formations or marginal deposits where glacier
retreat has paused (Mälkki 1999, Katko et al. 2006).
Finnish groundwater management is directed by national water legislation
(Water Resources Management Act 2004) and the European Union Groundwater
Directive (European Commission 2006). The main objective of all relevant
legislation is to ensure good quality and quantity of groundwater. A common
threat to groundwater quality derives from soil contamination by e.g., oil spills,
de-icing of roads with salt, chlorinated hydrocarbons, agricultural contaminants
(pesticides, fertilizers) or heavy metals. Groundwater quantity becomes an issue
for example when municipalities and cities are planning their potable water
strategies. Extraction of groundwater from the aquifer for potable water lowers
the groundwater level and can for example decrease the discharge from natural
springs. Many of the large cities in Finland use only groundwater as potable water,
e.g., Lahti, Joensuu, and Seinäjoki. Other cities such as Turku, Lappeenranta, and
Pori use a combination of groundwater and artificial groundwater. Other Finnish
cities, such as Oulu or Tampere, have also had plans for using groundwater as
these cities currently rely solely on surface water. The recently established water
safety plans of the EU have put even more pressure on the use of groundwater, as
multiple sources of potable water are required for cities. In many previous
groundwater abstraction cases the plans have been controversial, sparking
opposition and litigation (e.g., the Virttaankangas case in Turku and the
Viinivaara case in Oulu). The reasons for controversy in these cases can be
diverse, but the fact that controversy can easily arise indicates the need for better
governance of groundwater issues in Finland.
The increasing use of groundwater emphasizes the need to understand the
exact role of groundwater and different land uses. Besides groundwater
abstraction, one of the main land use management questions related to Finnish
aquifers arises from the drainage of peatlands in groundwater discharge areas, e.g.,
for forestry purposes. The impacts of peatland drainage on groundwater bodies
have not yet been studied. As the groundwater conditions in northern aquifers are
also expected to alter with climate change (Okkonen & Kløve 2010, Hiscock et al.
2011), it is important for future management to understand and differentiate the

19
impacts deriving from climate change and those deriving from land use. As stated
by Katko et al. (2006, p. 76) “In addition to Integrated Water Resources
Management, there should also be discussion about integrated aquifer
management”.
In order to provide a more scientific basis for better future management of
groundwater resources, the GENESIS project was started in 2009. It is an EU-
funded project involving researchers from 13 EU member states and four
associated countries. The main aim of the project is to provide scientific data to
update the EU Groundwater Directive with new scientific knowledge. For the
purposes of the project, 15 case study sites were chosen throughout Europe. One
of these sites is the Rokua esker aquifer in Northern Finland. At the Rokua site,
the groundwater level and the water level in groundwater-dependent lakes have
been an issue for concern in recent decades. Land use in the surrounding
peatlands for forestry and peat harvesting has been cited as one of the reasons for
the periodic declines in water levels. The work described in this thesis forms part
of the GENESIS project and its aim was to examine how different research and
management tools can be refined and combined to provide a more comprehensive
structure for the future management of the Rokua aquifer area. The main focus of
the work was the role of peatland forest drainage in groundwater areas. The
starting assumption was that in order to devise an appropriate management
strategy for the Rokua aquifer, there is a need for new information on the
hydrology of the area, the possible impacts of land use and climate change, and
the needs of different local stakeholders and livelihoods.
1.1 Modeling as a groundwater management tool
Groundwater models are one of the basic tools used in supporting groundwater
management and assessing the impacts of different pressures affecting
groundwater resources, as required in the EU Groundwater Directive. In Finland,
groundwater modeling has been used in many groundwater abstraction plans for
potable water, for example in planning artificial groundwater pumping in Turku
(Artimo et al. 2003, Artimo et al. 2008). Modeling has also been used in other
cases, for example to estimate climate change impacts on groundwater-surface
water interactions in a cold climate (Okkonen & Kløve 2011) and to define
groundwater flowpaths for contamination risk assessment (Backnäs et al. 2013).
When models are used as a basis for management decision making,
understanding and analysis of model uncertainty is a key part of the modeling

20
chain. Uncertainties associated with groundwater models derive, for example,
from uncertainties in geological structure (e.g., Bredehoeft 2005, Seifert et al.
2008), model structural simplification (Doherty & Welter 2010), non-uniqueness
of model parameters (Binley & Beven 2003), inadequate measurement disposition
and density, and noise associated with measurements comprising the calibration
dataset (e.g., Moore & Doherty 2006). Analyses of the uncertainties associated
with predictions made by environmental models have been variously based on
Bayesian methods (e.g., Marin et al. 1989), generalized likelihood methods
(Beven & Binley 1992), calibration-constrained subspace methodology (Tonkin
& Doherty 2005), and other methods (see e.g., Refsgaard et al. 2012). These
analyses provide the necessary understanding for decision making on
management issues that might have high costs and/or high risks in the event of
failure (e.g., Blazkova & Beven 2004, James et al. 2009). However, groundwater
models are just one technical device for use in e.g. assessment of different land
use impacts. Other management tools are equally necessary for discussion and
participation processes involving the people affected by future decisions.
1.2 Participatory analyses supporting management
Due to the high degree of complexity and uncertainty in groundwater
management, a combination of thorough analysis and informed deliberation is
clearly useful and important for decision making. Generally, the need for
interdisciplinary and participatory processes combining scientific and local
knowledge in environmental research and planning is widely acknowledged in
environmental, natural resource, and water governance (e.g., Renn 2006, Silva et
al. 2010, Pahl-Wostl et al. 2010).
Multi-criteria decision analysis (MCDA) is a method which is increasingly
being used for fusing available scientific and technical information with
stakeholder knowledge and values in order to support decisions in many fields,
including natural resources and environment management (Belton & Stewart
2002). There is a wide range of MCDA approaches and applications covering
different fields of natural resource management and environmental planning (e.g.,
Kangas et al. 2001, Keefer et al. 2004, Huang et al. 2011). MCDA is increasingly
being used to support stakeholder involvement in environmental and natural
resource planning, and experiences from many participatory MCDA applications
have been positive (e.g., Pykäläinen et al. 1999, Qureshi & Harrison 2001, Regan
et al. 2007, Marttunen & Hämäläinen 2008). There is also a fairly rich body of

21
literature related to the use of multi-criteria analysis (MCA) or MCDA in
participatory water resource management projects (e.g., Brown et al. 2001, Silva
et al. 2010, Straton et al. 2011).
Multi-criteria methods have often been applied to the analysis of groundwater
management, mostly in the form of multi-objective optimization (e.g., Willis &
Liu 1984, Yang et al. 2001, Almasri & Kaluarachchi 2005). However, with a few
exceptions (e.g., McPhee & Yeh 2004), decision analysis has been restricted to
the assessment of trade-offs among the selected objectives and to the
determination of non-dominant solutions. The approaches have not been
interactive or participatory, mostly because they have omitted the explicit
inference of the stakeholders’ preferences.
The use of MCDA in a participatory way is a challenging task requiring
careful design and expertise related to the methodology and process (Sparrevik et
al. 2011). Many problems have been identified, including the need for transparent
and easily applied methods for engaging stakeholders and for developing a robust
decision model that accounts for the time and resource constraints experienced by
practitioners attempting real-life MCDA applications (Huang et al. 2011). It is
said that successful deliberation as part of the decision analysis approach depends
on learning, “which in turn depends on the ability of those leading the process to
create an environment that fosters dialogue, questioning, and self-reflection”
(Gregory et al. 2012, p. 246). This behavioral and learning viewpoint is important
when applying any decision analysis framework. The process should be planned
in such a way that all of the participants can fully understand the reasoning and
results. However, practical applications of decision support methods are often too
technically oriented and difficult to use, understand, or interpret (Kangas et al.
2008). The learning aspect has been mentioned in many papers on MCDA (e.g.,
Kangas et al. 2001), but not systematically studied in practice.
1.3 Outline and aims of this study
This thesis is divided into three sections, reflecting the content of the three papers
on which it is based.
(I) The main objective of Paper I was to determine how groundwater
discharges from an esker aquifer and interacts with a drained peatland (fen). In
many cases drains are a boundary to groundwater systems and this interaction is
therefore of general importance and required for groundwater modeling. Paper I
studied how the peatland located in the Rokua esker discharge zone influences the

22
hydraulic pressure head in the sand aquifer. It also examined whether the contact
between groundwater and peat depends on preferential flow (double porosity)
channels being formed in the peat, how discharge patterns are spatially distributed,
and how peatland drainage influences this distribution.
(II) A typical management question arises when peatlands in groundwater
discharge areas have been drained by excavating open drainage channels to create
more suitable conditions for forest growth. Therefore, groundwater modeling was
used in Paper II as a tool to study management options for esker aquifers and
related land uses. A MODFLOW model (McDonald & Harbaugh 1984) was built
to simulate saturated groundwater flow and drainage in the surrounding discharge
zone peatlands of the Rokua esker. PEST and its ancillary support software
(Doherty 2013) were used for model calibration and uncertainty analysis.
Modeling was conducted considering the underlying uncertainties of the model,
measurement data quality and scarcity, geology, climate, and land use. The model
was used a) to examine groundwater-surface water interactions between a drained
peatland and an esker aquifer; and b) to study how peatland drainage and possible
drainage restoration by blocking or filling of the ditches would be reflected in the
aquifer. To date, peatland drainage restoration has been studied to show the effects
on catchment discharge (Wilson et al. 2010) and water quality (e.g., Wallage et al.
2006, Wilson et al. 2011) but not on aquifer conditions. Paper II aimed to
contribute to more integrated management of groundwater resources. It presents a
suitable and pragmatic method for determining the impacts of different pressures
and identifying future management strategies for esker aquifers.
(III) Paper III analyzed the potential of interactive multicriteria decision
analysis – especially the decision analysis interview (DAI) approach (Marttunen
& Hämäläinen 2008) – for facilitating stakeholder involvement and learning in
groundwater management. It evaluated the results of an MCDA process
conducted for the Rokua esker aquifer in Northern Finland. There were fears of
disturbance of the system’s water dynamics by human activity, leading to the loss
of ecosystem goods and services, affecting recreation and other associated
activities in the area. The MCDA started a process, in association with
stakeholder groups, to find ecologically sustainable, economically feasible, and
socially acceptable options for sustainable land use management of the Rokua
esker area and to evaluate these alternatives systematically and transparently. The
main objective of Paper III was to evaluate the usefulness of the MCDA process
in sustainable land use and groundwater management in the Rokua case. The
questions examined included: Did the process facilitate stakeholder involvement

23
and learning among the participants? What was the benefit of the interactive
MCDA process for land use planning in the area? Was the process successful in
enhancing the conditions for learning (meaningful participation and dialogue
among participating stakeholders) and in fostering learning (especially a common
understanding of the problem)?
During the PhD studies the author of this thesis has also contributed to papers
by Kløve et al. (2011b), Koundouri et al. (2012), Ala-aho et al. (2013) and
Bertrand et al. (2013). These papers further widened the Rokua esker aquifer case
studies and the integrated groundwater management issues.

24

25
2 Hydrogeology of eskers and surrounding peatlands
Eskers are glacial sand and gravel deposits from the last deglaciation period. The
eskers were formed as glacier meltwater flow transferred sediment in the
direction of ice withdrawal. The meltwater ran either in sub-glacier tunnels or in
ice crevasses near the edge of the glacier. In esker aquifers, a gravel core is often
found at the center of the formation, as the first phase of the glacifluvial sediment
stratified in high velocity flow (Banerjee & McDonald 1975, Hebrand & Åmark
1989). As the glacier withdrew, flow conditions usually slowed and finer elements
such as sand sedimented on the top of the gravel core (Fig. 1). At the end phase of
the formation period, when the glacier had fully withdrawn, the esker might have
been part of the flow delta formation left behind by the glacier. In this part, even
finer elements might have sedimented onto the top or into the bearings of the
formation.
Fig. 1. Conceptual cross-section (A-B) of an esker rising from the surroundings with
kettle lakes in the area. The esker formation is divided into a recharge area and a
peatland-covered discharge area.
With the glacier melting and withdrawing, ice blocks and boulders became
embedded in the sediment of the meltwater flow. When these blocks and boulders
eventually melted the ground sank, forming kettle holes (Mälkki 1999). These
kettle holes are mostly found in the vicinity of the main channel of meltwater

26
flow and can be up to 50 m deep (Aartolahti 1973). When the groundwater level
is above the bottom of the kettle hole, a groundwater-dependent kettle lake
emerges (Fig. 1).
The esker formations are often shallow, unconfined aquifers, rising 10–100 m
above the surrounding landscape. However, eskers can also be completely
covered by other sediment formations, as in the coastal areas surrounding the
Ostrobothnian Bay in Finland (Kløve et al. 2011a). The typical esker formation,
rising above its surroundings, forms groundwater within the recharge area as
rainwater infiltrates to the aquifer. The recharge area usually comprises the main
part of the esker formation (with sand and gravel) and the groundwater discharge
area comprises nearby features such as springs, lakes, rivers and peatlands (Fig.
1). Since 1984, many eskers in Finland have been protected within the Esker
Protection Programme or by the European Union Habitat Directive and its Natura
2000 network.
Around many of eskers in the boreal zone, peatlands cover large parts of the
discharge area and can locally confine the groundwater. In many regions of the
world, fens have been drained for agriculture, forestry, or peat harvesting. Despite
their potential importance, the impacts of discharge area drainage or other land
uses on groundwater levels or discharge conditions have not been thoroughly
taken into account. Rather, the main focus has been on protecting the aquifer
recharge area conditions. The main threats to esker aquifer groundwater levels
and ecosystems in Finland to date have been the extraction of gravel and the
increasing use of groundwater as a drinking water supply (Britschgi et al. 2009,
Rintala 2006). The impact of land use in the discharge zone, such as peatland
drainage for forestry, has not been considered to have direct effects on esker
ecosystems e.g., kettle lakes. A key to understanding whether a particular land use
in a discharge area fen affects aquifer groundwater is the hydraulic connection
between the discharge peatland area and the upslope esker aquifer.
The hydraulic properties of peat have been studied in various field and
laboratory studies in recent decades (e.g., Price 1992, Schlotzhauer & Price 1999,
Beckwith & Baird 2001), but groundwater exfiltration into peatlands is not well
understood. The hydraulic conductivity of peat decreases with depth and changes
drastically at the interface between the acrotelm (layer above the lowest point of
varying groundwater level) and catotelm (layer continuously below the
groundwater). In studies by Päivänen (1973), Holden & Burt (2002) and
Ronkanen & Kløve (2005), the hydraulic conductivity of the peat matrix was
found to vary from 10-2 to 10-10 m s-1. Peat can also have double porosity, where
27
water flows through the peat matrix and in concentrated passageways as pipeflow
(Gilman & Newson 1980, Ours et al. 1997). Horizontal pipeflow has been noted
in studies of hilly blanket mires, where stormwater moves downstream rapidly via
surface runoff and horizontal pipeflow (Holden & Burt 2002, Holden 2005).
Studies by Lowry et al. (2009) suggest that the double porosity could be the cause
of spring formation in peatlands. If the piezometric head is higher in the mineral
soil below the peat, the confined groundwater can eventually find its way through
the peat in the form of vertical pipeflow. Confined groundwater seepage through
peat has also been conceptually presented by Langhoff et al. (2006). In both cases,
the groundwater discharged in areas where the peat depth rapidly decreased from
3–4 m to less than a meter.
As the hydraulic conductivity of peat can be very low, it can in theory work
as an aquitard. For example, in a Danish fen ecosystem, Johansen et al. (2011)
showed that peat functions as a partially impermeable layer. Those authors
concluded that the groundwater intake from the confined sand aquifer under the
fen peat does not affect the peat layer groundwater level, but lowers the discharge
of natural springs and confined piezometric heads in the area. For assessment of
ecosystem impacts after groundwater withdrawal, the interaction between fens
and groundwater must thus be understood (Dahl et al. 2007). The recent EU
Groundwater Directive asks for a better understanding of how terrestrial
ecosystems are connected to groundwater (European Commission 2008). The
assessment of groundwater body status also depends on the status of ecosystems
relying on groundwater.
For peatland-aquifer interactions, groundwater modeling has been used in the
past to study the role of peat thickness in spring formation (Lowry et al. 2009), to
examine the relationship between peatland flow paths and the fate of pesticides
(Kidmose et al. 2010), to reconstruct historical peatland flow conditions (van
Loon et al. 2009b), and to define how peatland throughflow defines habitats (van
Loon et al. 2009a). However, modeling has not been applied in peatland-aquifer
land use management.

28
29
3 Description of the Rokua esker study area
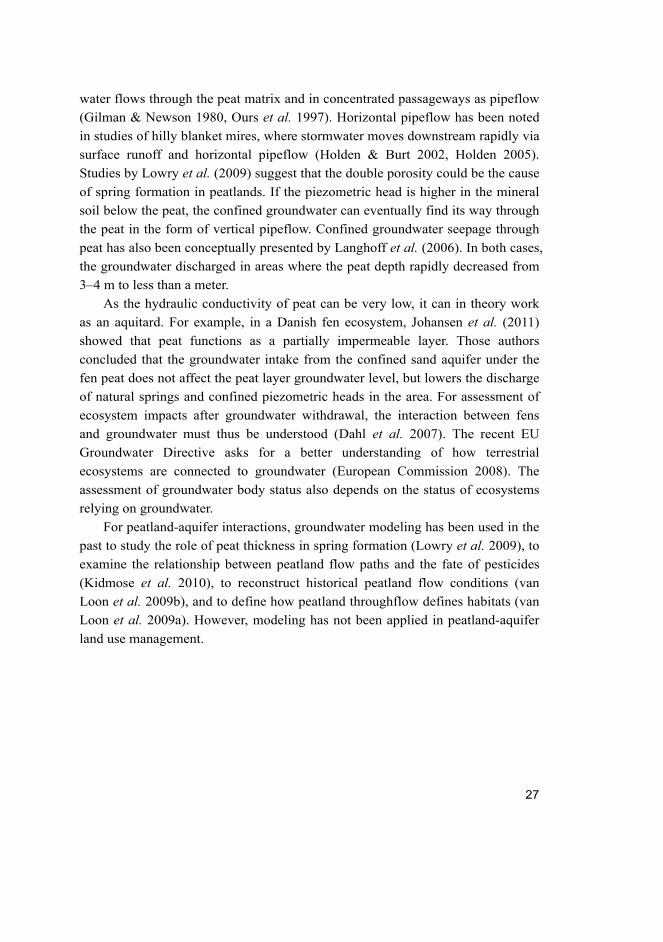
The Rokua esker aquifer (Fig. 2) is part of a chain of consecutive eskers in
Northern Finland formed during the last deglaciation period (Aartolahti 1973).
Rokua is a deltaic anticline esker (i.e., the groundwater from the esker discharges
to the surroundings) sand formation that rises on average 30–40 m above the
surrounding landscape (90 m at maximum; Fig. 3). The groundwater discharge
area is covered with peatlands formed after glacial melt, with a maximum peat
thickness of more than 5 m (Pajunen 1995, Häikiö 2008). Rokua has a recharge
area of 92 km2 and a current groundwater protection area of 139 km2 in the
discharge zone.
Fig. 2. Rokua esker aquifer with protected areas, groundwater level contours, water
level measurements, discharge subcatchments, and discharge measurement points.
The Siirasoja stream was the study site in Paper I and non-measurement groundwater
mound points I and point II were used for water level analysis in modeling in Paper II.
30
Rokua is one of the largest individual esker groundwater bodies in Finland. It is a
member of the UNESCO Geoparks Network, its western part is protected under
the European Union’s Natura 2000 network, and part of the esker is protected as a
national park (Fig. 2). Rokua is a popular recreation area and holiday resort, with
hotels and second homes. The economic impact of the 120,000 tourists per annum
(mainly hikers and cross-country skiers) on the local economy is significant
(Jurvakainen 2007). Rokua is an example of unique dune formations caused by
the wind and fluvial and coastal currents after deglaciation, as well as deep kettle
holes and kettle lakes (Fig. 3, cross-section). Among the area’s key ecosystems
are the crystal clear, oligotrophic, groundwater-dependent kettle lakes. A
consistent decline in lake water levels, especially after a dry period at the
beginning of the 2000s, raised concerns about their future state. At this point,
several factors were cited as the reason for the decline, with land use (forestry
drainage and peatland harvesting) in the surrounding peatlands suspected of being
one of the main reasons.
Rokua has been geologically surveyed in previous decades by the local
authorities. These surveys included borehole drillings, but only to a maximum
depth of 20–30 m, without any bedrock confirmation (Fig. 3). Peat depth in the
surroundings of Rokua has been studied by the Geological Survey of Finland
using point measurements (n = 4000) of peat layer depth (Häikiö 2008, Pajunen
1990, Pajunen 1993, Pajunen 2009) but the data do not cover all of the peat area.
From 2008 to 2010, the University of Oulu and the Geological Survey of Finland
mapped the Rokua esker geology with a 150 km line length of ground-penetrating
radar (using Malå 50 and 100 MHz GPR system), a 5 km line length of seismic
refraction/reflection measurement, six borehole drillings to the bedrock, and two
partially penetrating boreholes (Fig. 3). These surveys revealed fine and medium
sand layers to a thickness of over 80 m above the bedrock in the esker area. In one
of the boreholes (borehole number 3 in Fig. 3), a 40 m thick sandy gravel core
was found beneath 50 m of sand. Coarse material was also found in eastern parts
of the Rokua esker near Lake Oulujärvi in earlier surveys, but besides these
observations no continuous gravel has been found in the other boreholes or in any
of the geophysical analyses. Apart from the borehole gravel observations, other
different stratigraphical layers, which could have been used to classify esker soil
layers of different permeability, were not evident in the geological data. However,
the esker branches in two directions in the eastern part, and most of the borehole
samples from this part of the esker consist of finer sand. This suggests a deltaic

31
formation rather than an esker, and may be associated with lower hydraulic
conductivities in the eastern part of the Rokua area.
Water levels in 12 lakes and 12 groundwater piezometers at Rokua were
measured monthly in the period 2006–2008 by the local environmental agency. In
2008–2009, 25 automatic water level loggers were installed in lakes and
piezometers in the area by the University of Oulu. According to water level
observations, the groundwater at Rokua forms two separate mounds, which are
represented and studied by modeling in Paper II of this thesis as points I and II
(Fig. 2). From these mounds, groundwater discharges to the surrounding drained
peatlands in a radial direction. The University of Oulu measured discharge from
18 subcatchments to the surroundings (Fig. 3) of Rokua on 4–6 occasions per
year in the period 2009–2012. Subcatchment areas were defined using a LIDAR
digital elevation model provided by the National Land Survey of Finland. The
LIDAR data have an accuracy of 0.15 m vertically and 0.6 m in the horizontal
direction.

32
Fig. 3. Surface elevation, geophysical measurements, boreholes, partially penetrating
boreholes reaching depths of 20–30 m below the surface, and a cross-section A-B of
the Rokua esker with drained peatlands and kettle lakes. The esker consists mostly of
sand with no continuous stratigraphical layers, but local gravel deposits occur. The
vertical axis of the cross-section is exaggerated for clarity. Reprinted with permission
from Springer.

33
4 Materials and methods
4.1 Groundwater-surface water interaction of a peatland discharge
area (I)
In order to study groundwater discharge to a drained peatland, a study site area
located in the upper catchment area of the Siirasoja stream was chosen (Fig. 2).
The Siirasoja stream had one of the highest runoff amounts of the streams
surrounding Rokua during dry season measurements conducted in July 2009 and
July 2010. The study area (1.5 km2) was divided into subcatchments A - D (Fig.
4). The drained peatland areas had a mixture of forest types, from dense new
forest to thin older forest and clear-cut areas. The Rokua esker formation rises
steeply (30%) on the southern side of the peatland.
Fig. 4. Map of the Siirasoja stream study site and subcatchments A-D, showing the
groundwater pipes, piezometers, stream sampling points, and peat thickness
measurement points. Peat thickness measurements were done with ground
penetrating radar and manual sounding. Pipe 1 is at the same point as borehole
number 4 in Fig. 3. Reprinted with permission from Elsevier.

34
All ditches in the study area were examined in situ during the low-flow season of
July 2009 and classified by their discharge volumes according to measurements
recorded with a flow meter. In addition, in May 2010 two V-notch weirs were
installed at sub-catchment C for continuous discharge measurements (sample
points 2 and 4 in Fig. 4). Water level loggers (Solinst Levelogger Gold) were
installed at the weirs for hourly measurements.
Groundwater exfiltration points in ditches were identified and classified as
either point or diffuse exfiltration types. Spring-like groundwater point discharges
were first visually observed and then confirmed with water temperature
measurements from the ditch water before and after the observed point. Because
groundwater temperature was approximately 10 °C colder than that of the surface
water during the in situ study period, it was possible to use the temperature
difference as a tracer (see e.g., Anibas et al. 2011). If no point discharge was
observed, the discharge of a ditch increased, and water temperature was low, the
ditch was classified as having groundwater seepage discharge.
The hydrogeological structure of the area was studied using a variety of
methods. Esker formation thickness was studied with drilling to the bedrock at
groundwater pipe 1 (see Fig. 4). At the drilling point, the esker consisted of an
83.4 m thick layer of homogeneous sand (see Fig. 3, cross-section) with a mean
d50 grain size of 1.961 mm and a standard deviation of 0.065 mm (10 samples).
Peat layer thickness in the area has been reported previously by Häikiö (2008).
Those data were supplemented with additional manual peat drillings and ground-
penetrating radar measurements in 2009 and 2010 (Fig. 4). The spatial
distribution of peat thickness was interpolated for the area using the natural
neighbor method (140 measurement points at the study site). The groundwater
level in sand and peat layers was recorded hourly in piezometers and groundwater
pipes in the area (Figs. 4 and 5), using water level loggers (Solinst Levelogger
Gold).

35
Fig. 5. Cross-section of the Siirasoja study site from groundwater pipe 1 to
piezometers 1 and 2. Horizontal axis has 10:1 exaggeration. Reprinted with permission
from Elsevier.
The hydraulic conductivity of the peat was measured using a direct-push
piezometer with a falling head (Hvorslev 1951). Measurements were taken from
different depths (20–200 cm) at four locations in the study area. The hydraulic
conductivity varied in these measurements from 10-5 m s-1 at 20 cm depth to
10-9 m s-1 at 200 cm depth. The hydraulic conductivity for sand of 2 mm d50 grain
size is usually 10-3 to 10-6 m s-1 (Davis 1969). Hydraulic conductivity values were
used in the Geoslope (Geostudio 2007) and Topodrive (Hsiesh 2001) programs to
outline groundwater flow routes.
Precipitation records from 1 July 2009 to 1 July 2010 were obtained from the
Finnish Meteorological Institute’s (FMI) Pelso Climate Station, located 10 km
south of the study site. Moreover, local precipitation was determined at the
Siirasoja stream using a tipping bucket gauge at one-hour measurement intervals
during the period 22 May 2010–1 July 2010. The snow water equivalent (SWE)
was measured by the Finnish Environment Institute at the snow line in Vaala, 11
km north-east of the study site. Evapotranspiration at the study site was estimated
using the United Nations Food and Agriculture Organization (FAO) Penman-
Monteith equation (Allen et al. 1998).

36
Data on meteorological variables were provided by FMI. Daily temperature
was measured at the Pelso Climate Station, while data on relative humidity, wind
speed, and global radiation were obtained from nearest 10 km x 10 km FMI grid
interpolation point of Finland. Applying the FAO Penman-Monteith equation
during winter can lead to erroneous results, because assumptions for reference
evapotranspiration calculations are contradicted for the snow cover period (Allen
et al. 1998). This was taken into account by setting the evapotranspiration to zero
for days when the maximum temperature was below 0 °C.
In addition to field observations and discharge measurement, natural tracers
(SiO2, Ca, pH, and electrical conductivity) were measured at the study site to
identify groundwater flow paths and exfiltration to the ditches on the hillslope
scale. Water samples were taken in June 2010 from stream sample points 1 to 4,
groundwater pipes, piezometers (Fig. 4), and rainwater (2 km west from study
site). In addition, in one stream section a mixing analysis was conducted, using
SiO2 as a natural tracer. SiO2 is typically used in groundwater and surface water
mixing studies (e.g., Hooper & Shoemaker 1986, Wels et al. 1991, Iorgulescu et
al. 2005), as precipitation usually has a very low concentration of SiO2. All
samples were analyzed by the Finnish Environmental Institute (SYKE) laboratory,
which is accredited for water sample analyses by the Finnish Accreditation
Service.
The mixing analysis was based on conservation of mass and water balance
and the assumption that the SiO2 tracer is chemically conservative. The mixing
ratio was calculated between the stream sampling points 2 and 4, where discharge
was measured with V-notch weirs. Mixing analysis was used to define the ratios
of water exfiltrating from the peat aquitard and from the sand aquifer to the
stream section between the V-notch weirs. The mixing analysis was calculated
using four end-points in eq. (1) and (2):
1. Upstream V-notch weir (stream sample point 2)
2. Peat aquitard (tracer sample from piezometer 1)
3. Sand aquifer (tracer sample from piezometer 2)
4. Downstream V-notch weir (stream sample point 4).
4 4 1 1 2 2 3 3Q C Q C Q C Q C , (1)
4 1 2 3Q Q Q Q , (2)

37
where Q1–4 is the discharge of components 1–4 (m3 d-1) and C1–4 is the
concentration of end-point samples 1–4 (mg L-1). From eq. (1), discharge for the
peat aquitard and the sand aquifer was calculated:
4 3 4 1 1 3
23 2
Q C C Q C CQ
C C
, (3)
4 2 4 1 1 3
32 3
Q C C Q C CQ
C C
, (4)
Rainwater was not taken into account in these calculations, as all samples were
taken during a dry period defined as no rain in three days.
4.2 Modeling future management scenarios (II)
Rokua is an anticline type esker, where the groundwater is discharged from the
groundwater mounds of the esker to the surrounding drained peatlands (Fig. 6a).
The humified peat deposits have a lower hydraulic conductivity than the esker
aquifer and have features of a semi-confined layer, with water flow in preferential
channels within the peat (see section 5.1). Groundwater flow from the esker to the
whole surroundings was simulated by a steady state model. The MODFLOW
groundwater model (McDonald & Harbaugh 1984) was built as a one-layer model
(because, as stated earlier, no continuous stratigraphy was detected), with a
uniform cell size of 100 m x 100 m. Boundary conditions fell into three categories.
Regional dammed lakes and a large dammed river surrounded part of the model
area, and were modeled as first type constant head boundaries (Fig. 7). Based on
the geological data, the soil layers situated south of the esker are thin (Fig. 3,
south of the cross-section), with local bedrock exposure, and therefore a no-flow
boundary was defined for these areas. Some of the lakes located in the esker area
have an outlet and were modeled as general heads (Fig. 7), as the stream outlet
from the lake keeps the lake water level constant as recharge and runoff
replenishes it.

38
Fig. 6. (A) Groundwater flow discharge from the Rokua esker to surrounding
peatlands and (B) peatland drain boundary condition concept in the MODFLOW model
cell. Reprinted with permission from Springer.

39
Fig. 7. Rokua MODFLOW model conditions, pilot points, and land use scenario
conditions. Constant head boundary conditions were defined for the River Oulujoki
with two dams, Lake Ahmasjärvi and Lake Oulujärvi. Lakes with outflow were defined
as general heads. Groundwater points I and II were used for water level follow-up
before and after calibration and in scenario runs. Reprinted with permission from
Springer.
The peatland drainage system covers almost all the peatlands surrounding the
Rokua esker (forestry ditches and streams in Fig. 2). The MODFLOW drain
package was used in all of the cells surrounding Rokua as a boundary condition
(Fig. 6b), to simulate water outflow to peatland drains from this part of the model
domain. Use of the drain package requires a drain elevation (level of the drain
bottom) and a drain conductance to be defined. When the simulated groundwater
level in a cell rises to the drain elevation, groundwater discharges to the drain. In
the modeling approach employed in Paper II, the conductance value represented
how the peat layer resists groundwater discharge. The physical properties of the

40
confining peat layer were used to define the drain conductance value in the drain
package as:
peatK lwCon
b (5)
where Con is the drain conductance (m2 s-1), b is the thickness of the peat below
the ditch (m), kpeat is the hydraulic conductivity of the peat (m s-1), l is the model
cell length (m), and w is the width of the ditch (m). The values for ditch width
(2 m, 3 ditches in a cell) and depth (0.8 m) were defined from drainage standards
used in Finland (Koivusalo et al. 2008). The average peat thickness below the
ditch was 0.6 m, based on Geological Survey data. An estimated value of 1.15 x
10-3 m2 s-1 (100 m2 d-1) for conductance was used as an initial condition for the
modeled area. This corresponds to a peat hydraulic conductivity of 10-6 m s-1 and
represents the situation where drainage has increased the hydraulic conductivity
from the natural value of 10-7 m s-1 (Päivänen 1973, Holden & Burt 2002). This
starting value for conductance was considered to represent the preferential flow
channels and seepage found in these drained discharge areas (see section 5.1).
The cell top elevation value in MODFLOW was calculated from LIDAR data
over the cell area. Using the cell top elevation as the drain elevation would
overestimate the drain depth, because the drains occupy the lowest elevations of a
cell. Therefore the lowest elevation within each cell in the groundwater discharge
area was calculated from LIDAR data and assigned the drain elevation in that cell.
Aquifer recharge was estimated using the COUP model, which is often used
in Nordic conditions to simulate water flow in the soil-vegetation-atmosphere
continuum (Jansson & Karlberg 2004). Driving climate data for recharge
(precipitation, temperature, global radiation, wind speed, and relative humidity)
were obtained from the Finnish Meteorological Institute (1960–2010) and
downscaled regional climate change data (2010–2100) from four different global
climate models (GCMs) based on the SRES A1B (Special Report on Emissions
Scenarios A1B) greenhouse gas emission scenarios (Nakićenović & Swart 2000,
IPCC 2007). The recharge area was subdivided into different zones, similar to
those used by e.g., Jyrkama et al. (2002), which were defined by high resolution
data for leaf area index and unsaturated soil profile thickness. Water flow in the
soil profiles for each zone was simulated with the recharge equation. Transient
model runs resulted in daily time series of recharge, which were summarized to
annual values for hydrological years (1 Oct-30 Sept). The annual 440 mm
recharge, averaged for the period 2000–2010, was used as the steady state

41
recharge in MODFLOW. However, a lower level of detail was deemed adequate
for the study, so the data from the simulations were averaged spatially and
temporally. Previous estimates of esker aquifer recharge in Nordic conditions
range from 50 to 70 % of annual rainfall (Zaitsoff 1984, Lemmelä & Tattari 1988,
Lemmelä 1990). Recharge simulation results from the COUP model fell within
the range reported in previous studies and were considered to give a more site-
specific estimate.
4.2.1 Calibration and uncertainty analysis using PEST
The pilot point method (de Marsily et al. 1984, Doherty 2003) was used to
parameterize the hydraulic conductivity and the spatial distribution of drain
conductance within the model. Parameter values were estimated using PEST
(Doherty 2013). In the pilot point method, parameter values are estimated at
discrete locations and then interpolated to model cells. Pilot points were also used
to study the spatial identifiability of the parameters. Hydraulic conductivity was
parameterized using 489 pilot points and drain conductance was parameterized
using 375 pilot points within the model (Fig. 7). Long-term average data on water
levels during 2006–2011 and discharge values during 2009–2011 were the
calibration targets. Water levels were assigned different weights according to the
temporal data available and the quality of the measurement at each point (weight
0.5–1, where 0.5 corresponds to a short time span of measurements).
Subcatchment discharge data weights were smaller (weight 0.0005), as the data
had a relative difference in accuracy compared with water level data (hundreds of
cubic meters for discharge compared with 0.1 m for water level). Furthermore,
discharge was only measured 4–6 times a year for three years. The use of these
weights also ensured that discharge data contributed roughly the same as head
data to the overall objective function at the commencement of the inversion
process. Such a strategy can be used to ensure that information contained within
different types of data achieves its objective of informing parameters during the
overall calibration (Doherty & Welter 2010).
The starting value used for hydraulic conductivity of the aquifer was
10-5 m s-1. Parameter upper and lower bounds were based on common values for
sand (e.g., Davis 1969) and grain size analysis data on soil samples from the
Rokua area. In total, 36 soil samples from eight boreholes were analyzed for grain
size distribution. When a borehole with grain size analysis data was near a pilot
point, the soil sample-based K value estimated for the borehole was used to give
42
the pilot point a starting value and calibration upper and lower limits. The initial
condition for drain conductance was the value of 1.15 × 10⁻³ m2 s-1 (100 m d-1) for
the drainage area, as stated in section 4.2.
In solving the inverse problem of calibration of the Rokua model, two types
of regularization were implemented by PEST. One of these was Tikhonov
regularization (Tikhonov & Arsenin 1977), which imposed the constraint that
parameters vary from their initial values (informed by geological knowledge, as
described above) to the smallest extent possible in order to fit the calibration
dataset. The other was singular value decomposition as described by e.g., Aster et
al. (2005), which ensures numerical stability by partitioning parameter space into
solution and null spaces; a solution to the inverse problem is sought only in the
former space. In implementing PEST’s Tikhonov regularization functionality, the
target objective function specified was somewhat higher than the lowest that
could be achieved with this measure. This target was chosen to provide a level of
fit commensurate with the measurement noise associated with the data and the
structural noise associated with the model. The latter was assessed through the
fact that such an objective function results in estimation of parameter fields which
are geologically reasonable (based on measurements of the area and the literature
concerning eskers) and do not appear to show signs of “over-fitting”, such as high
levels of spatial hydraulic property heterogeneity.
To study how much information the calibration dataset held with respect to
different parameters employed by the model, the identifiability described by
Doherty & Hunt (2009) was used. The identifiability of a parameter is defined as
the cosine of the angle between a vector in the direction of the parameter in
parameter space, and the projection of that vector onto the calibration solution
space. It can have a value between zero and one. If the value is one, the parameter
is completely identifiable on the basis of the calibration dataset. If its value is zero,
nothing about the parameter’s value can be inferred from the calibration dataset.
Nonlinear uncertainty analysis: Null-space Monte Carlo
The null-space Monte Carlo (NSMC) method (Tonkin & Doherty 2009) can be
used for efficiently generating many different random parameter fields, all of
which are geologically reasonable and all of which allow the model to fit the
calibration dataset. Efficiencies are gained through: (1) generating random
realizations of only null-space components, centered on the calibrated parameter
field; (2) re-calibrating the model on each occasion (no re-calibration would be
43
needed if the model were truly linear) using so-called “super parameters”, which
are typically small in number as they span the solution subspace of parameter
space; and (3) using pre-calculated sensitivities for the first iteration of these re-
calibration procedures for all parameter realizations.
In implementing the NSMC process for the Rokua model, the random field
recalibration process was halted either when the target objective function was
achieved, or after two iterations. A total of 900 stochastic parameter fields were
generated and subjected to re-calibration in this way; 870 of these re-calibration
exercises achieved the target objective function within two iterations. Only those
which achieved the target were retained for subsequent uncertainty analysis. An
average of 24 model runs was needed per parameter field. Outputs calculated
using NSMC-generated parameter fields were compared with the same outputs
generated using the 900 stochastic parameter fields prior to the NSMC process.
The comparison was made for two non-calibration points (points I and II, Fig. 2)
to demonstrate how much the hydrological information on the calibration data
could narrow the range of uncertainty of these model predictions.
4.2.2 Land use change and climate variability scenarios
To demonstrate the impact of different land use or climate condition scenarios on
the status of groundwater in the esker aquifer, a calibration-constrained
uncertainty analysis was undertaken with the model. The fact that the model is
steady state removes its ability to predict the timing of changes undergone by the
groundwater system. However, the final state of the system after land use changes
or periods of constant (high or low) driving conditions (the most important
information required for the decision-making process in the present context) is
still predictable. At the same time, the relatively short computation requirements
for steady state simulations allow uncertainty analysis of the type described here
to be undertaken. In making each prediction of future groundwater state, the
model was run 870 times under the pertinent altered conditions (see Table 1), i.e.,
one model run was undertaken using each of the parameter fields computed
through the null-space Monte Carlo process. The effects of scenarios on esker
water levels were studied for groundwater mound points I and II (see Fig. 2), as
these points represent the average groundwater state in the esker area.

44
Table 1. Summary of land uses tested and different climate scenarios with changed
conditions for each model (gw = groundwater; see text for explanation of scenarios).
Reprinted with permission from Springer.
Scenario name Drained peatland restoration hypothesis GW-
abstraction
Climate data
Restoration
area
Drain
elevation rise
Factor to peat
hydr. cond.
Restoration 1A current
gw-area
0.5 m - - 2000–2010
Restoration 2A current
gw-area
0.5 m 0.5 - 2000–2010
Restoration 3A current
gw-area
0.5 m 0.1 - 2000–2010
Restoration 1B expanded
gw-area
0.5 m - - 2000–2010
Restoration 2B expanded
gw-area
0.5 m 0.5 - 2000–2010
Restoration 3B expanded
gw-area
0.5 m 0.1 - 2000–2010
Abstraction - - - 27 000 m3 d-1 2000–2010
Abstraction and
Restoration 3A
current
gw-area
0.5 m 0.1 27 000 m3 d-1 2000–2010
Dry - - - - 1970–1980
Dry and Restoration
3A
current
gw-area
0.5 m 0.1 - 1970–1980
Dry and Restoration
3B
expanded
gw-area
0.5 m 0.1 - 1970–1980
Dry 2050–2100 - - - - 2050–2100 climate
scenario data
Drained peatland restoration
Drain blocking is a common method for restoring the hydrological and ecological
conditions of a peatland (e.g., Armstrong et al. 2009, Wilson et al. 2010, Aapala
et al. 2013). Drained peatland restoration has been considered as a potential
method to maintain the aquifer water levels at a higher elevation. Here, the effect
of such restoration was modeled by: 1) raising drain water levels (drain elevation
parameter) with dams; and 2) filling the ditches and reducing the hydraulic
conductance of drains (see Fig. 6b). Both of these methods have been used in
practise for peatland restoration. Drains were assumed to reduce the confining
effect of the peat layer, thereby enabling more exfiltration from the aquifer to the

45
drainage ditches. Restoration of the drained area, e.g., through filling in the
ditches, reduces the hydraulic connection between the aquifer and drainage
ditches. Thus the elevation of the groundwater exfiltration point (elevation of the
ditch) in the restored peatland also rises. Six different restoration scenarios were
tested:
– Restoration 1A: Restoration is carried out within the current groundwater
protection area. A 0.5 m rise in drain elevation (as the ditches are dammed)
was imposed in the model.
– Restoration 2A: As in scenario 1A, except drain restoration decreases drain
conductance by a factor of 2 as the drains are filled in (i.e., drain conductance
was multiplied by a factor of 0.5) within the restoration area.
– Restoration 3A: As in scenario 1A, except drain restoration decreases drain
conductance by a factor of 10 (i.e., drain conductance was multiplied by a
factor of 0.1) within the restoration area. This value is considered to represent
more natural state conditions of the peatlands (see section 4.2).
– Restoration 1B: Restoration is carried out in a groundwater protection area
expanded at the western edge of the esker, where a sensitivity analysis
suggests that changes in drainage conditions will affect aquifer water levels
(Fig. 7). Drain elevations were raised by 0.5 m in this area.
– Restoration 2B: As in scenario 1B, except drain restoration decreases drain
conductance by a factor of 2 (i.e., drain conductance was multiplied by a
factor of 0.5) in the expanded area.
– Restoration 3B: As in scenario 1B except drain restoration decreases drain
conductance by a factor of 10 (i.e., drain conductance was multiplied by a
factor of 0.1) in the expanded area.
Small-scale restoration comprising blocking a single ditch within the Rokua
discharge area was tested by Kupiainen (2010) and a groundwater discharge
decrease and groundwater potentiometric level rise adjacent to the restoration area
showed local potential for restoration. That study represented a situation where
drain elevation was raised with a dam, as in the Restoration 1A scenario. As no
local data were available on the effects of filling in the ditches, the factors 0.5 and
0.1 were used as representative end results of restoration.

46
Groundwater abstraction
Oulu, the main city in Northern Finland (population 190 000), is situated 70 km
from the Rokua esker. There are no current or future plans to extract groundwater
for use in Oulu from the vicinity of Rokua, but this scenario was nevertheless
tested using the model developed in this study as a further demonstration of its
use as a management tool, and to have a comparison point for the effects of
peatland drainage on aquifer storage. The city currently uses 27 000 m3 of water
per day, which is approximately 25% of the daily recharge of the Rokua aquifer
(average for 2000–2010). In the Abstraction scenario, this amount was assumed to
be pumped from 10 abstraction wells around Rokua (Fig. 7). The Abstraction
scenario was also combined with the Restoration 3A scenario in order to
investigate whether the effects of abstraction on water levels could be reduced
with concomitant drain restoration.
Past and future dry climate seasons
The driest 10-year period within the available local climate data (1960–2010) was
1970–1980. The average recharge for this 10-year period was used to examine
how the model responded to periods of lower than average recharge compared
with the climate conditions used for calibration (2000–2010). This dry period
scenario was also combined with the Restoration 3A and 3B scenarios. Future
recharge was estimated with the same simulation approach as the historical
recharge, using the downscaled projected climate change scenario data for
precipitation, temperature, global radiation, wind speed, and relative humidity as
the driving variables in the recharge model for the period 2010–2100. As for the
historical dry period, a 10-year moving average was calculated from the simulated
recharge for each of the four climate change scenarios to obtain a recharge
estimate for drier than average periods for 2050–2100. The minimum 10-year
moving average for each climate scenario was considered as the recharge for dry
periods in the future climate conditions, all of which were used as model inputs in
NSMC predictive runs.
4.3 Decision analysis framework (III)
The aim of the MCDA process was not to obtain a definitive solution to the
problem of the Rokua aquifer, but to support stakeholder participation and

47
increase the overall understanding of the problem for all parties. In the beginning
of the MCDA process in spring 2011, the groundwater management issue seemed
to be an ‘unstructured problem’ (see Turnhout et al. (2008) for problem
definition), with no consensus concerning either the goals or the means and with
great scientific uncertainty. For example, the groundwater modeling for
management (Paper II) was in preparation, and therefore only preliminary
modeling results were available for the MCDA process. In this kind of context,
decision making requires a high level of participation by actors holding
conflicting perspectives and interests. Policy development becomes a learning
process, a dialogue where actors develop and reflect upon conflicting perspectives
(Turnhout et al. 2008).
The MCDA method applied in the Rokua case is based on multi-attribute
value theory (MAVT) (Keeney & Raiffa 1976), and it takes advantage of the DAI
approach (Marttunen & Hämäläinen 2008, Marttunen 2011), based on personal
interviews using a multi-criteria model. At the core of the DAI framework is
MCDA-based interactive and individual analysis. In the DAI approach, framing
and structuring, as well as impact assessment, are carried out in close co-
operation with all key stakeholders. In the interviews, the decision analyst uses
MCDA software and poses questions to the interviewee, ensuring that the answers
reflect the interviewee’s views as closely as possible.
In MAVT, a decision problem is formulated with multiple attributes, and
these attributes are used in the evaluation of the alternatives. MAVT has been
proven to be a systematic and a transparent way to model problems with multiple
criteria and alternatives when working with stakeholders (see e.g., Mustajoki et al.
2011). In the interview process, the stakeholders or decision-makers are asked to
give numerical preference statements, which are used to calculate the attribute
weights describing the trade-offs between the attributes in the additive value
function model. In eliciting the weights of the criteria, the interviewees are
encouraged to profoundly consider their own values and the trade-offs. This
‘learning by analyzing’ technique is one of the main advantages of the DAI
approach (Marttunen & Hämäläinen 2008).
The DAI approach has been observed to help the participants in assigning
consistent and unbiased weights. In an interactive interview, the analyst can
notice possible inconsistencies, misunderstandings, and biases in the
interviewee’s answers (Marttunen & Hämäläinen 2008). For example, in
watercourse planning, MCDA methods are reported to inspire learning and
understanding in a different manner than conventional meetings, while interactive

48
use of the methods has supported systematic analysis of stakeholder preferences
and has helped analyze how these preferences affect the ranking of the
alternatives (Marttunen & Suomalainen 2005, Marttunen & Hämäläinen 2008).
The decision analysis process in Rokua was led by an expert group consisting
of researchers from the University of Oulu. The expert group organized a total of
four different meetings or workshops with the stakeholders (see Table 2), where
the MCDA work was processed. Figure 8 describes the main phases of the
decision analysis process.
Table 2. List of stakeholder groups and representatives in the decision analysis
interviews.
Stakeholder Representation Number of interviewees
Forestry Forest Centre (state organization) 2
Forestry association 1
Forest owner 3
Regional administration Groundwater management 3
Conservation of habitats 2
Nature park administration Forest park services 1
Municipalities Chief engineers 2
Tourism Hotel manager 1
Local NGO Rokua association 1
Second house owners Association of owners 1
Development organization Humanpolis/Geopark 1
Peat production Turveruukki company 1

49
Fig. 8. Decision analysis process in the Rokua case.
4.3.1 Stakeholder analysis and structuring the value tree
In the first stakeholder meeting, the initial list of stakeholders and the definition
of the decision context in the Rokua esker area and groundwater management
were presented to the various interest group representatives. As a result of that
meeting, a list of stakeholders (see Table 2) to be involved was finalized, and a
first draft of the value tree, including the stakeholders’ objectives concerning
groundwater management and land use in the Rokua esker area, was formed (see
Fig. 9). The next step was to finalize the value tree. In the second stakeholder
meeting, the objectives (reflecting ‘what matters’ to those whose views should be
considered in a given decision context) on the basis of the initial proposal for the
value tree were discussed. In the same meeting, the attributes for the measurement
of each objective were set up (Table 3, see next section).
The meeting mainly focused on discussing the objectives and their
measurement. For example, there was discussion about how to measure the
change in tourism if the water levels in the kettle lakes continue to decrease. It
was generally accepted that changes in the number of tourists visiting the area due
to water level variations cannot be evaluated convincingly, since many other
issues (e.g., the overall standard of tourism services) influence the attractiveness
of the area in the future. The ecosystem services of the kettle lakes that provide

50
recreational and aesthetic benefits for visitors are one of the area’s attractions, but
they do not form the only and decisive factor for the whole tourism sector.
Indirect economic benefits of tourism and forestry for the local and regional
economy were also discussed. It was decided not to focus on these benefits in the
assessment, due to the considerable level of uncertainty concerning how much
water level changes may affect these factors.
Fig. 9. Value tree for the multi-criteria decision analysis of Rokua.
4.3.2 Development of alternatives and impact assessment
The possible land use management alternatives were considered while structuring
the value tree. The set of alternatives was initially developed by the expert group
and discussed and revised in the second stakeholder meeting. The alternatives
developed reflect the main objectives and interests, as well as issues of conflict:
Alternative A: Business-as-usual
Forestry practices continue as usual; reopening of drainage ditches in the
groundwater area is not prohibited, but is under case-by-case consideration by the
regulators.

51
Alternative B: Expansion of the groundwater protection area
A 3–5 km2 expansion of the Rokua groundwater protection area into the
surrounding peatlands, where groundwater is confined under peat. Forestry is
limited or forbidden in these areas. The environmental administration’s control
over the area is strengthened.
Alternative C: Active restoration (technical solutions) of peatlands
Restoration of critical groundwater exfiltration areas either by damming or filling
in drainage ditches. The alternative focuses on adaptive management efforts to
locate the most critical areas of groundwater exfiltration instead of protecting
larger land areas.
Locations for groundwater area expansion (Alternative B) and restoration
targets (Alternative C) were estimated by using the groundwater exfiltration risk
prediction method developed for Rokua by Eskelinen (2011). The method
estimated the most likely locations of groundwater exfiltration from the slope of
the esker, distance from the recharge zone, distance from springs, baseflow of the
discharge area watersheds, and peat thickness.
The impact assessment of the selected alternatives was conducted by the
expert group after the second stakeholder meeting. The hydrological, ecological,
and socio-economic impacts of the proposed alternatives during a 30-year period
are presented in Table 3. The impact assessment was based on the studies
conducted and the preliminary results of ongoing research in the area. As the
assessment was partially based on preliminary results and the time span of the
assessment was 30 years, the uncertainty of the impact assessment was considered
to be high. For this reason, some of the impacts were studied using less precise,
qualitative measures. These qualitative measures indicated whether the alternative
had a negative impact (−), no change from the current situation (0), or a positive
(+) or highly positive impact (++). For example, active restoration was assessed
to have a highly positive impact on the springs surrounding Rokua.
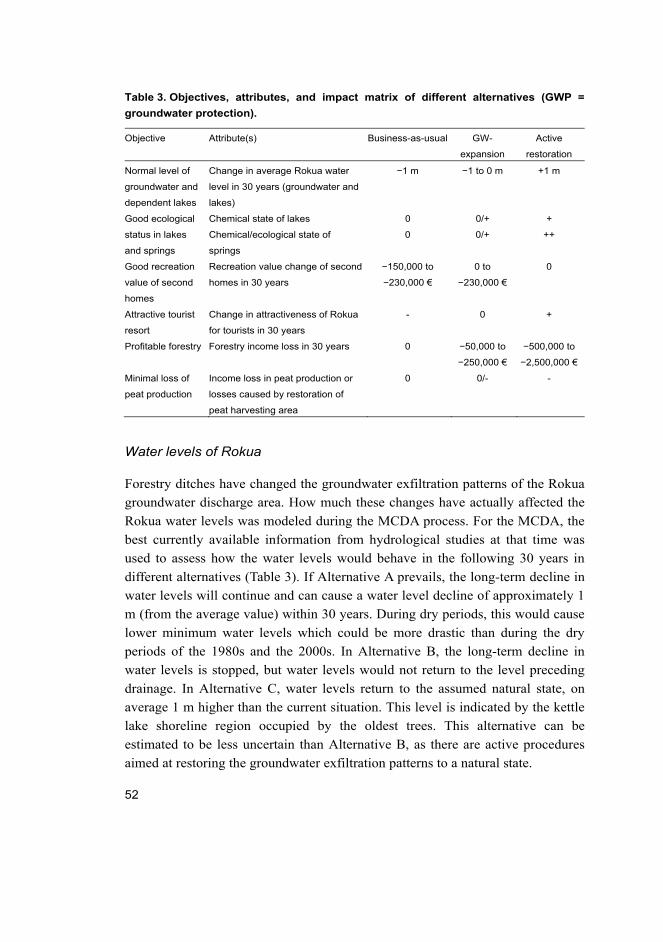
52
Table 3. Objectives, attributes, and impact matrix of different alternatives (GWP =
groundwater protection).
Objective Attribute(s) Business-as-usual GW-
expansion
Active
restoration
Normal level of
groundwater and
dependent lakes
Change in average Rokua water
level in 30 years (groundwater and
lakes)
−1 m −1 to 0 m +1 m
Good ecological
status in lakes
and springs
Chemical state of lakes 0 0/+ +
Chemical/ecological state of
springs
0 0/+ ++
Good recreation
value of second
homes
Recreation value change of second
homes in 30 years
−150,000 to
−230,000 €
0 to
−230,000 €
0
Attractive tourist
resort
Change in attractiveness of Rokua
for tourists in 30 years
- 0 +
Profitable forestry Forestry income loss in 30 years 0 −50,000 to
−250,000 €
−500,000 to
−2,500,000 €
Minimal loss of
peat production
Income loss in peat production or
losses caused by restoration of
peat harvesting area
0 0/- -
Water levels of Rokua
Forestry ditches have changed the groundwater exfiltration patterns of the Rokua
groundwater discharge area. How much these changes have actually affected the
Rokua water levels was modeled during the MCDA process. For the MCDA, the
best currently available information from hydrological studies at that time was
used to assess how the water levels would behave in the following 30 years in
different alternatives (Table 3). If Alternative A prevails, the long-term decline in
water levels will continue and can cause a water level decline of approximately 1
m (from the average value) within 30 years. During dry periods, this would cause
lower minimum water levels which could be more drastic than during the dry
periods of the 1980s and the 2000s. In Alternative B, the long-term decline in
water levels is stopped, but water levels would not return to the level preceding
drainage. In Alternative C, water levels return to the assumed natural state, on
average 1 m higher than the current situation. This level is indicated by the kettle
lake shoreline region occupied by the oldest trees. This alternative can be
estimated to be less uncertain than Alternative B, as there are active procedures
aimed at restoring the groundwater exfiltration patterns to a natural state.

53
Ecological state of lakes and springs
Preliminary studies of groundwater-surface water interactions in Rokua have
shown that phosphorus is leaching into the groundwater from sandy soil,
especially when the groundwater has a long contact time with the sand (i.e., old
groundwater). As the clear oligotrophic kettle lakes are groundwater-dependent,
the risk of eutrophication increases due to water level decline. The risk also
increases as older groundwater might seep into lakes and increase the
proportional amount of incoming phosphorus. Additionally, lake water volume
decreases due to water level decline, increasing the proportional amount of
phosphorus entering the lakes.
Another ecological issue is that drainage has dried up natural springs that
formerly acted as natural groundwater exfiltration locations in the peatlands
surrounding Rokua. As they are dry, a poor ecological state currently exists in
these spring ecosystems. If drained areas are restored, the springs will most
probably return to a more natural state. Spring locations have not been mapped
thoroughly and therefore the question of how many springs can be restored
increases the uncertainty of this factor. The ecological status of both lake and
spring ecosystems is predicted to have a positive impact as a result of
implementing Alternatives B and C.
Recreational value of second homes
One of the key factors in the recreational value of Rokua is the pristine, clear-
water, oligotrophic kettle lakes. To date, 53 second homes have been built on the
shores of these lakes and the recreational value of these houses is partially
dependent on the shoreline. The water level decline is moving the shoreline away
from the houses and revealing former lake bed areas. This will decrease the
recreational value of the lake shore as thickets start to grow and the pristine
landscape changes. The link between the recreational value of second homes and
lake water level was calculated using the VIRKI model. The model was originally
developed to calculate the effects of water level variations on the value of
properties on lake and river shorelines (Keto et al. 2005). In the present case, the
model was used to calculate how much the recreational value of Rokua would
decrease if the shoreline recedes from the level observed in 2008, when lakes no
longer showed significant effects due to previous dry years and water levels were
close to the estimated average of the past 30 years. In Alternative A, the water

54
level is presumed to decrease by approximately 1 m, and this would cause a
shoreline retreat of approximately 5–6 m. This retreat would cause an annual
decrease in recreational value of 94–145 € for each of the second homes. In 30
years, this would mean a 150 000–230 000 € decrease in the recreational value. In
Alternative B the decline would presumably stop, but as the future level variation
is uncertain, the value decrease would be somewhere between 0 and 230 000 €. In
Alternative C, the water levels should return to a more natural state and would be
at those of 2008 or above.
Attractiveness of the Rokua area
Lakes are also one of the key factors in the attractiveness of Rokua for tourism.
Lake level decline might change the landscape and recreational use of lakes. This
again might reduce the amount of visitors to Rokua. As the lakes are only one part
of the landscape in Rokua and as tourism is not only dependent on the lakes, the
impact of lake level change can be considered to have less of an effect on tourism
than, for example, on the recreational value of second homes.
Economic impacts on forestry income
The impacts of the restoration of drained peatland areas on the forest economy
were studied by using exfiltration risk analysis (Eskelinen 2011). Watersheds in
high exfiltration risk areas were defined as areas where active restoration
procedures in Alternative C would be allocated. In these areas, restoration can be
presumed to wet the forest and affect tree growth. As the growth potential of the
forest would then be drastically reduced, the income of the forest owner would
decrease. Using different input data (different combination sets of available data)
in risk scenario maps, the value of income losses in 30 years was calculated to
vary from 500 000 to 2 500 000 € (Eskelinen 2011). The change in land value was
not taken into account. In Alternative B, where the groundwater protection area is
expanded, defining forestry income loss was more problematic. As the expansion
would restrict forestry management practices in some of the areas where the
groundwater area is expanded, some new areas might become wet. As this is less
certain, it was estimated that Alternative B would result in only 10% of the effect
on forestry of Alternative C.

55
Income loss of peat production
Peat production by harvesting in the vicinity of Rokua (Fig. 2, the peat harvesting
area west of the esker) is scheduled to end in 2018. Furthermore, the hydrological
studies showed that approximately 1% of groundwater discharging from Rokua
was flowing from the peat harvesting area. This demonstrated the minimal effect
of the harvesting area on the whole Rokua esker hydrology. Therefore, different
scenarios were presumed to have only a small effect on peat harvesting. In
Alternative B, peat harvesting may end earlier, in the event of the groundwater
area expanding to the peat harvesting site. In Alternative C, a new method is
planned for the restoration of the peat harvesting area to prevent groundwater
exfiltration to the harvesting site. This again might be more expensive than
current methods and reduce the income from peat production.
4.3.3 Decision analysis interviews
Stakeholder preferences were taken into account in the MCDA model by means
of decision analysis interviews. In the third stakeholder meeting and learning
workshop with selected interviewees, the results of the impact assessment were
presented and the framework and process of the decision analysis were described.
The interviewees were given a questionnaire for the interview and an information
package with background information about the case, the decision analytical
approach, and the interviewing process. The package also described in detail the
value tree applied, including the grounds for the alternatives, criteria, and
measurement value estimates.
The interviews, conducted by two researchers in September 2011, involved
19 representatives of the stakeholder groups (see Table 2). In one case, three
interviewees (representing the same stakeholder group and organization) wanted
to give mutual criteria weights, so finally 17 different weighting profiles and
evaluations were gathered in order to infer the preferences of the main
stakeholder groups. Local scales were used as attribute measurement values on a
0–1 value scale. Thus, for each criterion, the lowest attribute value among the
alternative set was mapped to 0 and the highest value to 1, while the other
attribute values were mapped linearly to this scale (Belton & Stewart 2002).
The SWING method was selected for eliciting the weights for the criteria
(von Winterfeldt & Edwards 1986). In this method, an interviewee is first asked
to allocate 100 points to the most important criterion, i.e., the criterion whose

56
value he/she would most prefer to change from its lowest possible level to its
highest level. After this, the decision maker is asked to allocate 0–100 points to
every other criterion to indicate the importance of value change in these criteria in
relation to the value change in the most important criterion. The actual weights
are obtained by normalizing the sum of the given points to 1. The SWING
procedure was chosen in order to ensure that the participants accounted for the
decision context by identifying the most important attribute first, and then the
relative importance of the other attributes was compared against this. It is crucial
that when eliciting weights for the highest level attributes, the participant is fully
aware of the meaning of the attributes. Thus, a bottom-up approach was used in
which the weights were first elicited for the attributes on the lowest level.
The interviews lasted from 1.5 to 4.5 hours. In the first half of each interview,
the interviewers laid out the general principles of the DAI approach, the case, and
the model applied, in order to ensure that the interviewee had understood all of
the details relating to the interview process. After this, the interviewee’s
preferences were entered into the model using the decision analysis software
Web-HIPRE (Mustajoki & Hämäläinen 2000). The final phase of the interview
consisted of analyzing the results and explaining the reasons behind them to the
interviewee.
The data for the evaluation mainly comprised the results of the decision
analysis interviews and the feedback survey for the participating stakeholders.
The feedback questionnaire was introduced in the fourth stakeholder meeting,
where the results of the MCDA process and interviews were presented and
discussed. The participants were asked, for example, to evaluate the suitability of
the MCDA approach applied for meeting the different objectives and the success
of implementation of MCDA in Rokua in supporting learning.

57
5 Results and discussion
5.1 Groundwater-surface water interaction between an esker
aquifer and a drained fen (I)
The groundwater from the esker to the Siirasoja subcatchments discharged into
the drained fen in a complex spatial pattern. A high variation in the amount of
base flow, 24–121 l s-1 km-2, was observed between the four Siirasoja stream
subcatchments, A-D (Fig. 10). These runoff values are much higher than the
typical base flow values of 1.5–3 l s-1 km-2 in Northern Finland (Mustonen 1986),
indicating strong groundwater exfiltration. A high variation was also seen within
each subcatchment, as some ditches had discharge amounts above 500 m3 d-1,
whereas adjacent ditches had no flow.
Fig. 10. Distribution of groundwater discharge to subcatchment ditches and
subcatchment baseflow during low flow conditions. Flow in the ditches was quantified
into three categories: more than 500 m3 d-1, less than 500 m3 d-1, and no flow. The
largest discharge was measured from subcatchment C. Reprinted with permission
from Elsevier.
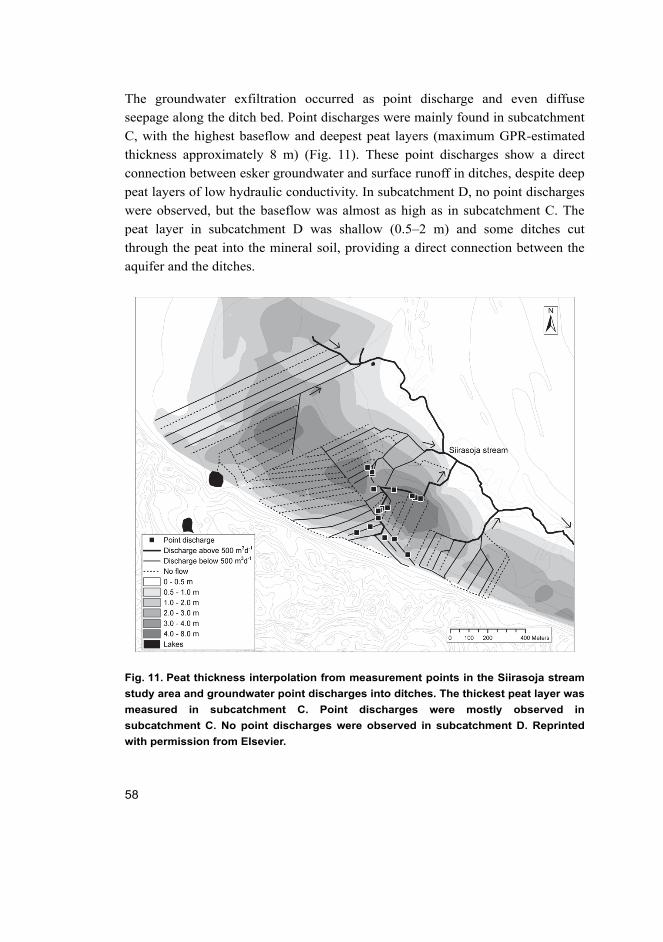
58
The groundwater exfiltration occurred as point discharge and even diffuse
seepage along the ditch bed. Point discharges were mainly found in subcatchment
C, with the highest baseflow and deepest peat layers (maximum GPR-estimated
thickness approximately 8 m) (Fig. 11). These point discharges show a direct
connection between esker groundwater and surface runoff in ditches, despite deep
peat layers of low hydraulic conductivity. In subcatchment D, no point discharges
were observed, but the baseflow was almost as high as in subcatchment C. The
peat layer in subcatchment D was shallow (0.5–2 m) and some ditches cut
through the peat into the mineral soil, providing a direct connection between the
aquifer and the ditches.
Fig. 11. Peat thickness interpolation from measurement points in the Siirasoja stream
study area and groundwater point discharges into ditches. The thickest peat layer was
measured in subcatchment C. Point discharges were mostly observed in
subcatchment C. No point discharges were observed in subcatchment D. Reprinted
with permission from Elsevier.

59
The double porosity point discharge through the peat was induced by a high
pressure level in the aquifer below the peat layer. The pressure head in the sand
layer beneath the peat (measured from piezometer 1) was always higher than the
groundwater level in the peat layer (measured from piezometer 2) during the
measurement period (Fig. 12). On the edge of the esker hillside (groundwater pipe
1) and at the esker (groundwater pipe 2), the aquifer was unconfined. During the
measurement period, the groundwater level and pressure level in all of the sand
layer measurement points varied between 11 cm (piezometer 2) and 14 cm
(groundwater pipe 2).
Fig. 12. Groundwater levels at the Siirasoja stream (upper plot), precipitation,
calculated FAO reference evapotranspiration, and snow water equivalent (lower plot)
for the period 1 July 2009–1 July 2010. Reprinted with permission from Elsevier.
The groundwater pressure directly below the peat deposit and further uphill in the
recharge area showed a clear response to rainfall. Both peat layer water level
(piezometer 2) and sand layer pressure level (piezometer 1) peaked after rain
events, with a 1–2 hour delay (Fig. 13). The increase in sand layer piezometric
pressure level was similar to the depth of areal precipitation (Table 4).
Considering the three longest rainless periods (Table 4), the average rate of
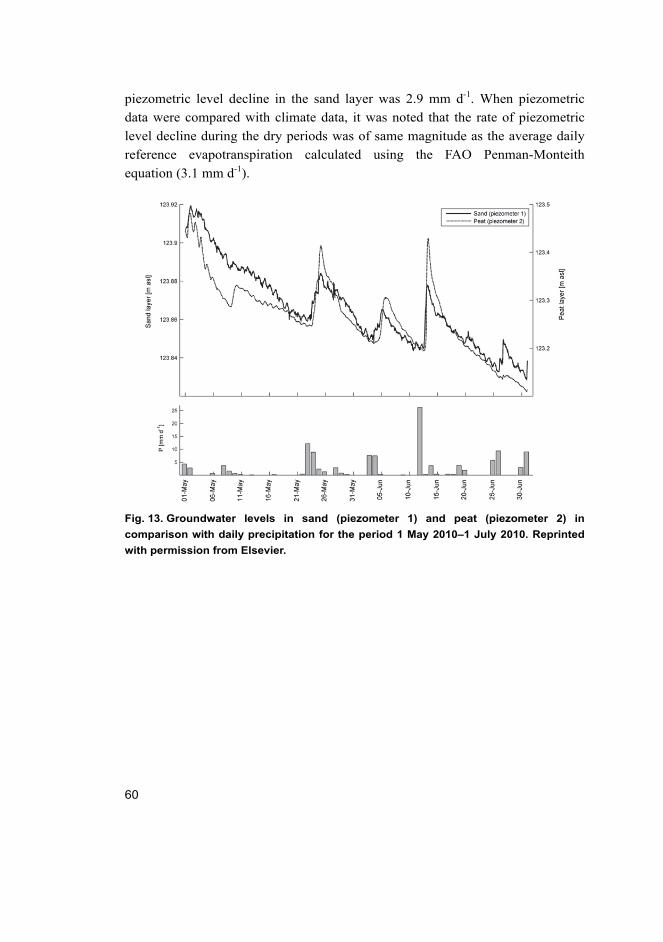
60
piezometric level decline in the sand layer was 2.9 mm d-1. When piezometric
data were compared with climate data, it was noted that the rate of piezometric
level decline during the dry periods was of same magnitude as the average daily
reference evapotranspiration calculated using the FAO Penman-Monteith
equation (3.1 mm d-1).
Fig. 13. Groundwater levels in sand (piezometer 1) and peat (piezometer 2) in
comparison with daily precipitation for the period 1 May 2010–1 July 2010. Reprinted
with permission from Elsevier.
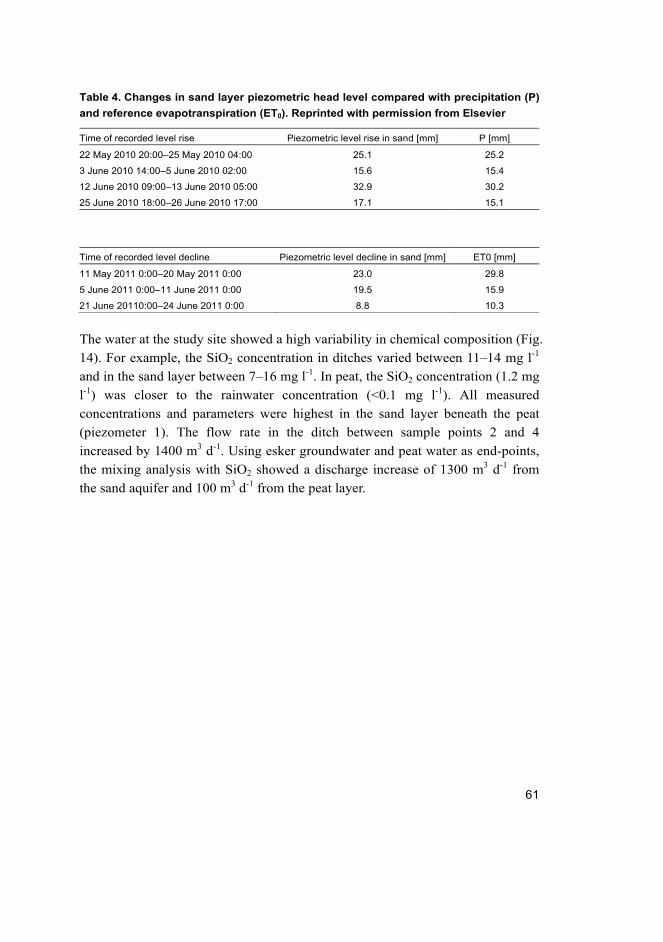
61
Table 4. Changes in sand layer piezometric head level compared with precipitation (P)
and reference evapotranspiration (ET0). Reprinted with permission from Elsevier
Time of recorded level rise Piezometric level rise in sand [mm] P [mm]
22 May 2010 20:00–25 May 2010 04:00 25.1 25.2
3 June 2010 14:00–5 June 2010 02:00 15.6 15.4
12 June 2010 09:00–13 June 2010 05:00 32.9 30.2
25 June 2010 18:00–26 June 2010 17:00 17.1 15.1
Time of recorded level decline Piezometric level decline in sand [mm] ET0 [mm]
11 May 2011 0:00–20 May 2011 0:00 23.0 29.8
5 June 2011 0:00–11 June 2011 0:00 19.5 15.9
21 June 20110:00–24 June 2011 0:00 8.8 10.3
The water at the study site showed a high variability in chemical composition (Fig.
14). For example, the SiO2 concentration in ditches varied between 11–14 mg l-1
and in the sand layer between 7–16 mg l-1. In peat, the SiO2 concentration (1.2 mg
l-1) was closer to the rainwater concentration (<0.1 mg l-1). All measured
concentrations and parameters were highest in the sand layer beneath the peat
(piezometer 1). The flow rate in the ditch between sample points 2 and 4
increased by 1400 m3 d-1. Using esker groundwater and peat water as end-points,
the mixing analysis with SiO2 showed a discharge increase of 1300 m3 d-1 from
the sand aquifer and 100 m3 d-1 from the peat layer.

62
Fig. 14. pH, electrical conductivity (E.C.), calcium (Ca), and silicon dioxide (SiO2)
measurements in groundwater pipes, piezometers, and stream water samples in June
2010. Black columns represent samples from the sand layer, the grey column samples
from the peat, and the white columns samples from the ditch. The dashed line
represents the rainwater sample. Reprinted with permission from Elsevier.

63
5.1.1 Groundwater exfiltration in drained fens
In order to assess groundwater flowpaths in eskers, the discharge patterns must be
properly understood to set correct boundary conditions. The groundwater
discharge patterns can be observed by dividing the study area into subcatchments
of ditches and measuring the discharge rates during low flow. For a detailed
analysis, each ditch must be observed and areas of point discharge and diffuse
seepage must be determined.
As suggested by Lowry et al. (2009), vertical pipeflow (or preferential flow)
can form in peat and can cause spring-like point discharge formations, as
happened at several points in the Rokua Siirasoja study site ditches. These point
discharges seemed to occur where the peat was fairly deep, indicating that peat
depth or matrix hydraulic conductivity does not prevent exfiltration. The mixing
analysis suggested that point discharges can increase the discharge in a 200-m
ditch section by as much as 1300 m3 d-1, whereas surface runoff from the peat
layer was 100 m3 d-1.
The detailed survey of sand and peat topography showed that the point
discharge occurred in transition areas where peat layer thickness changed from
thick to thin (Fig. 15). It is not known whether the point discharges emerged in
the area after drainage, or whether they already existed as natural springs before
drainage. Groundwater diffuse seepage into ditches occurred in places where the
peat layer was penetrated and the ditch had a direct connection to the sand layer.
Both of these exfiltration types were caused by a higher water pressure level in
the sand layer than the ditch water level (Fig. 15). Generally, the drainage
network facilitated exfiltration into ditches by providing a network for conveying
water from the discharge area. The drainage ditches also increased the
piezometric pressure difference between the free water surface (ditch water level)
and the sand aquifer.

64
Fig. 15. Conceptualization of groundwater flow below the peat layer and groundwater
flow mechanisms to ditches at the Siirasoja stream study site. Reprinted with
permission from Elsevier.
5.1.2 Sand aquifer response to rain events and to evapotranspiration
Wetting of the peat during rain events seemed to have a direct impact on the
groundwater pressure head in the sand aquifer. As the peat is an aquitard above
the sand, rain events should not directly affect the sand layer pressure level.
However, the results showed a quick pressure level response to rain. This pressure
level change could also be caused by recharge at the unconfined part of the esker
aquifer, but the response would be less immediate due to the considerable
residence time in the thick unsaturated zone. Thus, the pressure level rise in the
sand layer below the peat was most likely caused by the mass increase of the peat
layer by rainwater. Data analysis showed that the piezometric level increase was
close to the precipitation depth measured at the Pelso Climate Station (Table 4).
The observation that precipitation affects groundwater levels in both the peat
layer and sand aquifer can be explained by peat soil water retention characteristics
and the depth of groundwater level in the peat layer. During dry conditions in the

65
fen, the rainwater is presumably absorbed into the unsaturated zone of the peat
layer, because no increase in peat groundwater level was observed. This is
apparent after the rain event of 25–26 June (Fig. 13). This rain event only
increased the sand layer pressure level, probably induced by increased mass in the
peat layer due to retained water in the unsaturated peat soil.
On the other hand, a quick response in the peat groundwater level was
observed during the rain events of 8–9 May. On that occasion, only a small
amount of precipitation changed the peat groundwater level considerably. This
might have been caused by the peat soil water content being closer to full
saturation after spring snowmelt. The dependence of the peat layer groundwater
level on the moisture status of the peat soil preceding the precipitation event
indicates threshold behavior. The sand aquifer underlying the peat responded
consistently to all precipitation events with a level rise closely matching the depth
of precipitation (Table 4).
During the dry seasons of May and June 2010, the piezometric water level in
the sand and the water level in the peat decreased. The average rate of piezometric
decline in the sand layer was consistent with the average reference
evapotranspiration rate (ET0) calculated using the FAO Penman-Monteith
equation. This observation can be considered the reverse phenomenon to the
precipitation events discussed above, where the depth of precipitation was
consistent with the pressure level rise in the sand layer piezometer. The mass of
water evaporating from the peat layer and vegetation reduces the pressure in the
sand layer.
Assuming that water losses from the peat layer to the drainage ditches during
dry seasons are minor compared with evapotranspiration in the peat layer water
balance, the rate of pressure head decline in the sand layer can be expected to be
equal to the rate of evapotranspiration, as observed. It is still possible that the
calculated ET0 overestimated the amount of daily evapotranspiration.
Parameterization in the reference ET0 was not modified to match study site
vegetation and the method calculates potential, not actual, evapotranspiration.
Part of the piezometric head decline in the sand layer can also have been caused
by loss of water from the peat layer to the drainage ditches, as some drainage flow
from the peat layer was also seen in the results of the mixing analysis.

66
5.2 Impact of peatland drainage and restoration on esker aquifer – future model scenarios (II)
5.2.1 Model calibration and analysis
Based on the results, the hydraulic conductivity values of the model were
informed and constrained by the calibration data, but the drainage conductance
parameter values were less informed by the data (Fig. 16). The area surrounding
the eastern groundwater mound (point II) had lower values and a more complex
pattern of hydraulic conductivity than the area in the vicinity of the western
mound (point I). However, drain conductance values did not change from their
initial values, with a few exceptions where data were able to guide the calibration.
In the Siirasoja stream subcatchment area on the north-central side of the esker
(Fig. 2), the values were almost an order of magnitude lower than that initially set.
Regularized inversion defined a lower conductance of 10-4 m2 s-1 for the Siirasoja
stream area, as inferred from available piezometric data. The peat caused
semiconfined aquifer conditions in the area and the piezometric pressure level of
the aquifer beneath the peat was measured to be above the land surface.
Piezometric data from peatlands were almost non-existent for other areas. As an
outcome of Tikhonov regularization, most of the model area was assigned initial
parameter values after calibration.

67
Fig. 16. Hydraulic conductivity and drain conductance of the calibrated model.
Reprinted with permission from Springer.
Hydraulic conductivity values over the western part of the esker were more
identifiable than those over the east (Fig. 17). Piezometers on the edge of the
recharge area and in the discharge area appeared to hold a large amount of
information with respect to hydraulic conductivity. Some of the discharge
subcatchment areas with discharge calibration data had above zero values for
spatial identifiability, but water levels were clearly more informative of model
parameters. For drain conductance, identifiability was significantly non-zero in
the Siirasoja stream subcatchment, where drain conductance values varied
considerably from their initial values as a result of the calibration process.

68
Fig. 17. Identifiability of hydraulic conductivity and drain conductance. Reprinted with
permission from Springer.
Calibration-constrained NSMC parameter fields show a far greater degree of
variability than that achieved through regularized inversion using Tikhonov
regularization. This is a result of the fact that the latter process purposely seeks a
minimum error variance solution to the inverse problem by minimizing parameter
variability; in other words it tries to find the parameter heterogeneity that must
exist to explain the data (see Moore & Doherty 2005). The NSMC process, on the
other hand, seeks a suite of parameter fields that express hydraulic property
variability which may exist and is compatible with the data. At places within the
model domain, information within the calibration dataset is uninformative, so the
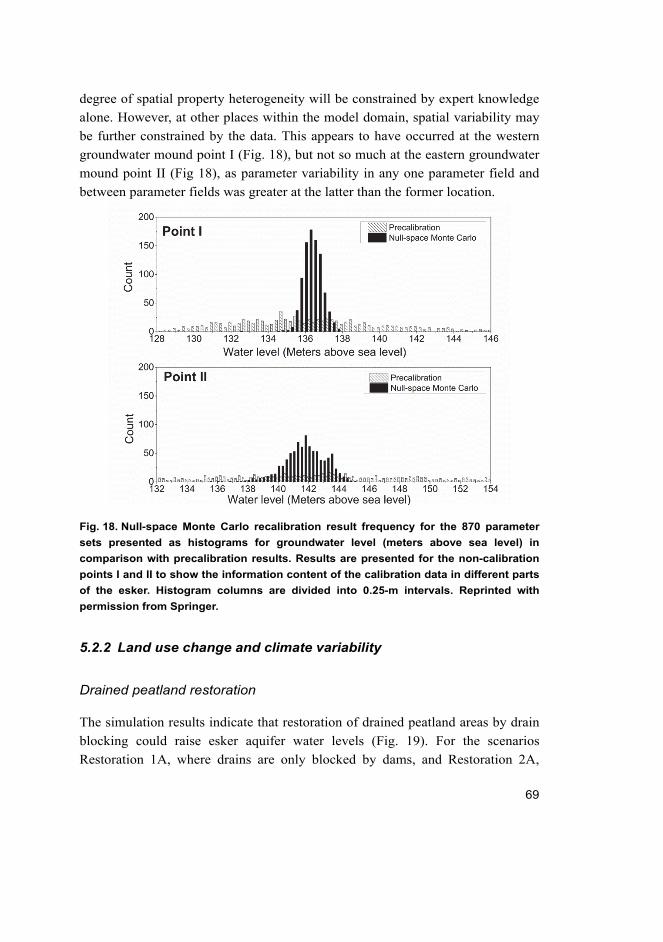
69
degree of spatial property heterogeneity will be constrained by expert knowledge
alone. However, at other places within the model domain, spatial variability may
be further constrained by the data. This appears to have occurred at the western
groundwater mound point I (Fig. 18), but not so much at the eastern groundwater
mound point II (Fig 18), as parameter variability in any one parameter field and
between parameter fields was greater at the latter than the former location.
Fig. 18. Null-space Monte Carlo recalibration result frequency for the 870 parameter
sets presented as histograms for groundwater level (meters above sea level) in
comparison with precalibration results. Results are presented for the non-calibration
points I and II to show the information content of the calibration data in different parts
of the esker. Histogram columns are divided into 0.25-m intervals. Reprinted with
permission from Springer.
5.2.2 Land use change and climate variability
Drained peatland restoration
The simulation results indicate that restoration of drained peatland areas by drain
blocking could raise esker aquifer water levels (Fig. 19). For the scenarios
Restoration 1A, where drains are only blocked by dams, and Restoration 2A,

70
where drains are filled, the rise in groundwater level was less than 1 m. The
different NSMC model runs showed small variations between the results. For the
Restoration 3A scenario, representing the situation where filling the drain would
restore the peatland to more natural hydraulic conditions, the water level rise
could be above 1 m. Because the drain conductance was not constrained by the
calibration dataset, the NSMC-generated parameter fields showed great
variability in conductance parameter values. The combination of parameter
variability and sensitivity resulted in a spread of the simulation results. This
shows the benefit of the NSMC method, with which the parameter uncertainty is
now propagated to the results. Even though the drainage parameters were not
informed by the calibration data, the analysis showed that the uncertainty of these
parameters did have an impact on predictions.
Scenarios including restoration of areas outside the current groundwater
protection zone (Restoration 1B, 2B, and 3B) did not change the groundwater
level dramatically. Based on the results, restoration would have more impact
within the current groundwater protection zone rather than on outside areas.

71
Fig. 19. Comparative box plots of the water level changes at points I and II in the
drained peatland restoration, groundwater abstraction, and climate scenarios.
Scenario outcomes were calculated with the 870 null-space Monte Carlo parameter
sets. Predictions are shown as a change (in meters) from the 2000–2010 water levels.
The box plots represent the median, 50% box, and 1–99% whiskers of the parameter
ensemble. Reprinted with permission from Springer.
Groundwater abstraction
Hypothetical water abstraction from Rokua (27 000 m3 d-1 to a city of 190 000
inhabitants) would lower the water level by 1–2 m, according to the median
values of the null-space Monte Carlo runs (Fig. 19, abstraction scenarios), but
drainage restoration would reduce the decline in water levels (Abstraction +

72
Restoration 3A scenarios). Based on this result, abstraction would have a larger
impact on water levels in the present conditions than if the peatland in the
discharge zone were in a more natural state.
Past and future dry climate seasons
Based on the groundwater model scenario runs, the water level variations and
periodic declines in the Rokua aquifer are highly dependent on climate conditions.
Conditions resembling those of the dry period 1970–1980 resulted in water levels
which were 2–3 m lower than in 2000–2010 conditions (Fig. 19, dry scenarios).
The combination of dry conditions and the Restoration 3A or 3B scenarios
resulted in higher water levels. Scenario runs for the estimated future dry period
indicated that future dry periods would be less dramatic than in former decades,
owing to the overall increase in precipitation and thereby recharge. Recurring dry
periods are important to consider if the combined effect of land use and climate
on minimum water levels is of interest in groundwater management.
5.2.3 Impact of model scenarios
From a management point of view, the main outcome of the modeling concept in
the study is the possibility to compare the effects of peatland drainage and
restoration with those of climate (historical and future) or water abstraction. This
is important information in order to answer the main management question of
whether there is a critical need for expensive peatland drain restoration. Based on
the models and considering the uncertainty analyses, peatland drainage does play
a role in the hydrology of the Rokua esker aquifer and drainage restoration might
affect the aquifer water levels, but the groundwater level seems to be more
dependent on climate conditions. In this northern esker area, the future climate
conditions might be more suitable for groundwater recharge (agreeing with e.g.,
Hiscock et al. 2011). This might mask the impacts of drainage on groundwater
levels in the long run.
The drain water level rise brought about by blocking the ditches by dams
decreased the hydraulic gradient between the ditch and the aquifer. However, as
seen from the simulation results (comparing the Restoration 1 and Restoration 3
scenarios), the aquifer water level was much more responsive to restoration
methods that would able to affect drain conductance. Even though blocking
ditches with dams can have an impact, e.g., on peatland and catchment hydrology

73
(Wilson et al. 2010) or the groundwater discharge amounts of an individual ditch
(Kupiainen 2010), it should not be expected to change the whole esker aquifer
water level. For example, in Finland, ditch blocking by dams is a common
peatland restoration method (Aapala et al. 2013), but it is important to
acknowledge that it should not be considered an aquifer restoration method, based
on the findings in this thesis.
The filling of ditches might have more promising results. However, as no
large-scale empirical data are available on how peatland restoration by filling the
ditches would change the hydraulic conditions in the peat, questions remain
regarding the best means of peatland restoration to reduce the “lumped” peat
hydraulic conductivity. Filling in ditches or blocking preferential channels and
seepage observed in the peat matrix, e.g., by bentonite injection, could reduce the
total hydraulic conductivity. For the Rokua area, which will possibly experience
less severe dry periods in the future, extensive drainage restoration by filling the
ditches in the whole groundwater protection zone could be regarded as an
overambitious and expensive measure relative to the benefits obtained.
Peatland drainage and drain restoration have not been included in esker
aquifer scale groundwater modeling in previous studies, which forced us to devise
novel conceptual thinking for the use of drainage boundaries. The identifiability
of the drain conductance parameter from the calibration data was limited, but the
NSMC method incorporated this uncertainty into the results. The flow through
peatland could have been modeled in more detail (Ballard et al. 2011), but it is
unlikely that the use of greater detail would have affected the conclusions
presented here. Meanwhile the relative simplicity of the model allowed a
comprehensive uncertainty analysis to be undertaken, so that all model
predictions could be accompanied by an estimate of their uncertainty. The
possibility of simulating peat as its own layer in the MODFLOW model was
considered. However this would have added to the computational difficulties, and
possibly instigated the appearance of cell drying/re-wetting. This, in turn, might
have compromised the analysis through contributing numerical noise to the
calculation of finite-difference derivatives of model outputs with respect to the
parameters which formed the basis of calibration and subsequent NSMC analysis.
A previous study on the legal implications of EU directives relating to
groundwater in Finland concluded that peatland drainage could be seen as a
quantitative use of groundwater, comparable to groundwater abstraction (Allan
2011). The modeling results presented in this thesis agree with this conclusion,
although the simulated effect in the Rokua esker was not as large as the modeled

74
extensive water abstraction. This finding emphasizes the necessity to have
groundwater protection areas surrounding the esker aquifer, and to conduct
thorough monitoring and issue permits (or bans in high discharge risk areas) for
drainage within groundwater protection zones. By testing the effects of expanding
the groundwater protection area and restoration area (Restoration B scenarios in
this thesis), administrators can make an informed decision on the extent of the
protection area. For example, in the case studied here, the benefits of protection
zone expansion would be minor. Additionally, for areas with current or future
groundwater abstraction, the model approach used in this thesis could be applied
to find out if peatland drain restoration by filling the ditches could be used to
compensate for the impacts of water abstraction.
The climate scenarios used in this study were admittedly simplified, as
climate conditions are highly dynamic and variable in time. The method
employed, i.e., the average dry period conditions run as steady state, could only
be used to estimate the dynamics and the climate dependence of the aquifer, as the
climate conditions deviated from average conditions for several years. This again
could be compared with the dependence of the aquifer on land use, as done in this
thesis. From a management point of view, the results of climate on water levels
are therefore indicative. However, because the outcomes of the analysis included
the uncertainties associated with important predictions of management interest,
they provide a more robust basis for decision-making.
The hypothetical groundwater abstraction and the comparison of the effects
of land use and climate were the key outcomes of the modeling work, enhancing
the ability of managers and stakeholders to understand and discuss different
management options. In the Rokua area, the approach eased the discussion on the
impact and role of forest drainage in hydrology with the local stakeholders.
Increasing the understanding and possible learning of stakeholders is emphasized
by different environmental management strategies (e.g., Reed et al. 2010,
Gregory et al. 2012) and it would be possible to link the modeling concept
presented in this thesis with these strategies in groundwater management issues.
For example, the preliminary model results for Rokua (Paper II) were used in the
MCDA method (Paper III).

75
5.3 Decision analysis framework (III)
5.3.1 Importance of the objectives
The interviewees were asked to consider the range of impacts of the alternatives
and the importance of the objectives/issues considered. As the results show (Fig.
20), there was agreement among stakeholders that the water level of the lakes and
the aquifer (more than 30% share of the total weight; median value) is the most
important criterion in the context of the Rokua area. Most of the interviewees
considered this criterion to be the basic unit when measuring the success of land
use management.
Fig. 20. Importance weights given by the stakeholders interviewed to the criteria in the
Rokua groundwater case (min, median, 75th percentile, max).
The ecological status of lakes and springs received more than a 20% share of the
total weight (median value, Fig. 21), but there was much more disagreement
(range between min/max and 75th percentile) about how important this criterion
is and about the impact that the proposed alternatives might cause. The
recreational value of second homes was considered an important objective, but
the impacts (measured by change in monetary value per second house) were rated

76
low by the participating stakeholders. Therefore, the overall importance of this
criterion (median value of weights) was set as being smaller than that of lake
water level, ecological status, and tourism attractiveness.
Tourism attractiveness was seen as a significant issue for the Rokua area and
its surrounding municipalities. However, some interviewees rated the marketing
and development of new tourism services as more decisive for the attractiveness
of the area than the state of the water bodies or lake water levels. The importance
of forestry to the local economy was generally recognized among the
interviewees, but the impact of the alternatives on forestry income was considered
peripheral. Here the forestry representatives disagreed, emphasizing (more than
others) the indirect income and monetary flows to the regional and national
economy. Peat production was considered to be the least important criterion.
There are two reasons for this: i) risk analysis and hydrological studies showed
that the role of peat production harvesting in the water level decline in the Rokua
esker area was minimal, and ii) during the MCDA process, the representative
from the peat company announced that peat harvesting in the area would end by
2018.
5.3.2 Desirability of the alternatives
The interview results (Fig. 21) indicated that all stakeholder groups are willing to
accept that some measures should be promoted in the esker area in order to
improve the hydrological and ecological conditions. The ranking of the
alternatives showed that active restoration (Alternative C) was the preferred
option for all interviewees. However, the difference in preferences for alternatives
was not as substantial among the stakeholders stressing the significance of
forestry (left side of Fig. 21) as it was among the stakeholders mainly
emphasizing the ecological and hydrological issues (right side of Fig. 21), who
clearly preferred Alternative B over A, and C over B.

77
Fig. 21. Overall values of Alternatives A-C for each stakeholder interviewed.
5.3.3 Viewpoints of different stakeholders
Although there was some agreement regarding the preferences among the
stakeholders, a detailed analysis of the stakeholders’ interviews and weighting
profiles revealed that there was disagreement concerning the effects of the
different alternatives and the importance of the criteria. Three different
viewpoints of stakeholders were elicited from the analysis: forestry,
administrative, and the local economy.
The forestry viewpoint was mainly concerned about the adverse economic
impacts on forestry (Fig. 22). This can be seen from the high value given to the
business-as-usual alternative (Alternative A), where negative impacts on forest
income can be avoided. The proponents of this viewpoint also emphasized the
indirect impacts of forestry on the local, regional, and even national economy.
The business-as-usual position, from this point of view, was preferred over
Alternative B, which may cause income losses due to forestry restrictions on new
areas. In addition, the uncertainty about impacts on the groundwater level was

78
much greater for Alternative B than C. Alternative C was also considered to be a
more flexible management solution for forestry practitioners.
Fig. 22. Overall values of the forestry, local economy, and administrative perspectives.
Both the local economy and the administrative viewpoints (Fig. 22) emphasized
more ecological and hydrological objectives. According to the local economy
viewpoint, the water levels and the ecological status of existing water bodies
should be kept in good condition, since tourism is the most important source of
local income, jobs, and tax revenues. The attractiveness of the area (weighted as
the most important criteria) also depends on the ecosystem services provided by
the specific types of local esker ecosystems. Forestry was regarded as a locally
important source of income and livelihood too, but the income loss caused by the
proposed alternatives was regarded as tolerable if some compensation can be
negotiated. The local economy viewpoint adopted the broadest perspective on
sustainable development: ecological ‘health’ and ecosystem services were
considered the major sources of human well-being, while keeping in mind the

79
parallel economic effectiveness and social acceptance of the proposed policy
actions.
The administrative perspective (Fig. 22) placed more emphasis on the
ecological and hydrological criteria than the other two points of view. The overall
value of Alternative B was rated higher among the representatives of this group
than the other groups. The administrators believed that positive impacts on the
groundwater level and the ecological status of lakes and springs can also be
achieved by expanding the boundaries of the groundwater protection area. This
assessment was based on the guideline stating that in the groundwater area, every
proposed land use activity should be obliged to apply for a license from the
regional environmental or forestry administration. In that way, forestry practices
(especially ditches) can be banned in critical groundwater discharge areas.
5.3.4 Evaluation of the approach
At the closing workshop, the members of the participating stakeholder groups
were asked to evaluate both the suitability of the approach applied for this case
and the practical implementation of the process, including their understanding of
the process and the results. In general, the stakeholders were quite satisfied with
the application of the MCDA approach. The mean grade awarded in the overall
evaluation of the success of the approach was 8.3 (on a scale from 4 to 10). The
approach was considered most suitable for the identification and structuring of the
central issues of the problem, for increasing understanding among the different
stakeholder groups, and for the collection of information (Fig. 23). In the meeting
discussions, the stakeholders appreciated the method’s ability to collect
information from different sources, while at the same time revealing differing
views on the importance of different land use practices and the overall objectives
of the stakeholders. There was agreement that this was the most significant
benefit of the MCDA method.

80
Fig. 23. Results of the feedback questionnaire among the participants of the MCDA
process.
All participating stakeholders considered the MCDA process necessary as a
starting point and as a basis for further negotiation about the land use in the area.
Most of the stakeholder representatives also considered the MCDA process highly
useful for Rokua’s land use planning (Fig. 23). In their feedback evaluations,
most of the interviewees considered personal learning to have occurred during the
process. To the analysts, it was obvious that the participating stakeholders had
learned more about Rokua’s groundwater system itself, about how land use and
climate change might affect the system, and about the different stakeholders’
preferences. Computer-aided interviews helped the participants see how their

81
preferences affected the desirability and ranking of the alternatives. Nevertheless,
the participants considered weighting to be a challenging task.
The MCDA process having ended, learning success was now evident and
many results (facts, issues, viewpoints) uncovered during the process will be
usable in decision making in the Rokua area. Nevertheless, important gaps still
exist, for example the hydrological modeling was still at a preliminary stage.
5.3.5 Findings from the decision analysis process
The MCDA process in the Rokua case was successful in finding a way towards
sustainable land use in the esker aquifer area in three major respects.
First, it opened up a discussion about possible land use management options
in a conflicting situation with a considerable amount of mistrust between the
different stakeholders. Stakeholder meetings, as well as structured and transparent
methods of analysis, enabled the discussion and consideration of other points of
view, and especially reflection on the participants’ own preferences in this context.
The participants’ understanding and preferences evolved during the process as
they assessed their previous knowledge about new scientific and socio-economic
information and reflected on their preferences in the context of new knowledge
and specific options. When the participants had an opportunity to view their
attribute weights and the effects of these on the desirability of the alternatives,
this interactive and iterative approach improved the participants’ trust in the
method and promoted the transparency of the whole process – as has been
observed in earlier DAI studies (Marttunen & Hämäläinen 2008). At the
beginning of the process, the stakeholders’ comments and arguments in defense of
their prior point of view and the interests of their stakeholder group were
observed to be more rigid than at later stakeholder meetings.
Second, the analysis revealed that the stakeholders actually agreed on many
crucial issues. The most important issue is that some active measures be
implemented in the esker area in order to prevent a possible further decline in
groundwater levels. The analysis was effective in opening a dialogue and
negotiations. However, the stakeholders still disagreed with each other about the
measures and the effects of the alternatives. A critical issue for the social
acceptance of the management option in the Rokua case is the nature of measures
conducted (restoration efforts and/or expansion of groundwater area), where they
are implemented, and the compensation tools (monetary, land exchange, or

82
something else) available for forest owners who will lose part of their income if
the forest area they own is groundwater-protected and/or restored.
Third, the MCDA process informed decision-makers about the possible
alternatives in land use management in the Rokua esker area. This MCDA work
can be seen as a first step in the process of building up a sustainable land use plan.
It opened the way for a new process by showing an overall picture of the problem
and decision contexts, as well as the different views of the stakeholders
(agreements and disagreements), and identified the critical issues (e.g., new
research needed) in furthering the process.
The common purpose of MCDA methods is to evaluate and choose among
alternatives, based on multiple criteria using systematic analysis that overcomes
the limitations of unstructured individual or group decision making. However, in
many planning processes the ranking of the alternatives may be less important
than other process outputs, such as the identification of knowledge gaps,
improved and shared understanding about the situation, and revelations on the
diversity of different views. The modeling results (Paper II) changed the
estimation of water levels in future. For example, climate change might mask part
of the water level decline or the uncertainty of expensive restoration, in which
case the alternatives studied in the MCDA would need to be re-estimated. Still,
while the MCDA process may not lead to a specific action plan, it can provide a
basis for better cooperation.

83
6 Conclusions and future recommendations
This thesis combined hydrological and socio-economic research in a case study of
the Rokua esker aquifer to update the concepts of groundwater management. The
research concentrated on forestry drainage of peatlands in the esker surroundings
and on the effects on aquifer water levels. This combined approach can also be
applied to other conflicts concerning groundwater and groundwater-dependent
ecosystems.
Objective of the first paper was to determine how groundwater discharges
from an esker aquifer and interacts with a drained peatland. In the second paper
groundwater modeling was used as a tool to study management options for esker
aquifers and related land uses. Third paper analyzed the potential of interactive
multicriteria decision analysis for facilitating stakeholder involvement and
learning in groundwater management.
According to the results obtained for the Rokua area, forestry ditches within
groundwater discharge areas can change the groundwater discharge patterns and
therefore could have an impact on aquifer groundwater level and dependent
ecosystems such as kettle lakes. Groundwater can discharge into a forestry ditch
either by seepage, if the ditch has been dug through the peat layer, or by
preferential flow through the peat matrix in areas where the peat layer is thicker
than the depth of the ditch. This is important information for groundwater
protection planning, as low hydraulic conductivity of the peat matrix does not
necessarily prevent contact between peatland ditches and the underlying aquifer.
Modeling of the esker aquifer-peatland system clarified the groundwater
management options. Climate and land use can have a significant impact on the
esker groundwater and related ecosystems such as groundwater-dependent lakes.
Peatland drainage in the esker surroundings can have similar impacts to
groundwater abstraction and droughts. Thus forestry drainage should be properly
accounted for in groundwater management and conservation of Finnish esker
aquifers. Based on model simulations, drainage restoration by filling ditches
could restore the aquifer groundwater as long as it decreases the hydraulic
conductivity of the ditch bed by blocking preferential flows and seepage.
Restoring the ditches by simply using dams to lower the hydraulic gradient
between aquifer and ditches does not appear to be an effective method to
influence aquifer conditions.
The Rokua area could experience less severe dry periods in the future. Under
these conditions, extensive drainage restoration by filling in ditches in the entire

84
groundwater protection zone appears to be too ambitious, uncertain, and
expensive a measure relative to the potential benefits. A smaller, subcatchment-
scale pilot test of ditch filling would increase knowledge on the effectiveness of
this peatland restoration method. Additionally, it would be interesting to apply the
groundwater modeling approach used for Rokua (recharge area 92 km2) to a
smaller aquifer, with e.g. recharge area less than 5 km2, as the impacts of peatland
ditches for a smaller aquifer might differ with scale. The used modelling approach
should be appropriately versatile for different scales and situations.
If new drainage or reopening of ditches is planned in a peatland area where a
risk of groundwater discharge can be expected, for example in the close vicinity
of a groundwater protection area, a simple piezometer measurement could be
conducted beforehand to define the hydrological conditions. A piezometer with a
screen beneath the peat (Fig. 24) could measure the pressure level in the aquifer.
If the pressure level is above the planned ditch level, there is an immediate risk of
groundwater discharge.
Fig. 24. Concept of piezometer measurement for defining the risk of groundwater
discharge to a planned new ditch or reopening of an old ditch. A) Groundwater
pressure below peat higher than planned peat bottom; risk for groundwater discharge.
B) pressure level lower than planned peat bottom; ditch probably does not cause
groundwater discharge.
The decision analysis framework used in this thesis revealed positive impacts of
participatory analysis in supporting groundwater management. Although the
hydrological study results were still preliminary during the Rokua case MCDA,
the method had immediate impacts. It opened the conflicting situation between
stakeholders in the Rokua groundwater area and started a discussion on a
sustainable and acceptable land use plan for the area. Based on the feedback from
the analysis, the main advantage of the process was the learning of the

85
participants. Groundwater issues can be fairly abstract. This is the case especially
in the Rokua study where the ditch-aquifer interaction can be difficult to
understand. The MCDA process helped with this learning process and therefore
eased the discussion on the Rokua land use plan as the stakeholders came to
understand the subject. When the hydrological modeling results of the Rokua
study were made available (Paper II), the discussion on how the groundwater
management plan should be updated was fairly calm. This was probably due to
the conflicting situation being already dealt with and the discussion already
opened. This emphasizes the importance of using participatory analyses from the
start of management projects.
The Rokua case study showed why these participatory methods should be
introduced as a more regular part of groundwater management. For example,
these methods could easily be integrated as part of water abstraction planning for
cities. Participatory analysis improves learning and interactive discussion
whereby all sides are heard and viewpoints taken into account. As stakeholders
and administrators learn to understand the issue at hand, the results of
hydrological studies, and each other’s viewpoints, the risk of management issues
culminating in mistrust or even litigation can be reduced or avoided.

86

87
References
Aapala K, Similä M & Penttinen J (eds) (2013) Handbook for the restoration of drained peatlands (in Finnish).
Aartolahti T (1973) Morphology, vegetation and developement of Rokuanvaara, an esker and dune complex in Finland. Societas Geographica Fenniae 127: 53.
Ala-aho P, Rossi PM & Kløve B (2013) Interaction of esker groundwater with headwater lakes and streams. J Hydrol 500(0): 144–156.
Allan A (2011) Implementing the Water Framework and Groundwater Directives in Finland. The Journal of Water Law 22(5): 185–196.
Allen RG, Pereira SL, Raes D & Smith M (1998) Crop Evapotranspiration – Guidelines for Computing Crop Water Requirements FAO Irrigation and Drainage Paper 56. Rome, FAO.
Almasri MN & Kaluarachchi JJ (2005) Multi-criteria decision analysis for the optimal management of nitrate contamination of aquifers. J Environ Manage 74(4): 365–381.
Anibas C, Buis K, Verhoeven R, Meire P & Batelaan O (2011) A simple thermal mapping method for seasonal spatial patterns of groundwater–surface water interaction. J Hydrol 397(1–2): 93–104.
Armstrong A, Holden J, Kay P, Foulger M, Gledhill S, McDonald AT & Walker A (2009) Drain-blocking techniques on blanket peat: A framework for best practice. J Environ Manage 90(11): 3512–3519.
Artimo A, Mäkinen J, Berg RC, Abert CC & Salonen V (2003) Three-dimensional geologic modeling and visualization of the Virttaankangas aquifer, southwestern Finland. Hydrogeol J 11(3): 378–386.
Artimo A, Saraperä S & Ylander I (2008) Methods for Integrating an Extensive Geodatabase with 3D Modeling and Data Management Tools for the Virttaankangas Artificial Recharge Project, Southwestern Finland. Water Resour Manage 22(12): 1723–1739.
Aster RC, Thurber CH & Borcher B (2005) Parameter Estimation and Inverse Problems. Waltham, MA, Academic Press.
Backnäs S, Pasanen A, Solismaa L, Karlsson T, Kauppila P, Hendriksson N, Lerssi J & Kauppila T (2013) Groundwater flowpaths and contaminant geochemistry at Luikonlahti mine (abstract). Res Terrae, Ser A, No 34 : 3–4.
Ballard CE, McIntyre N, Wheater HS, Holden J & Wallage ZE (2011) Hydrological modelling of drained blanket peatland. Journal of Hydrology 407(1–4): 81–93.
Banerjee I & McDonald BC (1975) Nature of esker sedimentation. In: Jopling AV & McDonald BC (eds) Society of Economic Paleontologists ans Mineralogists, Special Publication 24: 304–320.
Beckwith CW & Baird AJ (2001) Effect of biogenic gas bubbles on water flow through poorly decomposed blanket peat. Water Resour Res 37(3): 551–558.
Belton V & Stewart TJ (2002) Multiple Criteria Decision analysis - An Integrated approach. Norwell, Massachusetts, USA, Kluwer Academic publisher.

88
Bertrand G, Siergieiev D, Ala-aho P, Rossi PM (2013) Environmental tracers and indicators bringing together groundwater, surface water and groundwater-dependent ecosystems: importance of scale in choosing relevant tools. Environmental Earth Sciences: DOI 10.1007/s12665-013-3005-8
Beven K & Binley A (1992) The future of distributed models: Model calibration and uncertainty prediction. Hydrol Process 6(3): 279–298.
Binley A & Beven K (2003) Vadose Zone Flow Model Uncertainty as Conditioned on Geophysical Data. Ground Water 41(2): 119–127.
Blazkova S & Beven K (2004) Flood frequency estimation by continuous simulation of subcatchment rainfalls and discharges with the aim of improving dam safety assessment in a large basin in the Czech Republic. J Hydrol 292(1–4): 153–172.
Bredehoeft J (2005) The conceptualization model problem - surprise. Hydrogeol J 13(1): 37–46.
Britschgi R, Antikainen M, Ekholm-Peltonen M, Hyvärinen V, Nylander E, Siiro P & Suomela T (2009) Pohjavesien kartoitus ja luokitus. In summary: Mapping and classification of groundwater areas. Sastamala, Finnish Environment Insitute.
Brown K, Adger WN, Tompkins E, Bacon P, Shim D & Young K (2001) Trade-off analysis for marine protected area management. Ecol Econ 37(3): 417–434.
Dahl M, Nilsson B, Langhoff JH & Refsgaard JC (2007) Review of classification systems and new multi-scale typology of groundwater–surface water interaction. J Hydrol 344(1–2): 1–16.
Darcy H (1856) Les Fontaines Publiques de la Ville de Dijon. Paris, Dalmont. Davis SN (1969) Porosity and Permeability of Natural Materials. In: De Wiest RJM (ed)
Flow Through Porous Media. New York, Academic Press: 53–89. de Marsily G, Lavedan C, Boucher M & Fasanino G (1984) Interpretation of Interference
Tests in a Well Field using Geostatistical Techniques to Fit the Permeability Distribution in a Reservoir Mode. In: Verly G, David M, Journel AG & Marechal A (eds) Geostatistics for Natural Resources Characterization. Massachusetts, D. Reidel Pub. Co.: 831–849.
Doherty J (2003) Ground Water Model Calibration Using Pilot Points and Regularization. Ground Water 41(2): 170–177.
Doherty J (2013) PEST: Model-independent parameter estimation, user manual. Watermark Numerical Computing.
Doherty J & Hunt RJ (2009) Two statistics for evaluating parameter identifiability and error reduction. J Hydrol 366(1–4): 119–127.
Doherty J & Welter D (2010) A short exploration of structural noise. Water Resour Res 46(5): W05525.
Eskelinen R (2011) Development and utilization of GIS based groundwater discharge prediction method. Master's thesis (Tech.). University of Oulu.
European Commission (2000) Directive 2000/60/EC establishing a framework for community action in the field of water policy.
European Commission (2006) Directive 2006/118/EC on the Protection of Groundwater against Pollution and Deterioration.

89
European Commission (2008) Groundwater Protection in Europe. 35 pp. Freeze RA & Cherry JA (1979) Groundwater. Michigan, Prentice-Hall. Geostudio (2007) Geostudio program. Geo-slope international ltd. Gilman K & Newson M (1980) Soil pipes and pipeflow - a hydrological study in upland
Wales. British Geological Research Group, Research Monograph Ser 1. Gregory R, Failing L, Harstone M, Long G, McDaniels T & Ohlson D (2012) Structured
Decision Making: A Practical Guide to Environmental Management Choices. Chichester, John Wiley & Sons Ltd.
Häikiö J (2008) The Peatlands and peat reserves of Vaala Part 1 (in Finnish). Geological Survey of Finland, Report of Peat Investigation 383.
Hebrand M & Åmark M (1989) Esker formation and glacier dynamics in eastern Skane and adjacent areas, southern Sweden. Boreas 18(1): 67–81.
Hiscock K, Sparkes R & Hodgson A (2011) Evaluation of future climate change impacts on European groundwater resources. In: Treidel H, Martin-Bordes JL & Gurdak JJ (eds) Climate Change Effects of Groundwater Resources: A Global Synthesis of Findings and Recommendations. London, CRC Press: 351–365.
Holden J (2005) Piping and woody plants in peatlands: Cause or effect? Water Resour Res 41: W06009.
Holden J & Burt TP (2002) Piping and pipeflow in a deep peat catchment. Catena 48(3): 163–199.
Hooper R & Shoemaker C (1986) A comparison of chemical and isotopic hydrograph separation. Water Resour Res 22(10): 1444–1454.
Hsiesh P (2001) Topodrive and Particle flow - Two computer models for simulation and visualization of groundwater flow and transport of fluid particles in two dimensions. USGS Open file report 01–286.
Huang IB, Keisler J & Linkov I (2011) Multi-criteria decision analysis in environmental sciences: Ten years of applications and trends. Sci Total Environ 409(19): 3578–3594.
Hvorslev MJ (1951) Time lag and soil permeability in ground-water observations. Waterways Experiment Station, Corps of Engineers no 36.
Iorgulescu I, Beven KJ & Musy A (2005) Data-based modelling of runoff and chemical tracer concentrations in the Haute-Mentue research catchment (Switzerland). Hydrol Process 19(13): 2557–2573.
IPCC (2007) Climate Change 2007: The Physical Science Basis. Contribution of Working Group I to the Fourth Assessment Report of the Intergovernmental Panel on Climate Change (Solomon, SD, Qin M, Manning Z, Chen M, Marquis KB, Averyt M, Tignor & Miller HL (Eds). Cambridge, Cambridge University Press.
James SC, Doherty JE & Eddebbarh A (2009) Practical Postcalibration Uncertainty Analysis: Yucca Mountain, Nevada. Ground Water 47(6): 851–869.
Jansson P & Karlberg L (2004) Coupled heat and mass transfer model for soil-plant-atmosphere systems. Stockholm, Royal Institute of Technolgy, Dept of Civl and Environmental Engineering.
Johansen OM, Pedersen ML & Jensen JB (2011) Effect of groundwater abstraction on fen ecosystems. J Hydrol 402(3–4): 357–366.

90
Jurvakainen A (2007) Developing tourism from a sustainable developement viewpoint: Regional environmental management system of Rokua (in Finnish). Licentiate Thesis. University of Oulu.
Jyrkama MI, Sykes JF & Normani SD (2002) Recharge Estimation for Transient Ground Water Modeling. Ground Water 40(6): 638–648.
Kangas A, Kangas J & Kurttila M (2008) Decision support for forest management, Managing Forest Ecosystems, Vol. 16. Springer.
Kangas J, Kangas A, Leskinen P & Pykäläinen J (2001) MCDM methods in strategic planning of forestry on state-owned lands in Finland: applications and experiences. Journal of Multi-Criteria Decision Analysis 10(5): 257–271.
Katko TS, Lipponen MA & Rönkä EKT (2006) Groundwater use and policy in community water supply in Finland. Hydrogeol J 14(1–2): 69–78.
Keefer DL, Kirkwood CW & Corner JL (2004) Perspective on decision analysis applications, 1990–2001 (and comments by Cantor, S.B. and Hamalainen, R.P.). Decision analysis 1(1): 4–34.
Keeney RL & Raiffa H (1976) Decisions with multiple objectives: Preferences and value tradeoffs. New York, John Wiley & Sons.
Keto A, Torsner M, Muotka J & Laitinen L (2005) Vedenkorkeuden vaihtelun vaikutukset Saimaan virkistyskäyttöön ja veneilyyn, The effects of changes of the water level on recreation and boating at Lake Saimaa. The Finnish Environment 808.
Kidmose J, Dahl M, Engesgaard P, Nilsson B, Christensen BSB, Andersen S & Hoffmann CC (2010) Experimental and numerical study of the relation between flow paths and fate of a pesticide in a riparian wetland. J Hydrol 386(1–4): 67–79.
Kløve B, Ala-aho P, Okkonen J & Rossi PM (2011a) Possible effects of climate change on hydrogeological systems: results from research on esker aquifers in Northern Finland. In: Treidel H, Bordes JLM & Gurdak J (eds) Climate Change Effects of Groundwater Resources: A Global Synthesis of Findings and Recommendations (IAH - International Contributions to hydrogeology). London, CRC Press.
Kløve B, Ala-aho P, Bertrand G, Boukalova Z, Ertürk A, Goldscheider N, Ilmonen J, Karakaya N, Kupfersberger H, Kvœrner J, Lundberg A, Mileusnić M, Moszczynska A, Muotka T, Preda E, Rossi P, Siergieiev D, Šimek J, Wachniew P, Angheluta V & Widerlund A (2011b) Groundwater dependent ecosystems. Part I: Hydroecological status and trends. Environ Sci & Policy 14(7): 770–781.
Kløve B, Allan A, Bertrand G, Druzynska E, Ertürk A, Goldscheider N, Henry S, Karakaya N, Karjalainen TP, Koundouri P, Kupfersberger H, Kvœrner J, Lundberg A, Muotka T, Preda E, Pulido-Velazquez M & Schipper P (2011c) Groundwater dependent ecosystems. Part II. Ecosystem services and management in Europe under risk of climate change and land use intensification. Environ Sci & Policy 14(7): 782–793.
Koivusalo H, Ahti E, Laurén A, Kokkonen T, Karvonen T, Nevalainen R & Finér L (2008) Impacts of ditch cleaning on hydrological processes in a drained peatland forest. Hydrology and Earth System Sciences 12: 1211–1227.

91
Koundouri P, Kougea E, Stithou M, Ala-aho P, Eskelinen R, Karjalainen TP, Klove B, Pulido-Velazquez M, Reinikainen K & Rossi PM (2012) The value of scientific information on climate change: a choice experiment on Rokua esker, Finland. Journal of Environmental Economics and Policy 1(1): 85–102.
Kupiainen V (2010) Groundwater discharge to forest ditches at Rokua esker area and restoration by ditch dams (in Finnish). Master's Thesis (Tech.). University Of Oulu.
Langhoff JH, Rasmussen KR & Christensen S (2006) Quantification and regionalization of groundwater–surface water interaction along an alluvial stream. J Hydrol 320(3–4): 342–358.
Lemmelä R (1990) Water balance of sandy aquifer at Hyrylä in southern Finland. University of Turku.
Lemmelä R & Tattari S (1988) Application of transfer function and conceptual pulse models to the study of groundwater level fluctuations. Geophysica 24: 33–46.
Lowry CS, Fratta D & Anderson MP (2009) Ground penetrating radar and spring formation in a groundwater dominated peat wetland. J Hydrol 373(1–2): 68–79.
Mälkki E (1999) Pohjavesi ja pohjaveden ympäristö. Tampere, Tammer-paino Oy. Marin CM, Medina Jr. MA & Butcher JB (1989) Monte Carlo analysis and Bayesian
decision theory for assessing the effects of waste sites on groundwater, I: Theory. J Contam Hydrol 5(1): 1–13.
Marttunen M (2011) Interactive Multi-Criteria Decision Analysis in the Collaborative Management of Watercourses. Doctoral Thesis. Helsinki, Aalto University.
Marttunen M & Hämäläinen R (2008) The Decision Analysis Interview Approach in the Collaborative Management of a Large Regulated Water Course. Environmental Management 42(6): 1026–1042.
Marttunen M & Suomalainen M (2005) Participatory and multiobjective development of watercourse regulation: creation of regulation alternatives from stakeholders' preferences. Journal of Multi-Criteria Decision Analysis 13(1): 29–49.
McDonald MG & Harbaugh AW (eds) (1984) A modular three-dimensional finite-difference ground-water flow model.
McPhee J & Yeh W (2004) Multiobjective Optimization for Sustainable Groundwater Management in Semiarid Regions. J Water Resour Plann Manage 130(6): 490–497.
Moore C & Doherty J (2005) Role of the calibration process in reducing model predictive error. Water Resour Res 41(5): W05020.
Moore C & Doherty J (2006) The cost of uniqueness in groundwater model calibration. Adv Water Resour 29(4): 605–623.
Mustajoki J & Hämäläinen RP (2000) Web-HIPRE: Global decision support by value tree and AHP analysis. INFOR 38(3): 208–220.
Mustajoki J, Saarikoski H, Marttunen M, Ahtikoski A, Hallikainen V, Helle T, Hyppönen M, Jokinen M, Naskali A, Tuulentie S, Varmola M, Vatanen E & Ylisirniö A (2011) Use of decision analysis interviews to support the sustainable use of the forests in Finnish Upper Lapland. J Environ Manage 92(6): 1550–1563.
Mustonen S (1986) Applied hydrology (in Finnish). Mänttä, Vesiyhdistys.

92
Nakićenović, N., Swart, R. (Eds) (2000) Special report on emissions scenarios. In: A Special Report of Working Group III of the Intergovernmental Panel on Climate Change. Cambridge, Cambridge University Press.
Narasimhan TM (2009) Groundwater: from mystery to management. Environmental Research Letters 4(3): 035002.
Okkonen J & Kløve B (2010) A conceptual and statistical approach for the analysis of climate impact on ground water table fluctuation patterns in cold conditions. Journal of Hydrology 388(1–2): 1–12.
Okkonen J & Kløve B (2011) A sequential modelling approach to assess groundwater–surface water resources in a snow dominated region of Finland. J Hydrol 411(1–2): 91–107.
Ours DP, Siegel DI & H. Glaser P (1997) Chemical dilation and the dual porosity of humified bog peat. J Hydrol 196(1–4): 348–360.
Pahl-Wostl C, Holtz G, Kastens B & Knieper C (2010) Analyzing complex water governance regimes: the Management and Transition Framework. Environ Sci & Policy 13(7): 571–581.
Päivänen J (1973) Hydraulic conductivity and water retention in peat soils. Acta Forestalia Fennica 129.
Pajunen H (1990) Mires and peat reserves of Utajärvi, part V (in Finnish). Geological Survey of Finland, Report of Peat Investigation 241.
Pajunen H (1993) Mires and peat reserves of Utajärvi, part VI (in Finnish). Geological Survey of Finland, Report of Peat Investigation 269.
Pajunen H (1995) Holocene accumulation of peat in the area of an esker and dune complex, Rokuanvaara, Central Finland. Geological Survey of Finland, Special paper 20 : 125–133.
Pajunen H (2009) Mires and peat reserves of Muhos, Central Finland, part 4 (in Finnish). Geological Survey of Finland, Report of Peat Investigation 397.
Price JS (1992) Blanket bog in Newfoundland. Part 2. Hydrological processes. J Hydrol 135: 103–119.
Pykäläinen J, Kangas J & Loikkanen T (1999) Interactive decision analysis in participatory strategic forest planning: Experiences from state owned boreal. Journal of Forest Economics 5(3): 341–364.
Qureshi ME & Harrison SR (2001) A decision support process to compare Riparian revegetation options in Scheu Creek catchment in North Queensland. J Environ Manage 62(1): 101–112.
Reed MS, Evely AC, Cundill G, Fazey I, Glass JH, Laing A, Newig J, Parrish B, Prell C, Raymond C & Stringer LC (2010) What is social learning? Ecology and Society 15(4): r1.
Refsgaard JC, Christensen S, Sonnenborg TO, Seifert D, Højberg AL & Troldborg L (2012) Review of strategies for handling geological uncertainty in groundwater flow and transport modeling. Adv Water Resour 36(0): 36–50.

93
Regan H, Davis F, Andelman S, Widyanata A & Freese M (2007) Comprehensive criteria for biodiversity evaluation in conservation planning. Biodivers Conserv 16(9): 2715–2728.
Renn O (2006) Participatory processes for designing environmental policies. Land Use Policy 23(1): 34–43.
Rintala R (2006) Maa-ainesten ottomäärät ja ottamislupatilanne 2004 -maa-aineslain mukaiset ottoalueet. In summary: Extractable land resource volumes and permits 2004 - extraction areas under the Land Extraction Act. Finnish Environment Institute.
Ronkanen A- & Kløve B (2005) Hydraulic soil properties of peatlands treating municipal wastewater and peat harvesting runoff. Suo 56(2): 43–56.
Schlotzhauer SM & Price JS (1999) Soil water flow dynamics in a managed cutover peat field, Quebec: field and labotary investigations. Water Resour Res 35(12): 3675–3683.
Seifert D, Sonnenborg T, Scharling P & Hinsby K (2008) Use of alternative conceptual models to assess the impact of a buried valley on groundwater vulnerability. Hydrogeol J 16(4): 659–674.
Silva VS, Morais D & Almeida A (2010) A Multicriteria Group Decision Model to Support Watershed Committees in Brazil. Water Resour Manage 24(14): 4075–4091.
Sparrevik M, Barton DN, Oen AM, Sehkar NU & Linkov I (2011) Use of multicriteria involvement processes to enhance transparency and stakeholder participation at Bergen Harbor, Norway. Integrated Environmental Assessment and Management 7(3): 414–425.
Straton A, Jackson S, Marinoni O, Proctor W & Woodward E (2011) Exploring and Evaluating Scenarios for a River Catchment in Northern Australia Using Scenario Development, Multi-criteria Analysis and a Deliberative Process as a Tool for Water Planning. Water Resour Manage 25(1): 141–164.
Tikhonov AN & Arsenin VY (1977) Solutions of Ill-Posed Problems. New York, Wiley. Tonkin MJ & Doherty J (2005) A hybrid regularized inversion methodology for highly
parameterized environmental models. Water Resour Res 41(10):W10412. Tonkin M & Doherty J (2009) Calibration-constrained Monte Carlo analysis of highly
parameterized models using subspace techniques. Water Resour Res 45(12): W00B10. Turnhout E, Hisschemöller M & Eijsackers H (2008) Science in Wadden Sea policy: from
accommodation to advocacy. Environ Sci & Policy 11(3): 227–239. Wallage ZE, Holden J & McDonald AT (2006) Drain blocking: An effective treatment for
reducing dissolved organic carbon loss and water discolouration in a drained peatland. Sci Total Environ 367(2–3): 811–821.
van Loon AH, Schot PP, Griffioen J, Bierkens MFP, Batelaan O & Wassen MJ (2009a) Throughflow as a determining factor for habitat contiguity in a near-natural fen. J Hydrol 379(1–2): 30–40.
van Loon AH, Schot PP, Griffioen J, Bierkens MFP & Wassen MJ (2009b) Palaeo-hydrological reconstruction of a managed fen area in The Netherlands. J Hydrol 378(3–4): 205–217.
von Winterfeldt D & Edwards W (1986) Decision Analysis and Behavioral Research. Cambridge, Cambridge University Press.

94
Wada Y, van Beek LPH, van Kempen CM, Reckman JWTM, Vasak S & Bierkens MFP (2010) Global depletion of groundwater resources. Geophys Res Lett 37(20): L20402.
Water Resources Management Act (2004) No. 1299/2004. Wels C, Cornett RJ & Lazerte BD (1991) Hydrograph separation: A comparison of
geochemical and isotopic tracers. J Hydrol 122(1–4): 253–274. Willis R & Liu P (1984) Optimization Model for Ground‐Water Planning. J Water
Resour Plann Manage 110(3): 333–347. Wilson L, Wilson J, Holden J, Johnstone I, Armstrong A & Morris M (2010) Recovery of
water tables in Welsh blanket bog after drain blocking: Discharge rates, time scales and the influence of local conditions. Journal of Hydrology 391(3–4): 377–386.
Wilson L, Wilson J, Holden J, Johnstone I, Armstrong A & Morris M (2011) Ditch blocking, water chemistry and organic carbon flux: Evidence that blanket bog restoration reduces erosion and fluvial carbon loss. Sci Total Environ 409(11): 2010–2018.
Yang YS, Kalin RM, Zhang Y, Lin X & Zou L (2001) Multi-objective optimization for sustainable groundwater resource management in a semiarid catchment. Hydrological Sciences Journal 46(1): 55–72.
Zaitsoff O (1984) Groundwater balance in the Oripää esker. National Board of Waters, Finland, Helsinki, Publications of the Water Research Institute No. 59.

95
Original publications
I Rossi PM, Ala-aho P, Ronkanen A-K & Kløve B (2012) Groundwater-surface water interaction between an esker aquifer and a drained fen. Journal of Hydrology 432–433 (2012): 52–60.
II Rossi PM, Ala-aho P, Doherty J & Kløve B (2014) Impact of peatland drainage and restoration on esker groundwater resources: modeling future scenarios for management. Hydrogeology Journal. DOI 10.1007/s10040-014-1127-z.
III Karjalainen TP, Rossi PM, Ala-aho P, Eskelinen R, Reinikainen K, Kløve B, Pulido-Velazquez M & Yang H (2013) A decision analysis framework for stakeholder involvement and learning in groundwater management. Hydrology and Earth System Sciences 17: 5141–5153.
Reprinted with permission from Elsevier (I), Springer (II) and Copernicus
Publications (III).
Original publications are not included in the electronic version of the dissertation.

96

A C T A U N I V E R S I T A T I S O U L U E N S I S
Book orders:Granum: Virtual book storehttp://granum.uta.fi/granum/
S E R I E S C T E C H N I C A
473. Seelam, Prem Kumar (2013) Hydrogen production by steam reforming of bio-alcohols : the use of conventional and membrane-assisted catalytic reactors
474. Komulainen, Petri (2013) Coordinated multi-antenna techniques for cellularnetworks : Pilot signaling and decentralized optimization in TDD mode
475. Piltonen, Petteri (2013) Prevention of fouling on paper machine surfaces
476. Juuso, Esko (2013) Integration of intelligent systems in development of smartadaptive systems : linguistic equation approach
477. Lu, Xiaojia (2013) Resource allocation in uplink coordinated multicell MIMO-OFDM systems with 3D channel models
478. Jung, Sang-Joong (2013) Personal machine-to-machine (M2M) healthcare systemwith mobile device in global networks
479. Haho, Päivi (2014) Learning enablers, learning outcomes, learning paths, and theirrelationships in organizational learning and change
480. Ukkonen, Kaisa (2014) Improvement of recombinant protein production inshaken cultures : focus on aeration and enzyme-controlled glucose feeding
481. Peschl, Michael (2014) An architecture for flexible manufacturing systems basedon task-driven agents
482. Kangas, Jani (2014) Separation process modelling : highlighting the predictivecapabilities of the models and the robustness of the solving strategies
483. Kemppainen, Kalle (2014) Towards simplified deinking systems : a study of theeffects of ageing, pre-wetting and alternative pulping strategy on ink behaviour inpulping
484. Mäklin, Jani (2014) Electrical and thermal applications of carbon nanotube films
485. Niemistö, Johanna (2014) Towards sustainable and efficient biofuels production :use of pervaporation in product recovery and purification
486. Liu, Meirong (2014) Efficient super-peer-based coordinated service provision
487. Väyrynen, Eero (2014) Emotion recognition from speech using prosodic features
489. Peräntie, Jani (2014) Electric-field-induced dielectric and caloric effects in relaxorferroelectrics
490. Aapaoja, Aki (2014) Enhancing value creation of construction projects throughearly stakeholder involvement and integration
C491etukansi.kesken.fm Page 2 Tuesday, May 6, 2014 11:54 AM

ABCDEFG
UNIVERSITY OF OULU P .O. B 00 F I -90014 UNIVERSITY OF OULU FINLAND
A C T A U N I V E R S I T A T I S O U L U E N S I S
S E R I E S E D I T O R S
SCIENTIAE RERUM NATURALIUM
HUMANIORA
TECHNICA
MEDICA
SCIENTIAE RERUM SOCIALIUM
SCRIPTA ACADEMICA
OECONOMICA
EDITOR IN CHIEF
PUBLICATIONS EDITOR
Professor Esa Hohtola
University Lecturer Santeri Palviainen
Postdoctoral research fellow Sanna Taskila
Professor Olli Vuolteenaho
University Lecturer Veli-Matti Ulvinen
Director Sinikka Eskelinen
Professor Jari Juga
Professor Olli Vuolteenaho
Publications Editor Kirsti Nurkkala
ISBN 978-952-62-0477-2 (Paperback)ISBN 978-952-62-0478-9 (PDF)ISSN 0355-3213 (Print)ISSN 1796-2226 (Online)
U N I V E R S I TAT I S O U L U E N S I SACTAC
TECHNICA
U N I V E R S I TAT I S O U L U E N S I SACTAC
TECHNICA
OULU 2014
C 491
Pekka M. Rossi
INTEGRATED MANAGEMENT OF GROUNDWATER AND DEPENDENT ECOSYSTEMSIN A FINNISH ESKER
UNIVERSITY OF OULU GRADUATE SCHOOL;UNIVERSITY OF OULU, FACULTY OF TECHNOLOGY;WATER RESOURCES AND ENVIRONMENTAL ENGINEERING RESEARCH GROUP;VALUE DOCTORAL PROGRAMME
C 491
ACTA
Pekka M. R
ossiC491etukansi.kesken.fm Page 1 Tuesday, May 6, 2014 11:54 AM


