OUE C-REIT 2018 AGM Final.ppt - links.sgx.com · (3) Based on OUB Centre’s 81.54% interest in One...
31
Annual General Meeting 24 April 2018
Transcript of OUE C-REIT 2018 AGM Final.ppt - links.sgx.com · (3) Based on OUB Centre’s 81.54% interest in One...

Annual General Meeting24 April 2018

Important Notice
2
This presentation shall be read in conjunction with OUE Commercial REIT’s Financial Results announcement forFY2017 dated 31 January 2018.
This presentation is for information only and does not constitute an invitation or offer to acquire, purchase orsubscribe for units in OUE Commercial REIT (“Units”). The value of Units and the income derived from them, if any,may fall or rise. The Units are not obligations of, deposits in, or guaranteed by, OUE Commercial REITManagement Pte. Ltd. as the Manager of OUE Commercial REIT (the “Manager”), or any of its affiliates. Aninvestment in Units is subject to investment risks, including the possible loss of the principal amount invested. Thepast performance of OUE Commercial REIT is not necessarily indicative of the future performance of OUECommercial REIT.
This presentation may contain forward-looking statements that involve risks and uncertainties. All statementsregarding future financial position, operating results, business strategies, plans and future prospects of OUECommercial REIT are forward-looking statements. Actual future performance, outcomes and results may differmaterially from those expressed in forward-looking statements as a result of a number of risks, uncertainties andassumptions. These forward-looking statements speak only as at the date of this presentation. No assurance canbe given that future events will occur, that projections will be achieved, or that assumptions are correct.Representative examples of these factors include (without limitation) general industry and economic conditions,interest rate trends, cost of capital and capital availability, competition from similar developments, shifts in expectedlevels of property rental income, changes in operating expenses (including employee wages, benefits and trainingcosts), property expenses and governmental and public policy changes. You are cautioned not to place unduereliance on these forward-looking statements, which are based on the Manager’s current view of future events.
Investors should note that they will have no right to request the Manager to redeem or purchase their Units whilethe Units are listed on the Singapore Exchange Securities Trading Limited (the “SGX-ST”). It is intended thatUnitholders may only deal in their Units through trading on the SGX-ST. Listing of the Units on the SGX-ST doesnot guarantee a liquid market for the Units.

Overview
Financial Highlights
Capital Management
Portfolio Performance
Summary
3
Agenda

4
About OUE Commercial REIT
4
OUE C-REIT’s principal investment strategy is to invest in income-
producing real estate which is used primarily for commercial purposes
in financial and business hubs in key gateway cities
With a total assets-under-management of approximately S$3.5 billion
over 2.4 million sq ft of GFA, OUE C-REIT’s portfolio comprises
OUE Bayfront, a premium Grade A office building located at Collyer Quay
between the Marina Bay downtown and established financial hub of Raffles
Place in Singapore;
One Raffles Place, an integrated commercial development comprising two
Grade A office towers and a retail mall located in the heart of Singapore’s
central business district at Raffles Place; and
Lippo Plaza, a Grade A commercial building located in Huangpu, one of
Shanghai’s established core CBD locations

Premium Portfolio of AssetsOUE Bayfront
5
GFA (sq m) 46,774.6
NLA (sq m) Office: 35,298.3; Retail: 1,830.1; Overall: 37,128.4
Committed Occupancy (@ 31 Dec 2017) Office: 98.2%; Retail: 100.0%; Overall: 98.2%
Valuation (@ 31 Dec 2017) S$1,153.0 m (S$2,885 psf)
Valuation Cap Rate (Office): 3.75%
Land Use Right Expiry
OUE Bayfront & OUE Tower : 99 yrs from 12 November 2007
OUE Link : 15 yrs from 26 March 2010
Underpass : 99 yrs from 7 January 2002
Completion Year 2011
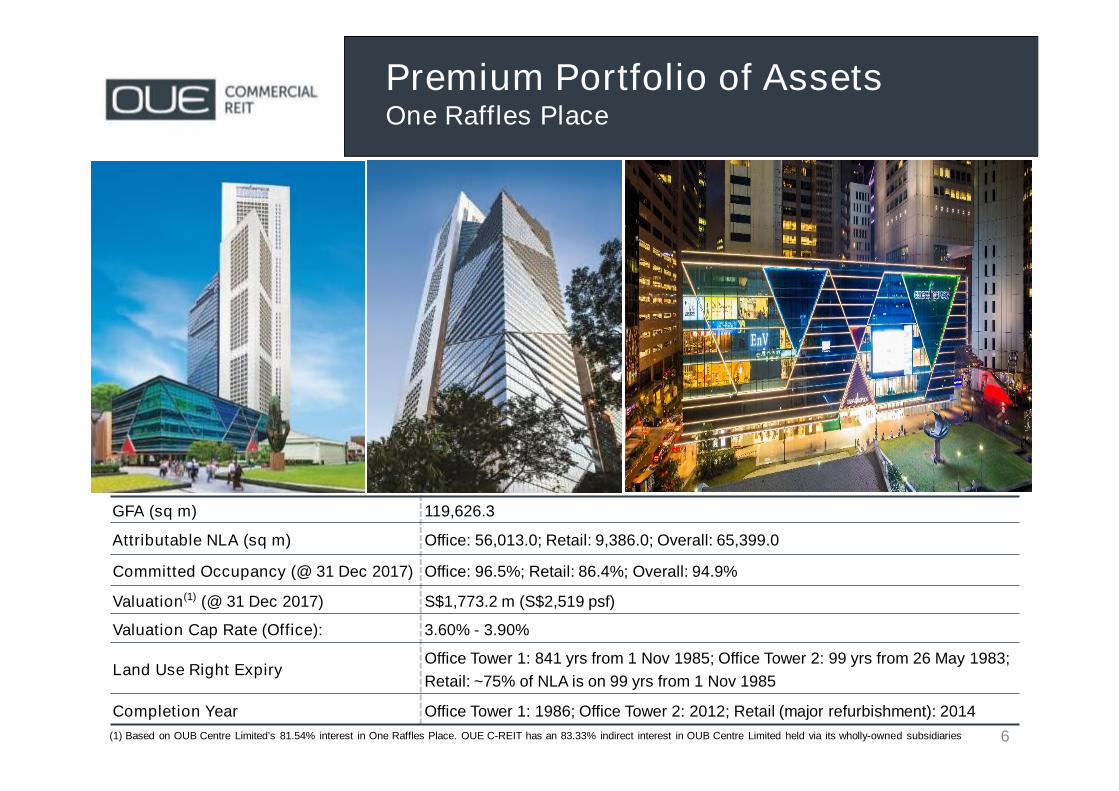
GFA (sq m) 119,626.3
Attributable NLA (sq m) Office: 56,013.0; Retail: 9,386.0; Overall: 65,399.0
Committed Occupancy (@ 31 Dec 2017) Office: 96.5%; Retail: 86.4%; Overall: 94.9%
Valuation(1) (@ 31 Dec 2017) S$1,773.2 m (S$2,519 psf)
Valuation Cap Rate (Office): 3.60% - 3.90%
Land Use Right ExpiryOffice Tower 1: 841 yrs from 1 Nov 1985; Office Tower 2: 99 yrs from 26 May 1983;
Retail: ~75% of NLA is on 99 yrs from 1 Nov 1985
Completion Year Office Tower 1: 1986; Office Tower 2: 2012; Retail (major refurbishment): 2014
Premium Portfolio of AssetsOne Raffles Place
6(1) Based on OUB Centre Limited’s 81.54% interest in One Raffles Place. OUE C-REIT has an 83.33% indirect interest in OUB Centre Limited held via its wholly-owned subsidiaries

GFA (sq m) 58,521.5
Attributable NLA (sq m) Office: 33,538.6; Retail: 5,685.9; Overall: 39,224.5
Committed Occupancy (@ 31 Dec 2017) Office: 100.0%; Retail: 90.4%; Overall: 98.6%
Valuation(1) (@ 31 Dec 2017) RMB2,887.0 m / RMB49,332 psm (S$588.9m)(2)
Land Use Right Expiry 50 yrs from 2 July 1994
Completion Year 1999; Retail (major refurbishment) : 2010
Premium Portfolio of AssetsLippo Plaza
7(1) Based on 91.2% strata ownership of Lippo Plaza(2) Based on SGD:CNY exchange rate of 1 : 4.902 as at 31 December 2017
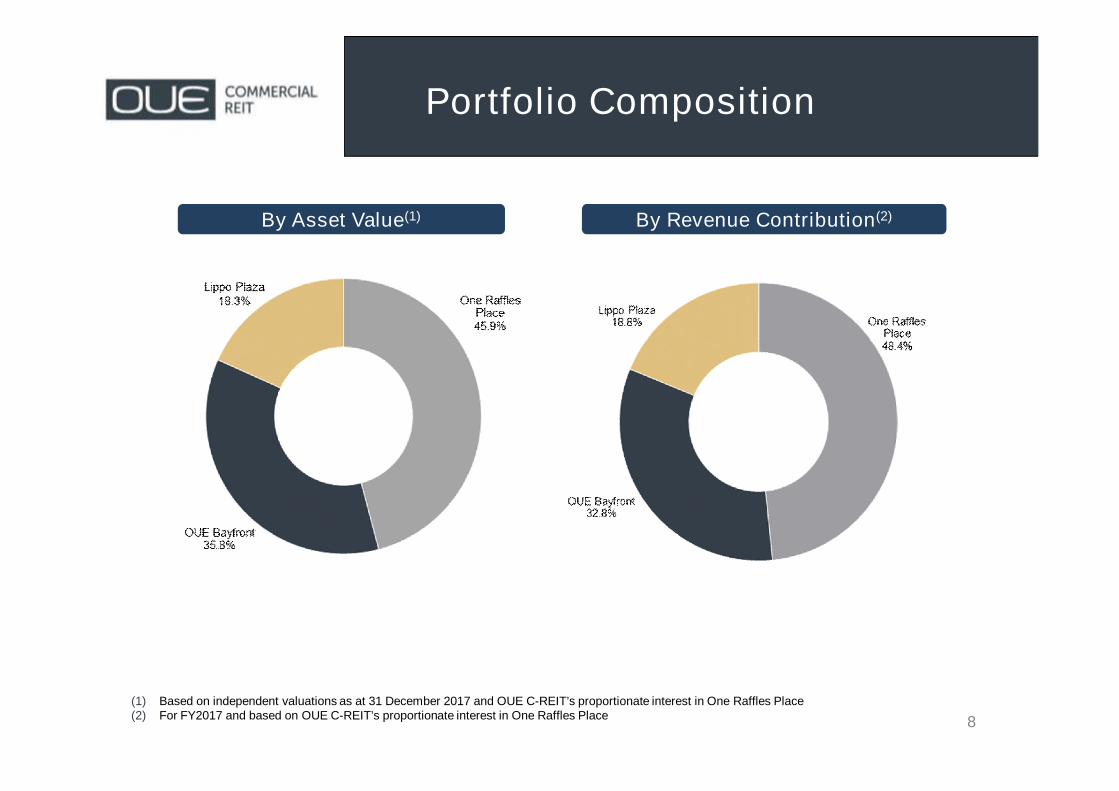
Portfolio Composition
8
(1) Based on independent valuations as at 31 December 2017 and OUE C-REIT’s proportionate interest in One Raffles Place(2) For FY2017 and based on OUE C-REIT’s proportionate interest in One Raffles Place
By Asset Value(1) By Revenue Contribution(2)

9
Well-Diversified PortfolioTenant Base
As at December 2017

10
Quality and Diversified Tenant Base
WALE by NLA 3.6 years
Top 10 tenants contribute approximately 27.5% of gross rental income
As at 31 Dec 2017

FinancialHighlightsFinancialHighlights

FY2017 Highlights
12
2.6 years
6.5%
Aggregate Leverage(As at 31 December 2017)
37.3%
S$0.91 per Unit(1)
S$3.5 billion
Assets-Under-Management
Distribution Yield
96.8%
Portfolio CommittedOccupancy(As at 31 December 2017)
Fixed Rate Debt(As at 31 December 2017)
84.3%
(1) OUE C-REIT’s distribution yield based on FY2017 distribution per unit of 4.67 cents and Unit closing price as at 19 April 2018 of S$0.715
New and Renewed LeasesCommitted(For 2017)
4.67 cents
Distribution Per Unit
418,000 sq ft
Net Asset Value(As at 31 December 2017)
Weighted AverageLease Expiry(By Gross Rental Income as at31 December 2017)

FY2017 vs FY2016
13
Net Property Income (S$m)
Revenue (S$m)
Amount Available for Distribution
to Unitholders (S$m)
DPU (cents)
• FY2017 revenue was slightly lower YoY at S$176.3 million due to absence of one-off incomein the current period
• With lower property operating expenses, net property income of S$138.2 million wasmarginally lower YoY
• Due to the absence of performance fees as well as higher income support drawn, FY2017amount available for distribution of S$70.0 million was 3.8% higher YoY
• DPU was 9.8% lower due to a larger unit base from the equity placement completed inMarch 2017
FY2016
177.8
138.6
FY2017
176.3
138.2
Change
-0.9%
-0.3%
67.470.0 +3.8%
5.184.67 -9.8%

Delivered sustainable distribution to Unitholders since IPO
(1) Period commencing from OUE C-REIT’s listing date of 27 January 2014 to 31 December 2014(2) FY2014-FY2017 compound annual growth rate (CAGR) calculated on the basis of annualised amount available for distribution for the period from OUE C-
REIT’s listing date of 27 January 2014 to 31 December 2014
Delivered Sustainable Distribution
14
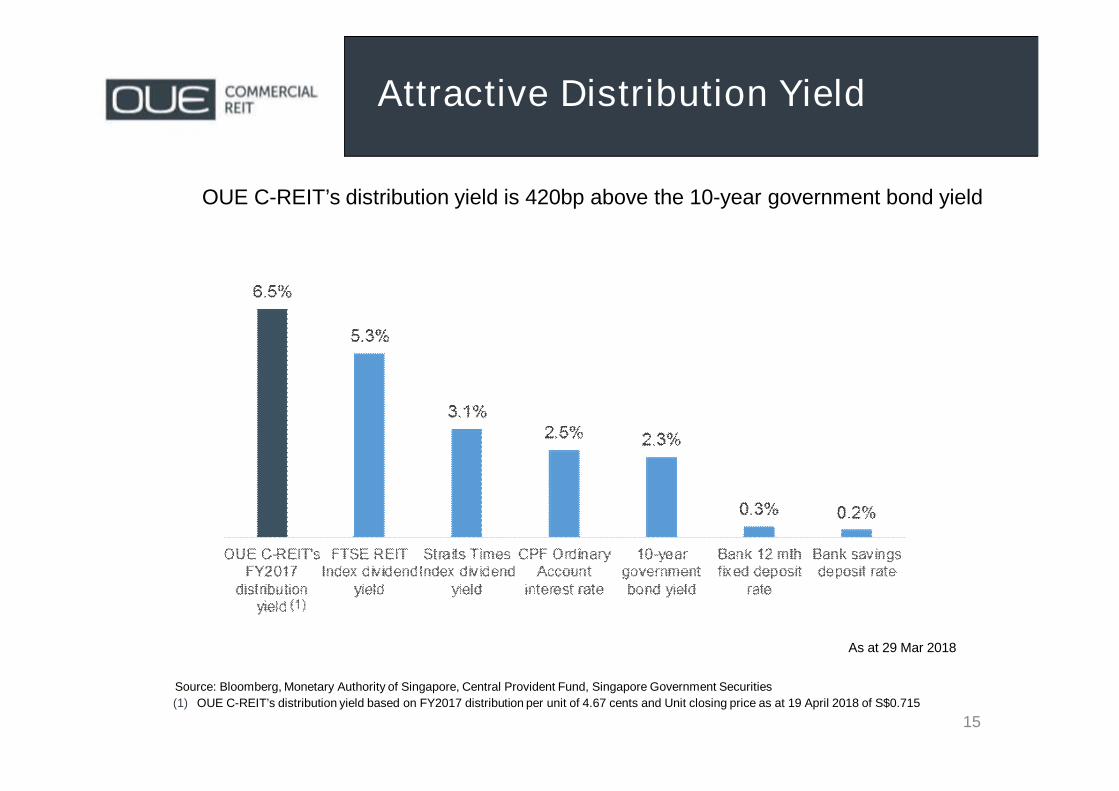
Attractive Distribution Yield
15
OUE C-REIT’s distribution yield is 420bp above the 10-year government bond yield
Source: Bloomberg, Monetary Authority of Singapore, Central Provident Fund, Singapore Government Securities
(1) OUE C-REIT’s distribution yield based on FY2017 distribution per unit of 4.67 cents and Unit closing price as at 19 April 2018 of S$0.715
As at 29 Mar 2018

CapitalManagementCapitalManagement

17
Valuation as at 31 Dec 2017
Valuation as at
31 December 2017 (1)
(S$ m)
Valuation as at
31 December 2016 (2)
(S$ m)
Change
OUE Bayfront 1,153.0 1,146.0 0.6%
One Raffles Place(3) 1,773.2 1,738.3 2.0%
Lippo Plaza588.9
(RMB 2,887.0 m)
524.2
(RMB 2,524.0 m)12.3%
(1) Based on independent valuations as at 31 December 2017 and SGD:CNY exchange rate of 1:4.902(2) Based on independent valuations as at 31 December 2016 and SGD:CNY exchange rate of 1:4.815(3) Based on OUB Centre’s 81.54% interest in One Raffles Place. OUE C-REIT has an 83.33% indirect interest in OUB Centre Limited(4) Not applicable. Valuation of Lippo Plaza was conducted based on Discounted Cashflow Approach and Direct Comparison Approach only
Valuations higher across portfolio supported by improved property cashflows

Capital Management
18(1) Based on SGD:CNY exchange rate of 1:4.902 as at 31 December 2017 and includes OUE C-REIT’s share of OUB Centre Limited’s loan(2) Based on SGD:CNY exchange rate of 1:4.815 as at 31 December 2016 and includes OUE C-REIT’s share of OUB Centre Limited’s loan
Raised S$150 million from an equity placement in March 2017 to strengthen OUE C-REIT’s
balance sheet
To ensure a sustainable capital structure, redeemed S$175 million of convertible perpetual
preferred units (“CPPUs”), reducing the amount of CPPUs outstanding to mitigate future
DPU dilution from potential conversion of CPPUs into new Units
As at 31 Dec 2017 As at 31 Dec 2016
Aggregate Leverage 37.3% 39.8%
Total debt S$1,221m(1) S$1,261m(2)
Weighted average cost of debt 3.5% p.a. 3.4% p.a.
Average term of debt 2.7 years 1.5 years
% fixed rate debt 84.3% 79.3%
Average term of fixed rate debt 2.0 years 2.5 years
Interest service ratio 3.2x 3.1x

Debt Maturity Profileas at 31 Dec 2017
19
Successfully diversified funding sources in September 2017 via a S$150 million 3.03% fixed
rate notes issuance maturing in 2020 which saw strong take up
Already in active negotiations to complete 2018 refinancing ahead of maturity in 2H 2018
PortfolioPerformancePortfolioPerformance

21
Resilient and Stable Portfolio
(1) Proforma committed occupancy as at 30 September 2013 as disclosed in OUE C-REIT’s Prospectus dated 17 January 2014
All three properties saw increased occupancy in 2017 and achieved above market officeoccupancy in a challenging leasing market environment
OUE C-REIT’s Committed Portfolio Occupancy

22
Office Occupancy Higher Than Market
Source: CBRE, Colliers Shanghai
OUE Bayfront maintainedabove market occupancydespite significant officesupply
One Raffles Placeincreased committedoffice occupancy by 6.5ppt since acquisition;currently enjoys abovemarket occupancy
Singapore
Lippo Plaza maintained100% occupancy in adeclining market
Shanghai

23
Committed Office Rents In Line OrAbove Market
FY2017 Range of Committed Rents(1) Average Passing Rents inDec 2017
OUE Bayfront S$10.00 – S$14.00 psf per month S$11.43 psf per month
One Raffles Place S$7.00(2) – S$11.80 psf per month S$9.92 psf per month
Lippo PlazaRMB8.00 – RMB12.00 psm per day(S$4.62 – S$6.94 psf per month)(3)
RMB9.79 psm per day(S$5.66 psf per month)(3)
(1) Committed rents for renewals and new leases(2) Due to leasing of a sub-optimal unit on low floor. Excluding this, the range of committed rents would be S$8.00 – S$11.80 psf / month(3) Translated at an SGD:CNY exchange rate of 1:4.888(4) Refers to CBD Grade A office rents in Singapore. Source: CBRE Singapore MarketView 4Q 2017(5) Refers to CBD Grade A office rents in Puxi. Source: Colliers International Shanghai 2017 Review and 2018 Outlook, 23 January 2018
The average of new and renewed office rents committed across the portfolio were in linewith or at a premium to their respective market office rents
The average of new and renewed office leases at OUE Bayfront and One Raffles Place in4Q 2017 was in line with or higher than the market rent of S$9.40(4) psf per month
At Lippo Plaza, new and renewed office leases in 4Q 2017 were higher than the marketrent of RMB9.14(5) psm per day

24
Average Passing Office Rents
(1) Proforma average passing rents as at 30 September 2013 as disclosed in OUE C-REIT’s Prospectus dated 17 January 2014
Singapore
Shanghai

25
Lease Expiry Profile- Portfolio
(1) “WALE” refers to the weighted average lease term to expiry(2) “NLA” refers to net lettable area
As at 31 Dec 2017
19.3% of OUE C-REIT’s portfolio gross rental income is due for renewal in 2018
WALE(1) of 2.5 years by NLA(2) and 2.6 years Gross Rental Income

Enhancing Quality Assets
One Raffles Place Tower 1 Commenced three-year asset enhancement programme in 2016 to upgrade
mechanical and engineering equipment
Completed replacement of air-conditioning chillers in 2017; utility costs
expected to reduce from better energy efficiency
Upgrade of basement lift lobbies also completed; further lift modernisation
works planned to improve lift efficiency
One Raffles Place Shopping Mall Asset enhancement works to improve circulation in mall to commence in mid-
2018
As part of efforts to drive a more diverse and dynamic tenant mix, co-working
operator occupying more than 35,000 sq ft set to open
Mall to remain operational during the asset enhancement period, where works
will be phased to minimise disruptions to business operations
26

Outlook andSummaryOutlook andSummary

Singapore Office Market
28Source: CBRE
After eight quarters of rental decline since 2Q 2015 due to unprecedented office supplyagainst an uncertain economic backdrop, CBD Grade A office rents recovered in 3Q 2017
Core CBD office occupancy improved 1.3 ppt QoQ to 93.8% while rents rose 3.3% QoQ toS$9.40 psf as at 4Q 2017, on the back of stronger leasing activity driven by co-working andtechnology sectors
The recovery in office rents is expected to continue on the back of firmer economicfundamentals and lower office supply in the medium term

Shanghai Office Market
29Source: Colliers International
Significant new office completions in 2017 resulted in Shanghai CBD Grade A officeoccupancy declining to 86.1% as at 4Q 2017
CBD Grade A office rents remained steady due to strong occupier demand from financialand professional services as well as the technology sectors.
In 2018, significant new office supply is expected to continue. However, continued strongleasing from financial services and technology sectors is expected to mitigate any significantincrease in vacancy rate and rents are expected to remain stable

30
Positive overall rental outlook given office market recovery inSingapore and a stable Shanghai office market
Strategically located, landmark Grade A commercial properties inSingapore are expected to ride on this wave of rent recovery
Lippo Plaza in Shanghai expected to continue to enjoy stableperformance
Significant proportion of debt cost is fixed, mitigating interest ratevolatility
Potential acquisition pipeline from Right of First Refusal over theSponsor’s income-producing properties
Summary
30

Thank you