Ottawa County Planning & Performance Improvement ......(2004-2008) 0% 100% 200% 300% 400% 500% 600%...
66
Planning & Performance Improvement Department Ottawa County Planning & Performance Improvement Department
Transcript of Ottawa County Planning & Performance Improvement ......(2004-2008) 0% 100% 200% 300% 400% 500% 600%...
Pla
nnin
g &
Per
form
ance
Im
prov
emen
t Dep
artm
ent
Ottawa County Planning & Performance Improvement Department

Pla
nnin
g &
Per
form
ance
Im
prov
emen
t Dep
artm
ent
Land Use Planning
Strategic Planning and Evaluation
Legislative Analysis
Grant Administration
Data and Research
Ottawa County Planning & Performance Improvement Department
Pla
nnin
g &
Per
form
ance
Im
prov
emen
t Dep
artm
ent
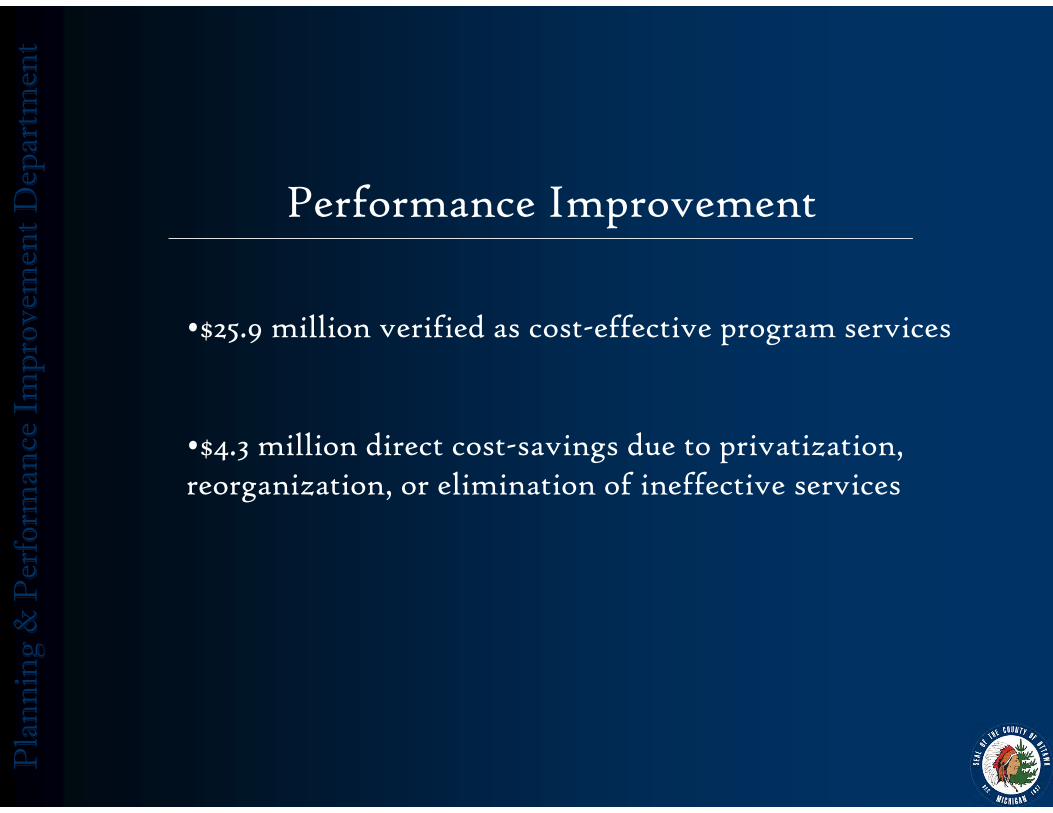
Performance Improvement
•$25.9 million verified as cost-effective program services
•$4.3 million direct cost-savings due to privatization, reorganization, or elimination of ineffective services

Pla
nnin
g &
Per
form
ance
Im
prov
emen
t Dep
artm
ent

Pla
nnin
g &
Per
form
ance
Im
prov
emen
t Dep
artm
ent Ottawa County Resident Survey
•Economic development listed as single issue that concerned respondents the most
•42% of respondents thought the county should do more to provide effective economic development programs

Pla
nnin
g &
Per
form
ance
Im
prov
emen
t Dep
artm
ent

Pla
nnin
g &
Per
form
ance
Im
prov
emen
t Dep
artm
ent
Une m ploym e n t Rate s in O ttawa C ounty, Mich igan an d Nation (2000-2009)(Annual Average1)
7.0%
11.7%
5.6%5.3%5.2%
5.5%5.9%
5.4%
4.1%2.6%
12.6%
8.4%
7.2%6.9%
5.2%
6.3%7.1% 7.1% 6.9%
3.7%
5.8%
8.7%
4.7%4.0%
5.8%6.0% 5.5%
5.1% 4.6% 4.6%
0.0%
2.0%
4.0%
6.0%
8.0%
10.0%
12.0%
14.0%
2000 2001 2002 2003 2004 2005 2006 2007 2008 2009
Ye ar
Une
mpl
oym
ent R
ate
Ottawa CountyMichiganNat ional
Pla
nnin
g &
Per
form
ance
Im
prov
emen
t Dep
artm
ent
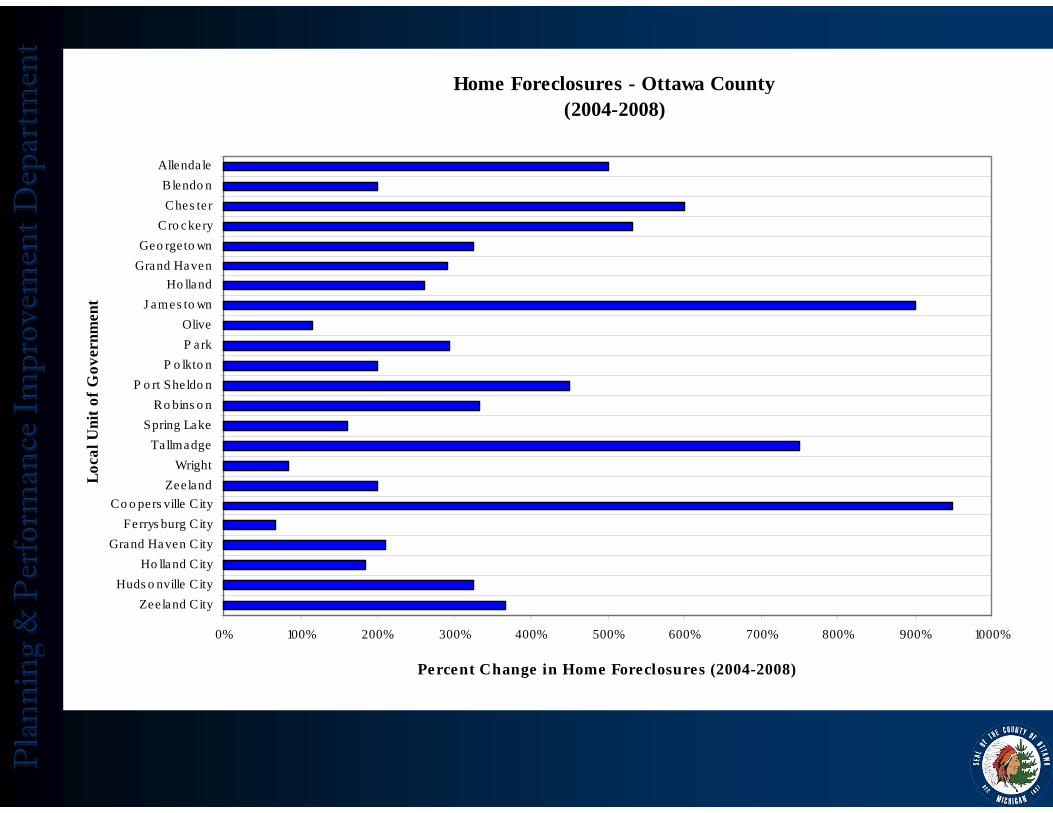
Home Foreclosures - Ottawa County (2004-2008)
0% 100% 200% 300% 400% 500% 600% 700% 800% 900% 1000%
Zeeland CityHuds o nville City
Ho lland CityGrand Haven City
Ferrys burg CityCo o pers ville City
Zee landWright
Ta llmadgeSpring Lake
Ro bins o nP o rt She ldo n
P o lkto nP arkOlive
J ames to wnHo lland
Grand HavenGeo rgeto wn
Cro ckeryChes te rBlendo n
Allenda le
Loca
l Uni
t of G
over
nmen
t
Percent Change in Home Foreclosures (2004-2008)
Pla
nnin
g &
Per
form
ance
Im
prov
emen
t Dep
artm
ent
Pla
nnin
g &
Per
form
ance
Im
prov
emen
t Dep
artm
ent
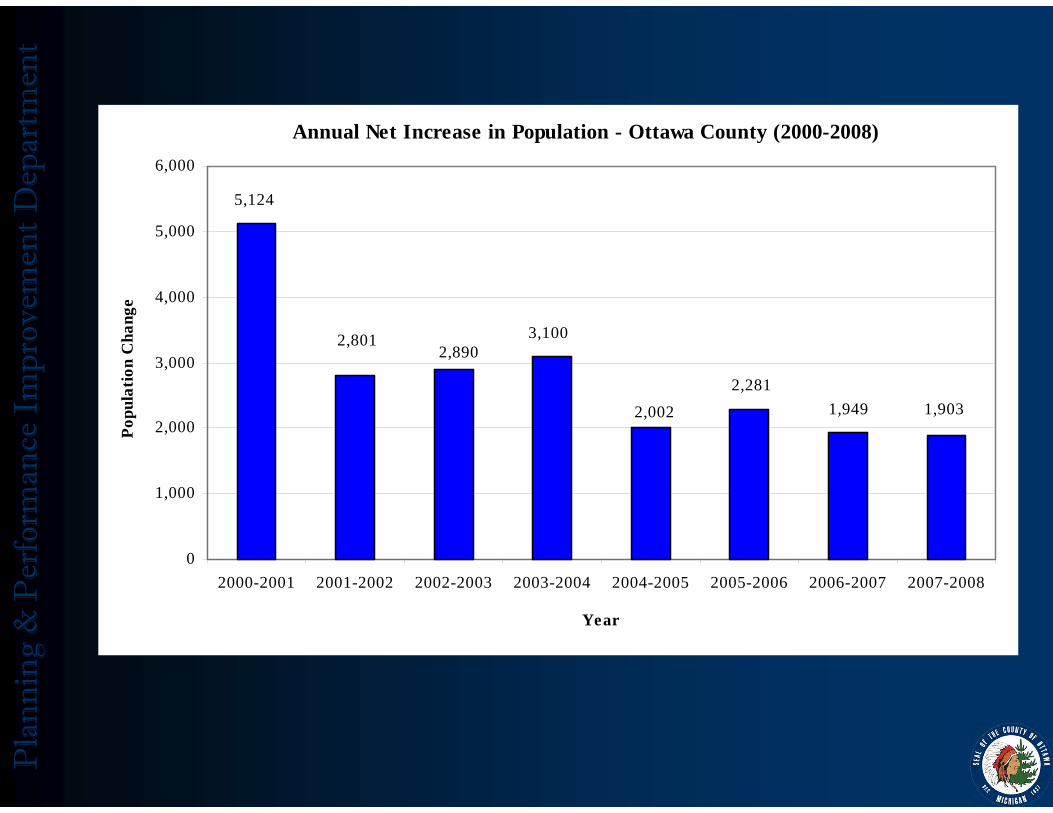
Annual Net Increase in Population - Ottawa County (2000-2008)
1,9031,9492,281
2,002
3,1002,890
2,801
5,124
0
1,000
2,000
3,000
4,000
5,000
6,000
2000-2001 2001-2002 2002-2003 2003-2004 2004-2005 2005-2006 2006-2007 2007-2008
Year
Popu
latio
n C
hang
e

Pla
nnin
g &
Per
form
ance
Im
prov
emen
t Dep
artm
ent

Pla
nnin
g &
Per
form
ance
Im
prov
emen
t Dep
artm
ent
•Collective Strategic Plan
•Research and Analysis
•Communication and Knowledge Management
•Policy Development
Pla
nnin
g &
Per
form
ance
Im
prov
emen
t Dep
artm
ent

Pla
nnin
g &
Per
form
ance
Im
prov
emen
t Dep
artm
ent
Planning & Performance Improvement Staff

Pla
nnin
g &
Per
form
ance
Im
prov
emen
t Dep
artm
ent Brownfield Redevelopment Authority

Pla
nnin
g &
Per
form
ance
Im
prov
emen
t Dep
artm
ent Land Bank Authority

Pla
nnin
g &
Per
form
ance
Im
prov
emen
t Dep
artm
ent
Tuesday May 5, 200910:00 a.m.
Ottawa County Fillmore Street Complex
West Olive, Michigan
Metropolitan Statistical Areas (MSAs)

Pla
nnin
g &
Per
form
ance
Im
prov
emen
t Dep
artm
ent
Land Use Planning
•Multi-Jurisdictional
•Demonstration Projects
•Pragmatic (Real Solutions)

Pla
nnin
g &
Per
form
ance
Im
prov
emen
t Dep
artm
ent

Pla
nnin
g &
Per
form
ance
Im
prov
emen
t Dep
artm
ent
Multi-Jurisdictional

Pla
nnin
g &
Per
form
ance
Im
prov
emen
t Dep
artm
ent

Pla
nnin
g &
Per
form
ance
Im
prov
emen
t Dep
artm
ent

Pla
nnin
g &
Per
form
ance
Im
prov
emen
t Dep
artm
ent
Pla
nnin
g &
Per
form
ance
Im
prov
emen
t Dep
artm
ent
Pla
nnin
g &
Per
form
ance
Im
prov
emen
t Dep
artm
ent

Pla
nnin
g &
Per
form
ance
Im
prov
emen
t Dep
artm
ent

Pla
nnin
g &
Per
form
ance
Im
prov
emen
t Dep
artm
ent Countywide Corridor Plan

Pla
nnin
g &
Per
form
ance
Im
prov
emen
t Dep
artm
ent Countywide Non-Motorized Pathways

Pla
nnin
g &
Per
form
ance
Im
prov
emen
t Dep
artm
ent

Pla
nnin
g &
Per
form
ance
Im
prov
emen
t Dep
artm
ent

Pla
nnin
g &
Per
form
ance
Im
prov
emen
t Dep
artm
ent
Demonstration Projects
Pla
nnin
g &
Per
form
ance
Im
prov
emen
t Dep
artm
ent
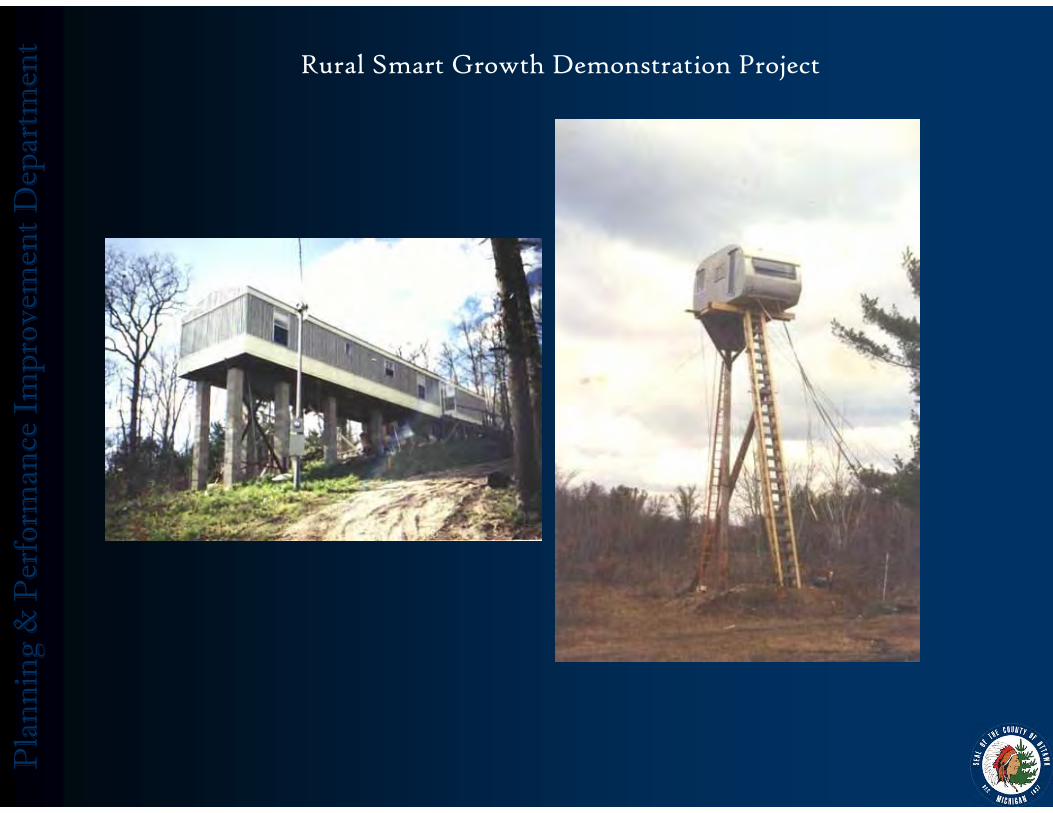
Rural Smart Growth Demonstration Project

Pla
nnin
g &
Per
form
ance
Im
prov
emen
t Dep
artm
ent
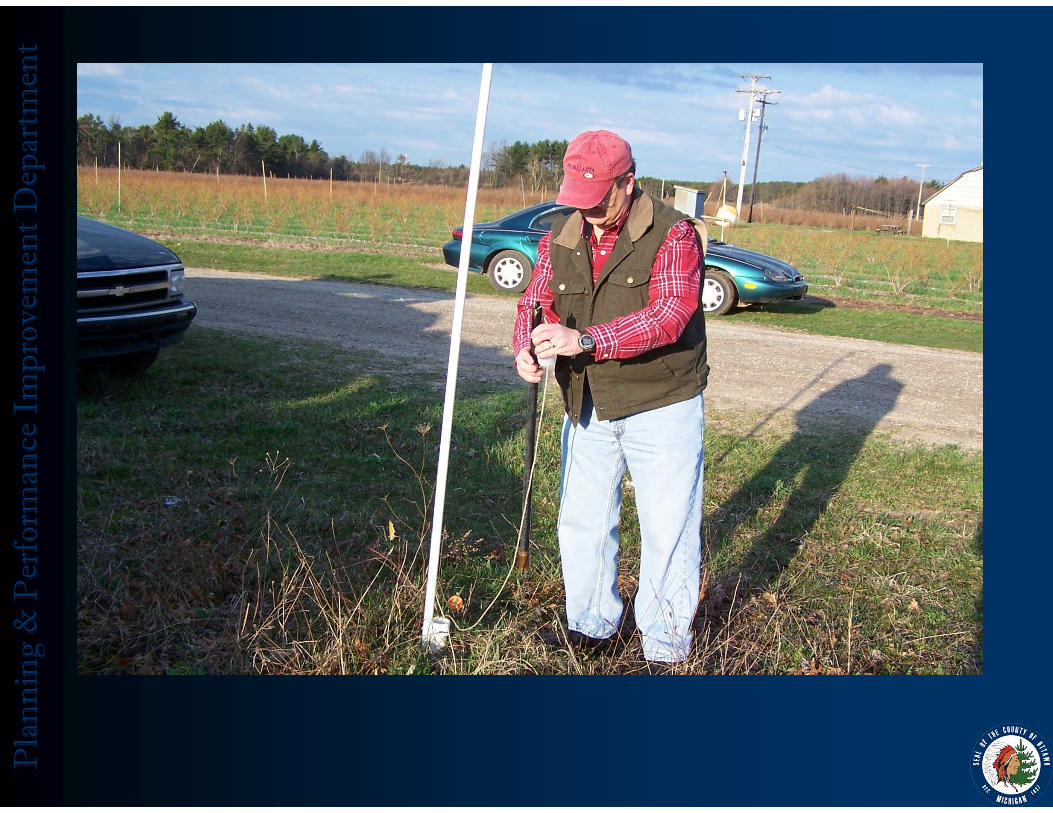
Aesthetic Features and Farmland

Pla
nnin
g &
Per
form
ance
Im
prov
emen
t Dep
artm
ent
Environmental Quality

Pla
nnin
g &
Per
form
ance
Im
prov
emen
t Dep
artm
ent
Transportation Efficiency

Pla
nnin
g &
Per
form
ance
Im
prov
emen
t Dep
artm
ent

Pla
nnin
g &
Per
form
ance
Im
prov
emen
t Dep
artm
ent
Urban Smart Growth Demonstration Project

Pla
nnin
g &
Per
form
ance
Im
prov
emen
t Dep
artm
ent
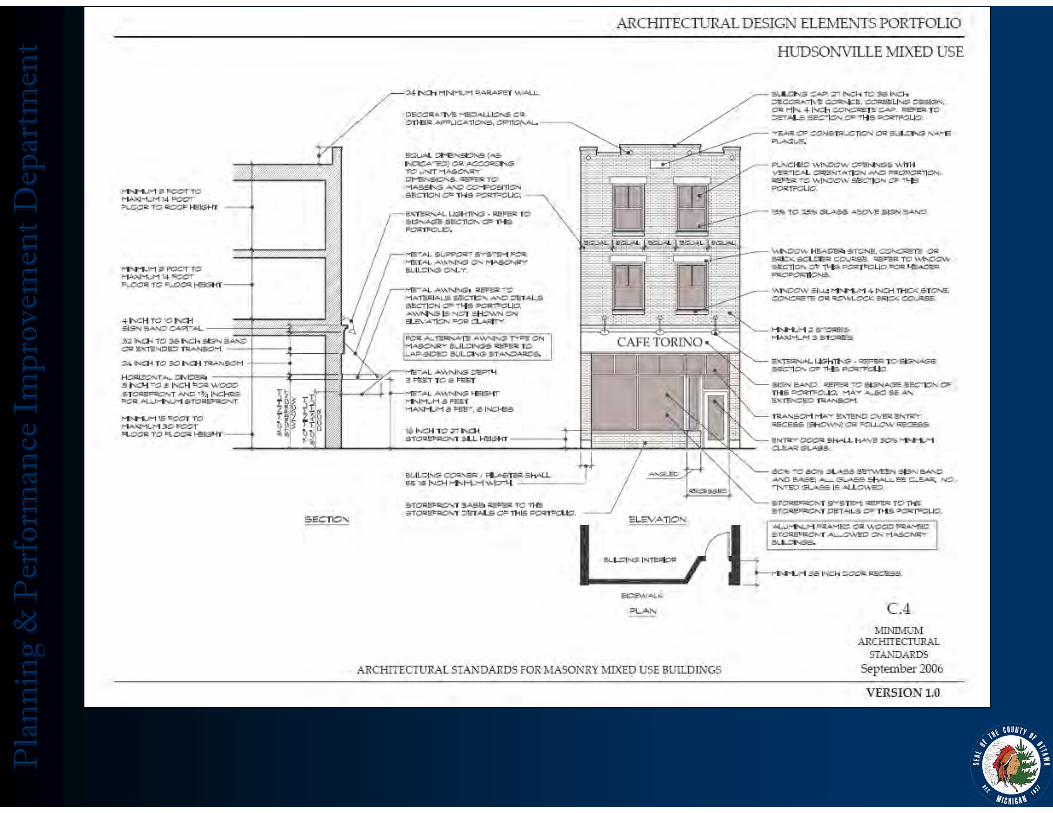
Aesthetics
Pla
nnin
g &
Per
form
ance
Im
prov
emen
t Dep
artm
ent
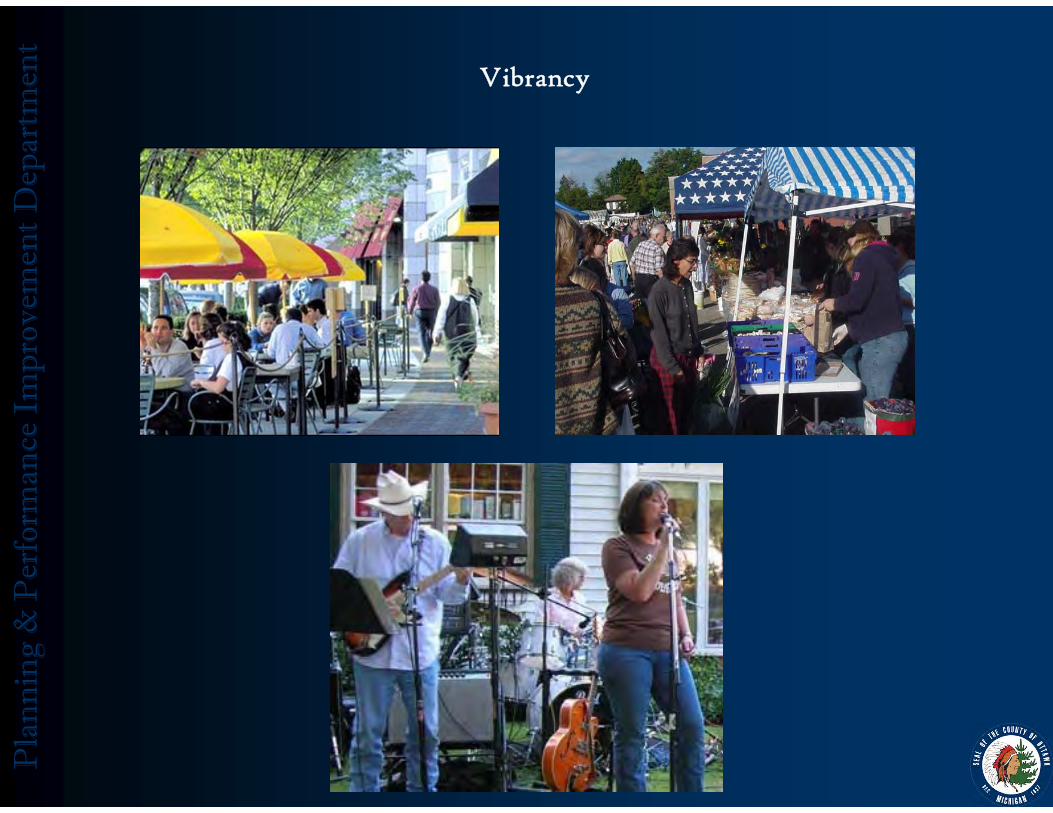
Vibrancy

Pla
nnin
g &
Per
form
ance
Im
prov
emen
t Dep
artm
ent
Livability
Pla
nnin
g &
Per
form
ance
Im
prov
emen
t Dep
artm
ent

Pla
nnin
g &
Per
form
ance
Im
prov
emen
t Dep
artm
ent

Pla
nnin
g &
Per
form
ance
Im
prov
emen
t Dep
artm
ent

Pla
nnin
g &
Per
form
ance
Im
prov
emen
t Dep
artm
ent

Pla
nnin
g &
Per
form
ance
Im
prov
emen
t Dep
artm
ent
Road Salt Management Program

Pla
nnin
g &
Per
form
ance
Im
prov
emen
t Dep
artm
ent

Pla
nnin
g &
Per
form
ance
Im
prov
emen
t Dep
artm
ent

Pla
nnin
g &
Per
form
ance
Im
prov
emen
t Dep
artm
ent
Pla
nnin
g &
Per
form
ance
Im
prov
emen
t Dep
artm
ent

Pla
nnin
g &
Per
form
ance
Im
prov
emen
t Dep
artm
ent
Pragmatic (Real Solutions)

Pla
nnin
g &
Per
form
ance
Im
prov
emen
t Dep
artm
ent Sustainability - Wind Energy

Pla
nnin
g &
Per
form
ance
Im
prov
emen
t Dep
artm
ent Sustainability - Ethanol Production
Pla
nnin
g &
Per
form
ance
Im
prov
emen
t Dep
artm
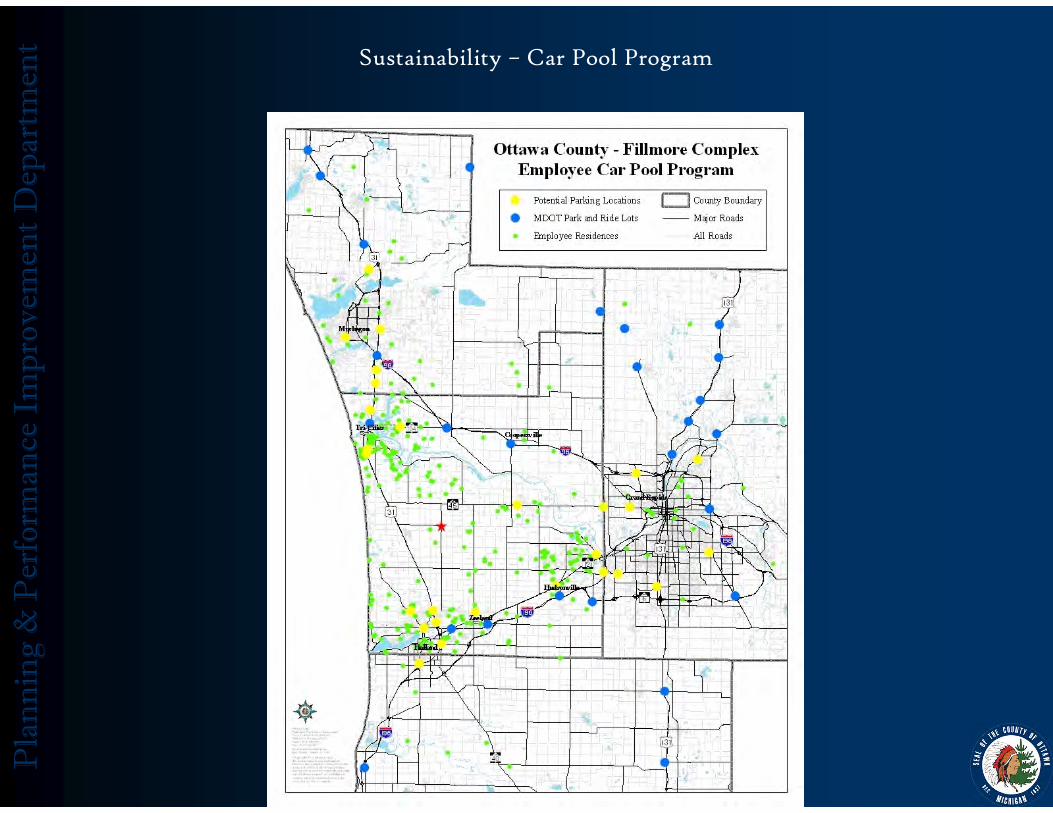
ent Sustainability – Car Pool Program

Pla
nnin
g &
Per
form
ance
Im
prov
emen
t Dep
artm
ent Sustainability – Tree Transplant and Preservation

Pla
nnin
g &
Per
form
ance
Im
prov
emen
t Dep
artm
ent

Pla
nnin
g &
Per
form
ance
Im
prov
emen
t Dep
artm
ent
Comprehensive Water Resource Assessment
•Aquifer Sustainability – Withdrawal limitation
•Aquifer Quality – Withdrawal Implications
•Foundation Elevation – Water Table Range
•Surface and Groundwater Impacts –Excavation/Ponds
Pla
nnin
g &
Per
form
ance
Im
prov
emen
t Dep
artm
ent
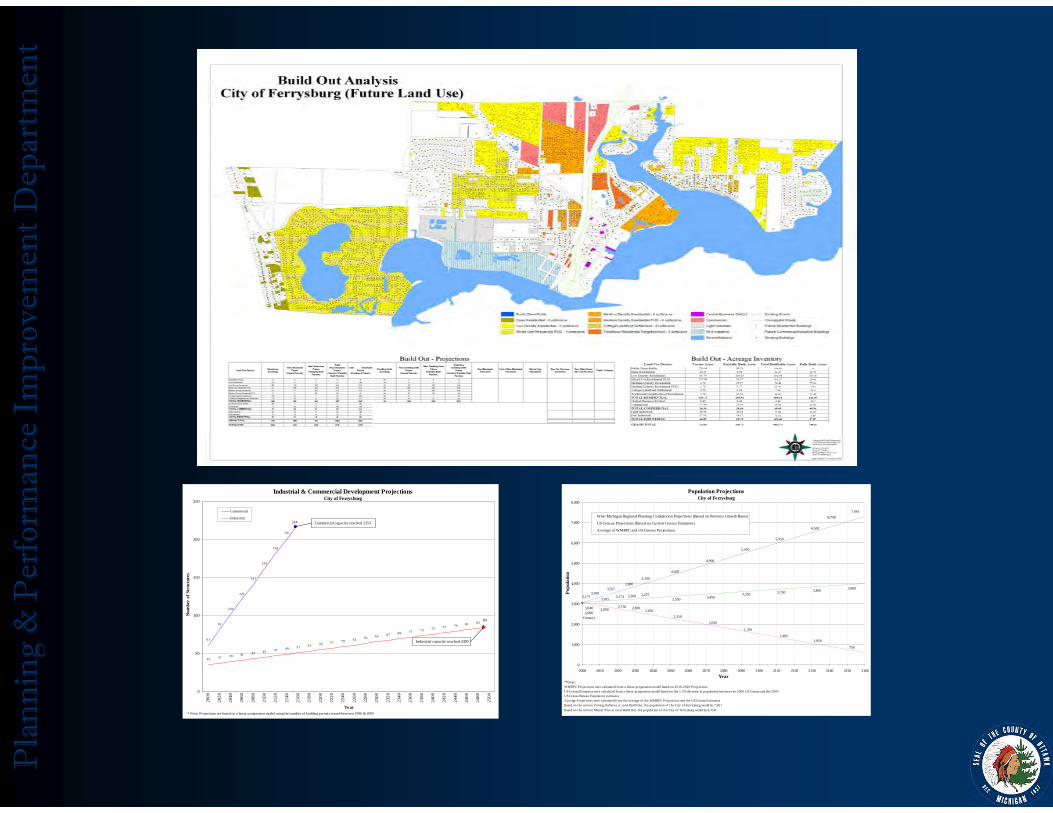
Industrial & Commercial Development ProjectionsCity of Ferrysburg
61
81
101
121
141
161
181
201
35 37 39 41 43 45 47 49 51 53 55 57 59 61 63 65 67 69 71 73 75 77 79 81 83
0
50
100
150
200
250
2000
2020
2040
2060
2080
2100
2120
2140
2160
2180
2200
2220
2240
2260
2280
2300
2320
2340
2360
2380
2400
2420
2440
2460
2480
2500
Year
Num
ber
of S
truc
ture
s
Commercial
Industrial
Industrial capacity reached 2490
* Note: Projections are based on a linear progression model using the number of building permits issued between 1996 & 2005
Commercial capacity reached 2153214
84
Population ProjectionsCity of Ferrysburg
2,350
2,050
1,700
1,400
4,100
3,173
3,8003,597
3,309
4,400
4,900
5,450
5,950
6,500
7,0616,758
2,4502,6002,750
2,900
1,050
750
3,040(2000
Census)
3,2753,174 3,2003,105
3,9003,8003,7003,5503,4503,350
0
1,000
2,000
3,000
4,000
5,000
6,000
7,000
8,000
2000 2010 2020 2030 2040 2050 2060 2070 2080 2090 2100 2110 2120 2130 2140 2150 2160Year
Popu
latio
n
West Michigan Regional Planning Commission Projections (Based on Previous Growth Rates)
US Census Projections (Based on Current Census Estimates)
Average of WMRPC and US Census Projections
*Notes:WMRPC Projections were calculated from a linear progression model based on 2010-2020 Project ionsUS Census Estimates were calculated from a linear progression model based on the 1.5% decrease in population between the 2000 US Census and the 2005 US Census Bureau Population estimatesAverage Projections were calculated from the average of the WMRPC Projections and the US Census EstimatesBased on the current Zoning Ordiance at total Build Out , the population of the City of Ferrysburg would be 7,061Based on the current Master Plan at total Build Out, the populat ion of the City of Ferrysburg would be 6,758

Pla
nnin
g &
Per
form
ance
Im
prov
emen
t Dep
artm
ent

Pla
nnin
g &
Per
form
ance
Im
prov
emen
t Dep
artm
ent
2009 – Approximately 8,000 people turn 65 every day
2009 – 1 in 8 people is over 65 years of age
2020 – 1 in 5 people is over 65 years of age
Housing for the Aging Population: Sustainable Planning for Parents and Grandparents

Pla
nnin
g &
Per
form
ance
Im
prov
emen
t Dep
artm
ent

Pla
nnin
g &
Per
form
ance
Im
prov
emen
t Dep
artm
ent
Pla
nnin
g &
Per
form
ance
Im
prov
emen
t Dep
artm
ent
Pla
nnin
g &
Per
form
ance
Im
prov
emen
t Dep
artm
ent

Pla
nnin
g &
Per
form
ance
Im
prov
emen
t Dep
artm
ent

Pla
nnin
g &
Per
form
ance
Im
prov
emen
t Dep
artm
ent

Pla
nnin
g &
Per
form
ance
Im
prov
emen
t Dep
artm
ent
Questions and/or Comments