€¦ · Others 14.7% Net sales ¥609,416 million Home Appliances 22.3% Net sales ¥924,478 million...
76
Transcript of €¦ · Others 14.7% Net sales ¥609,416 million Home Appliances 22.3% Net sales ¥924,478 million...

X-X01-1-C8783-A HQ1108〈MDOC〉
http://www.MitsubishiElectric.com

Contents
02 To Our Shareholders
03 Financial Highlights
04 Corporate Strategy
08 At a Glance
Fiscal 2011 Overview
10 Review of Operations
10 Energy and Electric Systems
11 Industrial Automation Systems
12 Information and Communication Systems
13 Electronic Devices
14 Home Appliances
15 Research and Development / Intellectual Property
18 Corporate Social Responsibility
21 Corporate Governance
22 Directors and Executive Officers
23 Organization
24 Major Subsidiaries and Affiliates
25 Financial Section
73 Corporate Data /Shareholder Information

2011 marks the year of Mitsubishi Electric’s 90th anniversary.
Looking ahead to our 100th anniversary, our continued aim is to help enrich society.
By enriching society, we mean creating a “people-friendly” society that ensures safety,
peace of mind, health and comfort for all, and a more “earth-friendly” society that recycles and
uses resources efficiently.
We at the Mitsubishi Electric Group provide a wide spectrum of products and services,
ranging from semiconductors to large-scale systems, with applications for homes, offices,
factories, social infrastructure and even space systems.
As we strive to become a global, leading green company that enriches society with technology,
we will increase cross-cooperation within the Group while providing advanced technologies and
engaging in a wide array of business pursuits.
For Japan, for the world, and for the future—the Mitsubishi Electric Group will continue
to make steady steps toward achieving this goal.
Aiming to become a global, leading green company, enriching society with technology.
MITSUBISHI ELECTRIC CORPORATION ANNUAL REPORT 2011 01

To Our Shareholders
To begin, Mitsubishi Electric would like to extend its deepest
condolences to all those affected by the Great East Japan
Earthquake, which occurred in March 2011. It is the sincerest
wish of the entire Mitsubishi Electric Group for the earliest
possible recovery of all stricken areas.
During the fiscal year ended March 31, 2011, although the
business environment saw such setbacks as rapid yen apprecia-
tion and soaring raw material prices, conditions continued to
improve overall on the back of a widespread recovery in the
global economy, particularly in emerging markets. However,
the business environment has been affected by the Great East
Japan Earthquake, resulting in partial suspensions of production
and, due to rolling blackouts and other factors, a decrease in the
capacity utilization ratio at some operational sites.
Under these circumstances, the Mitsubishi Electric Group
continued to emphasize Growth, Profitability and Efficiency, and
Soundness, the three key viewpoints of Balanced Corporate
Management. Accordingly, the Group placed greater emphasis
than ever before on promoting growth strategies rooted in its
competitive advantages as well as on Group efforts to boost its
competitiveness and strengthen its management structure in
accordance with the Balanced Corporate Management policy.
As a result, the Mitsubishi Electric Group recorded consolidated
net sales of ¥3,645.3 billion in the fiscal year ended March 31,
2011, up 9% compared with the previous fiscal year. Operating
income rose 2.5 times year-on-year to ¥233.8 billion, for a Group
operating income ratio of 6.4%. Meanwhile, net income jumped
4.4 times to ¥124.5 billion. Consequently, we achieved our oper-
ating income ratio, return on equity (ROE) and interest-bearing
debt to total assets targets (above 5%, above 10% and below
15%, respectively).
The entire Mitsubishi Electric Group will make wholehearted
efforts to contribute to future recovery activities in response to
the Great East Japan Earthquake, beginning with efforts to
restore social infrastructure. In addition, the Group is taking steps
to strengthen its initiatives in growing market segments. To that
end, we are engaging in activities that include: expanding busi-
ness activities globally, beginning with newly emerging markets;
promoting environment-related business strategies; bolstering the
social infrastructure systems business; and developing solutions
businesses by combining our wide array of technologies with
in-house expertise. Working to refine our robust management
structure to be even more resilient in today’s ever-fluctuating
business climate, the Mitsubishi Electric Group will further hone
the ”craftsmanship” capabilities integral to our operations.
We are confident that such endeavors shall help further
increase corporate value.
August 2011
President & CEO
Kenichiro Yamanishi
02 MITSUBISHI ELECTRIC CORPORATION ANNUAL REPORT 2011

Financial Highlights
Performance for the year ended March 31, 2011
Yen(millions)
U.S. dollars(thousands)
Years ended March 31 2011 2010 2009 2011
Net sales ¥3,645,331 ¥3,353,298 ¥3,665,119 $ 43,919,651
Operating income1 233,761 94,302 139,728 2,816,398
Net income attributable to Mitsubishi Electric Corp.2 124,525 28,278 12,167 1,500,301
Total assets 3,332,679 3,215,094 3,334,123 40,152,759
Interest-bearing debt 484,352 537,500 677,864 5,835,566
Mitsubishi Electric Corp. Shareholders’ equity 1,050,340 964,584 849,476 12,654,699
Capital expenditures 107,638 109,069 141,434 1,296,843
R&D expenditures 151,779 133,781 144,444 1,828,663
Yen U.S. dollars
Per-Share Amounts
Net income attributable to Mitsubishi Electric Corp.2
Basic ¥58.00 ¥13.18 ¥5.67 $0.699
Diluted3 — 13.18 5.67 —
Cash dividends declared 12 4 6 0.145
%
Statistical Information
Operating income ratio 6.4% 2.8% 3.8% —
Return on equity (ROE) 12.4 3.1 1.3 —
Interest-bearing debt to total assets 14.5 16.7 20.3 —
See accompanying notes to consolidated financial statements.1 Operating income is presented as net sales less cost of sales, selling, general, administrative and R&D expenses, and loss on impairment of long-lived assets. 2 From the year ended March 31, 2010, the Company has applied FASB ASC Topic 810 “Consolidation”. Due to the adoption of ASC Topic 810, “Net Income” has been renamed
“Net income attributable to Mitsubishi Electric Corp.”.3 For the year ended March 31, 2011, diluted net income per share attributable to Mitsubishi Electric Corp. is not included in the above figure as no dilutive securities existed.
Net Sales Breakdown by Business Segment
Energy and Electric Systems 24.8% Net sales ¥1,027,749 million
Others 14.7% Net sales ¥609,416 million
Home Appliances 22.3% Net sales ¥924,478 million
Electronic Devices 4.2% Net sales ¥175,910 million
Industrial Automation Systems 22.3% Net sales ¥927,002 million
Information and Communication Systems 11.7% Net sales ¥487,915 million
MITSUBISHI ELECTRIC CORPORATION ANNUAL REPORT 2011 03

Corporate Strategy
Pursuing Ever Higher GrowthIn fiscal 2011, the Mitsubishi Electric Group recorded an operat-
ing income ratio of 6.4%, return on equity (ROE) of 12.4% and
a ratio of interest-bearing debt to total assets of 14.5%.
Consequently, the Group achieved its management targets (which
must be continuously and stably achieved) for operating income
ratio, ROE and ratio of interest-bearing debt to total assets (above
5%, above 10% and below 15%, respectively).
Guided by its overarching policy of Balanced Corporate
Management, the Mitsubishi Electric Group will strive to continu-
ously and stably achieve the above indicators set as its manage-
ment targets, and aim to become a global, leading green
company, enriching society with technology. With these two
objectives in mind, the Group will strengthen its growth strate-
gies in each business in order to pursue ever higher growth from
three viewpoints: the environment and energy, social infrastruc-
ture systems and global business development.
Three Management Targets to be Continuously and Stably Achieved
Operating income ratio:
5% or more
ROE:
10% or more
Ratio of interest-bearing debt to total assets:
15% or less
Achieve Balanced Corporate Management
Emphasis on Growth Based on Strong
Profitability, Efficiency and Soundness
Establish a Robust Management Foundationand Ensure Sustainable Growth
Increase Corporate Value
ProfitabilityEfficiency
Soundness
Growth
Management Policy”Changes for the Better,” our corporate statement,
encapsulates all that we stand for and aspire to—a
brighter future for society, industry and everyday life
through innovation.
Supporting this commitment to innovation and
sustainable operations is a solid management structure
backed by balanced management initiatives that stem
from three key viewpoints: Growth; Profitability and
Efficiency; and Soundness.
In terms of its corporate social responsibility (CSR)
initiatives, the entire Mitsubishi Electric Group is steered
by its Corporate Mission and Seven Guiding Principles.
Putting particular emphasis on compliance with applicable
laws and high ethical standards, we are committed to
strengthening internal controls to ensure legal compliance
Group-wide, as well as thoroughly implementing educa-
tion and training. In addition, we continue to work
diligently to safeguard the environment. Among a host
of initiatives, we are striving to create a low-carbon,
recycling-based society as part of our Environmental
Vision 2021 program.
To ensure that we continue to meet the expectations
of shareholders, we have undertaken reforms that are
guiding our ongoing evolution into a network of highly
competitive, electric-electronic businesses while leverag-
ing synergies to further enhance corporate value.
04 MITSUBISHI ELECTRIC CORPORATION ANNUAL REPORT 2011

Framework for Implementing Balanced Corporate ManagementThe Mitsubishi Electric Group undertakes management opera-
tions based on its Front-line Priority framework in the two areas
of customer contact and production. In the first front-line area of
customer contact, the Group enhances its competitiveness in
marketing and services. In the latter front-line area of production,
the objective of the Front-line Priority works to bolster the
Group’s ”craftsmanship” in the areas of quality, costs, production
engineering technologies, research and development, and
intellectual property (IP). In addition, by implementing its Strong
Synergistic Corporate Network framework, the Group is pursuing
integration synergies. Such synergies are achieved by strengthen-
ing four collaborative links—(1) between production and sales
divisions, (2) between business segments, (3) between business
segments and corporate divisions, and (4) globally, between
parent factories in Japan and overseas facilities—as well as by
harmonizing business, product and regional strategies.
Through the two aspects of the Front-line Priority framework
and the four collaborative links within the Strong Synergistic
Corporate Network framework, the Group is implementing
Balanced Corporate Management that involves promoting
growth strategies, strengthening its management foundation,
improving its financial standing and undertaking CSR- and
corporate governance-related initiatives.
Growth StrategiesThe Mitsubishi Electric Group promotes the VI Strategy, which
aims to make strong businesses stronger, and the AD Strategy,
which is designed to reinforce solutions centered on strong
businesses. In line with these growth strategies, in order to realize
the objective of ensuring growth compatible with profitability
by making strong businesses stronger globally, the Group is
promoting individual business strategies and bolstering regional
strategies, with a priority on Asia. Aiming at further growth,
the Group is working to develop technologies that continuously
enable its strong businesses to become even stronger, promoting
compatibility between a low-carbon society and prosperous
lifestyles. As it moves forward, the Group is also pressing ahead
in all aspects of its efforts to strengthen global strategies with the
purpose of maintaining sustainable growth as it strives for further
global success.
Essential Growth Strategies: Promoting the VI Strategy and the AD Strategy
TransportationSystems
Power Devices
Elevators andEscalators
Optical BroadbandAccess Systems
Power Systems
Satellites
Factory AutomationProducts
Network SecuritySystems
Electric and ElectronicProducts for Automobiles
Air Conditioning andHousing Products
VI Growth Strategy1
Make Strong Businesses Stronger
AD Growth Strategy 2
Reinforce Solutions Businesses Centered on Strong Businesses
Display Solutions
Energy ConservationSolutions for Entire Buildings
Total SecuritySolutions
Smart CommunitiesSmart Grids
Low-carbonSolutions
1 “VI” derives from “VICTORY”2 “AD” derives from “ADVANCE”
MITSUBISHI ELECTRIC CORPORATION ANNUAL REPORT 2011 05

Growth Strategy: Strengthening Global StrategiesAs part of its efforts to fortify its business systems to make strong
businesses stronger globally, the Mitsubishi Electric Group contin-
ues to invest capital in existing business bases, for example, build-
ing a new transformer plant in the United States. In addition, the
Group is establishing manufacturing companies—such as factory
automation systems and automotive equipment makers in
China—to serve rapidly growing markets, and setting up new
sales companies to tap into new markets in India and Vietnam.
Beyond this, the Group will continue to carry out M&A to create
synergies and expand its businesses, as seen in the acquisition of
the power device-related business, Vincotech Holdings S.a.r.l.,
in November 2010.
Growth Strategy: Promoting Individual Business StrategiesRegarding the businesses within the Group that possess notewor-
thy growth potential (power systems, transportation systems,
building systems, factory automation systems, automotive equip-
ment, space systems, power devices, air-conditioning systems
and photovoltaic systems), the Mitsubishi Electric Group will
expand such businesses to be a driving force of Group-wide
performance, by implementing and augmenting global business
promotion systems, while reinforcing market strategies in priority
markets. Through such actions, the Group is contributing to the
improvement of corporate value.
Direction of Growth Strategies: Pursuing ever higher growth through ongoing efforts to strengthen businesses
Power DevicesFactory Automation SystemsPower Systems
Air-conditioningSystems
AutomotiveEquipment
Transportation Systems
PhotovoltaicSystemsSpace SystemsBuilding Systems
India StrategyChina Strategy
Promoting technological development to continuously
make strong businesses stronger
Compatibility between a Low-carbon Society and
Prosperous Lifestyles
Achieving profitable growth by making strong businesses stronger globally
Promoting Individual Business Strategies
Bolstering Regional Strategies with a Priority on Asia
Bolstering Global Strategies
Smart CommunitiesSmart Grids
SiC Power Devices
Automotive Equipmentfor Electric &
Hybrid Electric Vehicles
Growth Strategy: Bolstering Regional Strategies with a Priority on AsiaThe Mitsubishi Electric Group will bolster cross-business
regional strategies with a priority on Asia in response to newly
emerging markets, which are anticipated to experience high
growth rates. In the Chinese market, where it has already
established numerous businesses and built a solid foundation,
the Group will apply its overall strength to the further expansion
of its operations by strengthening collaborative links between its
operating bases as well as its businesses. The Group will also take
steps to augment partnerships between leading business groups
in China. In India, where the time is ripe for a full-scale entry, the
Group will tap into growing markets by leveraging strong global
businesses, particularly within the Energy and Electric Systems
and Industrial Automation Systems business segments.
Growth Strategy: Compatibility between a Low-carbon Society and Prosperous LifestylesThe Mitsubishi Electric Group is actively working to realize an
”eco-electricity community,” one that aims to foster compatibility
between a low-carbon society and safe, prosperous lifestyles.
To that end, the Group is combining its business expertise in all
areas, from power systems to home appliances, to optimize
energy usage communitywide based on the best possible mix of
energy sources, which includes maximizing the use of natural
sources of energy. Turning to future-oriented research and
06 MITSUBISHI ELECTRIC CORPORATION ANNUAL REPORT 2011

technological development measures, the Group is, in coordina-
tion with its Amagasaki, Wakayama and Ofuna facilities,
constructing experimental smart grid equipment internally that
anticipates the distribution networks to be developed in the
future. In the Ofuna facility, the Group will take steps to verify
the concept of ”painless electricity conservation” by building
a ”smart house” equipped with a photovoltaic system,
all-electric-powered home equipment and a Home Energy
Management System (HEMS), in order to demonstrate the
concurrent viability of zero-emission, energy-saving residential
housing that is comfortable, safe and secure.
The Mitsubishi Electric Group has developed power devices
that use silicon carbide (SiC); these energy-saving key devices
efficiently regulate power usage and help contribute to the
realization of a low-carbon society. Consequently, the Group
became the first in the world to successfully develop the Full
SiC-IPM in February 2011, which achieves both low power loss
and high reliability. By continuing to utilize the capabilities of its
devices to the utmost extent while ensuring performance and
reliability, the Group will strengthen the applications of its tech-
nologies in a wide array of power electronics products. Such
products range from air-conditioners, refrigerators and other
home appliances to photovoltaic systems, industrial equipment,
electric/hybrid automobiles, railcars, and power equipment.
Strengthening Our Management FoundationThe Mitsubishi Electric Group consistently promotes Group-wide
operational improvement measures, taking active steps to further
solidify its operational structure.
To this end, we constantly strive to reinforce the ”craftsman-
ship” that is integral to our foundations as a manufacturer. In
order to achieve this objective, we are always looking to enhance
productivity and quality, to promote prioritized development
rooted in growth strategies, to strengthen our R&D capabilities
and the development of strategic IP activities by promoting such
initiatives as the development of key components, and to
improve material procurement by bolstering value analysis (VA)
and other activities. Furthermore, we are working to improve our
financial standing through measures that include inventory
reduction and striving to allocate human resources effectively,
underpinned by the aim to make strong businesses stronger.
The Mitsubishi Electric Group will continuously and resolutely
promote these initiatives and make every effort to strengthen
quality, cost efficiencies, production technology capabilities,
development capabilities, IP activities, and sales and services,
with the goal of further boosting profitability.
Improving Our Financial StandingAs of March 31, 2011, total interest-bearing debt, including
bonds, stood at ¥484.4 billion for a ratio of interest-bearing debt
to total assets of 14.5%.
The Mitsubishi Electric Group is implementing comprehensive
structural reforms to increase the competitiveness and earnings
of all Group businesses. To raise overall profitability, we are
striving to boost competitiveness in the areas of quality, costs,
production technology capabilities, development capabilities, IP,
marketing and services. In addition, in order to streamline asset
turnover and the efficiency of funding operations, we are reduc-
ing inventories, primarily through ”just in time” activities, while
expanding our global cash management system. These initiatives
are aimed at generating stable cash flow.
With accumulated cash flow, we are taking a balanced
approach to reduce interest-bearing debt, provide returns to
shareholders through increased dividends, and invest in
growth areas.
Striving for Constant ImprovementBased on its Balanced Corporate Management policy, the
Mitsubishi Electric Group is steadily implementing the aforemen-
tioned management strategies, which are designed to enhance
the formidable competitiveness of its individual businesses.
At the same time, we continue to implement reforms intended to
guide our ongoing evolution into a network of highly competi-
tive, electric-electronic businesses while leveraging synergies to
further enhance corporate value and ensure sustainable growth.
To accomplish these goals, it is increasingly important that we
strive for constant improvement, which puts into practice the
spirit that is embodied in our corporate statement, ”Changes for
the Better.” The Mitsubishi Electric Group will continue to change
in order to create new value. We are confident these efforts will
yield even greater corporate value in the future.
MITSUBISHI ELECTRIC CORPORATION ANNUAL REPORT 2011 07

At a Glance
Energy and Electric Systems Industrial Automation Systems Information and Communication Systems
2010
MAIN PRODUCTS AND BUSINESS LINES
Turbine generators, hydraulic turbine generators, nuclear power plant equipment, motors, transformers, power electronics equipment, circuit breakers, gas insulated switches, switch control devices, surveillance system control and security systems, large display devices, electrical equipment for locomotives and rolling stock, elevators, escalators, building security systems, particle beam treatment systems, and others
0
1,200
1,000
800
600
400
200
07 08 09 10 11
1,058 1,044 1,0281,040
Yen (billions)
(Years ended March 31)
951
Net sales
0
1,200
800
1,000
600
400
200
1,018
852957
733
927
07 08 09 10 11
Yen (billions)
(Years ended March 31)
Net sales
-30
150
90
120
60
30
0
07 08 09 10 11
Yen (billions)
(Years ended March 31)
69 75 75
49
83
Operating income
-30
150
90
120
60
30
0
07 08 09 10 11
Yen (billions)
(Years ended March 31)
100
125 129
50
26
Operating income
MAIN PRODUCTS AND BUSINESS LINES
Programmable logic controllers, inverters, servomotors, human-machine interface, motors, hoists, magnetic switches, no-fuse circuit breakers, short circuit breakers, transformers for electricity distribution, time and power meters, uninterruptible power supply, industrial fans, computerized numerical controllers, electrical discharge machines, laser processing machines, industrial robots, clutches, automotive electrical equipment, car electronics and car mechatronics, car multimedia, and others
MAIN PRODUCTS AND BUSINESS LINES
Wireless and wired communications systems, surveillance cameras, satellite communications equipment, satellites, radar equipment, antennas, missile systems, fire control systems, broadcasting equipment, data transmission devices, network security systems, information systems equipment, systems integration, and others
0
1,200
1,000
800
600
400
200
07 08 09 10 11
Yen (billions)
(Years ended March 31)
488
688 644582
526
Net sales
Yen (billions)
-30
150
90
120
60
30
0
07 08 09 10 11(Years ended March 31)
21
219 14
25
Operating income
Fiscal 2011 Overview
July•Reachedanagreementtoconsolidatethehydroelectric
powergenerationsystemoperationsofHitachi,MitsubishiElectricandMitsubishiHeavyIndustries
•Delivered14,368PVcellmodules(approximately2.7MW)toButteCollegeinCalifornia
•Completedconstructionofanewplantforproducingcompressorsusedinindustrialairconditionersandchillers
September•Receivedanorderforheavyparticlebeam
cancertreatmentequipmentfromtheSAGAHeavyIonMedicalAcceleratorinTosu(SAGAHIMAT),thefirstprivatefacilityinJapantointroducethisequipment
May•Investedapproximately¥7billionoverthetwo-yearfiscal
2011–2012periodfortheconstructionofexperimentalsmartgridfacilitieswithintheCompany’sproductionsitesandannouncedthecommencementofrelatedtesting
•EstablishedtheMitsubishiElectricGroupBiodiversityActionGuidelines
•Developedtheworld'sfirstinjectorwithoutmagnets,basedontheProtonAlternativePhaseFocusing(APF)systemforparticlebeamtreatmentsystem(ProtonType) Newcompressorfactory ImageofthecompletedSAGAHIMAT
June•CommencedoperationofJapan’sfirst
large-scale,high-purityplasticrecyclingsystem•Announced“EcoChanges-foragreener
tomorrow,”theoverseasexpansionoftheGroup’senvironmentalstatement,“EcoChanges,”whichcommencedinJuly2010
August•Deliveryofanozonetreatment
systemtotheHanshinWaterSupplyAuthority’sAmagasakiWaterPurificationFacility
GreenCycleSystemsCorporation’sheadquartersandplant
08 MITSUBISHI ELECTRIC CORPORATION ANNUAL REPORT 2011

Electronic Devices Home Appliances Others
2011
MAIN PRODUCTS AND BUSINESS LINES
Power modules, high-frequency devices, optical devices, LCD devices, microcomputers, system LSIs, and others
MAIN PRODUCTS AND BUSINESS LINES
LCD televisions, projection TVs, display monitors, projectors, DVD players and recorders, room air conditioners, package air conditioners, air-to-water heat pump boilers, refrigerators, electric fans, ventilators, photovoltaic systems, hot water supply systems, LED lamps, fluorescent lamps, indoor lighting, compressors, chillers, humidifiers, dehumidifiers, air purifiers, showcases, cleaners, jar rice cookers, microwave ovens, IH cooking heaters, and others
MAIN PRODUCTS AND BUSINESS LINES
Procurement, logistics, real estate, advertising, finance and other services
Net sales
0
1,200
1,000
800
600
400
200
07 08 09 10 11
Yen (billions)
(Years ended March 31)
1,000
825922 916 924
Net sales
0
1,200
1,000
800
600
400
200
07 08 09 10 11
Yen (billions)
(Years ended March 31)
609631 661596 553
Net sales
-30
150
90
120
60
30
0
07 08 09 10 11
12 8-30 -7 6
Yen (billions)
(Years ended March 31)
Operating income (loss)
-30
150
90
120
60
30
0
07 08 09 10 11
Yen (billions)
(Years ended March 31)
42
66
35
523
Operating income
Yen (billions)
(Years ended March 31)
-30
150
90
120
60
30
0
07 08 09 10 11
1415 17 123
Operating income
FebruaryCelebrated the Company’s 90th anniversary
•AnnouncedtheestablishmentofanewplantattheU.S.subsidiaryMitsubishiElectricPowerProducts,Inc.alongwithaninvestmentofapproximately¥18.0billiontoaugmentthatcompany’selectrictransformerbusiness
•DisclosedtheCompany’slatestR&Dresultstothepressandsecuritiesanalysts(SiCpowerdevices,smartgridsetc.;18itemsincluding5newitems)
•ConcludedanagreementwithShanghaiElectricGroupCompanyLimitedtoestablishajointventuretoengageinthedevelopmentanddesignofenergy-savingandfactoryautomationsystems
November•Deliveredatotalof
approximately23,500LEDspotlightsforuseinall254storesofKonaka,aJapaneseclothingchain
•MitsubishiElectricandTheGoresGroupenteredintoasharepurchaseagreementontheacquisitionofVincotechHoldingsS.a.r.l.,amanufacturerofelectroniccomponentsbasedinGermany.
LEDspotlight(EL–S600L / W–K)
January•Announcedtheaimof
“Becomingaglobal,leadinggreencompany,enrichingsocietywithtechnology”inanticipa-tionoftheCompany’s100thanniversary
March•DeliveredoneofShikoku'slargesthigh-definitionvideodisplays
(DiamondVision)toNarutoOtsukaSportsParkPocariSweatStadium,homeoftheJ.LeaguesoccerclubTOKUSHIMAVORTIS
•ReceivedordersfortheTurkishcommunicationsatellites,Türksat–4AandTürksat–4B,fromTürksatSatelliteCommunication,CableTVandOperationA. .
•Announcedtheestablishmentofanewcompanytomanufactureandsellequipmentforelectricpowersteering,carmultimediaproductsandotherautomotiveequipmentinChina
October•Establishedthecomprehensivesales
companyMitsubishiElectricIndiaPvt.Ltd.,whichincorporatestheGurgaonandBangalorebranchesheldbyMitsubishiElectricAsiaPte.Ltd.
DiamondVisiondisplayinoperation
AnimageoftheTürksat–4AandTürksat–4B
0
1,200
1,000
800
200
400
600
07 08 09 10 11
Yen (billions)
(Years ended March 31)
186 192 167 139 176
MITSUBISHI ELECTRIC CORPORATION ANNUAL REPORT 2011 09

Review of Operations
Train Vision SystemIntegratingthemostadvancedinformationtechnologies,MitsubishiElectricintroduceditsTrainVisionSystemforthebenefitandcomfortofrailpassengers.Offeringsharpandvibrantpicturequality,LCDunitsinstalledabovecarriagedoorsdisplayvideo,advertisements,destinationguidesandotherdata.Thissubstantialvolumeofdataispresentedseam-lessly,withtheunitsbeingupdatedfromremotebasestations.
Diamond Vision OLEDMeasuringsixmetersindiameter,thisDiamondVisionOLEDistheworld’sfirstlarge-scalesphericaldisplaysystem*touseorganiclight-emittingdiode(OLED)panels.Thisdisplaysystemhasbeenusedtocreate”Geo-Cosmos,”anOLEDdisplayglobedevelopedbytheNationalMuseumofEmergingScienceandInnovation.Incorporatingmorethan10,000ofthemostadvancedOLEDpanels,Geo-Cosmosissuspendedinmidair,allowingviewerstoseetheconstantlychangingfaceoftheEarth.*AsofJune3,2011
Southern Tohoku Proton Therapy Cancer Center Particle Beam Treatment System Proton TypeThiscutting-edgesystemuseslinearprotonsandheavy-parti-clebeamstotargettheaffectedareas.Easieronpatients,thistreatmentmethodisexpectedtohelpimprovequalityoflife.
Power PlantsMitsubishiElectricpowerplantinstallationsareusedbypowercompaniesandasin-housepowergeneratorsinvariousindustries.Proveninthefield,theyareoptimalpowerplantsforhydroelectric,thermalandnuclearapplications.
AXIEZ Machine-room-less ElevatorsAlongwithenhancedenergy-savingfunctions,includingall-LEDlighting,theAXIEZ’svariable-speedcontrolelevatorsys-temreduceswaitingtimesthankstoadvancesinleading-edgespeedadjustmenttechnology.Thistechnologyhasevolvedintoasupervariablespeedcontrolsystemforimprovedconve-nienceandoperationalefficiency.TheAXIEZalsofeaturesanimproveddesign.
Facima BA-System, an Open Integrated Management System for Building FacilitiesTheFacimaBA-Systemcentrallycontrolsbuildingfacilitiesandequipmentthroughopenmanagementintegrationthatiscom-patiblewithfacilitiesandequipmentmadebydifferentmanu-facturers.Owingtoitsenhancedfunctionsandsupportmenu,rangingfromenergysavingtoefficientbuildingmanagementoperations,theFacimaBA-Systemoffersanewstyleofbuild-ingmanagement.
The social infrastructure systems business
saw year-on-year decreases in orders and
sales mainly due to a fall in large-scale proj-
ects in energy systems businesses, despite
growth in the electrical equipment for
rolling stock business in Japan and abroad.
The building systems business experi-
enced an increase in orders and sales
compared with the previous fiscal year due
to a gradual recovery in demand for
elevators and escalators in Japan and
increasing demand for the same products
in China and ASEAN countries.
As a result, total sales in the Energy and
Electric Systems segment amounted to
¥1,027.7 billion, a 1% dip from the previ-
ous fiscal year, but operating income rose
by ¥8.3 billion year on year to ¥83.1 billion,
owing primarily to cost improvements.
Net Sales
¥1,027.7billion
(down 1% year on year)
Operating Income
¥83.1billion
(up ¥8.3 billion year on year)
Energy and Electric Systems
24.8%
Net Sales Breakdown by Business Segment
10 MITSUBISHI ELECTRIC CORPORATION ANNUAL REPORT 2011

Industrial Automation Systems
Programmable Logic ControllersMitsubishiElectric’sMELSECseriesofprogrammablelogiccontrollerssupportsawidearrayofproductionlinesandsocialinfrastructureequipment,fromcontroldevicestosafetyassur-ance,informationprovisionandinstrumentationoperations.Japan’stopbrand,theMELSECseriescontributestotheconstructionofleading-edgesystems,owingtoitscapabilities,performance,productvarietyandhighreliability.
AC ServosTheMELSERVO-J3seriesfeaturestheindustry’sfastestACservoamplifiers,boastinghighperformanceandcapability.Functioningasdrivesourcesthatcontributetohigherlevelsofspeedandprecisioninproductionequipmentandmanufactur-ingdevices,theMELSERVO-J3serieshasapplicationsinnumerousfields,includingsemiconductors,FPDproductionandtransportequipment,andindustrialmachinery.
Computerized Numerical ControllersTheworld’sfirstequipmentforeffectivecontrolatthenano-meterlevel,enablingfasterandmorepreciseprocessing.Theycontributetohigherproductivityinautomotive,ITandotherindustries.
No-fuse Circuit Breakers and Earth Leakage Circuit BreakersNo-fusecircuitbreakersandearthleakagecircuitbreakersareusedforwiringprotectionandshort-circuitprotectioninlow-voltagecircuits.MitsubishiElectricoffersawidevariationofproducts,includingitsbrandnew”WS-V”series,forbothpowerdistributionandOEMmarkets.
Memory Car Navigation SystemMitsubishiElectric’smemorycarnavigationsystemallowsuserstoexperiencehigh-definition,full-segmentterrestrialdigitalbroadcastswhilebeingeasytooperate.Navigationandaudiooperationshavebeencombinedintotouchpaneliconsthatmakethesystemsimpletouse.Inaddition,thesystemdelivershigh-definitionmapdisplaysthathaveevolvedfromtheCompany’scoreHDDnavigationfunctions.
ETC Equipment for VehiclesToeasetheinsertionandextractionofETC(ElectronicTollCollection)cardsintherelativelydiminteriorofavehicle,LEDlightinghasbeencombinedintotheindicatorandcardinsertionslot.Withitsstrikinglydelicatecurves,thisproductrealizesadesignthatbeautifullycomplementscontouredvehicleinteriors.
Net Sales
¥927.0billion
(up 26% year on year)
Operating Income
¥100.1billion
(up ¥74.0 billion year on year)
The factory automation systems business
experienced an increase in orders and sales
compared with the previous fiscal year
thanks to expanded demand in the Asian
market, beginning with industrial machinery
in China as well as rising flat panel display-
and semiconductor-related capital expendi-
tures in South Korea and Taiwan.
The automotive equipment business saw
rises in excess of those of the previous fiscal
year both in orders and sales due to
increased demand in individual markets,
including China and India. This occurred
despite indications of decreasing demand
following the termination of promotional
incentives in certain markets in Japan and
Western Europe.
As a result, total sales in the Industrial
Automation Systems segment were ¥927.0
billion, a 26% increase year on year. Owing
to this rise and other factors, operating
income improved ¥74.0 billion to ¥100.1
billion.
Net Sales Breakdown by Business Segment
22.3%
MITSUBISHI ELECTRIC CORPORATION ANNUAL REPORT 2011 11
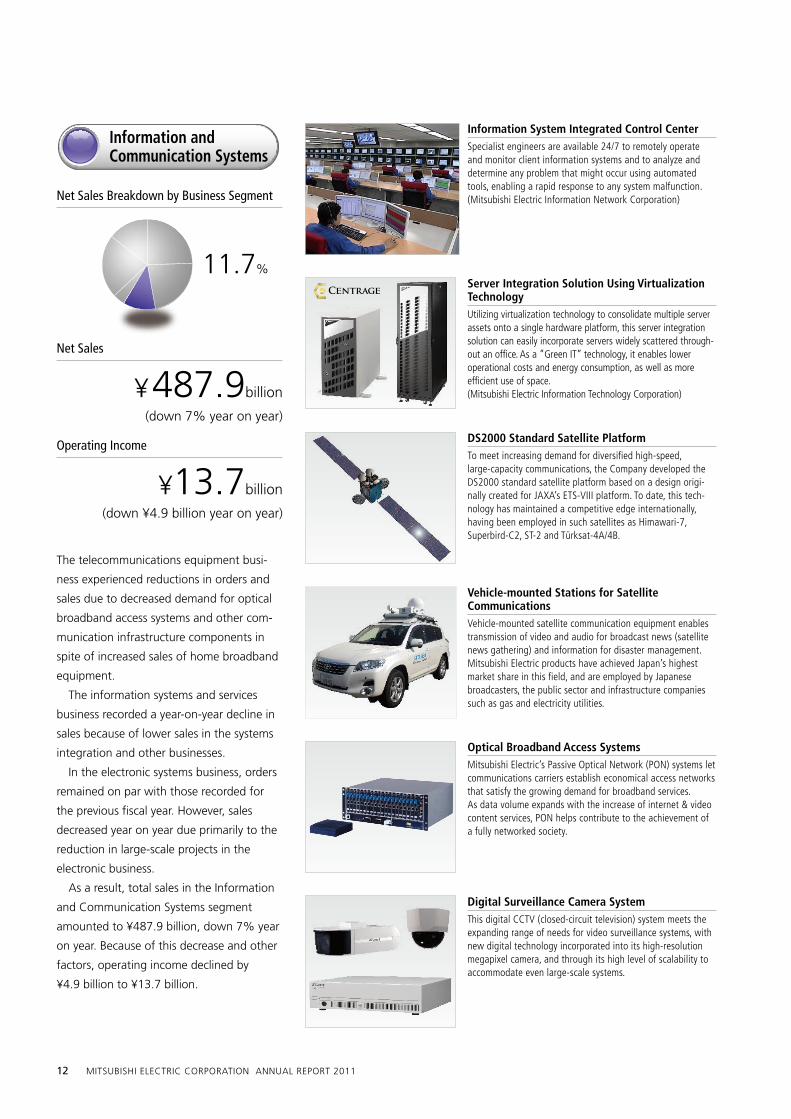
Information System Integrated Control CenterSpecialistengineersareavailable24/7toremotelyoperateandmonitorclientinformationsystemsandtoanalyzeanddetermineanyproblemthatmightoccurusingautomatedtools,enablingarapidresponsetoanysystemmalfunction.(MitsubishiElectricInformationNetworkCorporation)
DS2000 Standard Satellite PlatformTomeetincreasingdemandfordiversifiedhigh-speed,large-capacitycommunications,theCompanydevelopedtheDS2000standardsatelliteplatformbasedonadesignorigi-nallycreatedforJAXA’sETS-VIIIplatform.Todate,thistech-nologyhasmaintainedacompetitiveedgeinternationally,havingbeenemployedinsuchsatellitesasHimawari-7,Superbird-C2,ST-2andTürksat-4A/4B.
Vehicle-mounted Stations for Satellite CommunicationsVehicle-mountedsatellitecommunicationequipmentenablestransmissionofvideoandaudioforbroadcastnews(satellitenewsgathering)andinformationfordisastermanagement.MitsubishiElectricproductshaveachievedJapan’shighestmarketshareinthisfield,andareemployedbyJapanesebroadcasters,thepublicsectorandinfrastructurecompaniessuchasgasandelectricityutilities.
Optical Broadband Access SystemsMitsubishiElectric’sPassiveOpticalNetwork(PON)systemsletcommunicationscarriersestablisheconomicalaccessnetworksthatsatisfythegrowingdemandforbroadbandservices.Asdatavolumeexpandswiththeincreaseofinternet&videocontentservices,PONhelpscontributetotheachievementofafullynetworkedsociety.
The telecommunications equipment busi-
ness experienced reductions in orders and
sales due to decreased demand for optical
broadband access systems and other com-
munication infrastructure components in
spite of increased sales of home broadband
equipment.
The information systems and services
business recorded a year-on-year decline in
sales because of lower sales in the systems
integration and other businesses.
In the electronic systems business, orders
remained on par with those recorded for
the previous fiscal year. However, sales
decreased year on year due primarily to the
reduction in large-scale projects in the
electronic business.
As a result, total sales in the Information
and Communication Systems segment
amounted to ¥487.9 billion, down 7% year
on year. Because of this decrease and other
factors, operating income declined by
¥4.9 billion to ¥13.7 billion.
Net Sales
¥487.9billion
(down 7% year on year)
Operating Income
¥13.7billion
(down ¥4.9 billion year on year)
Information and Communication Systems
Net Sales Breakdown by Business Segment
Server Integration Solution Using Virtualization TechnologyUtilizingvirtualizationtechnologytoconsolidatemultipleserverassetsontoasinglehardwareplatform,thisserverintegrationsolutioncaneasilyincorporateserverswidelyscatteredthrough-outanoffice.Asa”GreenIT”technology,itenablesloweroperationalcostsandenergyconsumption,aswellasmoreefficientuseofspace.(MitsubishiElectricInformationTechnologyCorporation)
Digital Surveillance Camera SystemThisdigitalCCTV(closed-circuittelevision)systemmeetstheexpandingrangeofneedsforvideosurveillancesystems,withnewdigitaltechnologyincorporatedintoitshigh-resolutionmegapixelcamera,andthroughitshighlevelofscalabilitytoaccommodateevenlarge-scalesystems.
11.7%
12 MITSUBISHI ELECTRIC CORPORATION ANNUAL REPORT 2011

Electronic DevicesJ-Series Power Modules for VehiclesCurrentlyunderdevelopment,theJ-SeriesIPM1,designedforoptimumperformanceandsafety,andtheJ-SeriesT-PM2(showninphoto),whichincorporatesMitsubishiElectric’suniqueDLB3constructionforhighreliability,provideoptimalmotordriveperformanceforhybridandelectricvehicles.1IntelligentPowerModule:Apowermodulethatfeaturesdriveand
protectionfunctions2TransferMoldedPowerModule3DirectLeadBonding:Internalconnectiontechnologyinvolvingsolderingthe
mainterminaltothepowerchip
V1 Series High-output IPMs for Motor Drive and Control EquipmentFeaturingIGBT1switchingelementsthatincorporatethelow-power-lossCSTBT™2,V1Serieshigh-outputIPMsreducepowerlosscomparedtoconventionalinverters,andimproveprotectionagainstoverheatingwhilerealizingsizereductionsandhighercapacityforgeneralindustrialequipmentmotordrivesandcontrollers.1InsulatedGateBipolarTransistor:Apowerswitchingsemiconductor2CarrierStoredTrench-GateBipolarTransistor:AtrademarkedMitsubishi
ElectricIGBTthatincorporatestheCompany’saccumulatedcarrierexpertise
40Gbps DQPSK Quad PD ModuleThe40GbpsDQPSK*QuadPDmoduleisanopticalcommuni-cationsmoduleoptimizedforsendinglargevolumesofdatabetweendistantmetropolitanareas.Itboastsreductionsinsizeandpowerconsumptionwhilemaintainingtransmissionquality.ThesefeaturesaremadepossiblebyintegratingallthenecessaryelementsforDQPSKformatcommunicationsintoonepackage.*DifferentialQuadraturePhaseShiftKeying
GaN HEMT High-output Amplifier for C-band SatelliteMitsubishiElectrichasdevelopedaGaN1HEMT2high-outputamplifierthathasachievedtheworld’shighestpowerefficiencyratingof67%byincorporatingtheworld’sfirstharmonictuningcircuits3inGaNHEMTcells.Thisamplifierisexpectedtoenablesmaller,lighterandmoreenergy-efficienttransmittersforcommunicationsatellites,launchesofwhichareincreasingduetoreneweddemand.1GalliumNitride2HighElectronMobilityTransistor3AsofMay26,2011;basedoninternalresearchonthesatellite-mounted
GaNHEMThigh-outputamplifier
5.0-inch WVGA Color TFT LCD ModulesBeingtheworld’sfirst5.0-inchWVGAColorTFTLCDmodule*torealizealuminanceof800cd/m2(standardvalue,assuminganormal25°Cambienttemperature),thiscolorTFTLCDmoduleensuresgoodvisibilityoutdoors,featuresa170-degree(horizontal/vertical)super-wideviewingangle,andisoptimalforsmalloutdoor-usemobiledevices.*AsofApril,2011;basedoninternalresearch
9.0-inch QHD Color TFT LCD ModuleThe9.0-inchQHDcolorTFTLCDmoduleachievesquarterhighdefinition(QHD)(960x540)format,whichprovideshalftheresolutionoffullHD*screensbothhorizontallyandvertically.ThemoduleminimizesdegradationoffullHDresolutionandisoptimalformonitorsinbroadcastingstationsthatusefullHD.*Full-sizehigh-definitionresolution:horizontal1920xvertical1080pixels
Net Sales
¥175.9billion
(up 27% year on year)
Operating Income
¥5.9billion
(up ¥13.0 billion year on year, profitable)
The semiconductor business experienced
year-on-year increases in orders and sales
owing to a rise in demand for industrial-,
commercial-, railway-, and automotive-use
power modules as well as optical transmis-
sion devices.
Orders and sales in the LCD module busi-
ness were above those of the previous fiscal
year thanks to expanded demand for indus-
trial-use and vehicle-mounted products.
As a result, total sales in the Electronic
Devices segment stood at ¥175.9 billion,
up 27% year on year. Owing primarily to
this increase in sales, operating income
improved by ¥13.0 billion to ¥5.9 billion.
Net Sales Breakdown by Business Segment
4.2%
MITSUBISHI ELECTRIC CORPORATION ANNUAL REPORT 2011 13

Uni & Eco ChangesInworkingtowardthegoalofcreatingasustainablesociety,MitsubishiElectricendeavorstocreatehomeappliancesthatareenergysavingandecologicallycompatible(’Eco’),withadvancedrecyclability.TheCompanyalsoutilizesuniversaldesignprinciples(’Uni’),includingitsownunique”RakuRaku-UD”(universaldesignforgreatereaseandcomfort)features,andappliesitsmanufacturingknow-howtodevelopproductsthatdelivereaseofuseforallages.Theseprinciplesarereferredtocollectivelyas”Uni&Eco.”
Customers
Home Appliances Used Home Appliances
Metals, Glass Plastics
Single-materialPlastic
Mixed Plastic
MaterialsManufacturers
PP, PS, ABS
Closed LoopRecycling
Hyper Cycle Systems Corporation(HCS)
MitsubishiElectric Corporation
Green Cycle Systems Corporation(GCS)
Home Appliance RecyclingMitsubishiElectrichassuccessfullydevelopedatechnologyforautomaticallyseparatingoutthethreeprimarytypesofplasticusedinhomeappliances(PP,PSandABS)fromshreddedmixedplasticsoriginallyfromend-of-lifehomeappliances.ThistechnologyhasenabledtheCompanytomakesubstantialimprovementsinplasticrecyclingratios.
Sales in the Home Appliances segment
increased by 12% year on year to ¥924.5
billion. This result was attributable to the
following factors: a rise in sales of air
conditioners both in Japan and abroad
following last summer’s heat waves; growth
in domestic demand for consumer-use air
conditioners, LCD televisions, and refrigera-
tors due to a last-minute surge in response
to a change made in the eco-point system
for consumer electronics during the third
quarter; and increased sales of photovoltaic
(PV) systems in Japan and abroad owing
mainly to the impact of government
subsidies and other stimulus programs
introduced in various countries.
As a result of this increase in sales and
other factors, operating income improved
by ¥37.2 billion compared with the previous
fiscal year to ¥42.0 billion.
Net Sales
¥924.5billion
(up 12% year on year)
Operating Income
¥42.0billion
(up ¥37.2 billion year on year)
Home Appliances
Net Sales Breakdown by Business Segment
Air Conditioners and Home Appliance LineupBasedontheprinciplesof”Uni&Eco,”andkeywordssuchasenergy-saving,comfortableandclean,MitsubishiElectricstrivestodevelopproductsthatprovidebothadvancedfunctionalityand”RakuRaku-UD”usability.
Digital SignageMitsubishiElectricoffersafulllineupofvisualdisplayproducts,includinghigh-brightness,high-resolutionprojectors,large-screenLCDpublicdisplaysandmultiplelarge-screensystems.Throughtheseproducts,theCompanyisprovidingsolutionsformeetingrooms,schools,retailstoresandotherindoorvenues,aswellasforawiderangeofbusinessesandapplications,suchastrainstationsandpublicfacilities.
All-electric-powered Home-use ProductsWorkingtoachieveco-existencewiththeenvironmentandrealizearecycling-basedsociety,MitsubishiElectricstrivestocreatehigh-quality,long-lastingproductsforall-electric-poweredhome-useproducts,withadvantagesincludingenhancedcomfortandenergysavings.
LED LightingCurrentlyseeingrapiddevelopment,LEDspossessoutstandingfeaturesthatexpandlightingpossibilities,includinglongevity,lowpowerconsumption,absenceofmercuryandtheenablingofmorecompactfixtures.LEDsalsosignificantlycontributetopowerconservationefforts.
22.3%
14 MITSUBISHI ELECTRIC CORPORATION ANNUAL REPORT 2011

Research and Development / Intellectual Property
R&D InitiativesThe Mitsubishi Electric Group’s R&D network comprises the
Advanced Technology R&D Center, Information Technology R&D
Center, and Industrial Design Center in Japan and laboratories in
the United States and Europe. These centers operate under the
umbrella of the Corporate Research and Development Group,
working in collaboration with the development departments in
individual business groups.
Amid business conditions that remain uncertain due mainly to
intensifying global competition, the expansion of newly emerging
markets and the impact of the recent natural disaster in Japan on
economic activities, the Corporate Research and Development
Group is undertaking development activities in tandem with each
business group to thoroughly strengthen strong businesses and
products. The Corporate Research and Development Group is also
redoubling development initiatives that play a role in increasing
future growth, while making exhaustive efforts to bolster its core
technologies.
Regarding R&D based on the VI Strategy—which makes strong
businesses stronger in such areas as factory automation equip-
ment, elevators and escalators, automotive equipment, power
systems, transportation systems, and air-conditioning systems—
the Mitsubishi Electric Group is increasing its technological capa-
bilities in order to differentiate itself from other companies and
maintain its competitive edge in international markets. In addi-
tion, the Group is promoting activities that increase the number
of new, profitable businesses. Under the AD Strategy, which aims
at bolstering the solutions business centered on these strong
businesses, the Group will integrate various products and tech-
nologies related to energy-efficient buildings and digital signage
as it moves forward with development activities that create new
solution-based products and services.
From the standpoint of preserving the global environment, the
Group is aggressively addressing technological challenges related
to smart grids, power devices, photovoltaic (PV) power genera-
tion systems, heat pump applications and other energy and
environmental businesses. Such initiatives are being undertaken
with the aim of realizing the Group’s Environmental Vision 2021.
Through these efforts, Mitsubishi Electric is helping to achieve a
sustainable society by combining leading technologies from its
wide array of business fields and by developing energy-saving
products and systems.
To support global business development, we are pressing
ahead with intellectual property and international standardization
activities that link together our business and development
strategies as we undertake technological development. At the
same time, we are pursuing active collaboration with industry,
academia and government concerns through joint research with
leading Japanese and international institutions as well as national
projects in Japan.
R&D Achievements in Fiscal 2011Wireless Mesh Network Technology for Advanced Meter InfrastructureMitsubishi Electric has developed wireless mesh network technol-
ogy for smart meter systems that realizes low-power data trans-
mission and lower setup costs compared to wired communication
systems. By controlling wireless signal transmission timing, the
technology enables automatic meter reading every 30 minutes
with high reliability for up to approximately 500 smart meters1.
Mitsubishi Electric’s wireless mesh network technology employs
a unique transmission scheduling algorithm to maintain the mesh
network with less maintenance traffic. Beginning with the
practical use of this technology in the smart meter systems that
are vital to smart grids, Mitsubishi Electric will expand this
technology into such data consolidation system applications as
factory and public facility management along with energy usage
visualization tools.
The World’s First2 Full SiC3-IPM4 with Built-in Drive Circuits and Protection CircuitsMitsubishi Electric has developed the world’s first Full SiC-IPM fea-
turing power semiconductor elements composed entirely of SiC
materials. Compared with conventional Si-IPM modules, in which
semiconductor elements are composed of Si, our Full SiC-IPM
achieves an approximately 70% reduction in inverter power loss
and a 50% smaller module volume5. In addition to promoting the
commercialization of this type of Full SiC-IPM, Mitsubishi Electric
will take steps to improve the power efficiency of various types of
equipment by installing the Full SiC-IPM in products such as
general industrial electrical equipment, elevators and escalators,
and PV inverters for photovoltaic power generation.
Next-generation electronic meters Remote meters
Concentrator*
Realizes stable, automatic monitoring of up to 500 metering units
Wide-area transmission network
*Concentrator: A device that links together multiple circuits
Research and Development
MITSUBISHI ELECTRIC CORPORATION ANNUAL REPORT 2011 15

The World’s Smallest and Lightest6 Motor Controller Unit for Automotive Electric Power SteeringMitsubishi Electric has developed the world’s smallest and lightest
motor controller unit for automotive electric power steering. This
unit’s volume is approximately 50% lower and its mass is about
30% less compared with the Company’s conventional products
with equal output. These improvements were achieved by
utilizing Mitsubishi Electric’s Poki Poki motor7 technology,
which serves as the power source, and advanced motor design
technology that integrates this motor and a controller unit.
Essential to the Mitsubishi Electric Group’s pursuit of global
business development is the rigorous promotion and protection
of intellectual property (IP) rights.
Recognizing IP as a vital resource that underpins corporate
strengths, the Mitsubishi Electric Group continues to integrate
its business, R&D and IP activities. With approximately 40,000
patents and about 12,000 new applications filed each year in
Japan and overseas, the Group’s extensive portfolio forms the
wellspring of its global competitive advantage.
Structure of the Intellectual Property DivisionThe Group’s IP-related operations are the direct responsibility of
the President and overseen by the IP Division at headquarters
under an appointed IP executive officer. Day-to-day issues are
handled by IP departments at relevant facilities, R&D centers and
affiliated companies. Focusing on integration as the means to
improve the structure and effectiveness of the IP network, the
Group coordinates activities at each level. The IP Division at head-
quarters formulates strategies for the entire Group, promotes
Intellectual Property
Integrating Business, R&D and IP Activities
DevelopmentStrategy
R&D CentersIP Departments
Integration IP Network
PresidentIP Departments at Business Groups,Facilities, Affiliates
IP Strategy IP Division atHeadquarters
Business Strategy
*Rated at 1200V/300A when comparing volume
Approx. 50%less module mass
World’s first Full SiC-IPM with built-in drive and protection circuits
Full SiC-IPM
Moduleinterior
Si-IPM
SiC elements installed with current sensors
(for short-circuit protection)
Control board(drive and
protection circuits)
In combination with the Company’s unique motor control system,
the new motor controller unit realizes natural, smooth and stable
handling. Mitsubishi Electric will promote further size and weight
reductions for this power control unit in order to help lower
automobile fuel consumption.
1 Highly functional electronic meters capable of receiving transmissions from other equipment.
2 As of February 16, 2011; based on internal research3 Silicon carbide: A 1:1 compound of carbon and silicon4 Intelligent Power Module: A highly functional power semiconductor module with
built-in drive circuits and protection circuits5 Compared with the Company’s PM300CLA1206 As of September 30, 2010; based on internal research7 Motors that deliver high efficiency as well as size reductions. They can be mass
produced using the Company’s unique technology in which coils are wound around a linearly open core.
World’s smallest and lightest motor controller unit
Motor controller unit forautomotive power steering
critical IP-related projects, and coordinates interaction with the
patent office. At manufacturing facility, R&D center and affiliated
company levels, IP departments pursue specific objectives in line
with the Group’s overall IP strategies.
16 MITSUBISHI ELECTRIC CORPORATION ANNUAL REPORT 2011

IP StrategyIn all its IP-related activities, the Group strives to enhance IP capa-
bilities in order to contribute to business based on the effective
utilization of the IP creation cycle. Specifically, the IP Division and
its departments identify critical IP-related themes in connection
with mainstay businesses and important R&D projects. In strategi-
cally promoting IP activities, the Group further reinforces its
global competitiveness.
In the Group’s IP strategy of recent years, maintaining a close
correlation with international standards has been particularly
important. Therefore, the Group is working to ensure the interna-
SEGMENT FIELD CORE TECHNOLOGY PRODUCTS/TECHNOLOGIES/PATENTS
Energy and Electric Systems
Power SystemsPower generation systems, substation systems, power distribution systems, insulation technology, large-current control systems, smart grids, energy management systems
Transportation SystemsPropulsion control systems, transportation planning and control systems, train information systems, train vision systems
Elevators/EscalatorsMachine-room-less elevators, high-speed elevators, high-efficiency group control systems, escalators, elevator adjustable speed control technology, elevator electric safety technology
Supervisory Control SystemsTotal security solution (DIGUARD: security network integration platform), multiple large-screen systems, network visual monitoring systems
Industrial Automation Systems
Industrial Automation Products and Systems
Programmable controllers, human machine interfaces, AC servo systems, inverters, low-voltage circuit breakers, computerized numerical controllers, electrical discharge machines, laser processing machines, micro spark coating technology, industrial robots
Measurement and Control Systems Energy diagnosis technology, power meters, EcoMonitor, smart meters
Automotive Electric & Electronic Products and Car Multimedia Systems
Electrical power steering, high-frequency alternators, high-power starters, onboard ETC equipment, car navigation technology
Information and Communication Systems
Wireless SystemsDigital modulation and demodulation technology, wireless access control technology, error detection and correction technology, amplifier circuit technology, super-compact base stations for femto-cells, digital train radio systems
Closed Circuit Television SystemsVideo storage technology, video encoding and decoding technology, sensor information processing technology, speech coding technology
Space, Satellite Communication Systems
Satellites, posture control technology, H-II transfer vehicle
Antennas and Radar DevicesRadar system technology, antenna technology, microwave and millimeter wave technology, tracking and signal processing technology
Information Communications Network Systems
Information security technology, quantum cryptography systems, data management technology, information system construction technology, optical communication technology, optical access technology, optical core/metro network technology, IP network technology, NGN1 home gateways, optical network technology, optical transmission protocol
Electronic Devices
Power Devices High-efficiency power devices/modules, (IGBT2, IPM3), transfer molds/power modules, SiC power devices
High Frequency and Optical Devices GaN high-power devices/amplifiers, optical devices (LD/PD modules)
LCD Displays Curved displays, 3D LCDs
Home Appliances
Air-Conditioning SystemsHeat pump technology, air conditioners, ventilating fans, next-generation refrigerants, chlorofluorocarbon-free technology, hybrid nano-coating, universal design
Photovoltaic Power Generation Systems
High-efficiency photovoltaic cells, PV inverters
TVs Laser light source technology, intelligent image/sound processing technology, super-resolution technology
Recorders and PlayersBlu-ray disc recorders, digital terrestrial broadcasting receiver technology for automobiles, image retrieval technology, high-resolution image compression coding technology
1 NGN: Next Generation Network2 IGBT: Insulated Gate Bipolar Transistor3 IPM: Intelligent Power Module
Mitsubishi Electric Group’s Core Technologies and Patents
tional standardization of its technologies, as well as to obtain
standard patents. The securing of overseas IP rights is a critical
issue in light of progress made by the Group as well as by its
competitors, to further globalize business activities. Moreover,
in response to further business globalization, Group IP represen-
tatives in the United States, Europe and China actively work to
strengthen IP capabilities and to accelerate global IP activities.
At the same time, the Group is accelerating the globalization of
its IP activities through such actions as filing patents prior to
undertaking business development in emerging countries,
including India and Brazil.
MITSUBISHI ELECTRIC CORPORATION ANNUAL REPORT 2011 17
Corporate Social Responsibility
Philanthropic ActivitiesThe Mitsubishi Electric Group promotes philanthropic activities
in Japan and overseas with an emphasis on the three categories
of social welfare, environmental preservation, and science
and technology.
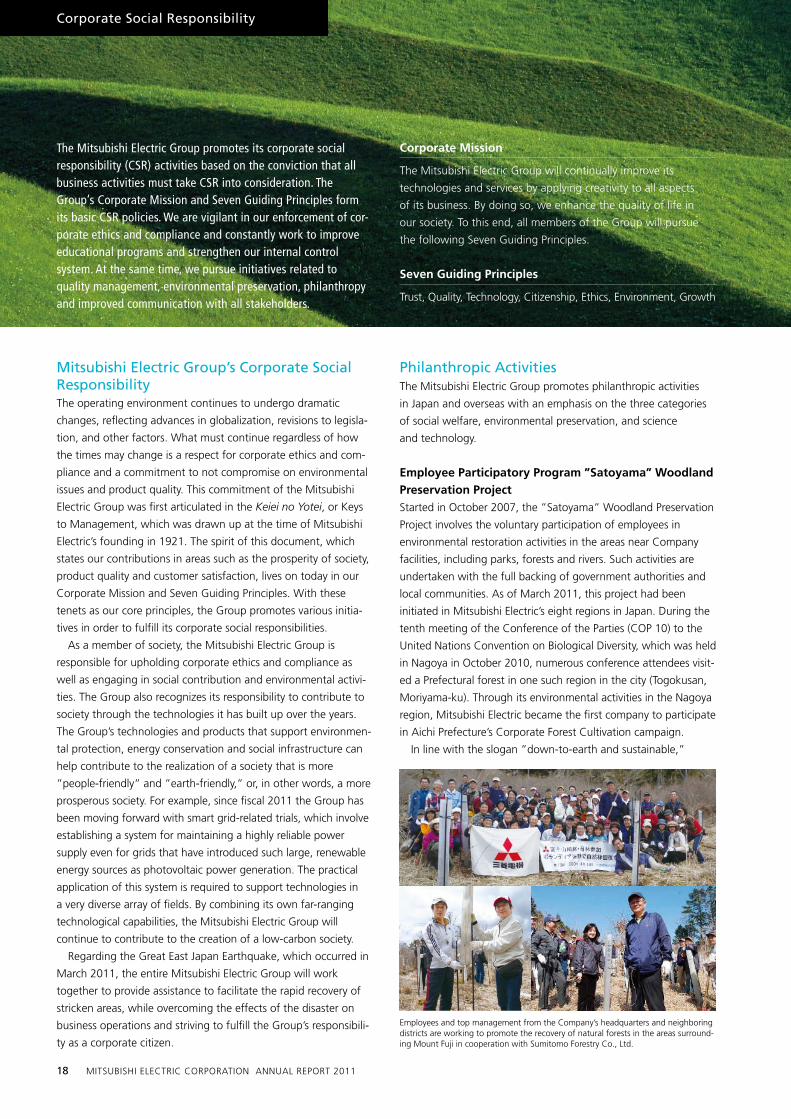
Employee Participatory Program ”Satoyama” Woodland Preservation ProjectStarted in October 2007, the ”Satoyama” Woodland Preservation
Project involves the voluntary participation of employees in
environmental restoration activities in the areas near Company
facilities, including parks, forests and rivers. Such activities are
undertaken with the full backing of government authorities and
local communities. As of March 2011, this project had been
initiated in Mitsubishi Electric’s eight regions in Japan. During the
tenth meeting of the Conference of the Parties (COP 10) to the
United Nations Convention on Biological Diversity, which was held
in Nagoya in October 2010, numerous conference attendees visit-
ed a Prefectural forest in one such region in the city (Togokusan,
Moriyama-ku). Through its environmental activities in the Nagoya
region, Mitsubishi Electric became the first company to participate
in Aichi Prefecture’s Corporate Forest Cultivation campaign.
In line with the slogan ”down-to-earth and sustainable,”
Mitsubishi Electric Group’s Corporate Social ResponsibilityThe operating environment continues to undergo dramatic
changes, reflecting advances in globalization, revisions to legisla-
tion, and other factors. What must continue regardless of how
the times may change is a respect for corporate ethics and com-
pliance and a commitment to not compromise on environmental
issues and product quality. This commitment of the Mitsubishi
Electric Group was first articulated in the Keiei no Yotei, or Keys
to Management, which was drawn up at the time of Mitsubishi
Electric’s founding in 1921. The spirit of this document, which
states our contributions in areas such as the prosperity of society,
product quality and customer satisfaction, lives on today in our
Corporate Mission and Seven Guiding Principles. With these
tenets as our core principles, the Group promotes various initia-
tives in order to fulfill its corporate social responsibilities.
As a member of society, the Mitsubishi Electric Group is
responsible for upholding corporate ethics and compliance as
well as engaging in social contribution and environmental activi-
ties. The Group also recognizes its responsibility to contribute to
society through the technologies it has built up over the years.
The Group’s technologies and products that support environmen-
tal protection, energy conservation and social infrastructure can
help contribute to the realization of a society that is more
”people-friendly” and ”earth-friendly,” or, in other words, a more
prosperous society. For example, since fiscal 2011 the Group has
been moving forward with smart grid-related trials, which involve
establishing a system for maintaining a highly reliable power
supply even for grids that have introduced such large, renewable
energy sources as photovoltaic power generation. The practical
application of this system is required to support technologies in
a very diverse array of fields. By combining its own far-ranging
technological capabilities, the Mitsubishi Electric Group will
continue to contribute to the creation of a low-carbon society.
Regarding the Great East Japan Earthquake, which occurred in
March 2011, the entire Mitsubishi Electric Group will work
together to provide assistance to facilitate the rapid recovery of
stricken areas, while overcoming the effects of the disaster on
business operations and striving to fulfill the Group’s responsibili-
ty as a corporate citizen.
Corporate Mission
The Mitsubishi Electric Group will continually improve its
technologies and services by applying creativity to all aspects
of its business. By doing so, we enhance the quality of life in
our society. To this end, all members of the Group will pursue
the following Seven Guiding Principles.
Seven Guiding Principles
Trust, Quality, Technology, Citizenship, Ethics, Environment, Growth
The Mitsubishi Electric Group promotes its corporate social responsibility (CSR) activities based on the conviction that all business activities must take CSR into consideration. The Group’s Corporate Mission and Seven Guiding Principles form its basic CSR policies. We are vigilant in our enforcement of cor-porate ethics and compliance and constantly work to improve educational programs and strengthen our internal control system. At the same time, we pursue initiatives related to quality management, environmental preservation, philanthropy and improved communication with all stakeholders.
Employees and top management from the Company’s headquarters and neighboring districts are working to promote the recovery of natural forests in the areas surround-ing Mount Fuji in cooperation with Sumitomo Forestry Co., Ltd.
18 MITSUBISHI ELECTRIC CORPORATION ANNUAL REPORT 2011

we will continue to pursue phased nature conservation activities
in areas throughout the country.
Mitsubishi Electric SOCIO-ROOTS FundEstablished in 1992, the Mitsubishi Electric SOCIO-ROOTS Fund
is a gift program in which the Company matches any donation
made by an employee, thus doubling the goodwill of the gift.
More than 1,000 employees participate in the Fund each year.
As of March 2011, the Fund had attracted more than 1,400
donations, with approximately ¥580 million provided to various
social welfare facilities and other programs.
Maximizing the benefits of this gift-matching system during
the course of social welfare activities undertaken in the fiscal year
under review, the Company assisted in covering some of the
costs needed to install a photovoltaic system at an orphanage in
Japan. Such activities encourage environmental preservation and
electricity conservation among children.
Powered by the goodwill of its employees, Mitsubishi Electric
will continue to carry out activities that bring smiles to people in
local communities.
Environmental ActivitiesCommunicating the Mitsubishi Electric Group’s Environmental Statement, ”Eco Changes” WorldwideFollowing the establishment of the Mitsubishi Electric Group’s
Environmental Vision 2021, Mitsubishi Electric formulated its
environmental statement in Japan, ”Eco Changes – from in the
home to outer space,” in June 2009. This statement expresses
the Group’s stance on environmental management. Since June
2010, the Company has also been promoting the environmental
statement outside Japan as: ”Eco Changes – for a greener
tomorrow.” Through the formulation of this new environmental
statement, the Group is emphasizing internally and externally its
conviction that any product or business activity that lacks the
perspective of environmental performance or improvement
should not exist, and also demonstrating its commitment to carry
out activities around the world that are grounded in local reality.
Aiming to be a leading green company that continues to
address the needs of a global society, the Mitsubishi Electric Group
will strive to strengthen its corporate constitution (disciplining
ourselves to use less energy and resources while manufacturing in
a responsible, self-regulated manner, and increasing production
efficiency to its highest level) and contribute to society (striving to
ensure that an environmental benefit or improvement is delivered
when people use our products and services).
Strengthening Our Corporate Constitution• Reducing CO2 during Production
Due to a sharp increase in production after recovery following the
economic crisis of 2008-2009, particularly in China, Thailand and
other Asian countries, the total amount of CO2 emitted by the
Mitsubishi Electric Group in fiscal 2011 was 966,000 tons. This
amount exceeded the Group’s overall expected total of 873,000
tons. Conversely, the Group successfully cut CO2 emissions by
35,000 tons, exceeding its reduction target of 33,000 tons.
Mitsubishi Electric’s non-consolidated CO2 emissions totaled
508,000 tons (target: 493,000 tons); the Company reduced CO2
emissions by 22,000 tons, exceeding its emission reduction target
of 16,000 tons. In our production divisions, we are promoting
the identification and reduction of waste resulting from the use
of our products. In future Environmental Plans, Mitsubishi Electric
shall continue to focus on making further improvements to
production lines, but will put particular emphasis on visualizing
LeadingGreen Company
Making Positive Contributions to the Earthand Its People through Technology and Action
Creating a Low-Carbon
Society
Respecting BiodiversityEnsuring harmony with nature and fostering environmental awareness
Creating a Recycling-Based
Society
Aim to reduce CO2 emissionsfrom power generation
Reduce CO2 emissionsfrom product usage by 30%(Base year: fiscal 2001)Reduce total CO2 emissionsfrom production by 30%(Base year: fiscal 1991)
Aim for zero emissionsfrom manufacturing
Promote product “3Rs”;reduce, reuse and recycleReduce resource inputs
Environmental Vision 2021
Strengthen OurConstitution
(Through high-efficiency production and proactive self-regulation)
Contribute toSociety
(Through business activities and environmental mindset)
Presentation ceremony held at Seikou Gakuen Orphanage
The photovoltaic module installed at Seikou Gakuen Orphanage
MITSUBISHI ELECTRIC CORPORATION ANNUAL REPORT 2011 19

Groupwide Plan to Reduce CO2 from Production
and monitoring the status of energy use in the production
process. Toward this end, in fiscal 2011, at several of its factories
in Japan, the Company initiated a plan to gradually install energy
conservation support equipment, such as its EcoMonitor and
EcoServer, as well as its ”e & eco-F@ctory” solution. The mea-
sures we have undertaken at Company offices include utilizing
the DIGUARD total building security system and proactively
introducing technology that automatically turns lighting on and
off depending on the presence of people.
Affiliated companies in Japan emitted a total of 191,000 tons
of CO2 (target: 165,000 tons) and cut emissions by 5,000 tons
(target: 7,000 tons). Affiliated companies overseas emitted a
total of 267,000 tons of CO2 (target: 215,000 tons) and reduced
emissions by 7,000 tons (target: 10,000 tons).
Looking ahead, the entire Mitsubishi Electric Group will further
bolster its initiatives in this area.
• Making Significant Progress toward Zero Emissions
As outlined in its 6th Environmental Plan, the Mitsubishi Electric
Group established the following final waste disposal ratio targets
for fiscal 2012: less than 0.1% for Mitsubishi Electric, less than
0.5% for affiliated companies in Japan and less than 3.0% for
overseas affiliated companies. The final disposal ratio for fiscal
2011 stood at 0.002% for Mitsubishi Electric, 0.04% for affiliat-
ed companies in Japan and 1.76% for overseas affiliated compa-
nies, a significant improvement over initial targets. These results
were made possible by the development of measures that took
into account actual conditions for waste production and disposal.
Particularly in Japan, we are making aggressive efforts in this
area, mainly by promoting coordinated waste management that
integrates the processes of numerous operating bases.
Contributing to Society• Mitsubishi Electric Operates Japan’s First Large-scale,
High-purity Plastic Recycling Plant
Mitsubishi Electric initiated Japan’s first-ever large-scale,
high-purity plastic recycling system at its subsidiary Green Cycle
Systems Corporation (GCS) in April 2010. This system takes the
shredded mixed plastic recovered from end-of-lifecycle home
appliance recycling facilities, and separates—in significant
amounts and at high levels of purity—the three major types of
plastic that can be recycled for reuse in home appliances.
Through this system, Mitsubishi Electric has increased its
recycling ratio of high-purity plastic that is available for use in
new products more than tenfold, from 6% to a maximum of
70%. This, in turn, has enabled the recycling of high volumes of
plastic into new home appliances.
1991 2010 2012 2021
67
23
24
47
17
22
51
19
26
47
16
17
16%30%96
0
20
40
60
80
100
120
8086
2011
51
19
2797
2009
51
19
2595
114
Total emissions(10,000 tons)
Base year
Environmental Vision 2021
Goal (FY2021)Goal of the 6th
Environmental Plan
Overseas Affiliates (Base year: FY2006)
Affiliates in Japan (Base year: FY2001)Mitsubishi Electric (Base year: FY1991)
(FY)
More information about the Mitsubishi Electric Group’s environmental and CSR initiatives is available on our website at the following URL.
http://www.MitsubishiElectric.com/company/csr/index.html
Mitsubishi Electric’s Large-scale High-purity Plastic Recycling
Plasticseparation
Minutecrushing
Machinecrushing
Manualdisassembly
End-of-lifecycleappliance
Available for use in new products Available for use in
new products
Up to 70% RecyclingGreen Cycle Systems produces high-purity
plastic that can be recycled for use in new
appliances on a large scale
70%6%
Green Cycle SystemsLarge-scale, high-purity plastic recycling plant
Hyper Cycle SystemsElectrical appliance recycling plant
Breaking the 6% BarrierOnly 6% of plastic has been recovered
manually at Hyper Cycle Systems
MetalPlastic
20 MITSUBISHI ELECTRIC CORPORATION ANNUAL REPORT 2011

Corporate Governance
Basic Corporate Governance PolicyTo realize sustained growth and increase corporate value,
Mitsubishi Electric works to maintain the flexibility of its operations
while promoting management transparency. These endeavors are
supported by an efficient corporate governance structure that
clearly defines and reinforces the supervisory functions of manage-
ment while ensuring that the Company is responsive to the expec-
tations of customers, shareholders, and all of our stakeholders.
Corporate Management and Governance StructureCorporate Management StructureIn June 2003, Mitsubishi Electric became a company with a
committee system. Key to this structure is the separation of
supervisory and executive functions; the Board of Directors plays
a supervisory decision-making role and executive officers handle
the day-to-day running of the Company.
The present Board is comprised of 12 directors (five of whom
are outside directors), who objectively supervise and advise the
Company’s management. The Board of Directors has three inter-
nal bodies: the Audit, Nomination and Compensation commit-
tees. Each body has five members, three of whom are outside
directors. The Audit Committee is supported by dedicated
independent staff.
Internal Control SystemFurther ensuring effective corporate governance, the roles of
Chairman and President & CEO are clearly defined and exclusive.
The Chairman heads the board of directors and the President &
CEO heads the Company’s executive officers. Neither the
Chairman nor the President & CEO is a member of the Nomination
or Compensation Committees. This allows for the clear division of
executive and supervisory functions, thereby enabling Mitsubishi
Electric to ensure effective corporate governance.
Executive officers are responsible for ensuring compliance and
management efficiency in their assigned areas of operations.
Internal auditors monitor executive officers’ performance of
duties. Internal auditors report on the results of such monitoring
to the executive officer in charge of auditing. And the executive
officer in charge of auditing and accounting auditors report on
the results of such monitoring to the Audit Committee.
Mitsubishi Electric maintains a multi-dimensional risk manage-
ment system in which all executive officers participate. Under this
system, executive officers are responsible for risk management in
their assigned areas of operation. In addition, executive officers
exchange information and participate in important management
initiatives and decisions through regularly scheduled executive
officers’ meetings.
The Corporate Auditing Division and Audit CommitteeActing independently, Mitsubishi Electric’s Corporate Auditing
Division conducts internal audits of the Company from a fair and
impartial standpoint. In addition, the division’s activities are
supported by auditors with profound knowledge of their particu-
lar fields, assigned from certain business units.
The Audit Committee is made up of five directors, three of
whom are outside directors. In accordance with the policies and
assignments agreed to by the committee, the performances of
directors and executive officers as well as affiliated companies
are audited.
The Corporate Auditing Division, through the executive officer
in charge of auditing, submits reports to the Audit Committee,
which holds periodic meetings to exchange information and dis-
cuss auditing policies. In addition, the Audit Committee discusses
policies and methods of auditing with accounting auditors, who
furnish it with reports on the status and results of the audits of
the Company that they themselves conduct.
Decision-making and Execution SupervisionReport
Appointment
Report
President & CEO
Executive Vice Presidents
Senior Vice Presidents
Executive Officers
General Shareholders’ Meeting
Executive Officers Board of Directors
Business/Administration Divisions
Reporting to
Appointment/Dismissal/Supervision
Chairman
DirectorsNominationCommittee
Outside Directors (majority)
DirectorsAuditCommittee
Outside Directors (majority)
Outside Directors (majority)
DirectorsCompensationCommittee
MITSUBISHI ELECTRIC CORPORATION ANNUAL REPORT 2011 21

Directors and Executive Officers
Directors (As of June 29, 2011)
Setsuhiro Shimomura ........................... Chairman
Kenichiro Yamanishi ............................ Representative Executive Officer, President & CEO
Masanori Saito ...................................... Chairman of the Audit Committee
Hiroki Yoshimatsu ................................ Member of the Compensation Committee, Executive Officer
Noritomo Hashimoto ........................... Chairman of the Nomination Committee, Chairman of the Compensation Committee,
Executive Officer
Ryosuke Fujimoto ................................. Member of the Audit Committee
Masaki Sakuyama ................................. Member of the Nomination Committee, Senior Vice President
Hiroyoshi Murayama ............................ Member of the Nomination Committee, Member of the Audit Committee, Attorney-at-Law
Shunji Yanai .......................................... Member of the Nomination Committee, Member of the Compensation Committee,
Judge, International Tribunal for the Law of the Sea
Mikio Sasaki .......................................... Member of the Compensation Committee, Senior Corporate Advisor,
Mitsubishi Corporation
Shigemitsu Miki .................................... Member of the Nomination Committee, Member of the Audit Committee,
Senior Advisor, The Bank of Tokyo-Mitsubishi UFJ, Ltd.
Fujiatsu Makino .................................... Member of the Audit Committee, Member of the Compensation Committee,
Certified Public Accountant, Registered Tax Accountant
Executive Officers (As of April 1, 2011)
Representative Executive Officer
President & CEO:
Kenichiro Yamanishi
Representative Executive Officers
Executive Vice Presidents:
Mitsuo Muneyuki ................................. In charge of Export Control and Building Systems
Kazuo Kyuma ....................................... In charge of Semiconductor & Device
Senior Vice Presidents:
Masaki Sakuyama ................................. In charge of Corporate Strategic Planning and Operations of Associated Companies
Takashi Sasakawa ................................. In charge of Global Strategic Planning & Marketing
Hideyasu Nonaka ................................. In charge of Factory Automation Systems
Eiji Nakayama ....................................... In charge of Automotive Equipment
Executive Officers:
Susumu Shikata .................................... In charge of Public Utility Systems
Kenji Kuroda ......................................... In charge of Information Systems & Network Service
Hiroki Yoshimatsu ................................ In charge of Accounting and Finance
Noritomo Hashimoto ........................... In charge of General Affairs, Human Resources and Public Relations
Shoichi Sakata ...................................... In charge of Purchasing
Kunio Oguchi ........................................ In charge of Advertising and Domestic Marketing
Kazuhiko Tsutsumi ............................... In charge of Research & Development
Yoshiaki Nakatani................................. In charge of Energy & Industrial Systems
Tsuyoshi Nakamura .............................. In charge of Auditing, Government & External Relations, Legal Affairs,
Export Control and Intellectual Property
Masaharu Moriyasu .............................. In charge of Total Productivity Management & Environmental Programs
Hiroyuki Umemura ............................... In charge of Living Environment & Digital Media Equipment
Masaaki Yasui ....................................... In charge of Electronic Systems
Yasuyuki Nakanishi .............................. In charge of Communication Systems
22 MITSUBISHI ELECTRIC CORPORATION ANNUAL REPORT 2011

Organization
Corporate Marketing Group Business Planning OfficeMarket Planning & Administration Dept.Marketing Research & Business Development Dept.Branch Offices (Hokkaido, Tohoku, Kanetsu, Kanagawa, Hokuriku, Chubu, Kansai, Chugoku, Shikoku, Kyushu)
Corporate Productivity Engineering Dept.Corporate Quality Assurance Planning Dept.Corporate Environmental Sustainability GroupCorporate Logistics Dept.Information Technology CenterDesign Systems Engineering CenterManufacturing Engineering Center
Planning & Administration Dept.Advanced Technology R&D CenterInformation Technology R&D CenterIndustrial Design Center
Planning & Administration Dept.Strategic IT Business Planning Dept.Marketing Dept.
Planning & Administration Dept.Engineering Planning Dept.ITS Business Development GroupPublic-Use Systems Marketing Div.Transportation Systems Div.Overseas Marketing Div.Plant Engineering & Construction Div.Branch OfficesKobe Works, Itami Works, Nagasaki Works
Planning & Administration Dept.Engineering Planning Dept.Nuclear Power Plant Technical Supervisory OfficePower Systems Marketing Div.Overseas Marketing Div.Power Plant Engineering & Construction CenterBranch OfficesEnergy Systems Center, Transmission & Distribution Systems Center,Power Distribution Systems Center
Planning & Administration Div.Engineering Planning Dept. Total Security Systems Dept.Domestic Marketing Div.Overseas Marketing Div.Branch OfficesInazawa Works
Planning & Administration Dept.Defense Systems Div.Space Systems Div.IT Space Solutions Div.Branch OfficesCommunication Systems Center, Kamakura Works
Planning & Administration Dept.Communication Systems Engineering CenterTelecommunication Systems Sales & Marketing Div.NTT Projects Div.Branch OfficesCommunication Networks Center
Planning & Administration Dept.Engineering Dept.External Relations Dept.Customer Satisfaction Promotion Dept.Marketing & Operations Strategic Planning Dept.Eco-Facility Systems Marketing Dept.Air-Conditioning & Refrigeration Systems Div.Lighting, Ventilation & Housing Systems Div.PV Systems Div.Home Appliances Div.Digital Media Equipment Div.Living Environment Systems LaboratoryBranch OfficesNakatsugawa Works, Air-Conditioning & Refrigeration Systems Works, Shizuoka Works, Kyoto Works, Gunma Works, Nagasaki Works
Planning & Administration Dept.Industrial Products Marketing Div.Industrial Automation Marketing Div.Overseas Marketing Div.Branch OfficesNagoya Works, Fukuyama Works
Planning & Administration Dept.Automotive Equipment Marketing Div.Automotive Electronics Development CenterBranch OfficesHimeji Works, Sanda Works
Planning & Administration Div.Semiconductor & Device Marketing Div. ASemiconductor & Device Marketing Div. BLCD Div.Branch OfficesPower Device Works, High Frequency & Optical Device Works
Corporate Total Productivity Management & Environmental Programs Group
Corporate Research and Development Group
Information Systems & Network Service Group
Public Utility Systems Group
Energy & Industrial Systems Group
Building Systems Group
Electronic Systems Group
Communication Systems Group
Living Environment & Digital Media Equipment Group
Factory Automation Systems Group
Automotive Equipment Group
Semiconductor & Device Group
Board of DirectorsChairman
Audit Committee Office
Executive Officers’Meeting
NominationCommittee
AuditCommittee
CompensationCommittee
President & CEO
Executive VicePresidents
Senior VicePresidents
ExecutiveOfficers
Corporate Auditing Div.
Corporate Strategic Planning Div.
Associated Companies Div.
Government & External Relations Div.
Corporate Administration Div.
Corporate Human Resources Div.
Corporate Accounting Div.
Corporate Finance Div.
Corporate Purchasing Div.
Public Relations Div.
Corporate Advertising Div.
Global Strategic Planning & Marketing Div.
Regional Corporate Offices
Legal Div.
Corporate Export Control Div.
Corporate Licensing Div.
Corporate Intellectual Property Div.
Americas (U.S.A.)Europe (U.K.)Asia (Singapore)ChinaTaiwan
(As of June 29, 2011)
MITSUBISHI ELECTRIC CORPORATION ANNUAL REPORT 2011 23

Major Subsidiaries and Affiliates
Manufacturing Sales/Installation/Services Comprehensive Sales Companies
Energy and Electric Systems
Industrial Automation Systems
Information and Communication Systems
Electronic Devices
Home Appliances
Others
Mitsubishi Electric Building Techno-Service Co., Ltd.
Mitsubishi Electric Plant Engineering Corporation
Ryoden Elevator Construction, Ltd.
Mitsubishi Electric Control Software Corporation
RYO-SA BUILWARE Co.,Ltd.
Mitsubishi Elevator Korea Co., Ltd.
Mitsubishi Elevator Hong Kong Co., Ltd.
Ryowa Corporation
Meldas System Engineering Corporation
Ryoden Koki Engineering Co., Ltd.
Mitsubishi Electric Automation (Hong Kong) Ltd.
Mitsubishi Electric Automation Korea Co., Ltd.
Meiryo Technica Co., Ltd.
DB Seiko Co., Ltd.
Mitsubishi Electric Automotive America, Inc.
Mitsubishi Electric Thai Auto-Parts Co., Ltd.
Electric Powersteering Components Europe s.r.o.
Mitsubishi Electric Automation, Inc.
Mitsubishi Electric Automotive Czech s.r.o.
Mitsubishi Electric Living Environment Systems Corporation
Mitsubishi Electric Life Network Co., Ltd.
Mitsubishi Electric Osram Ltd.
Mitsubishi Electric Air Conditioning & Refrigeration Equipment Sales Co., Ltd.
Mitsubishi Electric Air Conditioning & Refrigeration Systems Co., Ltd.
Melco Facilities Corporation
Digitec Industrial Ltd.
Mitsubishi Electric Kang Yong Watana Co., Ltd.
Mitsubishi Electric Ryoden Air-Conditioning & Visual Information Systems (Hong Kong) Ltd.
Mitsubishi Electric Home Appliance Co., Ltd.
Mitsubishi Electric Lighting Corporation
Mitsubishi Digital Electronics America, Inc.
Mitsubishi Electric Consumer Products (Thailand) Co., Ltd.
Shanghai Mitsubishi Electric & Shangling Air-Conditioner and Electric Appliance Co., Ltd.
Mitsubishi Electric (Guangzhou) Compressor Co., Ltd.
Siam Compressor Industry Co., Ltd.
Mitsubishi Electric TOKKI Systems Corporation
Mitsubishi Precision Co., Ltd.
SPC Electronics Corporation
Diamond Telecommunication Co., Ltd.
Mitsubishi Electric Information Systems Corporation
Mitsubishi Electric Information Network Corporation
Mitsubishi Electric Information Technology Corporation
Mitsubishi Electric Business Systems Co., Ltd.
Mitsubishi Space Software Co., Ltd.
Mitsubishi Electric Micro-Computer Application Software Co., Ltd.
Melco Display Technology Inc.
Mitsubishi Electric Metecs Co., Ltd.
IT Semicon Co., Ltd.
Fukuryo Semiconductor Engineering Corporation
Mitsubishi Electric Trading Corporation
Mitsubishi Electric Logistics Corporation
Mitsubishi Electric Engineering Co., Ltd.
Mitsubishi Electric System & Service Co., Ltd.
Mitsubishi Electric Life Service Corporation
The Kodensha Co., Ltd.
iPLANET Inc.
Tada Electric Co., Ltd.
Toyo Electric Corporation
Mitsubishi Electric Power Products, Inc.
Mitsubishi Elevator Asia Co., Ltd.
Mitsubishi Electric Shanghai Electric Elevator Co., Ltd.
Toshiba Mitsubishi-Electric Industrial Systems Corporation
Mitsubishi Hitachi Home Elevator Corporation
Shanghai Mitsubishi Elevator Co., Ltd. ETA-Melco Elevator Co. L.L.C.
Shizuki Electric Co., Inc.
Nippon Injector Corporation
Shihlin Electric & Engineering Corporation
Seiryo Electric Co., Ltd.
Miyoshi Electronics Corporation
Oi Electric Co., Ltd.
Renesas Electronics Corporation
Powerex, Inc.
Setsuyo Astec Corporation
Itec Hankyu Hanshin Co., Ltd.
Osram Melco Ltd.
Kang Yong Electric Public Co., Ltd.
Mitsubishi Electric Credit Corporation
KITA KOUDENSHA Corporation
Ryoden Trading Co., Ltd.
Kanaden Corporation
Mansei Corporation
Chiyoda Mitsubishi Electric Co., Ltd. and other regional comprehensive sales companies (10 companies)
Mitsubishi Electric Europe B.V.
Mitsubishi Electric & Electronics USA, Inc.
Mitsubishi Electric Taiwan Co., Ltd.
Mitsubishi Electric (H.K.) Ltd.
Mitsubishi Electric Asia Pte. Ltd.
Mitsubishi Electric Australia Pty. Ltd.
Mitsubishi Electric & Electronics (Shanghai) Co., Ltd.
Notes: 1. Comprehensive sales companies include several companies that are responsible for selling products from a number of businesses, and therefore are put into their own separate
category rather than separating them by business segment.2. Companies shaded in gray are consolidated subsidiaries, while others are equity-method affiliate companies.3. The name of Fukuryo Semicon Engineering Corporation was changed to Melco Semiconductor Engineering Corporation on April 1, 2011.
(As of March 31, 2011)
24 MITSUBISHI ELECTRIC CORPORATION ANNUAL REPORT 2011

Financial SectionContents
26 Five-Year Summary
27 Financial Review
36 Consolidated Balance Sheets
38 Consolidated Statements of Income
39 Consolidated Statements of Equity
40 Consolidated Statements of Cash Flow
41 Notes to Consolidated Financial Statements
72 Independent Auditors’ Report

26 MITSUBISHI ELECTRIC CORPORATION ANNUAL REPORT 2011
Yen (millions)U.S. dollars (thousands)
Years ended March 31 2011 2010 2009 2008 2007 2011
Summary of Operations
Net sales ¥3,645,331 ¥3,353,298 ¥3,665,119 ¥4,049,818 ¥3,855,745 $43,919,651
Cost of sales 2,622,959 2,505,095 2,710,976 2,957,185 2,831,309 31,601,916
Selling, general, administrative
and R&D expenses 784,606 736,959 783,673 825,428 791,434 9,453,084
Loss on impairment of
long-lived assets 4,005 16,942 30,742 3,189 14,630 48,253
Operating costs 3,411,570 3,258,996 3,525,391 3,785,802 3,637,373 41,103,253
Operating income 233,761 94,302 139,728 264,016 218,372 2,816,398
Income before income taxes 210,237 64,259 43,933 244,137 210,733 2,532,976
Net income attributable
to Mitsubishi Electric Corp. ¥ 124,525 ¥ 28,278 ¥ 12,167 ¥ 157,977 ¥ 123,080 $ 1,500,301
Financial Ratios
Return on sales (%) 3.42 0.84 0.33 3.90 3.19 —
Return on equity (%) 12.36 3.12 1.29 15.11 12.30 —
Return on assets (%) 3.80 0.86 0.36 4.55 3.64 —
Equity ratio (%) 31.52 30.00 25.48 29.60 30.68 —
Per-Share Amounts
Net income attributable
to Mitsubishi Electric Corp.
(yen/U.S. dollars)
Basic ¥58.00 ¥13.18 ¥5.67 ¥73.60 ¥57.34 $0.699
Diluted — 13.18 5.67 73.59 57.34 —
Cash dividends declared
(yen/U.S. dollars) ¥ 12 ¥ 4 ¥ 6 ¥ 13 ¥ 10 $0.145
Statistical Information
Current assets ¥2,073,064 ¥1,927,473 ¥1,939,916 ¥2,060,628 ¥2,050,500 $24,976,675
Current liabilities 1,470,387 1,266,909 1,413,015 1,505,901 1,529,838 17,715,506
Working capital 602,677 660,564 526,901 554,727 520,662 7,261,169
Mitsubishi Electric Corp.
Shareholders’ equity 1,050,340 964,584 849,476 1,031,438 1,059,209 12,654,699
Cash dividends paid 19,315 — 27,904 25,758 19,317 232,711
Total assets 3,332,679 3,215,094 3,334,123 3,485,080 3,452,231 40,152,759
Capital expenditures 107,638 109,069 141,434 144,623 140,557 1,296,843
R&D expenditures 151,779 133,781 144,444 148,790 132,722 1,828,663
Depreciation ¥ 105,280 ¥ 119,762 ¥ 148,018 ¥ 136,283 ¥ 130,130 $ 1,268,434
Employees
(at the end of the year) 114,443 109,565 106,931 105,651 102,835 —
Notes: 1. Operating income is presented as net sales less cost of sales, selling, general, administrative and R&D expenses, and loss on impairment of long-lived assets. Total operating income for each segment conforms to above mentioned operating income. Business restructuring expenses are shown as non-operating expenses.
2. R&D expenditures include elements spent on quality improvements, which constitute manufacturing costs. 3. U.S. dollar amounts are translated from yen at the rate of ¥83=U.S.$1, the approximate rate on the Tokyo Foreign Exchange Market on March 31, 2011. 4. The Company has 157 consolidated subsidiaries and 40 equity-method companies as of March 31, 2011. 5. For the year ended March 31, 2010, the Company applies FASB ASC Topic 810 “Consolidation”. Due to the adoption of ASC Topic 810, “Net Income” is
renamed “Net income attributable to Mitsubishi Electric Corp.”. Also, income before income taxes includes equity in earnings (losses) of affiliated companies, while excluding net income attributable to noncontrolling interests. Consequently, the Company has reclassified the figures for all prior periods.
6. For the year ended March 31, 2011, diluted net income per share attributable to Mitsubishi Electric Corp. is not included in the above figure as no dilutive securities existed.
Five-Year Summary
Mitsubishi Electric Corporation and Subsidiaries

MITSUBISHI ELECTRIC CORPORATION ANNUAL REPORT 2011 27
OVERVIEW
During fiscal 2011, the year ended March 31, 2011, although the business environment saw such setbacks as rapid yen apprecia-
tion and soaring raw material prices, conditions continued improving overall on the back of a widespread recovery in the global
economy, particularly in emerging countries. However, the business environment has been affected by the Great East Japan
Earthquake, resulting in the suspension of production and, due to rolling blackouts and other factors, a decrease in the capacity
utilization ratio at some operational sites.
Under these circumstances, the Mitsubishi Electric Group placed greater emphasis than ever before on promoting growth
strategies rooted in the advantages it has over the competition as well as on Group efforts to boost its competitiveness and
strengthen its management structure.
As a result, in fiscal 2011, the Mitsubishi Electric Group recorded net sales of ¥3,645.3 billion, operating income of ¥233.8
billion, income before income taxes of ¥210.2 billion, and net income attributable to Mitsubishi Electric Corp. of ¥124.5 billion.
Financial Review
Net Sales
The Mitsubishi Electric Group recorded a rise in sales in the following business
segments: Industrial Automation Systems, Electronic Devices, Home Appliances
and Others. In the fiscal year under review, consolidated net sales increased by
¥3,645.3 billion year on year to ¥292.0 billion.
Cost of Sales, Expenses and Operating Income
The cost of sales increased by ¥117.9 billion compared with the previous fiscal
year to ¥2,623.0 billion, representing 72.0% of total net sales, an improvement
of 2.7 points. Selling, general and administrative (SG&A) expenses together with
research and development (R&D) expenses totaled ¥784.6 billion, up ¥47.6 bil-
lion year on year. As a result, the ratio of SG&A and R&D expenses to net sales
improved 0.5 point to 21.5%. Loss on impairment of long-lived assets decreased
by ¥12.9 billion year on year to ¥4.0 billion. Accounting for the aforementioned
factors, operating income amounted to ¥233.8 billion, a rise of ¥139.5 billion
compared with the previous fiscal year. This increase was primarily attributable
to improved income in the Energy and Electric Systems, Industrial Automation
Systems, Electronic Devices, Home Appliances and Others business segments.
Non-Operating Income and Expenses
Financial income, the sum of interest and dividend income less interest expenses,
amounted to ¥0.4 billion, a decrease of ¥0.8 billion year on year.
Equity in losses of affiliated companies totaled ¥20.3 billion, a decrease of
¥14.5 billion compared with the previous fiscal year.
Other income rose by ¥9.8 billion to ¥28.0 billion year on year due primarily
to the recording of a gain from sales of investment securities and other. Other
expenses increased by ¥18.6 year on year to ¥31.7 billion because of such
factors as foreign currency exchange losses and the costs required to completely
repair damage caused by the Great East Japan Earthquake.
Income before Income Taxes
Income before income taxes increased by ¥146.0 billion compared with the
previous fiscal year to ¥210.2 billion for a ratio to net sales of 5.8%. This was
primarily due to the aforementioned improvement in operating income.
Net Income Attributable to Mitsubishi Electric Corp.
Net Income Attributable to Mitsubishi Electric Corp. rose by ¥96.2 billion year on
year to ¥124.5 billion (a ratio to net sales of 3.4%). This was largely due to the
upswing in income before income taxes.
07 08 09 1007 08 09 10
3.86
218
4.053.65
264
234
1111
3.67
140
3.35
94
Net sales Operating income (Yen in trillions) (Yen in billions)
Net sales / Operating income
07 08 09 1007 08 09 10 1111
123
57.34
158 73.60
1228
125
5.67 13.18
58.00
Net income attributable to Mitsubishi Electric Corp. (Yen in billions)
Basic net income per share attributable to Mitsubishi Electric Corp. (Yen)
Net income attributable to Mitsubishi Electric Corp. / Basic net income per share attributable to Mitsubishi Electric Corp.

28 MITSUBISHI ELECTRIC CORPORATION ANNUAL REPORT 2011
Business Risks
The Mitsubishi Electric Group engages in the development, manufacture and sale of products in the Energy and Electric Systems,
Industrial Automation Systems, Information and Communication Systems, Electronic Devices, Home Appliances and Other
business fields in Japan as well as North America, Europe, Asia and other overseas regions. As a result, the Group’s financial
standing and business performance may be affected by a variety of external factors.
Factors that may affect the financial standing and business performance of the Mitsubishi Electric Group include but are not
limited to the following. As such, additional factors may arise at any given time.
(1) Important trends
The Mitsubishi Electric Group’s operations may be affected by trends in the global economy, social conditions, laws, tax
codes and regulations.
(2) Foreign currency exchange rates
Fluctuations in foreign currency markets may affect Mitsubishi Electric’s sales of exported products and purchases of
imported materials that are denominated in U.S. dollars or euros, as well as its Asian production bases’ sales of exported
products and purchases of imported materials that are denominated in foreign currencies.
(3) Stock markets
A fall in stock market prices may cause Mitsubishi Electric to record devaluation losses on marketable securities or cause
an increase in retirement benefit obligations in accordance with a decline in the fair value of pension assets.
(4) Supply/demand balance for products and procurement conditions for materials and components
A decline in prices and shipments due to changes in the supply/demand balance as well as an increase in costs due to
a worsening of material and component procurement conditions may adversely affect the Mitsubishi Electric Group’s
performance.
(5) Fund raising
An increase in interest rates, the yen interest rate in particular, would increase Mitsubishi Electric’s interest expenses.
(6) Significant intellectual property matters
Important patent filings, licensing, copyrights and patent-related disputes may adversely affect related businesses.
(7) Environmental legislation or relevant issues
Mitsubishi Electric may incur losses or expenses owing to changes in environmental legislation or the occurrence of
environmental issues. Such changes in legislation or the occurrence of environmental issues may also affect the Group’s
overall operations, including manufacturing activities.
(8) Flaws or defects in products or services
Mitsubishi Electric may incur losses or expenses relating to flaws or defects in products or services. A decrease in the general
assessment of the quality of Group products and services may also impact overall operations.
(9) Lawsuits and other legal proceedings
Lawsuits and/or other legal proceedings against the Mitsubishi Electric Group may affect its overall operations.
(10) Disruptive changes
Disruptive changes in the technology, development and manufacturing of products using new technology, and timing of
market introduction may adversely affect the Mitsubishi Electric Group’s performance.
(11) Business restructuring
The Mitsubishi Electric Group may record losses due to restructuring measures.
(12) Natural disasters
The Mitsubishi Electric Group’s operations, particularly manufacturing activities, may be affected by the occurrence of
earthquakes, typhoons, tsunami, fires and other large-scale disasters.
(13) Other significant factors
The Mitsubishi Electric Group‘s operations may be affected by the outbreak of social or political upheaval due to terrorism,
war, pandemic by new strains of influenza and other diseases, or other factors.

MITSUBISHI ELECTRIC CORPORATION ANNUAL REPORT 2011 29
Energy and Electric Systems
The social infrastructure systems business saw year–on-year decreases in orders
and sales mainly due to a fall in large-scale projects in energy systems businesses,
despite growth in the electrical equipment for rolling stock business in Japan
and abroad.
The building systems business experienced an increase in orders and sales
compared with the previous fiscal year due to a gradual recovery in demand for
elevators and escalators in Japan and increasing demand for the same products
in China and ASEAN countries.
As a result, total sales in the Energy and Electric Systems segment amounted to
¥1,027.7 billion, a 1% dip from the previous fiscal year, but operating income rose
by ¥8.3 billion year on year to ¥83.1 billion, owing primarily to cost improvements.
Industrial Automation Systems
The factory automation systems business experienced an increase in orders and
sales compared with the previous fiscal year thanks to expanded demand in the
Asian market, beginning with industrial machinery in China as well as rising flat
panel display- and semiconductor-related capital expenditures in South Korea
and Taiwan.
The automotive equipment business saw rises in excess of those of the pre-
vious fiscal year both in orders and sales due to increased demand in individual
markets, including China and India. This occurred despite indications of decreas-
ing demand following the termination of promotional incentives in certain
markets in Japan and Western Europe.
As a result, total sales in the Industrial Automation Systems segment were
¥927.0 billion, a 26% increase year on year. Owing to this rise and other factors,
operating income improved ¥74.0 billion to ¥100.1 billion.
Net Sales by Business SegmentYen (millions)
U.S. dollars (thousands)
Years ended March 31 2011 2010 2009 2008 2007 2011
Energy and Electric Systems ¥1,027,749 ¥1,039,669 ¥1,043,633 ¥1,057,935 ¥ 951,065 $12,382,518Industrial Automation Systems 927,002 733,132 851,688 1,017,503 956,930 11,168,699Information and
Communication Systems 487,915 526,161 582,146 644,388 688,004 5,878,494Electronic Devices 175,910 138,985 166,969 192,087 185,911 2,119,398Home Appliances 924,478 824,679 915,710 1,000,258 921,948 11,138,289Others 609,416 552,981 596,091 660,822 630,510 7,342,361Subtotal 4,152,470 3,815,607 4,156,237 4,572,993 4,334,368 50,029,759Eliminations (507,139) (462,309) (491,118) (523,175) (478,623) (6,110,108)Consolidated total ¥3,645,331 ¥3,353,298 ¥3,665,119 ¥4,049,818 ¥3,855,745 $43,919,651
Operating Income (Loss) by Business SegmentYen (millions)
U.S. dollars (thousands)
Years ended March 31 2011 2010 2009 2008 2007 2011
Energy and Electric Systems ¥ 83,055 ¥ 74,727 ¥ 74,539 ¥ 68,543 ¥ 49,299 $1,000,663Industrial Automation Systems 100,089 26,138 49,934 129,257 125,139 1,205,892Information and
Communication Systems 13,743 18,672 24,869 2,352 20,803 165,578Electronic Devices 5,901 (7,141) (29,807) 8,395 12,141 71,096Home Appliances 42,008 4,809 34,706 65,754 23,306 506,120Others 14,475 3,204 12,341 16,916 14,976 174,398Subtotal 259,271 120,409 166,582 291,217 245,664 3,123,747Eliminations (25,510) (26,107) (26,854) (27,201) (27,292) (307,349)Consolidated total ¥233,761 ¥ 94,302 ¥139,728 ¥264,016 ¥218,372 $2,816,398
RESULTS BY BUSINESS SEGMENT
07 08 09 1007 08 09 10 1111
951
49
1,058
69
1,04475
1,040 1,02875
83
Net sales Operating income (Yen in billions) (Yen in billions)
Net sales and Operating income of Energy and Electric Systems
957 1251,018 129
50
733
927
26
100852
07 08 09 1007 08 09 10 1111
Net sales Operating income (Yen in billions) (Yen in billions)
Net sales and Operating income of Industrial Automation Systems

30 MITSUBISHI ELECTRIC CORPORATION ANNUAL REPORT 2011
Information and Communication Systems
The telecommunications equipment business experienced reductions in orders
and sales due to decreased demand for optical broadband access systems and
other communication infrastructure components in spite of increased sales of
home broadband equipment.
The information systems and services business recorded a year-on-year decline
in sales because of lower sales in the systems integration and other businesses.
In the electronic systems business, orders remained on par with those
recorded for the previous fiscal year. However, sales decreased year on year due
primarily to the reduction in large-scale projects in the electronic business.
As a result, total sales in the Information and Communication Systems
segment amounted to ¥487.9 billion, down 7% year on year. Because of
this decrease and other factors, operating income declined by ¥4.9 billion to
¥13.7 billion.
Electronic Devices
The semiconductor business experienced year-on-year increases in orders and
sales owing to a rise in demand for industrial-, commercial-, railway-, and
automotive-use power modules as well as optical transmission devices.
Orders and sales in the LCD module business were above those of the
previous fiscal year thanks to expanded demand for industrial-use and vehicle-
mounted products.
As a result, total sales in the Electronic Devices segment stood at ¥175.9
billion, up 27% year on year. Owing primarily to this increase in sales, operating
income improved by ¥13.0 billion to ¥5.9 billion.
Home Appliances
Sales in the Home Appliances segment increased by 12% year on year to ¥924.5
billion. This result was attributable to the following factors: a rise in sales of
air conditioners both in Japan and abroad following last summer’s heat waves;
growth in domestic demand for consumer-use air conditioners, LCD televisions,
and refrigerators due to a last-minute surge in response to a change made in
the eco-point system for consumer electronics during the third quarter; and
increased sales of photovoltaic (PV) systems in Japan and abroad owing mainly to
the impact of government subsidies and other stimulus programs introduced in
various countries.
As a result of this increase in sales and other factors, operating income
improved by ¥37.2 billion compared with the previous fiscal year to ¥42.0 billion.
Others
Sales in the Others segment improved by 10% year on year to ¥609.4 billion
primarily due to stronger sales among affiliated companies engaged in
procurement, logistics, engineering and other related activities.
Consequently, operating income increased by ¥11.3 billion compared with
the previous fiscal year to ¥14.5 billion.
07 08 09 1007 08 09 10 1111
688
21644
2
25
58219
14
526488
Net sales Operating income (Yen in billions) (Yen in billions)
Net sales and Operating income of Information and Communication Systems
07 08 09 1007 08 09 10 1111
186
12
192
8
167
-30
139
176
-76
Net sales Operating income (loss) (Yen in billions) (Yen in billions)
Net sales and Operating income (loss) of Electronic Devices
07 08 09 1007 08 09 10 1111
23
922661,000
35
916
5
42
825924
Net sales Operating income (Yen in billions) (Yen in billions)
Net sales and Operating income of Home Appliances
07 08 09 1007 08 09 10 1111
63115
661 17596
12
553609
3
14
Net sales Operating income (Yen in billions) (Yen in billions)
Net sales and Operating income of Others

MITSUBISHI ELECTRIC CORPORATION ANNUAL REPORT 2011 31
Japan
Sales increased by 10% year on year to ¥3,176.6 billion, and operating income rose by ¥127.7 billion to ¥177.4 billion. These
improvements are mainly the result of higher sales in the factory automation systems, automotive equipment, photovoltaic
systems and visual equipment-related businesses.
North America
Sales rose by 12% year on year to ¥230.0 billion primarily due to increased sales in the automotive equipment-related business.
However, operating income fell of ¥4.2 billion to ¥1.4 billion following a drop in price and sales of visual equipment.
Asia
Sales improved by 31% year on year to ¥583.8 billion, and operating income jumped by ¥16.4 billion to ¥43.7 billion.
These increases are primarily attributable to higher sales in the factory automation systems, automotive equipment and air
conditioner-related businesses.
Europe
Sales increased by 4% year on year to ¥294.0 billion, while operating income rose by ¥4.7 billion to ¥7.8 billion. These improve-
ments are mainly attributable to higher sales in the factory automation systems, automotive equipment and photovoltaic
systems-related businesses.
Others
Sales in other regions, including figures for Mitsubishi Electric’s Australian subsidiary, amounted to ¥38.2 billion. Operating
income was ¥4.3 billion.
Net Sales by Geographic SegmentYen (millions)
U.S. dollars (thousands)
Years ended March 31 2011 2010 2009 2008 2007 2011
Japan ¥3,176,605 ¥2,886,502 ¥3,178,807 ¥3,468,792 ¥3,346,100 $38,272,349
North America 229,958 205,713 240,589 275,579 277,555 2,770,578
Asia (excluding Japan) 583,827 445,722 461,549 561,759 482,363 7,034,061
Europe 293,952 282,822 321,501 386,113 299,401 3,541,591
Others 38,200 33,140 34,107 31,905 30,819 460,241
Eliminations (677,211) (500,601) (571,434) (674,330) (580,493) (8,159,169)
Consolidated total ¥3,645,331 ¥3,353,298 ¥3,665,119 ¥4,049,818 ¥3,855,745 $43,919,651
Operating Income (Loss) by Geographic SegmentYen (millions)
U.S. dollars (thousands)
Years ended March 31 2011 2010 2009 2008 2007 2011
Japan ¥177,354 ¥49,673 ¥ 89,293 ¥194,413 ¥177,732 $2,136,795
North America 1,363 5,531 (3,599) 5,861 5,257 16,422
Asia (excluding Japan) 43,734 27,337 32,072 49,088 31,057 526,916
Europe 7,830 3,091 10,727 16,044 11,041 94,337
Others 4,329 1,949 1,020 1,321 1,007 52,157
Eliminations (849) 6,721 10,215 (2,711) (7,722) (10,229)
Consolidated total ¥233,761 ¥94,302 ¥139,728 ¥264,016 ¥218,372 $2,816,398
RESULTS BY GEOGRAPHIC SEGMENT

32 MITSUBISHI ELECTRIC CORPORATION ANNUAL REPORT 2011
The Mitsubishi Electric Group actively promotes R&D initiatives that cover fundamental and advanced applications as well as
product commercialization and manufacturing technologies. Carrying out these initiatives are various Group facilities, including
corporate laboratories in Japan and laboratories in the United States and Europe as well as the R&D departments of factories and
consolidated subsidiaries. Moreover, we pursue advanced and wide-ranging R&D activities in partnership with universities and
research institutions both in Japan and overseas.
In fiscal 2011, total R&D expenditures, including quality improvement expenses constituting manufacturing costs,
amounted to ¥151.8 billion. Mitsubishi Electric reports R&D activities by business segment according to purpose, type, result and
expenditure. However, expenditure on fundamental and basic research that does not fall under the purview of a specific business
segment is accounted for under Others.
In the Energy and Electric Systems segment, our research is directed at boosting the competitiveness of such core products
as rotating machines for generators, electric motors and other machinery, switches and transformers; other power transmission/
distribution/reception equipment and systems; transportation systems; and elevators and escalators. Other R&D areas include
IT-application systems for supervision and control, power information systems and building management systems. Notable
among Mitsubishi Electric’s recent R&D achievements are the Train Vision System, which has realized presentation of animated
destination guides and has enabled energy-saving by utilizing LED-backlit displays; Diamond Vision OLED large-scale display
system, which employs organic electro-luminescence (EL) panels; MLCNET-G100 Series IP modems that use metallic wires; the
commencement of verification experiments for smart grids; the world’s first1 injector without magnets, based on the Proton
Alternative Phase Focusing (APF) system for particle beam treatment system (Proton Type); Demonstration project of optimiza-
tion control technology for next-generation electrical tran./dist. systems; a digital instrumentation and control system for nuclear
power plants in China; NEXIEZ elevators for the global market; and hands free access control systems. R&D expenditures in this
segment totaled ¥27.1 billion.
In the Industrial Automation Systems segment, R&D activities are aimed at enhancing the competitiveness of our lineup,
which includes motors and related products; mechatronics equipment; FA control equipment and systems; automotive electric
and electronic components; electric power steering (EPS) and related products; and car multimedia systems. Mitsubishi Electric’s
important R&D successes include MELSEC-Q Series energy measuring module
and insulation monitoring module; RH-3SQHR/SDHR ceiling-mounted, high-
speed, horizontally articulated robot; MM-EFS Series premium high-efficiency IPM
motors; EA8A, EA12A, die-sinking electrical discharge machines; eX Series CO2
laser two-dimensional processing machines; the world’s smallest and lightest2
next-generation motor controller units for electric power steering; a car naviga-
tion system compatible with memory device; and DS-G50 DIATONE automobile
speaker based on carbon nanotubes. R&D expenditures in this segment totaled
¥45.0 billion.
In the Information and Communication Systems segment, Mitsubishi Electric
pursues research related to the development of information and communication
technology (ICT) systems, which include network systems for telecommunication
operators and network solutions equipment, as well as space systems, includ-
ing satellites, ground systems and large telescopes. Notable R&D successes for
R&D Expenditures
Yen (billions)U.S. dollars
(millions)
Years ended March 31 2011 2010 2009 2008 2007 2011
Energy and Electric Systems ¥ 27.1 ¥ 23.5 ¥ 24.0 ¥ 21.1 ¥ 20.5 $ 326.0
Industrial Automation Systems 45.0 34.7 37.8 37.1 28.3 541.7
Information and Communication Systems 14.9 12.5 15.1 25.2 21.9 179.9
Electronic Devices 8.6 7.3 8.3 8.6 8.8 103.4
Home Appliances 30.7 29.6 32.4 29.6 26.0 370.1
Others 25.5 26.1 26.9 27.2 27.3 307.5
Consolidated total ¥151.8 ¥133.8 ¥144.4 ¥148.8 ¥132.7 $1,828.7
Note: Figures for each segment and the consolidated total are rounded to the nearest unit.
RESEARCH AND DEVELOPMENT
07 08 09 1007 08 09 10 1111
133
3.4
149
3.7
144
3.9134
152
4.0 4.2
R&D expenditures R&D expenditures / (Yen in billions) Net sales (%)
R&D expenditures R&D expenditures ratio

MITSUBISHI ELECTRIC CORPORATION ANNUAL REPORT 2011 33
Mitsubishi Electric include a digital surveillance camera system MELOOK-DG; the achievement of large capacity applications for
wavelength, multiplex transmission equipment; IP set top box; MELFOS on Demand FAX OCR service; WebMinder3 on Demand
SaaS Web security assessment services; and Value Platform on Demand4 IaaS platform service. R&D expenditures in this segment
totaled ¥14.9 billion.
In the Electronic Devices segment, our R&D focuses on semiconductor and other electronic devices that are themselves vital
components used in all our business segments. Major R&D achievements include the development of IPMs for New PV; the Super
Mini-DIPIPM Ver. 5 Series; a GaAs power transmission amplifier for W–CDMA-type PC data transmission terminals; a 43-Gbps
RZ–DQPSK modulator-integrated, wavelength-tunable, laser; the 9.0-inch QHD and 8.4-inch SVGA, XGA for industrial DIAFINE
Color TFT-LCD Modules. R&D expenditures in this segment totaled ¥8.6 billion.
In the Home Appliances segment, Mitsubishi Electric is directing its R&D efforts toward environment-conscious products
that focus on energy conservation, recycling, reducing environmental impact, universal design, digital imaging systems, and PV
cell modules. Notable results include home appliances with “RakuRaku-UD” (universal design for greater ease and comfort);
KIRIGAMINE Move Eye Series of room air conditioners, which incorporate the world’s first5 SiC power device; HIKARI BIG
Series refrigerators with rotating and moving shelves; REAL MDR1 Series 3D LCD televisions; FUJIN TC–ZK Series cyclone-type
vacuum cleaners installed with FUJIN cyclone technology; RakuRaku IH cooking heaters with user-friendly functions; and Indoors
Move Eye clothes-drying dehumidifiers with infrared sensors detecting un-dry spaces and dehumidify them intensively. R&D
expenditures in this segment totaled ¥30.7 billion.
In Others, fundamental technology R&D that benefits the entire Group is carried out at the Corporate Research and
Development Group and the Corporate Total Productivity Management & Environmental programs Group research centers, which
strive to enhance Group competitiveness and create new businesses. In our main areas of R&D we have developed smart grid
technologies (energy management system for supply/demand control, voltage regulating system for power distribution network,
wireless mesh network for advanced meter infrastructure); the world’s first6 Full SiC IPM with built-in drive and protection circuits;
Laser-backlight LCD televisions; embedded real-time virtualization technology for integrated controllers platform; one-time pad
mobile phone software using quantum key distribution; and Japan’s first7 large-scale, high-purity plastic recycling system. R&D
expenditures in this area amounted to ¥25.5 billion.
1. Source: Mitsubishi Electric Corporation as of May 19, 2010
2. Source: Mitsubishi Electric Corporation as of September 30, 2010
3. WebMinder is a registered trademark of Mitsubishi Electric Information Network Corporation.
4. Value platform on Demand is a registered trademark of Mitsubishi Electric Information Network Corporation.
5. Source: Mitsubishi Electric Corporation as of August 24, 2010
6. Source: Mitsubishi Electric Corporation as of February 16, 2011
7. Source: Mitsubishi Electric Corporation as of June 2, 2010

34 MITSUBISHI ELECTRIC CORPORATION ANNUAL REPORT 2011
Total assets stood at ¥3,332.7 billion as of March 31, 2011, an increase of
¥117.6 billion compared with the previous fiscal year-end. Investments in securi-
ties and other decreased by ¥33.1 billion; however, cash and cash equivalents
rose by ¥80.9 billion, while inventories increased by ¥53.3 billion.
Under liabilities, the outstanding balance of debt and corporate bonds fell
by ¥53.1 billion compared with the end of the previous fiscal year to ¥484.4
billion. As a result, the ratio of interest-bearing debt to total assets was 14.5%, a
decrease of 2.2 points year on year. Retirement and severance benefits decreased
by ¥39.8 billion. However, taking into account such factors as increases in trade
payables, accrued income taxes and accrued expenses by ¥64.1 billion, ¥24.2
billion and ¥11.3 billion, respectively, total liabilities rose by ¥29.8 billion to
¥2,223.7 billion.
Mitsubishi Electric Corp. shareholders’ equity rose by ¥85.8 billion compared
with the previous fiscal year-end to ¥1,050.3 billion and the ratio of Mitsubishi
Electric Corp. shareholders’ equity to total assets was 31.5%, up 1.5 points year
on year. The principal contributor to these increases was ¥124.5 billion in net
income attributable to Mitsubishi Electric Corp. These results occurred despite
such decreases as a ¥19.4 billion fall in accumulated other comprehensive
income—accompanying high yen exchange rates and a drop in share prices—
and the payment of cash dividends totaling ¥19.3 billion.
FINANCIAL POSITION
07 08 09 1007 08 09 10 1111
18.6
15.8
20.3
16.7
14.5
641
551
678
538484
Interest-bearing debt Interest-bearing debt / (Yen in billions) Total assets (%)
Interest-bearing debt Debt ratio
25.5
30.0 31.530.7 29.6
07 08 09 1007 08 09 10 1111
1,0591,031849 965 1,050
3,452 3,4853,334 3,215
3,333
Total assets (Yen in billions) Mitsubishi Electric Corp. shareholders’ equity (Yen in billions)
Shareholders’ equity ratio (%)
Total assets / Mitsubishi Electric Corp. shareholders’ equity
Shareholders’ equity ratio

MITSUBISHI ELECTRIC CORPORATION ANNUAL REPORT 2011 35
In line with its policy of expanding and accelerating performance by imple-
menting Balanced Corporate Management while pursuing further growth, the
Mitsubishi Electric Group aims to realize its growth strategies as it increases
profitability. To that end, the Group directed its capital investment mainly
toward the areas of energy and electric systems, factory automation equipment,
automotive products and power devices. At the same time the Group contin-
ued to reinforce its solid business platform through the careful selection and
concentration of investments.
On an individual business segment basis, investments were made in Energy
and Electric Systems (including power systems, electric equipment for rolling
stock and elevators/escalators) aimed at increasing production capacity, stream-
lining and enhancing quality. In Industrial Automation, capital expenditures
were principally used primarily for boosting production capacity for factory
automation systems and automotive equipment operations. In Information and
Communication Systems, funds were appropriated for bolstering research and
development capabilities, while in Electronic Devices, Mitsubishi Electric directed
investment primarily toward augmenting production in the power device busi-
ness. In Home Appliances, expenditures primarily focused on increasing the
production capacity of air-conditioning equipment and PV systems, streamlining
operations and enhancing quality. And in Common and Others, investments
went toward boosting research and development capabilities.
Capital expenditures are derived from cash on hand and funds from
operations. During the consolidated fiscal year under review, production capacity
was not materially affected by the sale, disposal, damage or loss due to natural
disaster of property, plant and equipment.
CAPITAL EXPENDITURES
In the year ended March 31, 2011, net cash provided by operating activities
amounted to ¥327.6 billion, while net cash used in investing activities was
¥145.6 billion. As a result, free cash flow was an inflow of ¥182.0 billion, down
¥13.7 billion compared with the previous fiscal year. Taken into account along
with net cash used in financing activities of ¥89.2 billion, fiscal year-end cash and
cash equivalents amounted to ¥472.1 billion, an increase of ¥80.9 billion year
on year.
Net cash provided by operating cash flows decreased by ¥2.6 billion com-
pared with the previous fiscal year to ¥327.6 billion. This was mainly due to a rise
in inventories in spite of an upswing in net income.
Net cash used in investing activities increased by ¥11.1 billion year on year
to ¥145.6 billion. This was mainly the result of higher purchases of short-term
investments and investment securities.
Net cash used in financing activities was ¥89.2 billion, a ¥76.0 billion
decrease compared with the previous fiscal year. This reflected the repayment of
borrowings and other factors.
CASH FLOWS
141130
145136141 148
109 108120
105
07 08 09 1007 08 09 10 1111
Capital expenditures Depreciation (Yen in billions) (Yen in billions)
Capital expenditures Depreciation
119 127
-34
196182
07 08 09 1007 08 09 10 1111
275
-156-132
-215
-134-146
259
181
330 328
Net cash provided by operating activities (Yen in billions) Net cash used in investing activities (Yen in billions)
Free cash flows (Yen in billions)
Cash flows

36 MITSUBISHI ELECTRIC CORPORATION ANNUAL REPORT 2011
Consolidated Balance Sheets
Mitsubishi Electric Corporation and Subsidiaries
March 31, 2011 and 2010
Yen (millions)
U.S. dollars (thousands)
(note 2)
2011 2010 2011
Assets
Current assets:
Cash and cash equivalents ¥ 472,067 ¥ 391,118 $ 5,687,554
Short-term investments (notes 3, 18 and 19) 10,031 9,542 120,856
Trade receivables (notes 4, 6 and 16) 790,991 790,754 9,530,012
Inventories (note 5) 527,504 474,204 6,355,470
Prepaid expenses and other current
assets (notes 9, 15 and 19) 272,471 261,855 3,282,783
Total current assets 2,073,064 1,927,473 24,976,675
Long-term receivables and investments:
Long-term trade receivables (note 18) 2,090 1,560 25,181
Investments in securities and other (notes 3, 15, 18 and 19) 259,164 292,281 3,122,458
Investments in and advances to affiliated
companies (note 6 and 19) 189,789 173,372 2,286,614
Total long-term receivables and investments 451,043 467,213 5,434,253
Property, plant and equipment (notes 7, 19, 20 and 21):
Land 99,438 98,484 1,198,048
Buildings 611,574 604,019 7,368,361
Machinery and equipment 1,475,820 1,461,201 17,780,964
Construction in progress 26,862 22,472 323,639
2,213,694 2,186,176 26,671,012
Less accumulated depreciation 1,686,241 1,668,642 20,316,157
Net property, plant and equipment 527,453 517,534 6,354,855
Other assets (notes 9, 10 and 19) 281,119 302,874 3,386,976
Total assets ¥3,332,679 ¥3,215,094 $40,152,759
See accompanying notes to consolidated financial statements.

MITSUBISHI ELECTRIC CORPORATION ANNUAL REPORT 2011 37
Yen (millions)
U.S. dollars (thousands)
(note 2)
2011 2010 2011
Liabilities and Equity
Current liabilities:
Bank loans (note 7) ¥ 64,905 ¥ 71,022 $ 781,988
Current portion of long-term debt (notes 7, 18 and 21) 137,856 57,977 1,660,916
Trade payables (notes 6 and 8) 697,789 633,670 8,407,096
Accrued expenses (note 17) 367,995 356,704 4,433,675
Accrued income taxes (note 9) 47,418 23,178 571,301
Other current liabilities (notes 10, 15 and 19) 154,424 124,358 1,860,530
Total current liabilities 1,470,387 1,266,909 17,715,506
Long-term debt (notes 7, 18 and 21) 281,591 408,501 3,392,663
Retirement and severance benefits (note 10) 419,008 458,763 5,048,289
Other liabilities (notes 9, 15, 17 and 19) 52,668 59,727 634,554
Total liabilities 2,223,654 2,193,900 26,791,012
Mitsubishi Electric Corp. shareholders' equity
Common stock (note 11):
Authorized 8,000,000,000 shares;
issued 2,147,201,551 shares in 2011 and in 2010 175,820 175,820 2,118,313
Capital surplus (note 11) 208,669 210,006 2,514,085
Legal reserve 59,223 58,281 713,530
Retained earnings 822,750 718,482 9,912,651
Accumulated other comprehensive
income (loss) (notes 3, 9, 10, 13 and 15) (215,919) (196,509) (2,601,434)
Treasury stock, at cost
264,421 shares in 2011 and
1,975,175 shares in 2010 (203) (1,496) (2,446)
Total Mitsubishi Electric Corp. shareholders' equity 1,050,340 964,584 12,654,699
Noncontrolling interests 58,685 56,610 707,048
Total equity 1,109,025 1,021,194 13,361,747
Commitments and contingent liabilities (note 17)
Total liabilities and equity ¥3,332,679 ¥3,215,094 $40,152,759

38 MITSUBISHI ELECTRIC CORPORATION ANNUAL REPORT 2011
Consolidated Statements of Income
Mitsubishi Electric Corporation and Subsidiaries
Years ended March 31, 2011, 2010 and 2009
Yen (millions)
U.S. dollars (thousands)
(note 2)
2011 2010 2009 2011
Revenues:
Net sales (note 6) ¥3,645,331 ¥3,353,298 ¥3,665,119 $43,919,651
Interest and dividends (note 6) 8,162 8,921 12,948 98,337
Other (notes 3, 13, 15 and 20) 28,035 18,277 21,015 337,771
Total revenues 3,681,528 3,380,496 3,699,082 44,355,759
Costs and expenses:
Cost of sales (notes 10 and 21) 2,622,959 2,505,095 2,710,976 31,601,916
Selling, general and administrative
(notes 10, 20 and 21) 645,779 614,062 650,455 7,780,470
Research and development 138,827 122,897 133,218 1,672,614
Loss on impairment of long-lived assets
(note 19 and 20) 4,005 16,942 30,742 48,253
Interest 7,749 9,345 11,013 93,361
Equity in losses of affiliated companies
(note 6 and 19) 20,285 34,801 67,715 244,398
Other (notes 3, 13, 15, 16 and 20) 31,687 13,095 51,030 381,771
Total costs and expenses 3,471,291 3,316,237 3,655,149 41,822,783
Income before income taxes 210,237 64,259 43,933 2,532,976
Income taxes (note 9):
Current 54,309 23,958 7,909 654,326
Deferred 22,788 7,432 20,137 274,554
77,097 31,390 28,046 928,880
Net income 133,140 32,869 15,887 1,604,096
Net income attributable to
noncontrolling interests 8,615 4,591 3,720 103,795
Net income attributable to
Mitsubishi Electric Corp. ¥ 124,525 ¥ 28,278 ¥ 12,167 $ 1,500,301
Net income per share attributable to Mitsubishi Electric Corp. (note 14):
YenU.S. dollars
(note 2)
Basic ¥58.00 ¥13.18 ¥5.67 $0.699
Diluted — 13.18 5.67 —
See accompanying notes to consolidated financial statements.

MITSUBISHI ELECTRIC CORPORATION ANNUAL REPORT 2011 39
Consolidated Statements of Equity
Mitsubishi Electric Corporation and Subsidiaries
Years ended March 31, 2011, 2010 and 2009
Yen (millions)
Common stock
Capital surplus
Legal reserve
Retained earnings
Accumulated other
comprehensive income (loss)
Treasury stock
Total Mitsubishi Electric Corp. shareholders’
equity
Non-controlling
interestsTotal
equity
Balance at March 31, 2008 ¥175,820 ¥210,890 ¥56,189 ¥708,033 ¥(118,987) ¥ (507) ¥1,031,438 ¥59,782 ¥1,091,220Comprehensive income (loss):
Net income attributable to Mitsubishi Electric Corp. 12,167 12,167 12,167 Net income attributable to noncontrolling interests 3,720 3,720 Other comprehensive income (loss), net of tax (note 13):
Foreign currency translation adjustments (52,388) (52,388) (6,469) (58,857)Pension liability adjustments (note 10) (85,127) (85,127) (85,127)Unrealized gains (losses) on securities (note 3) (28,610) (28,610) (175) (28,785)Unrealized gains (losses) on derivative instruments (note 15) 46 46 6 52
(153,912) (2,918) (156,830)Transfer to legal reserve 1,036 (1,036) — —Equity transactions with noncontrolling interests and other (4,400) (4,400)Dividends paid to Mitsubishi Electric Corp. shareholders’ equity (27,904) (27,904) (27,904)Purchase of treasury stock (205) (205) (205)Reissuance of treasury stock (9) 68 59 59 Balance at March 31, 2009 ¥175,820 ¥210,881 ¥57,225 ¥691,260 ¥(285,066) ¥ (644) ¥ 849,476 ¥52,464 ¥ 901,940 Comprehensive income (loss):
Net income attributable to Mitsubishi Electric Corp. 28,278 28,278 28,278 Net income attributable to noncontrolling interests 4,591 4,591 Other comprehensive income (loss), net of tax (note 13):
Foreign currency translation adjustments 5,975 5,975 1,226 7,201 Pension liability adjustments (note 10) 61,699 61,699 61,699 Unrealized gains (losses) on securities (note 3) 20,699 20,699 51 20,750 Unrealized gains (losses) on derivative instruments (note 15) 184 184 8 192
116,835 5,876 122,711 Transfer to legal reserve 1,056 (1,056) — —Equity transactions with noncontrolling interests and other (868) (868) (1,730) (2,598)Dividends paid to Mitsubishi Electric Corp. shareholders’ equityPurchase of treasury stock (872) (872) (872)Reissuance of treasury stock (7) 20 13 13 Balance at March 31, 2010 ¥175,820 ¥210,006 ¥58,281 ¥718,482 ¥(196,509) ¥(1,496) ¥ 964,584 ¥56,610 ¥1,021,194 Comprehensive income (loss):
Net income attributable to Mitsubishi Electric Corp. 124,525 124,525 124,525 Net income attributable to noncontrolling interests 8,615 8,615 Other comprehensive income (loss), net of tax (note 13):
Foreign currency translation adjustments (17,876) (17,876) (3,337) (21,213)Pension liability adjustments (note 10) 9,284 9,284 9,284 Unrealized gains (losses) on securities (note 3) (10,643) (10,643) (36) (10,679)Unrealized gains (losses) on derivative instruments (note 15) (175) (175) (8) (183)
105,115 5,234 110,349 Transfer to legal reserve 942 (942) — —Equity transactions with noncontrolling interests and other (1,516) (1,516) (3,159) (4,675)Dividends paid to Mitsubishi Electric Corp. shareholders’ equity (19,315) (19,315) (19,315)Purchase of treasury stock (46) (46) (46)Reissuance of treasury stock 179 1,339 1,518 1,518 Balance at March 31, 2011 ¥175,820 ¥208,669 ¥59,223 ¥822,750 ¥(215,919) ¥ (203) ¥1,050,340 ¥58,685 ¥1,109,025
U.S. dollars (thousands) (note 2)
Common stock
Capital surplus
Legal reserve
Retained earnings
Accumulated other
comprehensive income (loss)
Treasury stock
Total Mitsubishi Electric Corp. shareholders’
equity
Non-controlling
interestsTotal
equity
Balance at March 31, 2010 $2,118,313 $2,530,193 $702,181 $8,656,410 $(2,367,579) $(18,024) $11,621,494 $682,048 $12,303,542 Comprehensive income (loss):
Net income attributable to Mitsubishi Electric Corp. 1,500,301 1,500,301 1,500,301 Net income attributable to noncontrolling interests 103,795 103,795 Other comprehensive income (loss), net of tax (note 13):
Foreign currency translation adjustments (215,373) (215,373) (40,205) (255,578)Pension liability adjustments (note 10) 111,855 111,855 111,855 Unrealized gains (losses) on securities (note 3) (128,229) (128,229) (434) (128,663)Unrealized gains (losses) on derivative instruments (note 15) (2,108) (2,108) (96) (2,204)
1,266,446 63,060 1,329,506 Transfer to legal reserve 11,349 (11,349) — —Equity transactions with noncontrolling interests and other (18,265) (18,265) (38,060) (56,325)Dividends paid to Mitsubishi Electric Corp. shareholders’ equity (232,711) (232,711) (232,711)Purchase of treasury stock (554) (554) (554)Reissuance of treasury stock 2,157 16,132 18,289 18,289 Balance at March 31, 2011 $2,118,313 $2,514,085 $713,530 $9,912,651 $(2,601,434) $ (2,446) $12,654,699 $707,048 $13,361,747
See accompanying notes to consolidated financial statements.

40 MITSUBISHI ELECTRIC CORPORATION ANNUAL REPORT 2011
Consolidated Statements of Cash Flows
Mitsubishi Electric Corporation and Subsidiaries
Years ended March 31, 2011, 2010 and 2009
Yen (millions)
U.S. dollars (thousands)
(note 2)
2011 2010 2009 2011
Cash flows from operating activities:
Net income ¥ 133,140 ¥ 32,869 ¥ 15,887 $ 1,604,096 Adjustments to reconcile net income
to net cash provided by operating activities:
Depreciation 105,280 119,762 148,018 1,268,434 Impairment losses of property, plant and
equipment 3,538 16,425 28,704 42,627 Loss (gain) from sales and disposal of
property, plant and equipment, net (463) (1,056) 1,832 (5,578) Deferred income taxes 22,788 7,432 20,137 274,554 Loss (gain) from sales of securities and
other, net (1,300) (946) (605) (15,663) Devaluation losses of securities and other, net 3,979 3,099 18,556 47,940 Equity in losses of affiliated companies 20,285 34,801 67,715 244,398 Decrease (increase) in trade receivables (14,594) (16,170) 108,729 (175,831) Decrease (increase) in inventories (65,512) 56,358 (37,726) (789,301) Decrease (increase) in other assets 2,493 10,977 (8,800) 30,036 Increase (decrease) in trade payables 66,177 45,373 (133,954) 797,313 Increase (decrease) in accrued expenses and
retirement and severance benefits (29,019) (13,047) (43,192) (349,627) Increase (decrease) in other liabilities 43,653 7,069 (39,080) 525,940 Other, net 37,196 27,295 34,918 448,144 Net cash provided by operating activities 327,641 330,241 181,139 3,947,482
Cash flows from investing activities:
Capital expenditure (107,638) (109,069) (141,434) (1,296,843) Proceeds from sale of property,
plant and equipment 4,504 6,347 4,340 54,265 Purchase of short-term investments
and investment securities (51,640) (46,107) (86,749) (622,169) Proceeds from sale of short-term
investments and investment securities 18,895 20,145 13,693 227,651 Decrease (increase) in loans receivable (19) 831 146 (229) Other, net (9,732) (6,638) (4,935) (117,253) Net cash used in investing activities (145,630) (134,491) (214,939) (1,754,578)
Cash flows from financing activities:
Proceeds from long-term debt 100 92,711 102,940 1,205 Repayment of long-term debt (62,248) (106,584) (112,021) (749,976) Increase (decrease) in short-term debt, net (5,114) (146,487) 122,024 (61,614) Dividends paid (19,315) — (27,904) (232,711) Purchase of treasury stock (46) (872) (205) (554) Reissuance of treasury stock 5 13 59 60 Other, net (2,610) (3,988) — (31,446) Net cash provided by (used in) financing activities (89,228) (165,207) 84,893 (1,075,036)Effect of exchange rate changes on cash and cash equivalents (11,834) 1,959 (26,788) (142,579)Net increase in cash and cash equivalents 80,949 32,502 24,305 975,289 Cash and cash equivalents at beginning of year 391,118 358,616 334,311 4,712,265Cash and cash equivalents at end of year ¥ 472,067 ¥ 391,118 ¥ 358,616 $ 5,687,554
See accompanying notes to consolidated financial statements.

MITSUBISHI ELECTRIC CORPORATION ANNUAL REPORT 2011 41
Notes to Consolidated Financial Statements
Mitsubishi Electric Corporation and Subsidiaries
(1) BASIS OF PRESENTATION AND SUMMARY OF SIGNIFICANT ACCOUNTING POLICIES
(a) Description of Business
Mitsubishi Electric Corporation (the “Company”) is a multi-
national organization which develops, manufactures, sells
and distributes a broad range of electrical and electronic
equipments in the fields as diverse as home appliances and
space electronics.
The Company and its subsidiaries’ principal lines of
business are: (1) Energy and Electric Systems, (2) Industrial
Automation Systems, (3) Information and Communication
Systems, (4) Electronic Devices, (5) Home Appliances and
(6) Others.
Each line’s sales as a percentage of total consolidated
sales, before elimination of internal sales, for the year
ended March 31, 2011 are as follows: Energy and Electric
Systems—25%, Industrial Automation Systems—22%,
Information and Communication Systems—12%, Electronic
Devices—4%, Home Appliances—22% and Others—15%.
Majority of the operations of the Company and its
subsidiaries is mainly conducted in Japan. Net sales for the
year ended March 31, 2011 comprises of the following
geographical locations: Japan—66%, North America—7%,
Asia (excluding Japan)—17%, Europe—8% and Others—2%.
Our manufacturing operations are conducted principally
at the Parent company with 22 manufacturing sites located in
Japan as well as overseas manufacturing sites located in the
United States, United Kingdom, Thailand, Malaysia, China and
other countries.
(b) Basis of Presentation
The Company and its subsidiaries maintain their books of
account in conformity with financial accounting standards in
the countries of their domicile.
The Company prepares the consolidated financial state-
ments with reflecting the adjustments which are considered
necessary to conform with accounting principles generally
accepted in the United States of America.
(c) Consolidation
The Company prepares the consolidated financial statements
including the accounts of the parent company and those of
its majority-owned subsidiaries, whether directly or indirectly
controlled. All significant intercompany transactions, accounts,
and unrealized gains or losses have been eliminated.
Investments in corporate joint ventures and affiliated
companies with the ownership interest of 20% to 50%, in
which the Company does not have control, but has the ability
to exercise significant influence, are accounted for by the
equity method of accounting. Investments of less than 20%
or where the Company does not have significant influence are
accounted for by the cost method.
The Company evaluates Variable Interest Entities (VIEs)
whether it has a controlling financial interest in an entity
through means other than voting rights and whether it should
consolidate the entity as the primary beneficiary when the
Company has a controlling financial interest.
Starting this Year, the Company applies FASB Accounting
Standards Updates (ASU) 2009-17 “Improvements to Financial
Reporting by Enterprises Involved with Variable Interest
Entities”. ASU 2009-17 changes the approach to determining
a VIE‘s primary beneficiary and requires companies to more
frequently reassess whether they must consolidate a VIE. The
Company anticipates that there are no material effects on
the Company’s consolidated financial position and results of
operation from the adoption of ASU 2009-17.
(d) Use of Estimates
The Company makes estimates and assumptions to prepare
the consolidated financial statements in conformity with
generally accepted accounting principles, and those estimates
and assumptions affect the reported amounts of assets and
liabilities as well as the disclosed amounts of contingent assets
and liabilities at the date of the consolidated financial state-
ments and the reported amounts of revenues and expenses
during the reporting period. Significant items subject to such
estimates and assumptions include valuation allowances for
receivables, inventories and deferred tax assets; the carry-
ing amount of property, plant and equipment; and assets
and obligations related to employee benefits. Actual results
could differ from those estimates. In the year ended March
31, 2009, the Company changed its accounting estimates
relating to the useful life of certain machinery and equipment.
As a result of the change, net income and net income per
share (basic and diluted) decreased by ¥5,747 million and
¥2.68, respectively.
(e) Cash and Cash Equivalents
The Company considers all highly liquid debt instruments
with original maturities of three months or less to be cash
equivalents for the consolidated cash flow statements.
(f) Short-Term Investments and Investment Securities
The Company classifies investments in debt and equity secu-
rities into trading, available-for-sale, or held-to-maturity
securities.
Trading securities are bought and held principally for the
purpose of selling them in the near term. Held-to-maturity
securities are those securities in which the Company has the
ability and intent to hold the security until maturity. All securi-
ties not included in trading or held-to-maturity are classified
as available-for-sale.
Trading and available-for-sale securities are recorded
at fair value. Held-to-maturity securities are recorded at

42 MITSUBISHI ELECTRIC CORPORATION ANNUAL REPORT 2011
amortized cost, adjusted for the amortization or accretion of
premiums or discounts. Unrealized holding gains and losses
on trading securities are included in earnings. Unrealized
holding gains and losses, net of the related tax effect, on
available-for-sale securities are excluded from earnings and
are reported as a separate component of other comprehen-
sive income (loss) until realized. Realized gains or losses from
the sale of securities are determined on the average cost of
the particular security held at the time of sale.
A decline in the fair value of any available-for-sale security
below costs that is other-than-temporary results in a reduction
in carrying amount to the fair value, which becomes the new
cost basis for the security.
To determine whether an impairment of equity security
is other-than-temporary, the Company considers whether it
has the ability and intent to hold the security until a market
price recovery and considers whether evidence indicating
the market price of the security is recoverable to the carrying
amount outweighs the counter evidence. Evidence considered
in this assessment includes the reasons for the impairment,
the severity and duration of the impairment, changes in value
subsequent to year-end, and forecasted performance of
the investee.
To determine whether an impairment of debt security is
other-than-temporary, the Company considers whether it has
the intent to sell the equity investment and more likely than
not where the Company is required to sell until a market price
of the investment is recoverable to the amortized cost.
Other investments are stated at cost. The Company rec-
ognizes a loss when there is other-than-temporary decline in
value of other investments, using the same policy as described
above for available-for-sale security impairments.
(g) Allowance for Doubtful Receivables
The Company records an allowance for doubtful receiv-
ables based on credit loss history and evaluation of specific
doubtful receivables.
(h) Inventories
In work-in-process, the Company records the ordered products
at the acquisition cost and the regular purchased products at
the average production costs. Those products are recorded at
the lower of cost or market. Net costs in excess of billings on
long-term contracts are included in inventories. Raw material
and finished product inventories are generally recorded using
the average-cost method, and evaluated at the lower of
cost or market. In accordance with the general practice in
the heavy electrical industry, inventories related to Energy
and Electric Systems include items with long manufacturing
periods which are not realizable within one year.
(i) Property, Plant and Equipment
The Company records property, plant and equipment at cost.
Depreciation of property, plant and equipment is generally
calculated by the declining-balance method, except for certain
assets which are depreciated by the straight-line method, over
the estimated useful life of the assets according to general
class, type of construction, and use of these assets.
The estimated useful life of buildings is 3 to 50 years,
while machinery and equipment is 2 to 20 years.
(j) Leases
The Company records capital leases at the inception of the
lease at the lower of the discounted present value of future
minimum lease payments or the fair value of the leased
assets. The amortization of the leased assets is calculated in
accordance with the Company’s normal depreciation policy.
(k) Income Taxes
The Company recognizes deferred tax assets and liabilities
for the future tax consequences attributable to differences
between the financial statement carrying amounts of existing
assets and liabilities and their respective tax basis, operating
loss and tax credit carryforwards. Deferred tax assets and
liabilities are measured using enacted tax rates expected to
apply to taxable income in the years in which the tempo-
rary differences are expected to be recovered or settled. The
effect on deferred tax assets and liabilities of a change in
tax rates is recognized in income in the period that includes
the enactment date. Valuation allowances are established to
reduce deferred tax assets to their net realizable value if it is
more likely than not that some portion or all of the deferred
tax asset will not be realized.
The Company recognizes the financial statement effects
of unrecognized tax benefits only if those positions are more
likely than not of being sustained.
(l) Product Warranties
The Company generally offers warranties on its products
against certain manufacturing and other defects for the spe-
cific periods of time and/or usage of the product depending
on the nature of the product, the geographic location of its
sale and other factors. The Company recognizes accrued war-
ranty costs based primarily on historical experience of actual
warranty claims as well as current information on repair costs.
(m) Retirement and Severance Benefits
The Company recognizes the funded status (i.e., the difference
between the fair value of plan assets and the projected bene-
fit obligations) of its pension plans in the consolidated balance
sheet at the end of the year, and records the corresponding
amount to Accumulated other comprehensive income (loss),
net of tax. The adjustment items for Accumulated other
comprehensive income (loss) are unrecognized prior service
cost and unrecognized net gain or loss. The amounts of these
adjustments are recognized as net periodic pension cost in
future fiscal years.

MITSUBISHI ELECTRIC CORPORATION ANNUAL REPORT 2011 43
(n) Revenue Recognition
The Company recognizes revenue when persuasive evidence
of an arrangement including title transfer exists, delivery has
occurred, the sales price is fixed or determinable, and collect-
ibility is probable. These criteria are met for mass-merchandis-
ing products such as consumer products and semiconductors
at the time when the product is received by the customer,
and for products with acceptance provisions such as heavy
machinery and industrial products at the time when the prod-
uct is received by the customer and the specific criteria of the
product are demonstrated by the Company with only certain
inconsequential or perfunctory work left to be performed
by the customer. Revenue from maintenance agreements is
recognized over the contract term when the maintenance is
provided and the cost is incurred. Also, the Company applies
the percentage of completion method for long-term con-
struction contracts. The Company measures the percentage
of completion by comparing expenses recognized through
the current year to the aggregate amount of estimated cost.
Any anticipated losses on fixed price contracts are charged
to operations when such losses can be estimated. Provisions
are made for contingencies in the period when they become
known pursuant to specific contract terms and conditions and
are estimable.
The contract which may consists of any combination of
products, equipment, installation and maintenance is allo-
cated revenue to each accounting unit based on its relative
fair value, when each deliverable is accounted for separate
accounting unit.
(o) Research and Development and Advertising
The Company accounts for the costs of research and devel-
opment and advertising as expense when those costs are
incurred.
(p) Shipping and Handling Costs
The Company records shipping and handling costs mainly as
selling, general and administrative expenses.
(q) Net Income per Share
The Company calculates basic net income per share attribut-
able to Mitsubishi Electric Corp. divided net income attribut-
able to Mitsubishi Electric Corp. by the weighted-average
number of common shares outstanding during each year.
Diluted net income per share attributable to Mitsubishi Electric
Corp. reflects the potential dilution and is calculated on the
basis that dilutive securities were converted at the beginning
of the year or at time of issuance (if later), and that dilutive
stock option were exercised (less the number of treasury
stock assumed to be purchased from the proceeds using the
average market price of the Company’s common stock).
(r) Foreign Currency Translation
The Company translates receivables and payables in foreign
currency at the prevailing rates of exchange at the balance
sheet date. Gains and losses resulting from translation of
receivables and payables are recognized in current earnings.
Assets and liabilities of the Company’s overseas consolidating
subsidiaries are translated into Japanese yen at the prevail-
ing rates of exchange at the balance sheet date. Income and
expense items are translated at the average exchange rate
prevailing during the year. Gains and losses resulting from
translation of financial statements are recognized as foreign
currency translation adjustments in other comprehensive
income (loss).
(s) Derivatives
The Company recognizes all derivatives as either assets or lia-
bilities in the consolidated financial statements and measures
them at fair value. For derivatives designated as fair value
hedges, changes in fair value of the hedged item and the
derivative are recognized in current earnings. For derivatives
designated as cash flow hedges, fair value changes of the
effective portion of the hedging instruments are recognized as
a component of other comprehensive income (loss) until the
hedged item is recognized in earnings. The ineffective portion
of all hedges is recognized in earnings immediately.
The Company discloses the use and purpose of derivative
instruments, accounting for derivative instruments and related
hedged items. The Company also discloses the effects on the
entity’s financial position, financial performance, and cash
flows by the derivative instruments and hedging activities.
(t) Securitizations
The Company accounts for the securitization of the accounts
receivables as a sale, if it is determined based on the
Company’s evaluation that it has surrendered control over the
transferred receivables.
Accordingly, the receivables sold under these facilities
are excluded from Trade receivables in the accompanying
consolidated balance sheets. Gain or loss on sale of receiv-
ables is calculated based on the allocated carrying amount of
the receivables sold. When a portion of accounts receivables
is transferred, the participating interest that continues to be
held is recorded at the allocated carrying amount of the assets
based on their relative fair values at the date of the transfer.
The Company estimates fair value based on the present value
of future expected cash flows less credit losses.
Starting this Year, the Company applies FASB ASU
2009-16 “Accounting for Transfers of Financial Assets”.
ASU 2009-16 eliminates the concept of a qualifying special-
purpose entity (QSPE), creates more stringent conditions for
reporting a transfer of a portion of a financial asset as a sale,
clarifies other sale-accounting criteria, and changes the initial
measurement of a transferor’s interest in transferred financial
assets. The Company anticipates that there are no material
effects on the Company’s consolidated financial position and
results of operation from the adoption of ASU 2009-16.

44 MITSUBISHI ELECTRIC CORPORATION ANNUAL REPORT 2011
(u) Impairment of Long-Lived Assets
The Company reviews for impairment of long-lived assets
such as property, plant, and equipment and purchased intan-
gibles subject to amortization, to be held and used whenever
events or changes in circumstances indicate that the carrying
amount of an asset may not be recoverable. Recoverability of
assets to be held and used is measured by a comparison of
the carrying amount of an asset to estimated undiscounted
future cash flows expected to be generated by the asset. If
the carrying amount of an asset exceeds its estimated future
cash flows, an impairment loss is recognized by the amount
by which the carrying amount of the asset exceeds the fair
value of the asset. Long-lived assets to be disposed of other
than sale continue to be classified as held and used until they
are disposed.
Long-lived assets classified as held-for-sale are separately
presented in the balance sheet and reported at the lower of
the carrying amount or fair value less costs to sell, and are
no longer depreciated. The assets and liabilities of a disposed
group classified as held-for-sale are presented separately in
the appropriate asset and liability sections of the consolidated
balance sheets.
(v) Stock-based Compensation
When the Company grants stock-option to employees and
others, the Company recognizes the cost of employee ser-
vices received in exchange for stock compensation based on
the grant-date fair value of the employee stock options and
incremental compensation costs arising from subsequent
modifications of awards after the grant date.
(w) Goodwill and Other Intangible Assets
The Company accounts for acquisition of companies using
the acquisition method. The Company recognizes at fair value
the assets acquired, the liabilities assumed, any noncontrolling
interests in the acquiree, and acquired goodwill at the acquisi-
tion date. The Company discloses the nature of business com-
bination to enable the readers to evaluate the effects of such
transaction on the consolidated financial statements.
The Company does not amortize goodwill but tests it for
impairment at least annually. Also other intangible assets with
indefinite useful life are not amortized, but instead tested for
impairment until its useful life is determined. On the other
hand, other intangible assets determined to have useful life
are amortized over their respective estimated useful life and
tested for impairment.
(x) Cost Associated with Exit or Disposal Activities
The Company recognizes the costs associated with exit or dis-
posal activities as liability only when it meets the definition of
a liability in the Statements of Financial Accounting Concepts
No. 6, “Elements of Financial Statements”. The Company uses
fair value for initial measurement of liabilities related to exit or
disposal activities.
(y) Guarantees
The Company recognizes the guarantees and indemnifica-
tion arrangements as liability measured at fair value as they
are issued or modified by the Company, and discloses the
guarantees that the Company has undertaken, including a
rollforward of the Company’s product warranty liabilities. The
Company continually monitors the conditions of the guaran-
tees and indemnifications to identify occurrence of probable
losses, and when such losses are identified and if estimable,
they are recognized in current earnings.
(z) Asset Retirement Obligations
The Company recognizes legal obligations associated with the
retirement of long-lived assets that result from an acquisition,
construction and development, and (or) from a normal opera-
tion of a long-lived asset, except for certain lease obligations.
The Company recognizes a liability for an asset retirement
obligation at fair value in the period which it is incurred if a
reasonable estimate of fair value can be made. The associated
asset retirement costs are capitalized as part of the carrying
amount of the long-lived asset and subsequently allocated to
expense over the asset’s useful life. Subsequent to the initial
measurement of the asset retirement obligation, the obliga-
tion is adjusted at the end of each period to reflect the pas-
sage of time and changes in the estimated future cash flows
underlying the obligation.
(aa) Reclassifications
The Company has made certain reclassifications of the previ-
ous fiscal years’ consolidated financial statements to conform
to the presentation used for the year ended March 31, 2011.
(bb) Future Application of New Accounting Standards
The Company recognizes ASU issued by FASB as new
accounting standards.
In October 2009, the FASB issued ASU 2009-13 “Multiple-
Deliverable Revenue Arrangements” (An Amendment of
Accounting Standards Codification Topic (ASC Topic) 605
“Revenue Recognition”). ASU 2009-13 requires the selling
price used for each deliverable be based on estimated sell-
ing price (ESP) if neither vender specific objective evidence
(VSOE) nor third party evidence (TPE) is available, and that
arrangement consideration be allocated at the inception of
the arrangement to all deliverables using the relative selling
price method regardless of whether the selling price is deter-
mined based on VSOE, TPE, or ESP. As a result, the residual
method of allocating arrangement consideration will no lon-
ger be permitted. ASU 2009-13 also requires qualitative and
quantitative expanded disclosures. The Company is required
to adopt ASU 2009-13 on April 1, 2011. The Company is cur-
rently evaluating the effects on the Company's consolidated
financial position and results of operations upon adoption of
ASU 2009-13.
In October 2009, the FASB issued ASU 2009-14 “Certain

MITSUBISHI ELECTRIC CORPORATION ANNUAL REPORT 2011 45
Revenue Arrangements That Include Software Elements” (An
Amendment of ASC Topic 985 “Software”). ASU 2009-14
excludes tangible products containing software components
and non-software components that function together to deliv-
er the tangible product’s essential functionality from scope of
the software revenue guidance. ASU 2009-14 also requires
disclosures that are included within the amendments in ASU
2009-13. The Company is required to adopt ASU 2009-14 on
April 1, 2011. The Company is currently evaluating the effects
on the Company's consolidated financial position and results
of operations upon adoption of ASU 2009-14.
In December 2010, the FASB issued ASU 2010-28
“When to Perform Step 2 of the Goodwill Impairment Test
for Reporting Units with Zero or Negative Carrying Amounts”
(An Amendment of ASC Topic 350 “Intangibles-Goodwill
and Other”). ASU 2010-28 modifies Step 1 of the goodwill
impairment test which required an entity to compare the fair
value of reporting unit with its carrying amount including
goodwill for reporting units with zero or negative carrying
amounts, and requires the entity, if there are any adverse
qualitative factors indicating that it is more likely than not
that an impairment exists, to perform Step 2 of the goodwill
impairment test and calculate the amount of impairment
loss by comparing the implied fair value of reporting unit’s
goodwill with the carrying amount of goodwill. The Company
is required to adopt ASU 2010-28 on April 1, 2011. The
Company is currently evaluating the effects on the Company's
consolidated financial position and results of operations upon
adoption of ASU 2010-28.
In December 2010, the FASB issued ASU 2010-29
“Disclosure of Supplementary Pro Forma Information for
Business Combinations” (An Amendment of ASC Topic 805
“Business Combination”). ASU 2010-29 requires to disclose
the business combination(s) that occurred during the current
year as though it had occurred as of the beginning of the
comparable prior annual reporting period, if comparative pro
forma financial information of both current and prior annual
reporting periods is presented. ASU 2010-29 also expands the
supplemental pro forma disclosure requirements to include
a description of the nature and amount of material, nonrecur-
ring pro forma adjustments directly attributable to the business
combination in the reported pro forma revenue and earnings.
The Company is required to adopt ASU 2010-29 on April 1,
2011. The Company anticipates that there are no material
effects on the Company’s consolidated financial position and
results of operations upon adoption of ASU 2010-29.
In Apri l 2011, the FASB issued ASU 2011-03
“Reconsideration of Effective Control for Repurchase
Agreements” (An Amendment of ASC Topic 860 “Transfer and
Servicing”). ASU 2011-03 removes from assessment of effec-
tive control one of the criterions that required a transferor at
all times during the contract term to have obtained cash or
other collateral sufficient to fund substantially all of the cost
of purchasing replacement financial assets from others. The
Company is required to adopt ASU 2011-03 prospectively
to transactions or modifications of existing transactions that
occur on or after January 1, 2012. The Company is currently
evaluating the effects on the Company's consolidated finan-
cial position and results of operations upon adoption of ASU
2011-03.
(2) U.S. DOLLAR AMOUNTS
The Company has presented the consolidated financial
statements in Japanese yen, and solely for the convenience of
the reader, has provided translated amounts in United States
dollars at the rate of ¥83=U.S.$1, which was the approximate
exchange rate prevailing on the Tokyo Foreign Exchange
Market at the end of March 2011. This translation should not
be construed as a representation that the amounts shown
could be converted into United States dollars at such rate.
(3) SECURITIES
Marketable securities included in short-term investments and
investments in securities and other consist of available-for-
sale securities. The cost, gross unrealized holding gains, gross
unrealized holding losses and fair value for such securities by
equity securities and debt securities at March 31, 2011 and
2010 were as follows:Yen (millions)
Cost
Grossunrealized
holdinggains
Grossunrealized
holdinglosses Fair value
2011:
Available-for-sale:
Equity securities ¥102,609 ¥27,900 ¥ 9,946 ¥120,563
Debt securities 59,453 2,714 9,478 52,689
¥162,062 ¥30,614 ¥19,424 ¥173,252
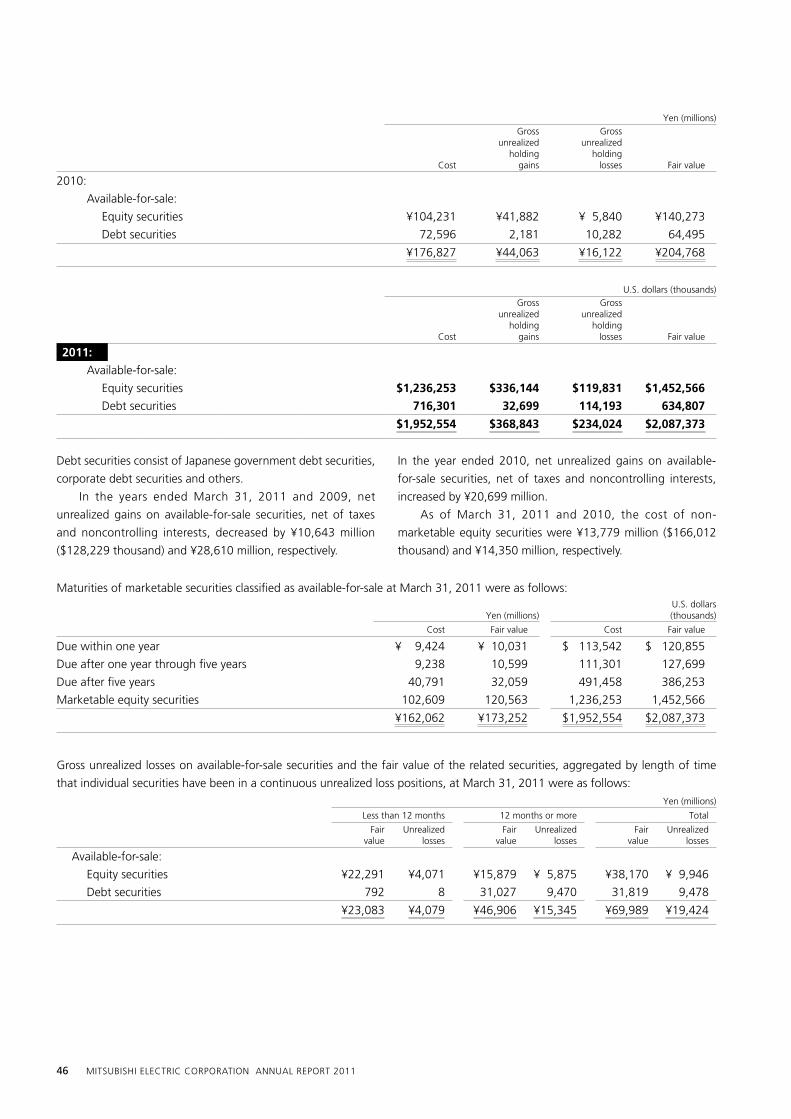
46 MITSUBISHI ELECTRIC CORPORATION ANNUAL REPORT 2011
Yen (millions)
Cost
Grossunrealized
holdinggains
Grossunrealized
holdinglosses Fair value
2010:
Available-for-sale:
Equity securities ¥104,231 ¥41,882 ¥ 5,840 ¥140,273
Debt securities 72,596 2,181 10,282 64,495
¥176,827 ¥44,063 ¥16,122 ¥204,768
U.S. dollars (thousands)
Cost
Grossunrealized
holdinggains
Grossunrealized
holdinglosses Fair value
2011:
Available-for-sale:
Equity securities $1,236,253 $336,144 $119,831 $1,452,566
Debt securities 716,301 32,699 114,193 634,807
$1,952,554 $368,843 $234,024 $2,087,373
Debt securities consist of Japanese government debt securities,
corporate debt securities and others.
In the years ended March 31, 2011 and 2009, net
unrealized gains on available-for-sale securities, net of taxes
and noncontrolling interests, decreased by ¥10,643 million
($128,229 thousand) and ¥28,610 million, respectively.
In the year ended 2010, net unrealized gains on available-
for-sale securities, net of taxes and noncontrolling interests,
increased by ¥20,699 million.
As of March 31, 2011 and 2010, the cost of non-
marketable equity securities were ¥13,779 million ($166,012
thousand) and ¥14,350 million, respectively.
Maturities of marketable securities classified as available-for-sale at March 31, 2011 were as follows:
Yen (millions)U.S. dollars(thousands)
Cost Fair value Cost Fair value
Due within one year ¥ 9,424 ¥ 10,031 $ 113,542 $ 120,855
Due after one year through five years 9,238 10,599 111,301 127,699
Due after five years 40,791 32,059 491,458 386,253
Marketable equity securities 102,609 120,563 1,236,253 1,452,566
¥162,062 ¥173,252 $1,952,554 $2,087,373
Gross unrealized losses on available-for-sale securities and the fair value of the related securities, aggregated by length of time
that individual securities have been in a continuous unrealized loss positions, at March 31, 2011 were as follows:
Yen (millions)
Less than 12 months 12 months or more Total
Fair value
Unrealized losses
Fair value
Unrealized losses
Fair value
Unrealized losses
Available-for-sale:
Equity securities ¥22,291 ¥4,071 ¥15,879 ¥ 5,875 ¥38,170 ¥ 9,946
Debt securities 792 8 31,027 9,470 31,819 9,478
¥23,083 ¥4,079 ¥46,906 ¥15,345 ¥69,989 ¥19,424

MITSUBISHI ELECTRIC CORPORATION ANNUAL REPORT 2011 47
U.S. dollars (thousands)
Less than 12 months 12 months or more Total
Fair value
Unrealized losses
Fair value
Unrealized losses
Fair value
Unrealized losses
Available-for-sale:
Equity securities $268,566 $49,048 $191,314 $ 70,783 $459,880 $119,831
Debt securities 9,542 96 373,819 114,097 383,361 114,193
$278,108 $49,144 $565,133 $184,880 $843,241 $234,024
The Company did not recognize an impairment loss from the
decline in the fair value of the marketable securities includ-
ing the unrealized losses. Based on that evaluation and the
Company’s ability and intent to hold those securities for
a reasonable period of time sufficient for a recovery of fair
value, the Company does not consider those securities to be
other-than-temporarily impaired.
Proceeds from the sale of available-for-sale securities and gross realized gains and losses on those sales in the years ended March
31, 2011, 2010 and 2009 were as follows:
Yen (millions)U.S. dollars (thousands)
2011 2010 2009 2011
Proceeds ¥3,955 ¥1,406 ¥1,732 $47,651
Gross realized gains 1,157 672 81 13,940
Gross realized losses 11 27 0 133
For the years ended March 31, 2011, 2010 and 2009 the Company recognized loss on impairment of marketable securities
¥3,679 million ($44,325 thousand), ¥2,864 million and ¥18,071 million due to other-than-temporary declines in fair value.
(4) TRADE RECEIVABLESS
Trade receivables are summarized as follows:
Yen (millions)U.S. dollars (thousands)
2011 2010 2011
Notes receivable ¥ 58,931 ¥ 49,364 $ 710,012
Accounts receivable 740,433 750,503 8,920,880
Allowance for doubtful receivables (8,373) (9,113) (100,880)
¥790,991 ¥790,754 $9,530,012
(5) INVENTORIES
Inventories are comprised of the following:
Yen (millions)U.S. dollars (thousands)
2011 2010 2011
Work in process ¥249,173 ¥246,685 $3,002,084
Less accumulated billings on long-term contracts 16,198 21,075 195,156
232,975 225,610 2,806,928
Raw materials 79,334 75,664 955,831
Finished products 215,195 172,930 2,592,711
¥527,504 ¥474,204 $6,355,470

48 MITSUBISHI ELECTRIC CORPORATION ANNUAL REPORT 2011
(6) INVESTMENTS IN AFFILIATED COMPANIES
Summary of combined financial information relating to affiliated companies accounted for by the equity method of accounting
(Renesas Electronics Corp., Toshiba Mitsubishi-Electric Industrial Systems Corp., etc.) as of March 31, 2011 and 2010, and for the
years ended March 31, 2011, 2010 and 2009 is as follows:
Yen (millions)U.S. dollars (thousands)
2011 2010 2011
Financial Position
Current assets ¥1,570,042 ¥1,229,928 $18,916,169
Property, plant and equipment 438,814 336,384 5,286,915
Other assets 252,402 147,978 3,040,988
Total assets ¥2,261,258 ¥1,714,290 $27,244,072
Current liabilities ¥1,270,234 ¥ 917,638 $15,304,024
Long-term debt 387,360 283,838 4,666,988
Total liabilities 1,657,594 1,201,476 19,971,012
Shareholders’ equity 603,664 512,814 7,273,060
Total liabilities and shareholders’ equity ¥2,261,258 ¥1,714,290 $27,244,072
Yen (millions)
U.S. dollars (thousands)
2011 2010 2009 2011
Results of Operations
Sales ¥2,181,546 ¥1,614,702 ¥1,840,643 $26,283,687
Net income (loss) attributable to affiliated companies (69,818) (37,851) (162,843) (841,181)
The balances and transactions with affiliated companies accounted for by the equity method of accounting as of March 31, 2011
and 2010, and for the years ended March 31, 2011, 2010 and 2009 is as follows:
Yen (millions)U.S. dollars (thousands)
2011 2010 2011
Trade receivables ¥ 69,625 ¥ 67,116 $ 838,855
Trade payables 146,925 125,410 1,770,181
Yen (millions)
U.S. dollars (thousands)
2011 2010 2009 2011
Sales ¥314,174 ¥281,043 ¥324,670 $3,785,229
Purchases 160,188 148,308 189,714 1,929,976
Dividends 8,963 7,558 7,644 107,988
Investments in affiliated companies accounted for by the equity method of accounting include the shares of 10 publicly quoted
affiliates (9 publicly quoted affiliates existed in 2010), which are summarized as follows:
Yen (millions)U.S. dollars (thousands)
2011 2010 2011
Investments at equity ¥ 95,177 ¥34,606 $1,146,711
Quoted market value 107,758 34,454 1,298,289
Due to an affiliated company accounted for by the equity
method of accounting named Renesas Technology Corp.
merged with NEC Electronics Corp., Renesas Electronics Corp.
(Renesas) was established on April 1, 2010. The Company
was allocated 20.5 shares of Renesas per share of Renesas
Technology Corp. at the effective date of its merger.
Renesas offered allocation of new stocks which is total
amounts of ¥134,600 million ($1,621,687 thousand) to the
Company, NEC Corporation and Hitachi, Ltd. The Company
was accepted ¥35,235 million ($424,518 thousand) to new
stocks allocation. As a result of its merger, the Company’s
ownership interest for Renesas is 25.05% and the Company

MITSUBISHI ELECTRIC CORPORATION ANNUAL REPORT 2011 49
accounts for by equity method to investment on Renesas.
The Company includes the amounts of $13,785 million
($166,084 thousand) which is difference between the costs of
investments $98,472 million ($1,186,410 thousand) and the
amounts of net assets which is after fair value measurements
at effective date $84,687 million ($1,020,325 thousand) in
investments in affiliated companies as goodwill related to
equity investment on consolidated balance sheets.
At March 31, 2011, the Company recognizes that no
impairment exists on its goodwill.
Bank loans consisted of the following:
Yen (millions)U.S. dollars (thousands)
2011 2010 2011
Borrowings from banks and others ¥64,555 ¥70,652 $777,771
Commercial paper 350 370 4,217
¥64,905 ¥71,022 $781,988
The weighted average interest rates on borrowings from
banks and others outstanding as of March 31, 2011 and 2010
were 0.74% and 0.97%, respectively.
At March 31, 2011, the Company had unused committed
lines of credit that can provide short-term funds from sub-
scribing financial institutions amounting to ¥114,000 million
($1,373,494 thousand).
(7) BANk LOANS AND LONG-TERM DEBT
Long-term debt consisted of the following:
Yen (millions)U.S. dollars (thousands)
2011 2010 2011
Borrowings from banks and other companies,
due 2011 to 2021 with bearing interest rate
ranging from 0.42% to 8.00% at March 31, 2011:
due 2010 to 2021 with bearing interest rate
ranging from 0.53% to 8.91% at March 31, 2010:
Secured ¥ 1,305 ¥ 1,312 $ 15,723
Unsecured 253,532 301,492 3,054,602
1.76% Japanese yen bonds due 2011 25,000 25,000 301,205
1.70% Japanese yen bonds due 2012 10,000 10,000 120,482
1.40% Japanese yen bonds due 2012 40,000 40,000 481,928
1.17% Japanese yen bonds due 2014 30,000 30,000 361,446
0.58% Japanese yen bonds due 2013 30,000 30,000 361,446
1.38% Japanese yen bonds due 2011 14 — 169
0.94% Japanese yen bonds due 2012 200 — 2,409
Capital lease obligations 29,396 28,674 354,169
419,447 466,478 5,053,579
Less amount due within one year 137,856 57,977 1,660,916
¥281,591 ¥408,501 $3,392,663
The aggregate annual maturities of long-term debt outstanding at March 31, 2011 were as follows:
Year ending March 31:
Yen (millions)U.S. dollars (thousands)
2012 ¥137,856 $1,660,916
2013 88,297 1,063,819
2014 98,063 1,181,482
2015 34,086 410,675
2016 7,470 90,000
Thereafter 53,675 646,687
Total ¥419,447 $5,053,579
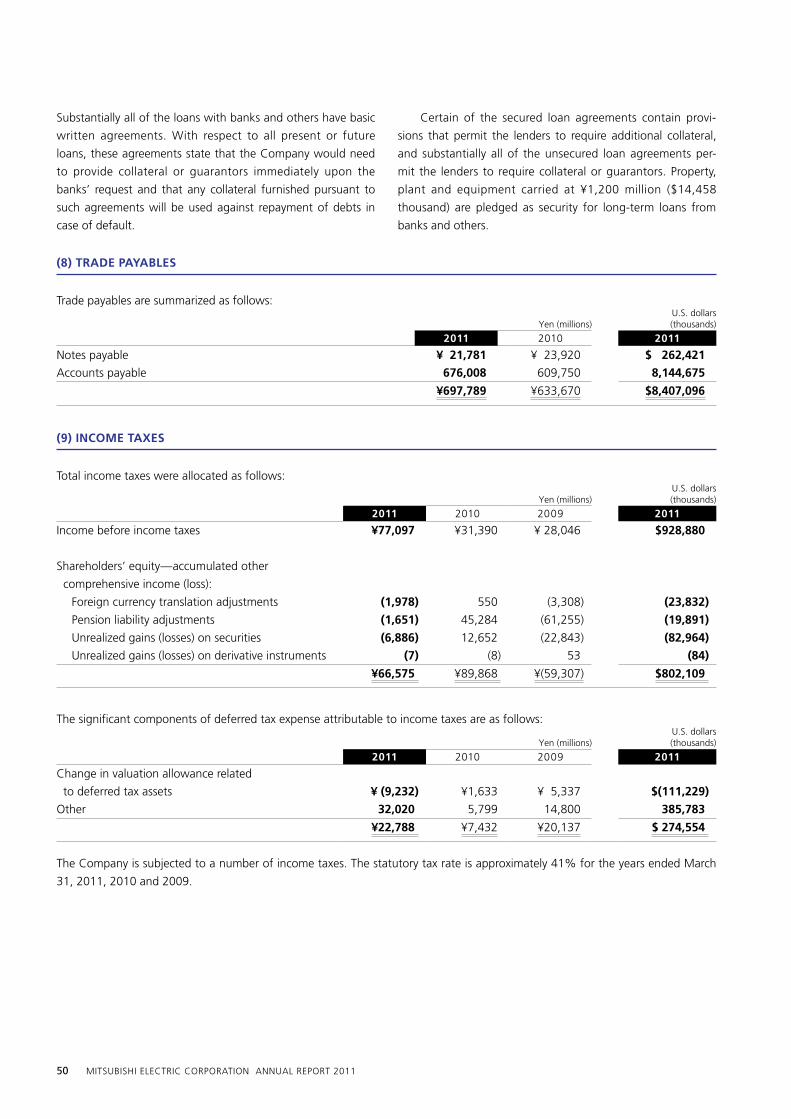
50 MITSUBISHI ELECTRIC CORPORATION ANNUAL REPORT 2011
Substantially all of the loans with banks and others have basic
written agreements. With respect to all present or future
loans, these agreements state that the Company would need
to provide collateral or guarantors immediately upon the
banks’ request and that any collateral furnished pursuant to
such agreements will be used against repayment of debts in
case of default.
Certain of the secured loan agreements contain provi-
sions that permit the lenders to require additional collateral,
and substantially all of the unsecured loan agreements per-
mit the lenders to require collateral or guarantors. Property,
plant and equipment carried at ¥1,200 million ($14,458
thousand) are pledged as security for long-term loans from
banks and others.
Trade payables are summarized as follows:
Yen (millions)U.S. dollars (thousands)
2011 2010 2011
Notes payable ¥ 21,781 ¥ 23,920 $ 262,421
Accounts payable 676,008 609,750 8,144,675
¥697,789 ¥633,670 $8,407,096
(8) TRADE PAYABLES
(9) INCOME TAXES
Total income taxes were allocated as follows:
Yen (millions)U.S. dollars (thousands)
2011 2010 2009 2011
Income before income taxes ¥77,097 ¥31,390 ¥ 28,046 $928,880
Shareholders’ equity—accumulated other
comprehensive income (loss):
Foreign currency translation adjustments (1,978) 550 (3,308) (23,832)
Pension liability adjustments (1,651) 45,284 (61,255) (19,891)
Unrealized gains (losses) on securities (6,886) 12,652 (22,843) (82,964)
Unrealized gains (losses) on derivative instruments (7) (8) 53 (84)
¥66,575 ¥89,868 ¥(59,307) $802,109
The significant components of deferred tax expense attributable to income taxes are as follows:
Yen (millions)U.S. dollars (thousands)
2011 2010 2009 2011
Change in valuation allowance related
to deferred tax assets ¥ (9,232) ¥1,633 ¥ 5,337 $(111,229)
Other 32,020 5,799 14,800 385,783
¥22,788 ¥7,432 ¥20,137 $ 274,554
The Company is subjected to a number of income taxes. The statutory tax rate is approximately 41% for the years ended March
31, 2011, 2010 and 2009.

MITSUBISHI ELECTRIC CORPORATION ANNUAL REPORT 2011 51
The actual tax rate for the years ended March 31, 2011, 2010 and 2009 is reconciled with the Japanese statutory tax rate in the
following table:
2011 2010 2009
Japanese statutory tax rate 41.0% 41.0% 41.0%
Change in valuation allowance (0.9) 0.7 24.7
Expenses permanently not deductible for tax purposes 1.0 3.2 6.5
International tax rate difference (6.9) (16.5) (13.2)
Tax credits (4.2) (4.1) (4.1)
Tax effect attributable to investments at equity 4.0 23.5 63.7
Revision of Japanese tax regulations — — (49.5)
Other 2.7 1.0 (5.3)
Actual income tax rate 36.7% 48.8% 63.8%
The tax effects of temporary differences that give rise to significant portions of the deferred tax assets and deferred tax liabilities
at March 31, 2011 and 2010 are as follows:
Yen (millions)U.S. dollars (thousands)
2011 2010 2011
Deferred tax assets:
Retirement and severance benefits ¥122,238 ¥140,255 $1,472,747
Accrued expenses 113,118 103,018 1,362,867
Property, plant and equipment 40,517 53,853 488,157
Inventories 42,699 37,745 514,446
Pension liability adjustments 121,765 120,114 1,467,048
Tax loss carryforwards 7,687 19,385 92,614
Other 85,216 84,504 1,026,699
Total gross deferred tax assets 533,240 558,874 6,424,578
Valuation allowance (62,590) (71,822) (754,096)
Deferred tax assets, less valuation allowance 470,650 487,052 5,670,482
Deferred tax liabilities:
Securities contributed to employee
retirement benefit trust 32,856 32,856 395,855
Property, plant and equipment 15,284 14,167 184,145
Net unrealized gains on securities 4,630 11,516 55,783
Other 25,576 21,777 308,145
Total gross deferred tax liabilities 78,346 80,316 943,928
Net deferred tax assets ¥392,304 ¥406,736 $4,726,554
The valuation allowance for deferred tax assets as of April
1, 2009 was ¥70,189 million. The net change in the total
valuation allowance for the year ended March 31, 2010 was
an increase of ¥1,633 million. The net change in the total
valuation allowance for the year ended March 31, 2011 was a
decrease of ¥9,232 million ($111,229 thousand). In assessing
the realizability of deferred tax assets, management considers
whether it is more likely than not that some portion or all of
the deferred tax assets will be realized. The ultimate realiza-
tion of deferred tax assets is dependent upon the generation
of future taxable income during the periods in which those
temporary differences become deductible. Management
considers the scheduled reversal of deferred tax liabilities, pro-
jected future taxable income, and tax planning strategies in
making this assessment.
At March 31, 2011, the Company and certain sub-
sidiaries had net operating loss carryforwards of ¥15,855
million ($191,024 thousand) and ¥46,301 million ($557,843
thousand) for corporate and local income tax purposes,
respectively, which were available to offset future taxable
income, if any. A significant portion of the net operating loss
carryforwards will expire in the years ending March 31, 2017
and 2016.

52 MITSUBISHI ELECTRIC CORPORATION ANNUAL REPORT 2011
Net deferred tax assets and liabilities at March 31, 2011 and 2010 are reflected in the accompanying consolidated balance sheets
under the following captions:
Yen (millions)U.S. dollars (thousands)
2011 2010 2011
Prepaid expenses and other current assets ¥159,559 ¥145,340 $1,922,397
Other assets 237,459 265,148 2,860,952
Other liabilities (4,714) (3,752) (56,795)
¥392,304 ¥406,736 $4,726,554
Income taxes have not been recognized undistributed income
of domestic subsidiaries and affiliated companies as such
income, if distributed in the form of dividends, is either
not taxable under present circumstances or is not material.
Income taxes based on the undistributed income of foreign
subsidiaries and affiliated companies have been recognized.
Although the Company believes that there are no sig-
nificant unrecognized tax benefits as of March 31, 2011 and
2010, future determination by tax authorities could affect the
effective tax rate in the future periods.
The Company records interest and penalties related to
additional income tax, etc. in the consolidated statements
of income. Both interest and penalties accrued as of March
31, 2011 and 2010, and interest and penalties for the years
ended March 31, 2011, 2010 and 2009 are not material.
The Company and its subsidiaries file income tax returns
in Japan and various foreign tax jurisdictions. The tax years
that remain subject to examination by major tax jurisdictions
are as follows:
Location Open tax years
Japan 2005-2011
United States 2009-2011
Thailand 2007-2011
Europe 2005-2011
(10) RETIREMENT AND SEVERANCE BENEFITS
The Company has non-contributory and contributory defined
benefit plans covering substantially all of its employees who
meet eligibility requirements.
Under the non-contributory plans, employees with less
than twenty years of service are entitled to lump-sum sev-
erance indemnities at date of severance, and employees
with twenty or more years of service are entitled to annu-
ity payments subsequent to retirement, determined by the
current basic rate of pay, length of service and termination
conditions. In addition, certain employees who meet the
eligibility requirements are entitled to additional lump-sum
payments at the date of retirement based on the retirement
age. Under the contributory plans, employees are entitled to
annuity payments at a certain age. The assets of certain of the
non-contributory plans and the contributory plans are com-
bined in accordance with the regulations and administered
by a board of trustees comprised equally of employer and
employee representatives. An employee retirement benefit
trust is established for certain of the non-contributory plans.
The Company amended its benefit plan under labor and
management agreement during the year ended March 31,
2005, and established a defined contribution plan on April
1, 2005. In addition, the Company amended its contributory
defined benefit plan and introduced a cash balance pension
plan. Under the cash balance pension plan, each participant
has a notional account which is credited yearly based on the
current rate of contribution and market-related interest rate.
The domestic consolidated subsidiaries sponsor various
pension plans, which are partially or entirely employees’
pension fund plan, corporate pension fund plan, and/ or
qualified pension plan, based on each subsidiaries’ respective
pension policies.
In addition, the foreign consolidated subsidiaries that have
adopted pension policy mainly sponsors defined contribution
pension plan.
The Company measures the fair value of plan assets and
the projected benefit obligation at the end of the year, and
recognizes the funded status (i.e., the difference between
the fair value of plan assets and the projected benefit
obligations) of pension in consolidated balance sheets with
the amount of corresponding adjustment to Accumulated
other comprehensive income (loss), net of tax.

MITSUBISHI ELECTRIC CORPORATION ANNUAL REPORT 2011 53
Obligations and funded status
Reconciliations of beginning and ending balances of the benefit obligations and the fair value of the plan assets are as follows:
Yen (millions)
U.S. dollars (thousands)
2011 2010 2011
Change in benefit obligations:
Benefit obligations at beginning of year ¥1,095,652 ¥1,136,279 $13,200,627
Service cost 28,925 31,358 348,494
Interest cost 22,346 23,108 269,229
Plan participants’ contributions 1,129 1,168 13,603
Amendments (576) (10,037) (6,940)
Actuarial loss (gain) 82 2,768 988
Benefits paid (74,651) (80,933) (899,410)
Acquisitions and divestitures, etc. (825) (8,059) (9,940)
Benefit obligations at end of year 1,072,082 1,095,652 12,916,651
Change in plan assets:
Fair value of plan assets at beginning of year 637,716 542,509 7,683,325
Actual return on plan assets (10,465) 87,573 (126,084)
Employer contributions 63,243 44,229 761,964
Plan participants’ contributions 1,129 1,168 13,603
Benefits paid (35,579) (36,295) (428,663)
Acquisitions and divestitures, etc. (458) (1,468) (5,518)
Fair value of plan assets at end of year 655,586 637,716 7,898,627
Funded status at end of year ¥ (416,496) ¥ (457,936) $ (5,018,024)
Amounts recognized in the consolidated balance sheet at March 31, 2011 and 2010 consist of:
Yen (millions)
U.S. dollars (thousands)
2011 2010 2011
Other assets ¥ 8,192 ¥ 7,467 $ 98,699
Other current liabilities (5,680) (6,640) (68,434)
Retirement and severance benefits (419,008) (458,763) (5,048,289)
¥(416,496) ¥(457,936) $(5,018,024)
Amounts recognized in accumulated other comprehensive income (loss) at March 31, 2011 and 2010 consist of:
Yen (millions)
U.S. dollars (thousands)
2011 2010 2011
Actuarial gain or loss ¥ 414,793 ¥ 427,115 $ 4,997,506
Prior service benefit (117,263) (133,683) (1,412,807)
¥ 297,530 ¥ 293,432 $ 3,584,699
The accumulated benefit obligations for all defined benefit plans were as follows:
Yen (millions)
U.S. dollars (thousands)
2011 2010 2011
Accumulated benefit obligations ¥1,066,581 ¥1,090,079 $12,850,373

54 MITSUBISHI ELECTRIC CORPORATION ANNUAL REPORT 2011
Components of net periodic retirement and severance costs and other amounts recognized in other comprehensive
income (loss)
Net periodic retirement and severance costs for the years ended March 31, 2011, 2010 and 2009 consisted of the following
components:
Yen (millions)U.S. dollars (thousands)
2011 2010 2009 2011
Service cost ¥ 30,054 ¥ 32,526 ¥ 37,534 $ 362,096
Interest cost on projected benefit obligation 22,346 23,108 23,494 269,229
Expected return on plan assets (12,057) (10,373) (12,158) (145,265)
Amortization of prior service benefit (16,996) (15,529) (15,505) (204,771)
Amortization of actuarial loss 35,107 42,220 31,273 422,976
58,454 71,952 64,638 704,265
Plan participants’ contributions (1,129) (1,168) (1,213) (13,602)
Net periodic retirement and severance costs ¥ 57,325 ¥ 70,784 ¥ 63,425 $ 690,663
Other changes in plan assets and projected benefit obligations recognized in other comprehensive income (loss) for the years
ended March 31, 2011 and 2010 were summarized as follows:
Yen (millions)U.S. dollars (thousands)
2011 2010 2011
Actuarial gain or loss ¥ 22,785 ¥ (73,766) $ 274,518
Amortization of actuarial loss (35,107) (42,220) (422,976)
Prior service benefit (576) (10,037) (6,940)
Amortization of prior service benefit 16,996 15,529 204,771
¥ 4,098 ¥(110,494) $ 49,373
The estimated actuarial gain or loss and prior service benefit for the defined benefit pension plans that will be amortized from
accumulated other comprehensive income (loss) into net periodic benefit cost over the next year are summarized as follows:
Yen (millions)
U.S. dollars (thousands)
Actuarial gain or loss ¥ 27,604 $ 332,578
Prior service benefit (17,044) (205,349)
Actuarial assumptions
Actuarial assumptions used to determine benefit obligations at March 31, 2011 and 2010 were as follows:
2011 2010
Discount rate 2.0% 2.0%
Assumed rate of increase in future compensation levels 1.7% 1.7%
Actuarial assumptions used to determine net periodic retirement and severance costs for the years ended March 31, 2011, 2010
and 2009 were as follows:2011 2010 2009
Discount rate 2.0% 2.0% 2.0%
Assumed rate of increase in future compensation levels 1.7% 1.7% 1.7%
Expected long-term rate of return on plan assets 2.5% 2.5% 2.5%
The expected long-term rate of return is based on actual historical returns and the expectations for future returns of each plan
asset category in which the Company invests.

MITSUBISHI ELECTRIC CORPORATION ANNUAL REPORT 2011 55
Plan Assets
The fair values of the Company’s pension plan assets at March 31, 2011 and 2010 were as follows:
Yen (millions)
2011Level 1 Level 2 Level 3 Total
Equity securities
Marketable equity securities ¥139,744 ¥ — ¥— ¥139,744
Pooled funds — 164,206 — 164,206
Debt securities
Government, municipal and corporate debt securities 2,334 20,876 — 23.210
Pooled funds — 207,468 — 207,468
Other assets
Life insurance company general accounts — 77,383 — 77,383
Other — 43,575 — 43,575
¥142,078 ¥513,508 ¥— ¥655,586
Notes: 1. Marketable equity securities include mainly domestic stocks.
2. Pooled funds of equity securities include approximately 40% domestic stocks and 60% foreign stocks.
3. Pooled funds of debt securities include approximately 60% domestic bonds and 40% foreign bonds.
4. Government, municipal and corporate debt securities of level 1 include government debt securities.
Yen (millions)
2010Level 1 Level 2 Level 3 Total
Equity securities
Marketable equity securities ¥155,666 ¥ — ¥— ¥155,666
Pooled funds — 171,802 — 171,802
Debt securities
Government, municipal and corporate debt securities 3,110 15,771 — 18,881
Pooled funds — 192,882 — 192,882
Other assets
Life insurance company general accounts — 72,872 — 72,872
Other — 25,613 — 25,613
¥158,776 ¥478,940 ¥— ¥637,716
Notes: 1. Marketable equity securities include mainly domestic stocks.
2. Pooled funds of equity securities include approximately 50% domestic stocks and 50% foreign stocks.
3. Pooled funds of debt securities include approximately 60% domestic bonds and 40% foreign bonds.
4. Government, municipal and corporate debt securities of level 1 include government debt securities.
U.S. dollars (thousands)
2011Level 1 Level 2 Level 3 Total
Equity securities
Marketable equity securities $1,683,663 $ — $— $1,683,663
Pooled funds — 1,978,386 — 1,978,386
Debt securities
Government, municipal and corporate debt securities 28,120 251,519 — 279,639
Pooled funds — 2,499,614 — 2,499,614
Other assets
Life insurance company general accounts — 932,325 — 932,325
Other — 525,000 — 525,000
$1,711,783 $6,186,844 $— $7,898,627

56 MITSUBISHI ELECTRIC CORPORATION ANNUAL REPORT 2011
The Company’s investment policies are designed to ensure
adequate plan assets are available to provide future pay-
ments of pension benefits to eligible participants. Taking into
account the expected long-term rate of return on plan assets,
the Company formulates an investment portfolio comprised
of the optimal combination of equity and debt securities.
Plan assets are invested in individual equity and debt securi-
ties using the guidelines of the investment portfolio in order
to produce a total return that will match the expected return
on a mid-term to long-term basis. The Company evaluates the
gap between expected return and actual return of invested
plan assets on an annual basis. In addition, taking into the
consideration the management environment and the revision
of regulations, the Company revises the investment portfolio
when and to the extent considered necessary to achieve the
expected long-term rate of return on plan assets based on the
pension asset and liability management method.
The Company’s investment portfolio consists of two major
components: approximately 40% is invested in equity securi-
ties, approximately 60% is invested in debt securities and
other investment vehicles, primarily consisting of investments
in life insurance company general accounts. As for selection
of plan assets, the Company has examined the contents of
investment, and appropriately diversified investments.
See note 19 which shows categorized input for fair value
measurements by the valuation technique into a three-level
hierarchy.
Each level into which assets are categorized is based on
inputs used to measure the fair value of the assets.
Level 1 assets are comprised principally of equity securities
and government bonds, which are valued using un adjusted
quoted market prices in active markets with sufficient volume
and frequency of transactions. Level 2 assets are comprised
principally of pooled funds that invest in equity and debt
securities, corporate bonds and investments in life insurance
company general accounts. Pooled funds are valued at their
net asset values that are calculated by the sponsor of the
fund. Corporate bonds are valued using quoted prices for
identical assets in markets that are not active. Investments in
life insurance company general accounts are valued at the
amounts that are the conventional interest adding to the
principle amounts calculated by life insurance company.
Cash Flows
The Company expects to contribute ¥46,661 million ($562,181 thousand) to its pension plan in the year ending March 31, 2011.
Estimated future benefit payments are as follows:
Year ending March 31:
Yen (millions)U.S. dollars (thousands)
2012 ¥ 79,769 $ 961,072
2013 71,016 855,614
2014 66,391 799,892
2015 62,540 753,494
2016 60,594 730,048
2017—2021 251,236 3,026,940
The amount of cost recognized for the Company and certain subsidiaries’ defined contribution plans for the years ended March
31, 2011, 2010 and 2009 were ¥6,709 million ($80,831 thousand), ¥6,225 million and ¥6,715 million, respectively.
Changes in common stock for the years ended March 31, 2011 and 2010 were as follows:Shares
2011 2010
Number of common shares issued: Balance at beginning of year 2,147,201,551 2,147,201,551
Balance at end of year 2,147,201,551 2,147,201,551
Conversions into common stock of convertible debenture
issued subsequent to October 1, 1982 and exercise of war-
rants were accounted for in accordance with the provisions of
the Japanese Commercial Code by crediting one-half of the
conversion price and exercise price to each of the common
stock account and the capital surplus account.
Certain sections of the Japanese Commercial Code are
repealed by the Japanese Corporate Law effective May 1,
2006.
The Japanese Corporate Law requires that an amount
equal to 10% of dividends and other distributions paid in
cash by the Company and its domestic subsidiaries be appro-
priated as a legal reserve until the aggregated amount of
additional paid-in capital and the legal reserve equal to 25%
(11) SHAREHOLDERS’ EqUITY

MITSUBISHI ELECTRIC CORPORATION ANNUAL REPORT 2011 57
of the common stocks. The additional paid-in capital and the
legal reserve may be used to reduce a deficit or transferred to
common stock with a resolution of the shareholders’ meeting.
The amount available for dividends under the Japanese
Corporate Law is based on the amount recorded in the
Company’s books of account in accordance with accounting
standards of Japan. The adjustments included in the accom-
panying consolidated financial statements to have them
conform with accounting principles generally accepted in
the United States of America, but not recorded in the books
(12) STOCk OPTION PLANS
of account, have no effect on the determination of retained
earnings available for dividends under the Japanese Corporate
Law. Retained earnings available for dividends shown in the
Company’s books of account amounted to ¥204,037 million
($2,458,277 thousand) at March 31, 2011.
Cash dividends and appropriations to the legal reserve
charged to retained earnings during the years ended March
31, 2011, 2010 and 2009 represent dividends paid out during
the years and the related appropriations to the legal reserve.
The Company had granted stock options to directors, execu-
tive officers and senior employees. Under the stock option
plan, options to purchase common stock, granted at the
exercise prices not less than market value at date of grant,
become exercisable in two years after the date of grant and
expire within four years after the date of grant.
(13) OTHER COMPREHENSIVE INCOME (LOSS)
The stock option plan activity for the years ended March 31, 2011, 2010 and 2009 is shown as follows:
Shares
Weighted average exercise price
Yen U.S. dollars
Outstanding at March 31, 2008 16,000 ¥437
Outstanding at March 31, 2009 16,000 437 Exercised 16,000 437
Outstanding at March 31, 2010 — — $ —
Outstanding at March 31, 2011 — ¥ — $ —
Change in accumulated other comprehensive income (loss) is as follows:
Yen (millions)U.S. dollars (thousands)
2011 2010 2009 2011
Foreign currency translation adjustments:
Balance at beginning of year ¥ (41,524) ¥ (47,499) ¥ 4,889 $ (500,290) Adjustments for the year (17,876) 5,975 (52,388) (215,373) Balance at end of year (59,400) (41,524) (47,499) (715,663)
Pension liability adjustments:
Balance at beginning of year (171,674) (233,373) (148,246) (2,068,361) Adjustments for the year 9,284 61,699 (85,127) 111,855 Balance at end of year (162,390) (171,674) (233,373) (1,956,506)
Unrealized gains (losses) on securities:
Balance at beginning of year 16,600 (4,099) 24,511 200,000 Adjustments for the year (10,643) 20,699 (28,610) (128,229) Balance at end of year 5,957 16,600 (4,099) 71,771
Unrealized gains (losses) on derivative instruments:
Balance at beginning of year 89 (95) (141) 1,072 Adjustments for the year (175) 184 46 (2,108) Balance at end of year (86) 89 (95) (1,036)
Total accumulated other comprehensive income (loss): Balance at beginning of year (196,509) (285,066) (118,987) (2,367,579) Adjustments for the year (19,410) 88,557 (166,079) (233,855) Balance at end of year ¥(215,919) ¥(196,509) ¥(285,066) $(2,601,434)

58 MITSUBISHI ELECTRIC CORPORATION ANNUAL REPORT 2011
Tax effects allocated to each component of other comprehensive income (loss) and reclassification adjustments are as follows:
Yen (millions)
Before-tax amountTax (expense)
or benefit Net-of-tax amount
2011:
Foreign currency translation adjustments:
Amount arising during the year on investments in
foreign entities held at end of year ¥(22,684) ¥ 1,948 ¥(20,736)
Less reclassification adjustments for gains (losses)
included in net income 2,830 30 2,860
Net change in foreign currency translation
adjustments during the year (19,854) 1,978 (17,876)
Pension liability adjustments:
Amount arising during the year on pension
liability adjustments (23,921) 9,077 (14,844)
Less reclassification adjustments for gains (losses)
included in net income 31,554 (7,426) 24,128
Net change in pension liability adjustment 7,633 1,651 9,284
Unrealized gains (losses) on securities:
Unrealized holding gains (losses) arising during the year (22,250) 8,864 (13,386)
Less reclassification adjustments for gains (losses)
included in net income 4,721 (1,978) 2,743
Net change in unrealized gains (losses) on securities (17,529) 6,886 (10,643)
Unrealized gains (losses) on derivative instruments:
Unrealized holding gains (losses) arising during the year (182) 7 (175)
Other comprehensive income (loss) ¥(29,932) ¥10,522 ¥(19,410)
Yen (millions)
Before-tax amountTax (expense)
or benefit Net-of-tax amount
2010:
Foreign currency translation adjustments:
Amount arising during the year on investments in
foreign entities held at end of year ¥ 6,100 ¥ (550) ¥ 5,550
Less reclassification adjustments for gains (losses)
included in net income 425 — 425
Net change in foreign currency translation
adjustments during the year 6,525 (550) 5,975
Pension liability adjustments:
Amount arising during the year on pension
liability adjustments 80,292 (34,341) 45,951
Less reclassification adjustments for gains (losses)
included in net income 26,691 (10,943) 15,748
Net change in pension liability adjustment 106,983 (45,284) 61,699
Unrealized gains (losses) on securities:
Unrealized holding gains (losses) arising during the year 29,832 (11,214) 18,618
Less reclassification adjustments for gains (losses)
included in net income 3,519 (1,438) 2,081
Net change in unrealized gains (losses) on securities 33,351 (12,652) 20,699
Unrealized gains (losses) on derivative instruments:
Unrealized holding gains (losses) arising during the year 176 8 184
Other comprehensive income (loss) ¥147,035 ¥(58,478) ¥88,557
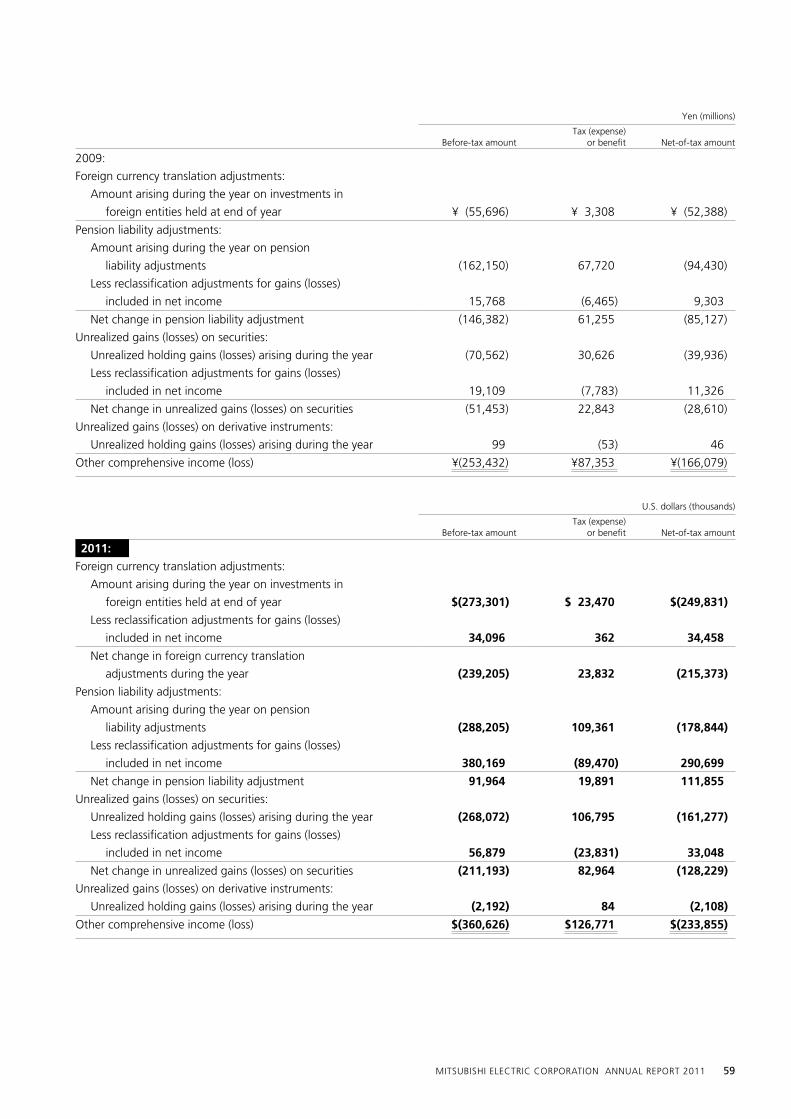
MITSUBISHI ELECTRIC CORPORATION ANNUAL REPORT 2011 59
Yen (millions)
Before-tax amountTax (expense)
or benefit Net-of-tax amount
2009:
Foreign currency translation adjustments:
Amount arising during the year on investments in
foreign entities held at end of year ¥ (55,696) ¥ 3,308 ¥ (52,388)
Pension liability adjustments:
Amount arising during the year on pension
liability adjustments (162,150) 67,720 (94,430)
Less reclassification adjustments for gains (losses)
included in net income 15,768 (6,465) 9,303
Net change in pension liability adjustment (146,382) 61,255 (85,127)
Unrealized gains (losses) on securities:
Unrealized holding gains (losses) arising during the year (70,562) 30,626 (39,936)
Less reclassification adjustments for gains (losses)
included in net income 19,109 (7,783) 11,326
Net change in unrealized gains (losses) on securities (51,453) 22,843 (28,610)
Unrealized gains (losses) on derivative instruments:
Unrealized holding gains (losses) arising during the year 99 (53) 46
Other comprehensive income (loss) ¥(253,432) ¥87,353 ¥(166,079)
U.S. dollars (thousands)
Before-tax amountTax (expense)
or benefit Net-of-tax amount
2011:
Foreign currency translation adjustments:
Amount arising during the year on investments in
foreign entities held at end of year $(273,301) $ 23,470 $(249,831)
Less reclassification adjustments for gains (losses)
included in net income 34,096 362 34,458
Net change in foreign currency translation
adjustments during the year (239,205) 23,832 (215,373)
Pension liability adjustments:
Amount arising during the year on pension
liability adjustments (288,205) 109,361 (178,844)
Less reclassification adjustments for gains (losses)
included in net income 380,169 (89,470) 290,699
Net change in pension liability adjustment 91,964 19,891 111,855
Unrealized gains (losses) on securities:
Unrealized holding gains (losses) arising during the year (268,072) 106,795 (161,277)
Less reclassification adjustments for gains (losses)
included in net income 56,879 (23,831) 33,048
Net change in unrealized gains (losses) on securities (211,193) 82,964 (128,229)
Unrealized gains (losses) on derivative instruments:
Unrealized holding gains (losses) arising during the year (2,192) 84 (2,108)
Other comprehensive income (loss) $(360,626) $126,771 $(233,855)
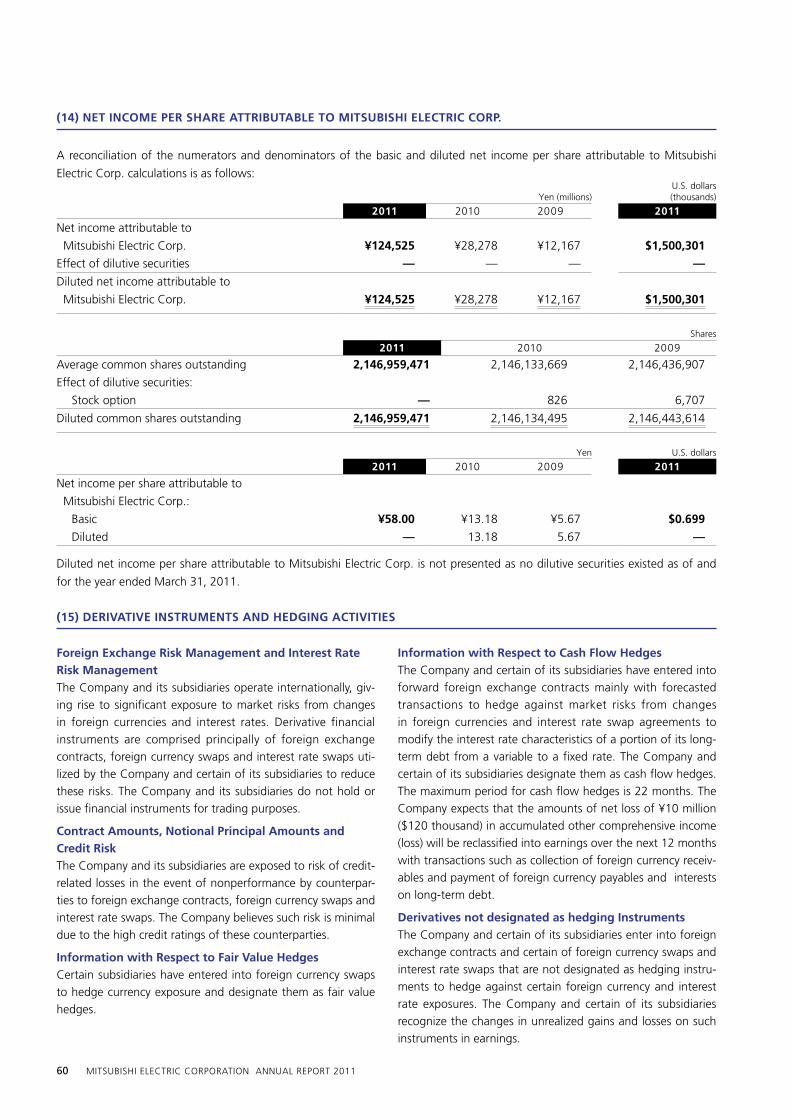
60 MITSUBISHI ELECTRIC CORPORATION ANNUAL REPORT 2011
(14) NET INCOME PER SHARE ATTRIBUTABLE TO MITSUBISHI ELECTRIC CORP.
A reconciliation of the numerators and denominators of the basic and diluted net income per share attributable to Mitsubishi
Electric Corp. calculations is as follows:
Yen (millions)U.S. dollars (thousands)
2011 2010 2009 2011
Net income attributable to
Mitsubishi Electric Corp. ¥124,525 ¥28,278 ¥12,167 $1,500,301
Effect of dilutive securities — — — —
Diluted net income attributable to
Mitsubishi Electric Corp. ¥124,525 ¥28,278 ¥12,167 $1,500,301
Shares
2011 2010 2009
Average common shares outstanding 2,146,959,471 2,146,133,669 2,146,436,907
Effect of dilutive securities:
Stock option — 826 6,707
Diluted common shares outstanding 2,146,959,471 2,146,134,495 2,146,443,614
Yen U.S. dollars
2011 2010 2009 2011
Net income per share attributable to
Mitsubishi Electric Corp.:
Basic ¥58.00 ¥13.18 ¥5.67 $0.699
Diluted — 13.18 5.67 —
Diluted net income per share attributable to Mitsubishi Electric Corp. is not presented as no dilutive securities existed as of and
for the year ended March 31, 2011.
(15) DERIVATIVE INSTRUMENTS AND HEDGING ACTIVITIES
Foreign Exchange Risk Management and Interest Rate Risk ManagementThe Company and its subsidiaries operate internationally, giv-
ing rise to significant exposure to market risks from changes
in foreign currencies and interest rates. Derivative financial
instruments are comprised principally of foreign exchange
contracts, foreign currency swaps and interest rate swaps uti-
lized by the Company and certain of its subsidiaries to reduce
these risks. The Company and its subsidiaries do not hold or
issue financial instruments for trading purposes.
Contract Amounts, Notional Principal Amounts and Credit RiskThe Company and its subsidiaries are exposed to risk of credit-
related losses in the event of nonperformance by counterpar-
ties to foreign exchange contracts, foreign currency swaps and
interest rate swaps. The Company believes such risk is minimal
due to the high credit ratings of these counterparties.
Information with Respect to Fair Value HedgesCertain subsidiaries have entered into foreign currency swaps
to hedge currency exposure and designate them as fair value
hedges.
Information with Respect to Cash Flow HedgesThe Company and certain of its subsidiaries have entered into
forward foreign exchange contracts mainly with forecasted
transactions to hedge against market risks from changes
in foreign currencies and interest rate swap agreements to
modify the interest rate characteristics of a portion of its long-
term debt from a variable to a fixed rate. The Company and
certain of its subsidiaries designate them as cash flow hedges.
The maximum period for cash flow hedges is 22 months. The
Company expects that the amounts of net loss of ¥10 million
($120 thousand) in accumulated other comprehensive income
(loss) will be reclassified into earnings over the next 12 months
with transactions such as collection of foreign currency receiv-
ables and payment of foreign currency payables and interests
on long-term debt.
Derivatives not designated as hedging InstrumentsThe Company and certain of its subsidiaries enter into foreign
exchange contracts and certain of foreign currency swaps and
interest rate swaps that are not designated as hedging instru-
ments to hedge against certain foreign currency and interest
rate exposures. The Company and certain of its subsidiaries
recognize the changes in unrealized gains and losses on such
instruments in earnings.

MITSUBISHI ELECTRIC CORPORATION ANNUAL REPORT 2011 61
Yen (millions)
U.S. dollars (thousands)
2011 2010 2011
Foreign exchange contracts:
Forwards to sell foreign currencies ¥129,398 ¥80,560 $1,559,012 Forwards to buy foreign currencies 57,395 37,288 691,506Foreign currency swaps 13,121 10,258 158,084Interest rate swaps 7,000 8,000 84,337
The estimated fair values of foreign exchange contracts, foreign currency swaps and interest rate swaps at March 31, 2011 and
2010 are as follows:Asset derivatives
Derivatives designated as hedging instruments Consolidated balance sheet line item Estimated fair value
Yen (millions)
U.S. dollars (thousands)
2011 2010 2011
Foreign exchange contracts Prepaid expenses and
other current assets ¥ — ¥214 $ —
Liability derivatives
Derivatives designated as hedging instruments Consolidated balance sheet line item Estimated fair value
Yen (millions)
U.S. dollars (thousands)
2011 2010 2011
Foreign exchange contracts Other current liabilities ¥ 16 ¥ 4 $ 193Interest rate swaps Other liabilities 163 188 1,964
Total ¥179 ¥192 $2,157
Asset derivatives
Derivatives not designated as hedging instruments Consolidated balance sheet line item Estimated fair value
Yen (millions)
U.S. dollars (thousands)
2011 2010 2011
Foreign exchange contracts Prepaid expenses and
other current assets ¥ 580 ¥1,325 $ 6,988Foreign currency swaps Prepaid expenses and
other current assets 816 235 9,831Interest rate swaps Investments in securities
and other 128 113 1,542
Total ¥1,524 ¥1,673 $18,361
Liability derivatives
Derivatives not designated as hedging instruments Consolidated balance sheet line item Estimated fair value
Yen (millions)
U.S. dollars (thousands)
2011 2010 2011
Foreign exchange contracts Other current liabilities ¥2,208 ¥675 $26,602Foreign currency swaps Other current liabilities 784 — 9,446
Total ¥2,992 ¥675 $36,048
The effect of foreign exchange contracts and interest rate swaps designated as cash flow hedges on the consolidated statements
of income for the years ended March 31, 2011 and 2010 are as follows: Derivatives in cash flow hedging relationships
Amount of gain or (loss) recognized in OCI on derivative (effective portion)
Yen (millions)
U.S. dollars (thousands)
2011 2010 2011
Foreign exchange contracts ¥(224) ¥226 $(2,699)Interest rate swaps 25 (45) 301
Total ¥(199) ¥181 $(2,398)
Contract amounts of foreign exchange contracts and foreign currency swaps and notional principal amounts of interest rate
swaps at March 31, 2011 and 2010 are as follows:

62 MITSUBISHI ELECTRIC CORPORATION ANNUAL REPORT 2011
Derivatives in cash flow hedging relationships
Line item of gain or (loss) recognized from accumulated OCI into income (effective portion)
Amount of gain or (loss) recognized from accumulated OCI into income(effective portion)
Yen (millions)
U.S. dollars (thousands)
2011 2010 2011
Foreign exchange contracts Other revenues ¥213 ¥214 $2,566
The effect of foreign exchange contracts, foreign currency swaps and interest rate swaps not designated as hedging instruments
on the consolidated statements of income for the years ended March 31, 2011 and 2010 are set forth below:
Derivatives not designated as hedging instrumentsLine item of gain or (loss) recognized in income on derivative Amount of gain or (loss) recognized in income on derivative
Yen (millions)
U.S. dollars (thousands)
2011 2010 2011
Foreign exchange contracts Other revenues ¥5,817 ¥4,897 $70,084Foreign currency swaps Other revenues
(cost and expenses) (159) 373 (1,916)Interest rate swaps Other revenues 5 108 60
Total ¥5,663 ¥5,378 $68,228
The Company sells its accounts receivable under several
securitization programs.
When the Company retains subordinated interests in the
certain accounts receivables after the sale of these receivables,
a portion of these, where the Company retains subordinated
interests, is not taken off the balance sheet and is recorded
at their fair value. Such carrying value is adjusted to reflect
the portion that is not expected to be collectible. As of
March 31, 2011, the Company did not retain subordinated
interests in the certain accounts receivables after the sale of
these receivables.
The Company recognized losses of ¥643 million ($7,747
thousand), ¥783 million and ¥1,216 million on the securitiza-
tions of receivables for the years ended March 31, 2011, 2010
and 2009, respectively.
Subsequent to securitization, the Company retains collec-
tion and administrative responsibilities for the receivables. The
Company has not recorded a servicing asset or liability since
the cost of collection effort is similar to the amount of com-
mission income.
(16) SECURITIzATIONS
Certain cash flows received from special purpose entities (SPEs) and banks on the above transactions for the years ended March
31, 2011, 2010 and 2009 are as follows:
Yen (millions)U.S. dollars (thousands)
2011 2010 2009 2011
Proceeds from new securitizations ¥413,959 ¥366,112 ¥452,406 $4,987,458
Quantitative information about trade receivables including securitized receivables as of March 31, 2011 and 2010 are as follows:
Yen (millions)
U.S. dollars (thousands)
2011 2010 2011
Trade receivables ¥923,510 ¥933,412 $11,126,627
Less: Securitized receivables 132,519 142,658 1,596,615
Total receivables ¥790,991 ¥790,754 $ 9,530,012
As of March 31, 2011 and 2010, delinquencies and credit losses of trade receivables including securitized receivables are
immaterial.

MITSUBISHI ELECTRIC CORPORATION ANNUAL REPORT 2011 63
At March 31, 2011, commitments outstanding for the
purchase of property, plant and equipment were ¥22,009
million ($265,169 thousand).
It is common practice in Japan for companies, in the
ordinary course of business, to receive promissory notes in
settlement of accounts receivable and to subsequently dis-
count such notes at banks. At March 31, 2011, certain sub-
sidiaries were contingently liable to trade notes discounted
in the amount of ¥512 million ($6,169 thousand). Certain
subsidiaries account for the discounted notes as sale of
receivables.
As of March 31, 2011, the Company had no significant
concentrations of credit risk.
While the Company and certain of its subsidiaries are
defendants and co-defendants in various lawsuits and
legal actions, based upon the advice of legal counsel, the
Company’s management is of the opinion that damages,
if any, would not have a material adverse effect on the
Company’s consolidated financial position and results of
operations, except for the following cases.
The Company and certain of its subsidiaries move toward
reconciliation with some DRAM purchasers in relation to the
possibility of the violation of competition law concerning
DRAM sales. In addition, the Company received a decision
rendered by the European Commission imposing fines for
an infringement of EU Competition Rules against its sales
of certain gas-insulated switchgears in Europe. However,
there is significant inconsistency on recognition of the mate-
rial underlying facts between the European Commission
and the Company. Therefore, the Company has appealed
to the European Court of First Instance and is challenging
the decision. As of March 31, 2011, the Company recorded
reasonably estimated amount of ¥27,728 million ($334,072
thousand) as a reserve for various competition-law-related
expenses in “Other liabilities” relating to the DRAM case in
the United States and in Europe and gas-insulated switchgears
in Europe. The Company is unable to estimate the impact on
the Company’s consolidated financial position and operational
results as to be arising out of other legal proceedings.
(17) COMMITMENTS AND CONTINGENT LIABILITIES
The following table provides the undiscounted maximum amount of potential future payments for each major group of
guarantees at March 31, 2011:
Yen (millions)U.S. dollars (thousands)
Guarantees of bank loan:
Employees ¥ 8,678 $104,554
Affiliated and other companies 1,762 21,229
Other 5,078 61,181
Total ¥15,518 $186,964
Change in accrued product warranty for the years ended March 31, 2011 and 2010 is summarized as follows:
Yen (millions)
U.S. dollars (thousands)
2011 2010 2011
Balance at beginning of year ¥45,904 ¥46,757 $553,060
Addition 44,363 41,427 534,494
Utilization 40,420 42,264 486,988
Foreign currency translation adjustments (455) (16) (5,482)
Balance at end of year ¥49,392 ¥45,904 $595,084
The guarantees for the employees are principally made for
their housing loans, and the term of guarantees is 1 year
to 26 years. The guarantees for the affiliated and other
companies are made to enhance their credit, and the term of
guarantees is 1 year to 4 years.

64 MITSUBISHI ELECTRIC CORPORATION ANNUAL REPORT 2011
(18) FAIR VALUE OF FINANCIAL INSTRUMENTS
The Company uses the following methods and assumptions to
estimate the fair value of each class of financial instrument for
which it is practical to estimate its value:
(a) Cash and cash equivalents, Trade receivables, Bank
loans, Trade payables, Accrued expenses and Other
current liabilities
The carrying amount approximates fair value because of the
short term nature of these instruments.
(b) Short-term investments and Investments in securities
and other
The fair values of most short-term investments and invest-
ments in securities and other are estimated based on quoted
market prices for these instruments. For other investments
for which there are no quoted market prices, a reasonable
estimate of fair value could not be made without incurring
excessive costs.
(c) Long-term trade receivables
The fair value of the Company’s long-term trade receiv-
ables are calculated by discounting future cash flows using
estimated market discount rates.
(d) Long-term debt
The fair value of the Company’s long-term debt is calculated
by discounting future cash flows associated with each instru-
ment using the Company’s current borrowing rate for similar
debt of comparable maturity, or based on the quoted market
prices for the same or similar issues. The Company excludes
the financial instruments relating to lease activities because its
carrying amount approximates fair value.
(e) Derivative financial instruments
The fair values of derivative financial instruments, consisting
principally of foreign exchange contracts, foreign currency
swaps and interest rate swaps are estimated by obtaining
quotes from brokers. (See note 15 about estimated fair value.)
The estimated fair values of the Company’s financial instruments at March 31, 2011 and 2010 are summarized as follows:
Yen (millions)
U.S. dollars (thousands)
2011 2010 2011Carryingamount
Estimatedfair value
Carryingamount
Estimatedfair value
Carryingamount
Estimatedfair value
Nonderivatives:
Assets:
Marketable securities ¥173,252 ¥173,252 ¥204,768 ¥204,768 $2,087,373 $2,087,373
Long-term trade receivables 2,090 2,142 1,560 1,689 25,181 25,807
Liabilities:
Long-term debt, including
current portion 390,051 392,774 437,804 440,507 4,699,410 4,732,217
Limitations
Fair value estimates are made at a specific point in time based
on relevant market information and information about the
financial instrument. These estimates are subjective in nature
and involve uncertainties and matters of significant judgment
and therefore cannot be determined with precision. Changes
in assumptions could significantly affect the estimates.
(19) FAIR VALUE MEASUREMENTS
The Company defines fair value as “the price that would be
received to sell an asset or paid to transfer a liability in an orderly
transaction between market participants at the measurement
date”. On that basis, the Company has categorized the inputs
for fair value measurement by the valuation technique into
a three-level hierarchy, and placed the order of priority.
Level 1 : Quoted prices in active markets for identical assets
or liabilities.
Level 2 : Inputs other than quoted prices included within
Level 1 that are directly or indirectly observable for
the asset or liability.
Level 3 : Unobservable inputs for the asset or liability.

MITSUBISHI ELECTRIC CORPORATION ANNUAL REPORT 2011 65
Level 1 equity securities are marketable equity securities,
which are valued using unadjusted quoted market prices
in active markets with sufficient volume and frequency of
transactions. Debt securities are comprised of government,
municipal and corporate debt securities, and investment
trusts. Level 1 debt securities are valued using unadjusted
quoted market prices in active markets with sufficient volume
and frequency of transactions. Level 2 debt securities are
valued based on market approach, using quoted prices for
identical assets in markets that are not active. Level 2 deriva-
tives are comprised principally of foreign exchange contracts,
which are valued based on market approach, using quotes
obtained from counterparties or third parties.
Assets and Liabilities Measured at Fair Value on a Recurring Basis
The following tables present the fair value hierarchy for those assets and liabilities measured at fair value on a recurring basis as
of March 31, 2011 and 2010.Yen (millions)
2011Level 1 Level 2 Level 3 Total
Assets:
Equity securities
Marketable equity securities ¥120,563 ¥ — ¥— ¥120,563
Debt securities
Government, municipal and
corporate debt securities 1,506 47,505 — 49,011
Investment trusts — 3,678 — 3,678
Derivatives — 1,524 — 1,524
Liabilities:
Derivatives — 3,171 — 3,171
Yen (millions)
2010Level 1 Level 2 Level 3 Total
Assets:
Equity securities
Marketable equity securities ¥140,273 ¥ — ¥— ¥140,273
Debt securities
Government, municipal and
corporate debt securities 2,026 56,326 — 58,352
Investment trusts — 6,143 — 6,143
Derivatives — 1,887 — 1,887
Liabilities:
Derivatives — 867 — 867
U.S. dollars (thousands)
2011Level 1 Level 2 Level 3 Total
Assets:
Equity securities
Marketable equity securities $1,452,566 $ — $— $1,452,566
Debt securities
Government, municipal and
corporate debt securities 18,145 572,349 — 590,494
Investment trusts — 44,313 — 44,313
Derivatives — 18,361 — 18,361
Liabilities:
Derivatives — 38,205 — 38,205

66 MITSUBISHI ELECTRIC CORPORATION ANNUAL REPORT 2011
At December 31, 2010, equity securities with an equity
method were written down to their fair value of ¥8,348
million ($100,578 thousand), resulting in an other-than-
temporary impairment charge of ¥8,414 million ($101,373
thousand), which was included in equity in earnings (losses)
of affiliated companies for the year ended March 31, 2011.
The impaired equity securities were classified as Level 1
instruments, because they were measured by the quoted
prices in active markets.
At March 31, 2011, long-lived assets were written down
to their fair value of ¥6,040 million ($72,771 thousand),
resulting in an impairment charge of ¥4,005 million ($48,253
thousand), which was included in loss on impairment of
long-lived assets for the year ended March 31, 2011. The
impaired long-lived assets were classified as Level 3 assets,
because they were measured by the unobservable inputs,
based on income approach.
At September 30, 2009, equity securities with an equity
method (Renesas Technology Corp.) were written down to
their fair value of ¥64,237 million, resulting in an other-than-
temporary impairment charge of ¥8,969 million, which has
included in equity in earnings (losses) of affiliated companies
for the year ended March 31, 2010. The impaired equity secu-
rities were classified as Level 3 instruments, because they were
measured based on unobservable inputs, such as business
plan and market approach.
At March 31, 2010, equity securities with an equity
method were written down to their fair value of ¥4,308
million, resulting in an other-than-temporary impairment
charge of ¥3,380 million, which was included in equity in
earnings (losses) of affiliated companies for the year ended
March 31, 2010. The impaired equity securities were classified
as Level 1 instruments, because they were measured by the
quoted prices in active markets.
At March 31, 2010, long-lived assets were written down
to their fair value of ¥21,214 million, resulting in an impair-
ment charge of ¥16,942 million, which was included in
loss on impairment of long-lived assets for the year ended
March 31, 2010. The impaired long-lived assets were clas-
sified as Level 3 assets, because they were measured by the
unobservable inputs, based on income approach.
Assets and Liabilities Measured at Fair Value on a Nonrecurring Basis
(20) SUPPLEMENTARY INCOME AND EXPENSE INFORMATION
Yen (millions)
U.S. dollars (thousands)
2011 2010 2009 2011
Advertising expenses ¥(17,053) ¥(16,462) ¥(21,720) $(205,458)Shipping and handling costs (74,782) (63,198) (72,672) (900,988)Exchange gains (losses) (10,174) 68 (20,200) (122,578)Business restructuring costs (2,501) — (3,572) (30,133)Loss on disaster (5,456) — — (65,735)Loss on impairment of long-lived assets (4,005) (16,942) (30,742) (48,253)
Advertising expenses are included in “Costs and expenses—
Selling, general and administrative”.
Shipping and handling costs represents the costs included
in “Costs and expenses—Selling, general and administrative”.
Exchange gains (losses) are included in “Revenues—
Other” and “Costs and expenses—Other”.
Business restructuring costs are included in “Costs and
expenses—Other”.
For the year ended March 31, 2011, the Company recog-
nized business restructuring costs of ¥2,501 million ($30,133
thousand) for the after-sale service expense and retirement
benefits and others associated with the restructuring of the
visual equipment businesses in North America.
For the year ended March 31, 2009, the Company rec-
ognized business restructuring costs of ¥3,572 million for the
removal and disposal of facilities and the after-sale service
expense resulting from the company’s decision to discontinue
the washing machine business.
Loss on disaster is included in “Costs and expenses—
Other”.
For the year ended March 31, 2011, the Company recog-
nized disaster losses of ¥5,456 million ($65,735 thousand) for
the repair and removal of facilities ,the disposal and inspec-
tion of inventories and restoration support for counterparties
which is suffered from an earthquake associated with the
recovery from damage suffered from the Great East Japan
Earthquake.
Loss on impairment of long-lived assets is included in
“Costs and expenses—Loss on impairment of long-lived
assets.”
For the year ended March 31, 2011, the Company and
certain of its subsidiaries recognized impairment losses of
¥3,538 million ($42,627 thousand) for tangible assets such
as buildings and machinery as well as ¥467 million ($5,626
thousand) for intangible assets. The impairment losses
included ¥1,879 million ($22,639 thousand) for the Home
Appliances business related assets due to a decline in the
profitability and ¥1,908 million ($22,988 thousand) for the
welfare related assets. The impairment losses were mainly
measured based on the fair value less cost to sell.

MITSUBISHI ELECTRIC CORPORATION ANNUAL REPORT 2011 67
For the year ended March 31, 2010, the Company and
certain of its subsidiaries recognized impairment losses of
¥16,425 million for tangible assets such as buildings and
machinery as well as ¥517 million for intangible assets. The
impairment losses included ¥11,053 million for the Home
Appliances business related assets due to a decline in the
profitability and ¥5,436 million for the welfare related assets.
The impairment losses were mainly measured based on the
fair value of the discounted present value of expected future
cash flow.
For the year ended March 31, 2009, the Company and
certain of its subsidiaries recognized impairment losses of
¥28,704 million for tangible assets such as buildings and
machinery as well as ¥2,038 million for intangible assets. The
impairment losses included ¥20,322 million for the Electronic
Devices business related assets and ¥6,412 million for the
Home Appliances business related assets due to a decline in
the profitability. The impairment losses were mainly measured
based on the fair value less cost to sell.
For the year ended March 31, 2010, the Company applies
FASB ASC Topic 810 “Consolidation”. Due to the adoption
of ASC Topic 810, “Net income” is renamed “Net income
attributable to Mitsubishi Electric Corp.”. Also, Income before
income taxes includes equity in earnings (losses) of affiliated
companies, while excluding net income attributable to non-
controlling interests. Consequently, the Company reclassifies
the consolidated financial statement for all prior periods,
and as a result, Income before income taxes as of March 31,
2009 decreased by ¥63,995 million. There is no impact to Net
income attributable to Mitsubishi Electric Corp.
(21) LEASES
The Company and certain of its subsidiaries enter into capital
lease and operating lease agreements with Mitsubishi Electric
Credit Corporation, an equity method investee. The leased
assets, which are committed under capital lease agreements,
are capitalized.
The Company and certain of its subsidiaries lease machin-
ery and equipments. At March 31, 2011, the aggregated cost
and accumulated depreciation of leased assets under capital
leases amounted to ¥46,099 million ($555,410 thousand) and
¥24,061 million ($289,892 thousand), respectively.
Future minimum lease payments under capital and non-cancelable operating leases as of March 31, 2011 are as follows:
Yen (millions)U.S. dollars (thousands)
Capital leases Operating leases Capital leases Operating leases
Year ending March 31:
2012 ¥11,546 ¥ 4,580 $139,108 $ 55,181
2013 9,900 3,352 119,277 40,386
2014 5,577 2,168 67,193 26,120
2015 2,388 1,239 28,771 14,928
2016 980 753 11,807 9,072
Thereafter 163 997 1,964 12,012
Total minimum lease payments 30,554 ¥13,089 368,120 $157,699Less: Estimated executory costs 832 10,023
Net minimum lease payments 29,722 358,097Less: Amount representing interest 326 3,928
Present value of net minimum capital lease payments 29,396 354,169Less: Current portion of obligations under capital leases 10,933 131,723
Obligations under capital leases, excluding current portion ¥18,463 $222,446
Rental expenses related to operating leases for the years
ended March 31, 2011, 2010 and 2009 amounted to
¥41,007 million ($494,060 thousand), ¥40,760 million and
¥41,280 million, respectively. These operating leases are for
office space, warehouses, employee facilities and computer
equipment, and are customarily renewed.
(22) SUPPLEMENTARY CASH FLOW INFORMATION
Yen (millions)
U.S. dollars (thousands)
2011 2010 2009 2011
Cash paid during the year for:
Interest ¥ 7,722 ¥ 8,748 ¥11,276 $ 93,036 Income taxes 34,166 17,596 68,016 411,639

68 MITSUBISHI ELECTRIC CORPORATION ANNUAL REPORT 2011
Principal businesses of each segment are as follows:
Energy and
Electric Systems
Turbine generators, hydraulic turbine generators, nuclear power plant equipment, motors, transformers, power
electronics equipment, circuit breakers, gas insulated switches, switch control devices, surveillance-system control
and security systems, large display devices, electrical equipment for locomotives and rolling stock, elevators,
escalators, building security systems, particle beam treatment systems, and others
Industrial
Automation
Systems
Programmable logic controllers, inverters, servomotors, human-machine interface, motors, hoists, magnetic
switches, no-fuse circuit breakers, short-circuit breakers, transformers for electricity distribution, time and power
meters, uninterruptible power supply, industrial fans, computerized numerical controllers, electrical-discharge
machines, laser processing machines, industrial robots, clutches, automotive electrical equipment, car electronics
and car mechatronics, car multimedia, and others
Information and
Communication
Systems
Wireless and wired communications systems, surveillance cameras, satellite communications equipment, satellites,
radar equipment, antennas, missile systems, fire control systems, broadcasting equipment, data transmission devices,
network security systems, information systems equipment, systems integration, and others
Electronic Devices Power modules, high-frequency devices, optical devices, LCD devices, microcomputers, system LSIs, and others
Home Appliances LCD televisions, projection TVs, display monitors, projectors, DVD players and recorders, room air conditioners, package
air conditioners, air-to-water heat pump boilers, refrigerators, electric fans, ventilators, photovoltaic power generation
systems, hot water supply systems, LED lamps, fluorescent lamps, indoor lighting, compressors, chillers, humidifiers,
dehumidifiers, air purifiers, showcases, cleaners, rice cookers, microwave ovens, IH cooking heaters, and others
Others Procurement, Logistics, real estate, advertising, finance and other services
Intersegment transactions are conducted generally at the price that the Company’s management recognizes as approximate
arm’s length price. Operating income (loss) in Segment Information is measured in a manner consistent with consolidated
operating income.
(23) SEGMENT INFORMATION
Starting from financial results for the fiscal year ended March
31, 2010, the Company discloses its segment information in
accordance with FASB ASC Topic 280 “Segment Reporting”,
the Company applies it to figures for all prior periods.
Operating segment presented below is identified based
on the segments for which separate financial information
is available, and is periodically used for decision of business
resources allocation and evaluation of business operation by
the Company’s management.
The Company conducts business through 6 reportable
business segments, Energy and Electric Systems, Industrial
Automation Systems, Information and Communication
Systems, Electronic Devices, Home Appliances, and Others,
based on types and characteristics of products, production
method, and similarity in market.
Segment Information
Segment information in the years ended March 31, 2011, 2010 and 2009 are as follows:
As of and for the year ended March 31, 2011 Yen (millions)
Energy and Electric Systems
Industrial Automation
Systems
Information and Communication
SystemsElectronic
DevicesHome
Appliances Others SubtotalEliminations
and other Total
I Net sales and operating income
Sales:(1) External customers ¥1,019,270 ¥921,667 ¥465,688 ¥149,623 ¥911,788 ¥177,295 ¥3,645,331 ¥ — ¥3,645,331(2) Intersegment 8,479 5,335 22,227 26,287 12,690 432,121 507,139 (507,139) — Net sales 1,027,749 927,002 487,915 175,910 924,478 609,416 4,152,470 (507,139) 3,645,331Operating costs 944,694 826,913 474,172 170,009 882,470 594,941 3,893,199 (481,629) 3,411,570Operating income ¥ 83,055 ¥100,089 ¥ 13,743 ¥ 5,901 ¥ 42,008 ¥ 14,475 ¥ 259,271 ¥ (25,510) ¥ 233,761
II Assets, depreciation and amortization, loss on impairment of long-lived assets, and capital expenditures
Assets ¥1,030,968 ¥806,494 ¥369,813 ¥139,333 ¥695,730 ¥164,719 ¥3,207,057 ¥ 125,622 ¥3,332,679Depreciation and
amortization 21,076 40,193 16,123 10,414 25,280 5,616 118,702 — 118,702Loss on impairment of
long-lived assets — — 42 — 1,879 2,084 4,005 — 4,005Capital expenditures 22,582 35,989 12,123 15,130 29,139 3,323 118,286 — 118,286

MITSUBISHI ELECTRIC CORPORATION ANNUAL REPORT 2011 69
As of and for the year ended March 31, 2011 U.S. dollars (thousands)
Energy and Electric Systems
Industrial Automation
Systems
Information and Communication
SystemsElectronic
DevicesHome
Appliances Others SubtotalEliminations
and other Total
I Net sales and operating income
Sales:(1) External customers $12,280,361 $11,104,422 $5,610,699 $1,802,687 $10,985,398 $2,136,084 $43,919,651 $ — $43,919,651(2) Intersegment 102,157 64,277 267,795 316,711 152,891 5,206,277 6,110,108 (6,110,108) — Net sales 12,382,518 11,168,699 5,878,494 2,119,398 11,138,289 7,342,361 50,029,759 (6,110,108) 43,919,651Operating costs 11,381,855 9,962,807 5,712,916 2,048,302 10,632,169 7,167,963 46,906,012 (5,802,759) 41,103,253Operating income $ 1,000,663 $ 1,205,892 $ 165,578 $ 71,096 $ 506,120 $ 174,398 $ 3,123,747 $ (307,349) $ 2,816,398
II Assets, depreciation and amortization, loss on impairment of long-lived assets, and capital expenditures
Assets $12,421,301 $ 9,716,795 $4,455,579 $1,678,711 $ 8,382,289 $1,984,566 $38,639,241 $ 1,513,518 $40,152,759Depreciation and
amortization 253,928 484,253 194,253 125,470 304,578 67,663 1,430,145 — 1,430,145Loss on impairment of
long-lived assets — — 506 — 22,639 25,108 48,253 — 48,253Capital expenditures 272,072 433,603 146,060 182,289 351,073 40,036 1,425,133 — 1,425,133
Notes: 1 The amount of unallocatable R&D expenditure included in “Eliminations and other” on “Operating costs” for the years ended March 31, 2011, 2010 and 2009 are ¥25,510 million ($307,349 thousand), ¥26,107 million and ¥26,854 million, respectively.
2 The amount of company-wide shared assets included in “Eliminations and other” on “Assets” for the years ended March 31, 2011, 2010 and 2009 are ¥267,159 million ($3,218,783 thousand), ¥204,551 million and ¥184,316 million, respectively, and those amounts are mainly the Company’s deposit in bank.
As of and for the year ended March 31, 2010 Yen (millions)
Energy and Electric Systems
Industrial Automation
Systems
Information and Communication
SystemsElectronic
DevicesHome
Appliances Others SubtotalEliminations
and other Total
I Net sales and operating income
Sales:(1) External customers ¥1,029,573 ¥714,145 ¥505,192 ¥119,531 ¥813,862 ¥170,995 ¥3,353,298 ¥ — ¥3,353,298(2) Intersegment 10,096 18,987 20,969 19,454 10,817 381,986 462,309 (462,309) — Net sales 1,039,669 733,132 526,161 138,985 824,679 552,981 3,815,607 (462,309) 3,353,298Operating costs 964,942 706,994 507,489 146,126 819,870 549,777 3,695,198 (436,202) 3,258,996Operating income (loss) ¥ 74,727 ¥ 26,138 ¥ 18,672 ¥ (7,141) ¥ 4,809 ¥ 3,204 ¥ 120,409 ¥ (26,107) ¥ 94,302
II Assets, depreciation and amortization, loss on impairment of long-lived assets, and capital expenditures
Assets ¥1,051,406 ¥758,993 ¥403,024 ¥110,978 ¥669,638 ¥164,873 ¥3,158,912 ¥ 56,182 ¥3,215,094Depreciation and
amortization 22,041 48,256 20,477 6,331 29,878 6,055 133,038 — 133,038Loss on impairment of
long-lived assets 6 — 50 397 11,053 5,436 16,942 — 16,942Capital expenditures 20,882 36,442 11,162 12,835 32,380 5,402 119,103 — 119,103
As of and for the year ended March 31, 2009 Yen (millions)
Energy and Electric Systems
Industrial Automation
Systems
Information and Communication
SystemsElectronic
DevicesHome
Appliances Others SubtotalEliminations
and other Total
I Net sales and operating income
Sales:(1) External customers ¥1,033,946 ¥827,340 ¥560,007 ¥146,720 ¥902,235 ¥194,871 ¥3,665,119 ¥ — ¥3,665,119(2) Intersegment 9,687 24,348 22,139 20,249 13,475 401,220 491,118 (491,118) — Net sales 1,043,633 851,688 582,146 166,969 915,710 596,091 4,156,237 (491,118) 3,665,119Operating costs 969,094 801,754 557,277 196,776 881,004 583,750 3,989,655 (464,264) 3,525,391Operating income (loss) ¥ 74,539 ¥ 49,934 ¥ 24,869 ¥ (29,807) ¥ 34,706 ¥ 12,341 ¥ 166,582 ¥ (26,854) ¥ 139,728
II Assets, depreciation and amortization, loss on impairment of long-lived assets, and capital expenditures
Assets ¥1,103,040 ¥736,508 ¥467,731 ¥103,190 ¥715,205 ¥170,219 ¥3,295,893 ¥ 38,230 ¥3,334,123Depreciation and
amortization 21,857 51,202 28,920 17,613 34,544 6,609 160,745 — 160,745Loss on impairment of
long-lived assets — 1,185 835 20,322 6,412 1,988 30,742 — 30,742Capital expenditures 21,910 52,821 14,546 22,814 36,985 5,901 154,977 — 154,977

70 MITSUBISHI ELECTRIC CORPORATION ANNUAL REPORT 2011
Geographical Information
Sales to external customers by the location of customers, and long-lived assets by the location of the Company and its
subsidiaries as of and for the years ended March 31, 2011, 2010 and 2009 are as follows:
As of and for the year ended March 31, 2011 Yen (million)
Overseas
Consolidated totalJapan
North America
Asia (excluding
Japan) Europe Others Overseas total
Sales to external customers ¥2,416,090 ¥251,071 ¥603,261 ¥289,440 ¥85,469 ¥1,229,241 ¥3,645,331% of total net sales 66.3% 6.9% 16.6% 7.9% 2.3% 33.7% 100.0%Long-lived assets 488,524 8,055 57,465 13,481 2,154 81,155 569,679
As of and for the year ended March 31, 2010 Yen (million)
Overseas
Consolidated totalJapan
North America
Asia (excluding
Japan) Europe Others Overseas total
Sales to external customers ¥2,262,834 ¥236,409 ¥488,613 ¥286,284 ¥79,158 ¥1,090,464 ¥3,353,298% of total net sales 67.5% 7.0% 14.6% 8.5% 2.4% 32.5% 100.0%Long-lived assets 467,367 10,182 62,647 11,534 2,110 86,473 553,840
As of and for the year ended March 31, 2009 Yen (million)
Overseas
Consolidated totalJapan
North America
Asia (excluding
Japan) Europe Others Overseas total
Sales to external customers ¥2,478,509 ¥271,447 ¥487,814 ¥344,435 ¥82,914 ¥1,186,610 ¥3,665,119% of total net sales 67.6% 7.4% 13.3% 9.4% 2.3% 32.4% 100.0%Long-lived assets 500,556 10,111 67,827 11,182 1,782 90,902 591,458
As of and for the year ended March 31, 2011 U.S. dollars (thousand)
Overseas
Consolidated totalJapan
North America
Asia (excluding
Japan) Europe Others Overseas total
Sales to external customers $29,109,518 $3,024,952 $7,268,205 $3,487,229 $1,029,747 $14,810,133 $43,919,651% of total net sales 66.3% 6.9% 16.6% 7.9% 2.3% 33.7% 100.0%Long-lived assets 5,885,831 97,048 692,349 162,422 25,952 977,771 6,863,602
Notes: The major countries and regions included in each segments are as follows: (1) North America : United States, and Canada (2) Asia (excluding Japan) : China, South Korea, Thailand, Malaysia, Singapore, and Indonesia (3) Europe : United Kingdom, France, Germany, the Netherlands, Spain, and Italy
In addition to the disclosure requirement of FASB ASC Topic 280 “Segment Reporting”, the Company discloses the following
information as supplement.
Geographical Information Based on the Location of the Company and Its Subsidiaries
As of and for the year ended March 31, 2011 Yen (million)
JapanNorth
America
Asia (excluding
Japan) Europe Others Subtotal Eliminations Total
I Net sales and operating income
Sales:(1) External customers ¥2,685,219 ¥216,536 ¥419,557 ¥285,862 ¥38,157 ¥3,645,331 ¥ — ¥3,645,331(2) Intersegment 491,386 13,422 164,270 8,090 43 677,211 (677,211) — Net sales 3,176,605 229,958 583,827 293,952 38,200 4,322,542 (677,211) 3,645,331Operating costs 2,999,251 228,595 540,093 286,122 33,871 4,087,932 (676,362) 3,411,570Operating income ¥ 177,354 ¥ 1,363 ¥ 43,734 ¥ 7,830 ¥ 4,329 ¥ 234,610 ¥ (849) ¥ 233,761
II Assets ¥2,552,679 ¥155,972 ¥430,965 ¥183,427 ¥26,958 ¥3,350,001 ¥ (17,322) ¥3,332,679

MITSUBISHI ELECTRIC CORPORATION ANNUAL REPORT 2011 71
As of and for the year ended March 31, 2010 Yen (million)
JapanNorth
America
Asia (excluding
Japan) Europe Others Subtotal Eliminations Total
I Net sales and operating income
Sales:(1) External customers ¥2,531,542 ¥189,927 ¥325,730 ¥272,993 ¥33,106 ¥3,353,298 ¥ — ¥3,353,298(2) Intersegment 354,960 15,786 119,992 9,829 34 500,601 (500,601) — Net sales 2,886,502 205,713 445,722 282,822 33,140 3,853,899 (500,601) 3,353,298Operating costs 2,836,829 200,182 418,385 279,731 31,191 3,766,318 (507,322) 3,258,996Operating income ¥ 49,673 ¥ 5,531 ¥ 27,337 ¥ 3,091 ¥ 1,949 ¥ 87,581 ¥ 6,721 ¥ 94,302
II Assets ¥2,527,697 ¥130,586 ¥391,891 ¥162,568 ¥22,101 ¥3,234,843 ¥ (19,749) ¥3,215,094
As of and for the year ended March 31, 2009 Yen (million)
JapanNorth
America
Asia (excluding
Japan) Europe Others Subtotal Eliminations Total
I Net sales and operating income
Sales:(1) External customers ¥2,769,713 ¥225,718 ¥324,157 ¥311,451 ¥34,080 ¥3,665,119 ¥ — ¥3,665,119(2) Intersegment 409,094 14,871 137,392 10,050 27 571,434 (571,434) — Net sales 3,178,807 240,589 461,549 321,501 34,107 4,236,553 (571,434) 3,665,119Operating costs 3,089,514 244,188 429,477 310,774 33,087 4,107,040 (581,649) 3,525,391Operating income (loss) ¥ 89,293 ¥ (3,599) ¥ 32,072 ¥ 10,727 ¥ 1,020 ¥ 129,513 ¥ 10,215 ¥ 139,728
II Assets ¥2,674,014 ¥133,168 ¥362,990 ¥156,638 ¥17,354 ¥3,344,164 ¥ (10,041) ¥3,334,123
As of and for the year ended March 31, 2011 U.S. dollars (thousand)
JapanNorth
America
Asia (excluding
Japan) Europe Others Subtotal Eliminations Total
I Net sales and operating income
Sales:(1) External customers $32,352,036 $2,608,867 $5,054,904 $3,444,121 $459,723 $43,919,651 $ — $43,919,651(2) Intersegment 5,920,313 161,711 1,979,157 97,470 518 8,159,169 (8,159,169) — Net sales 38,272,349 2,770,578 7,034,061 3,541,591 460,241 52,078,820 (8,159,169) 43,919,651Operating costs 36,135,554 2,754,156 6,507,145 3,447,254 408,084 49,252,193 (8,148,940) 41,103,253Operating income $ 2,136,795 $ 16,422 $ 526,916 $ 94,337 $ 52,157 $ 2,826,627 $ (10,229) $ 2,816,398
II Assets $30,755,169 $1,879,181 $5,192,349 $2,209,964 $324,795 $40,361,458 $ (208,699) $40,152,759
Notes: 1 The Company has identified 5 location segments based on geographical proximity, similarity in market, and interconnectedness within business activities. 2 The major countries and regions included in each segments are as follows: (1) North America : United States, and Canada (2) Asia (excluding Japan) : China, South Korea, Thailand, Malaysia, Singapore, and Indonesia (3) Europe : United Kingdom, France, Germany, the Netherlands, Spain, and Italy 3 The amount of company-wide shared assets included in “Eliminations and other” on “Assets” for the years ended March 31, 2011, 2010 and 2009 is
¥267,159 million ($3,218,783 thousand), ¥204,551 million and ¥184,316 million, respectively, and those amounts are mainly the Company’s deposit in bank.
(24) SUBSEqUENT EVENT
On June 29, 2011, the date the consolidated financial statements were issued, there was no incidence of subsequent events that
would give material effects on the Company’s consolidated financial position and results of operations.

72 MITSUBISHI ELECTRIC CORPORATION ANNUAL REPORT 2011
Independent Auditors’ Report

Corporate Data / Shareholder Information
Number of Shares (thousands)
Percentage of Total
The Master Trust Bank of Japan, Ltd. (Trust Account) 180,351 8.4%
State Street Bank and Trust Company 115,284 5.4%
Japan Trustee Services Bank, Ltd. (Trust Account) 107,070 5.0%
Meiji Yasuda Life Insurance Company 81,862 3.8%
Nippon Life Insurance Company 72,439 3.4%
Mitsubishi Electric Group Employees Shareholding Union 49,458 2.3%
SSBT OD05 OMNIBUS ACCOUNT-TREATY CLIENTS 43,241 2.0%
The Bank of Tokyo-Mitsubishi UFJ, Ltd. 36,849 1.7%
Japan Trustee Services Bank, Ltd. (Trust Account 4) 35,372 1.6%
The Master Trust Bank of Japan, Ltd. (Mitsubishi Heavy Industries, Ltd. [Retirement benefit trust account]) 30,087 1.4%
Major Shareholders
(As of March 31, 2011)
Corporate DataMitsubishi Electric Corporation
Tokyo Building, 2-7-3, Marunouchi,
Chiyoda-ku, Tokyo 100-8310, Japan
Tel: +81(3)3218-2111
Established: January 15, 1921
Paid-in Capital: ¥175,820 million
Shares issued: 2,147,201,551 shares
Employees: 114,443
Annual MeetingThe annual meeting of shareholders of the Corporation is normal-
ly held in June each year. In addition, the Corporation may hold a
special meeting of shareholders as necessary, giving at least two
weeks advance notice to shareholders.
Stock Exchange ListingsJapan: Tokyo
Europe: London
Stock Price (Yen)
0
1,500
1,200
900
600
300
5,000
10,000
15,000
20,000
’08/4 ’09/4 ’10/4 ’11/4 Nikkei Stock Average(Yen)The Nikkei Stock Average is based on information copyrighted by Nihon Keizai Shimbun, Inc.
Other Corporations
Individuals and Others
Securities Companies
Financial InstitutionsForeign Corporations
0.8%
44.2%
6.5%
31.1%
17.4%
Distribution of Shareholders
MITSUBISHI ELECTRIC CORPORATION ANNUAL REPORT 2011 73

X-X01-1-C8783-A HQ1108〈MDOC〉
http://www.MitsubishiElectric.com