Other Governmental and Proprietary Funds
22
Financial Section 121 2014-15 Comprehensive Annual Budget Report | Financial Section In this sub-section, other governmental and proprietary funds are detailed with narratives of their respective services, goals, achievements, and performance measurements. Special Revenue Funds........................................................... 122 Federal Projects Funds........................................................ 123 Other Special Revenue Funds............................................. 124 Debt Service Funds ................................................................ 126 Capital Projects Funds ........................................................... 130 Proprietary Funds ................................................................... 139 Food Services Fund............................................................. 139 Internal Service Funds ......................................................... 141 Other Governmental and Proprietary Funds
Transcript of Other Governmental and Proprietary Funds

Fina
ncia
l Sec
tion
1212014-15 Comprehensive Annual Budget Report |
Fina
ncia
l Sec
tion
In this sub-section, other governmental and proprietary funds are detailed with narratives of their respective services, goals, achievements, and performance measurements.
Special Revenue Funds........................................................... 122 Federal Projects Funds........................................................ 123 Other Special Revenue Funds............................................. 124
Debt Service Funds ................................................................ 126 Capital Projects Funds ........................................................... 130 Proprietary Funds ................................................................... 139
Food Services Fund............................................................. 139Internal Service Funds ......................................................... 141
Other Governmental andProprietary Funds

122 | Clark County School District
grants is included in the appendix section. The Medicaid programs are for services rendered on behalf of eligible students receiving School-Based Child Health Services that are used to supplement the District’s educational process.
The Federal Projects Funds’ ending fund balance is expected to decrease by almost $2 million due to the planned spend down of reimbursement revenues received in prior years for Medicaid services on behalf of eligible students.
The District maintains one major governmental and five non-major governmental special revenue funds. “Special revenue funds are used to account for and report the proceeds of specific revenue sources that are restricted or committed to expenditure for specified purposes other than debt service or capital projects.” Government Accounting Standards Board, Statement 54, Par. 30
Federal Projects Funds
The Federal Projects Funds are used to account for projects related to federally assisted activities. A detailed listing of
Special Revenue Funds
Grants From Federal SourcesFor the Fiscal Years 2013-14 and 2014-15
Description2013-14
Estimated2014-15Budget
Title I, Part A ClusterP.L. 103-382:
Focus School Improvement - Title I $ 1,325,000 $ 1,325,000 Title I-A Basic 104,465,755 105,665,755 Differentiated Consequences Grant 870,000 870,000
Special Education Cluster (IDEA)P.L. 101-476:
Educate Students with Disabilities 69,942,779 69,942,779 District Improvement Grant Plan 500,000 500,000 Educate the Handicapped: Preschool 2,100,000 2,100,000
Carl D. Perkins Career and Technical Education 4,254,500 4,254,500
Indian Education Act, Title IX-A, P.L. 102-382 172,000 172,000
Direct Grants from the Nevada Department of EducationFIE - Highly Gifted (GATE Title V-D) 287,800 287,800 FIE - English Language Learners (ELL) 10,000 10,000
Direct Grants from the U.S. Department of EducationInvesting in Innovation 1,890,000 1,890,000
Direct Grants from the U.S. Department of InteriorIndian Ed Assistance - J. O'Malley Supplement 10,200 10,200 Lake Mead National Recreation Area 25,000 25,000
Direct Grants from the U.S. Department of JusticeCommunity Oriented Policing Services 205,000 205,000
Nevada Department of Education Pass-Thru ProgramsHigh School Graduation Initiative 1,800,000 1,800,000 Professional Development for Arts Educators 400,000 400,000 Title I-D Neglected & Delinquent Children-Correctional 650,000 650,000 Title I-D Neglected & Delinquent Children 831,500 831,500 Title I NCCAT-D Grant 30,000 30,000 Title III English Language Acquisition 8,645,000 8,645,000 Title II-A Improving Teacher Quality 7,799,500 7,799,500 Education of Homeless Children and Youth 115,650 115,650 21st Century Community Learning Centers 3,481,577 3,481,577 Common Core Summer Institute 130,000 130,000 Refugee School Impact Aid 117,394 117,394 Striving Readers Comprehensive Literacy 15,500,000 15,500,000 Mathematics & Science Partnerships 415,000 415,000

Fina
ncia
l Sec
tion
1232014-15 Comprehensive Annual Budget Report |
Grants From Federal Sources - ContinuedFor the Fiscal Years 2013-14 and 2014-15
Description2013-14
Estimated2014-15Budget
Nevada Department of Education Pass-Thru Programs - ContinuedTitle I 1003(g) School Improvement Plan 7,170,000 7,170,000 Title I 1003(g) School Improvement Plan - Cohort 1 500,000 500,000 GEAR UP 1,240,000 1,240,000 Advanced Placement Fee Payment Program 5,200 5,200
University of Las Vegas NevadaImproving Teacher Quality 105,000 105,000
Nevada Department of TransportationSafe Routes to School 364,145 364,145
Centers for Disease Control and PreventionCommunity Transformation Grant 2,400,000 2,400,000
Community Services Agency
Jobs for America's Graduates 660,000 660,000
PACT Coalitin for Safe and Drug Fee CommunitiesSubstance Abuse Prevention Agency 122,000 122,000
Southern Nevada Workforce Investment BoardYouthbuild Program 160,000 160,000
Southern Nevada Health DistrictARRA-Prevention First 100,000 100,000
Other Federal SourcesMedicaid Reimbursement Programs 4,500,000 4,500,000
Total federal sources appropriations $243,300,000 $244,500,000
Federal Projects Funds - Summary Of Revenues, Expenditures, And Changes In Fund BalanceFor Fiscal Years 2012-13 Through 2014-15
2012-13Actuals
2013-14Estimated Actuals
2014-15Final Budget 2013-14 Vs. 2014-15
Description Staff Amount Staff Amount Staff Amount Amount PercentRevenues and Resources: Federal sources $186,097,701 $243,300,000 $244,500,000 $ 1,200,000 0.5 % Opening fund balance 9,459,799 10,724,831 8,774,831 (1,950,000) (18.2)%Total Resources 195,557,500 254,024,831 253,274,831 (750,000) (0.3)%
Expenditures: Salaries 1,442.32 102,398,637 1,345.00 115,894,250 1,345.00 115,694,250 (200,000) (0.2)% Employee benefits 31,502,407 34,212,000 34,415,000 203,000 0.6 % Purchased services 14,778,172 30,124,000 30,056,000 (68,000) (0.2)% Supplies 30,700,694 50,103,750 51,405,750 1,302,000 2.6 % Property/equipment 596,003 4,405,000 4,360,000 (45,000) (1.0)% Other expenditures 4,856,756 10,511,000 10,519,000 8,000 0.1 %Total Expenditures: 184,832,669 245,250,000 246,450,000 1,200,000 0.5 %
Ending fund balance 10,724,831 8,774,831 6,824,831 (1,950,000) (22.2)%
Total Applications 1,442.32 $195,557,500 1,345.00 $254,024,831 1,345.00 $253,274,831 $ (750,000) (0.3)%Source: CCSD Budget and Accounting Departments

124 | Clark County School District
Other Special Revenue Funds - Budget SummaryFiscal Year 2014-15
2014-15Description Fund Budget
Vegas PBS Services Public and Private 220 $ 11,160,000
State Funded Grant Programs:Adult education-prison program 230 2,750,000 Adult education-regular program 230 9,650,000 Assembly Bill 1 - Incentive grant 279 4,600,000 Educational enhancement programs 279 1,740,000 Educational technology 279 2,830,000 Full day kindergarten program 279 49,716,000 Professional development programs 279 4,894,000 Psychologists/counselors 5% salary increase 279 320,000 Speech pathologist 5% salary increase 279 295,000 Windsong-improve the quality of teaching 279 1,000,000 Windsong-pre kindergarten 279 600,000 Senate Bill SB 504 - Zoom Schools 279 14,950,000 Other 279 395,000
Total State funded grant programs 93,740,000
Total Other Special Revenue Funds $104,900,000
Source: Fiscal Accountability and Data Analysis
Other Special Revenue Funds
The Other Special Revenue Funds are used to account for activities of the District relating to additional educational services provided to the public for student activities, drivers’ education, adult education, telecommunications, special State appropriations, and other revenues from entities and individuals outside the District.
Major programs included are:
Adult High School Diploma – Educational program funding is for out-of-school persons (including prison inmates) 17 years of age and older who seek a high school diploma or General Educational Development (GED) certificate. The Education Services Division administers the Adult Education Program. This program also serves students enrolled in regular day schools who need to make up a number of deficient high school credits.
Nevada Department of Education Special Appropriations – Provides a wide range of special appropriations for enhancing educational programs, including school improvement plans, funding for full day kindergarten programs, zoom schools, operations of professional development centers, providing remedial education programs for schools designated as demonstrating need for improvement, upgrading technology in schools, and implementing other educational support programs.
Vegas PBS – Revenues are generated from public television memberships, corporate program sponsors, contract productions, facility rentals, and the Corporation for Public Broadcasting and includes non-instructional public television expenditures such as general audience programming and capital purchases. These sources provide approximately two-thirds of the operating budget for Vegas PBS, which includes: public television, audio and video services for the District, school cable wiring, educational satellite and cable, and closed circuit wireless services. Certain revenues in this fund are restricted by the donor for specific programming or capital purchases. More detailed operations information on Vegas PBS is included in Unit 140 of the General Operating Fund.
Special Revenue Appropriations – Other governmental entities outside the District for special instructional projects or programs are included.

Fina
ncia
l Sec
tion
1252014-15 Comprehensive Annual Budget Report |
Other Special Revenue Funds - Summary Of Revenues, Expenditures, And Changes In Fund BalanceFor Fiscal Years 2012-13 Through 2014-15
2012-13Actuals
2013-14Estimated Actuals
2014-15Final Budget 2013-14 Vs. 2014-15
Description Staff Amount Staff Amount Staff Amount Amount PercentRevenues and Resources: Local sources $ 8,477,071 $13,545,000 $13,545,000 $ - - % State sources 52,919,035 88,630,000 80,880,000 (7,750,000) (8.7)% Federal sources 55,079 350,000 350,000 - - % Transfers from other funds 4,817,116 8,660,000 10,000,000 1,340,000 15.5 % Opening fund balance 2,824,815 3,184,742 2,669,742 (515,000) (16.2)% Total Resources 69,093,116 114,369,742 107,444,742 (6,925,000) (6.1)%
Expenditures and Uses: Salaries 523.39 30,810,502 1,038.00 60,103,000 1,005.00 60,786,000 683,000 1.1 % Employee benefits 22,440,092 26,407,000 26,687,000 280,000 1.1 % Purchased services 5,595,392 10,595,000 8,140,000 (2,455,000) (23.2)% Supplies 3,267,697 6,100,000 5,612,000 (488,000) (8.0)% Property/equipment 213,209 5,830,000 1,655,000 (4,175,000) (71.6)% Other expenditures 2,940,360 2,165,000 2,020,000 (145,000) (6.7)% Transfers to other funds 641,122 500,000 - (500,000) (100.0)% Total Expenditures and Uses 65,908,374 111,700,000 104,900,000 (6,800,000) (6.1)%
Ending fund balance 3,184,742 2,669,742 2,544,742 (125,000) (4.7)%
Total Applications 523.39 $ 69,093,116 1,038.00 $114,369,742 1,005.00 $107,444,742 $(6,925,000) (6.1)%Source: CCSD Budget and Accounting Departments
Special Revenue Funds - Projected BudgetsFor Fiscal Years 2014-15 Through 2017-18Fund Expenditure Appropriations by Major Object
Description2014-15Budget
2015-16Projected
2016-17Projected
2017-18Projected Growth Rate
Revenues:Local sources $13,545,000 $14,000,000 $14,500,000 $15,000,000 3.4 %State sources 80,880,000 81,000,000 83,500,000 87,000,000 4.2 %Federal sources 244,850,000 245,000,000 247,000,000 248,000,000 0.4 %Total Revenues 339,275,000 340,000,000 345,000,000 350,000,000 1.4 %
Expenditures:Salaries 176,480,250 180,000,000 183,000,000 185,000,000 1.1 %Employee benefits 61,102,000 65,000,000 67,000,000 70,000,000 4.5 %Purchased services 38,196,000 35,000,000 35,000,000 35,000,000 - %Supplies 57,017,750 55,000,000 55,000,000 55,000,000 - %Property and equipment 6,015,000 5,000,000 3,500,000 3,500,000 - %Other expenditures 12,539,000 5,000,000 3,000,000 3,000,000 - %Total Expenditures 351,350,000 345,000,000 346,500,000 351,500,000 1.4 %
Excess (Deficiency) of Revenuesover Expenditures (12,075,000) (5,000,000) (1,500,000) (1,500,000)
Other Sources and (Uses):Transfers from other funds 10,000,000 - - -
Opening fund balance - July 1 11,444,573 9,369,573 4,369,573 2,869,573
Ending Fund Balance - June 30 $9,369,573 $4,369,573 $2,869,573 $1,369,573 Source: Budget Department

126 | Clark County School District
Debt Service Funds
The Debt Service Funds are used to account for the accumulation of resources for and the payment of general long-term debt principal, interest, and related costs. The sources of revenue are property taxes, room taxes, and real property transfer taxes earmarked by statute for capital programs. Additionally, proceeds of refunding bonds are accounted for in this fund. The Fund includes obligations of the 1998 Capital Improvement Program, the $642.7 million 1996 bond program, and the $605 million 1994 bond program.
Nevada Revised Statute 387.400 limits the aggregate principal amount of the District’s general obligation debt to 15% of the total assessed valuation of property within the District. Based upon the assessed valuation for fiscal year 2015 (using the Nevada Department of Taxation’s estimate of $64 billion), the District’s current debt limit is $9.6 billion. The District had outstanding general obligation debt on July 1, 2014, of $2.9 billion, leaving additional debt capacity of $6.7 billion, or a margin of 70% additional.
Balances in the Fund, which are restricted by statute only for payment of debt service, will decrease as a reflection of the instability in Clark County’s assessed valuation. These balances, being restricted from other use, provide both a margin of security for the District’s bonds and the opportunity to support substantial increases in bonded debt while maintaining stability in property tax rates. The schedule of statutory debt limitation indicates that existing and projected debt levels will not impact current and future operations.
Authorized Debt
In November 1998, voters of Clark County approved funding for a 10-year building program for school construction and modernization. This program was funded through a combination of property tax supported general obligation debt and debt additionally secured by pledged room tax and real property transfer tax revenues. The final bond issue from the 1998 authorization occurred in 2008. The District has delayed requesting voter approval for another building program until the economic conditions in the County have substantially improved.
Defeasement of Debt
The District has defeased certain general obligation bonds by placing the proceeds of new bonds into irrevocable trust accounts to provide for all future debt service payments on the old bonds. Accordingly, the trust account assets and the liability for the defeased bonds are not included in the District’s financial statements. At June 30, 2014, $536 million of previously outstanding principal is considered to be defeased.
Debt Service Reserve Fund
Nevada Revised Statute 350.020 requires that the District establish a reserve account within its debt service fund for payment of the outstanding bonds of the District. Currently, the account must be established and maintained in an amount at least equal to the lesser of the amount of principal and interest payments due on 25% of the outstanding bonds in the next fiscal year ($113.7 million) or 10% of all principal amounts ($289 million) outstanding at the end of fiscal year 2014-15. The projected ending fund balance at June 30, 2014, of $67.5 million fails to exceed the 25% of all outstanding bonds principal and interest payments in the next fiscal year. However, Assembly Bill 353 (AB 353) Capital Projects Fund contains a balance of over $109 million which may be used to cover any shortfall in the Reserve Fund.
The statutory debt capacity is established in accordance with NRS 350.013. The District’s debt management policy is approved annually by the Board and filed with the Nevada Department of Taxation and the Clark County Debt Management Commission. It is expected that future increases in assessed valuation, along with retirement of existing bonds, will result in a statutory debt limitation in excess of outstanding debt.
Summary of Debt ServiceAs of July 1, 2014
Fiscal Year Principal InterestTotal
Requirements2015 $ 312,475,000 $142,319,250 $ 454,794,250 2016 280,805,000 125,488,840 406,293,840 2017 289,590,000 111,645,490 401,235,490 2018 294,840,000 97,221,890 392,061,890 2019 289,720,000 82,805,040 372,525,040 2020 - 24 994,080,000 239,831,915 1,233,911,918 2025 - 28 432,615,000 41,459,650 474,074,650 Totals $2,894,125,000 $840,772,075 $3,734,897,075

Fina
ncia
l Sec
tion
1272014-15 Comprehensive Annual Budget Report |
Debt Service Funds - Statutory Debt LimitationFiscal Years 2014-15
DescriptionAssessed
Valuation Basis
Fiscal year 2014-15 assessed value of all taxable property situated in Clark County (includes $1,347,691,561 assessed valuation for redevelopment agencies) $64,252,633,650
Gross limitation -- 15% of assessed valuation (NRS 387.400) $9,637,895,048
Outstanding bonds of the Debt Service Fund at July 1, 2014 2,894,125,000Excess of limitation at July 1, 2014 $6,743,770,048
Debt Limit Margin 30.03%
Source: CCSD Budget Department
Debt Service Funds - Statutory Debt Additional CapacityFor Fiscal Years 2005-06 Through 2014-15
Fiscal Year Total
Assessed Valuation1 Debt Limit
Outstanding General Obligation Debt
As of July 1 Additional Statutory
Debt Capacity
2005-06 $ 65,582,487,400 $ 9,837,373,110 $ 3,220,455,500 $ 6,616,917,610 2006-07 91,622,434,937 13,743,365,241 3,534,820,500 10,208,544,741 2007-08 109,212,919,843 16,381,937,976 3,915,265,500 12,466,672,476 2008-09 115,790,200,550 17,368,530,083 5,006,995,500 12,361,534,583 2009-10 93,790,791,674 14,068,618,751 4,670,965,000 9,397,653,751 2010-11 65,758,625,871 9,863,793,881 4,110,425,000 5,753,368,881 2011-12 59,054,835,152 8,858,225,273 3,860,905,000 4,997,320,273 2012-13 55,225,712,175 8,283,856,826 3,554,575,000 4,729,281,826 2013-14 56,296,847,888 8,444,527,183 3,223,895,000 5,220,632,183 2014-15 64,252,633,650 9,637,895,048 2,894,125,000 6,743,770,048
(1) Includes redevelopment agenciesSource: CCSD Budget and Accounting Departments
Property Tax Levies (Per $100 Of Adjusted Assessed Valuation)For Fiscal Years 2010-11 Through 2014-15Fiscal Year 2010-11 2011-12 2012-13 2013-14 2014-15
Basic School Levy (General Operations) $0.7500 $0.7500 $0.7500 $0.7500 $0.7500
Debt Service/Special Projects Levy 0.5534 0.5534 0.5534 0.5534 0.5534
Total District Levies $1.3034 $1.3034 $1.3034 $1.3034 $1.3034Source: Clark County Assessor’s Office
0
1.0
2.0
3.0
4.0
$5.0$4.671
$3.555
$3.224
$3.861
$4.110
$2.894
2009 2010 201320122011 2014
Supported Debt And Related Tax LevyAs of June 30, 2014
Debt Levy .5534 .5534.5534.5534.5534 .5534
Source: Clark County Assessor’s Office
(1) Debt includes any special tax overrides for public safety projects and other capital programs (fire safety retrofit/asbestos removal, pay-as-you-go, EPA loan).

128 | Clark County School District
Debt Service Fund - Schedule Of General Obligation Bonds OutstandingAs of July 1, 2014
Issue DateDate of
Final Maturity TermInterest
RateOriginal
IssueBalance
July 1, 2013September 1, 1998 (Refunding May 1996) June 15, 2015 17 Years 4.6977% $ 169,310,000 $ 26,770,000
March 1, 2005A (Refunding April 1999, June 2002) June 15, 2019 14 Years 3.9800 269,600,000 219,025,000
March 1, 2005B (Refunding October 2001) June 15, 2022 17 Years 4.0713 209,995,000 161,795,000
November 15, 2005C1 June 15, 2019 20 Years 4.4161 500,000,000 107,790,000
March 30, 2006A (Refunding March 1996, June 2002) June 15, 2015 9 Years 3.8515 153,925,000 21,170,000
December 19, 2006B June 15, 2026 20 Years 4.1025 450,000,000 335,750,000
December 19, 2006C June 15, 2026 20 Years 4.1125 125,000,000 93,270,000
March 30, 2007A (Refunding November 2003,November 2004, November 2005) June 15, 2025 18 Years 4.1262 473,045,000 343,780,000
December 11, 2007B June 15, 2027 20 Years 4.3246 250,000,000 197,920,000
December 11, 2007C June 15, 2027 20 Years 4.3330 400,000,000 316,675,000
June 3, 2008A June 15, 2028 20 Years 4.1960 675,000,000 444,565,000
July 8, 2010A June 15, 2024 14 Years 0.7497 104,000,000 104,000,000
July 8, 2010D June 15, 2020 10 Years 0.7033 6,245,000 6,245,000
March 3, 2011A (Refunding September 2001C) June 15, 2016 5 Years 2.1065 69,160,000 29,380,000
March 3, 2011B (Refunding September 2001D) June 15, 2019 8 Years 2.9849 29,420,000 29,420,000
October 4, 2012A (Refunding November 2004, November 2005) June 15, 2021 9 Years 1.6657 159,425,000 159,425,000
July 31, 2013A June 15, 2023 10 Years 2.5233 32,855,000 29,015,000
July 31, 2013B (Refunding November 2003, November 2004, November 2005) June 15, 2019 6 Years 1.7281 95,870,000 74,755,000
April 29, 2014A (Refunding March and November 2004) June 15, 2020 6 Years 1.1606 131,175,000 131,175,000
April 29, 2014B (Refunding March 2004) June 15, 2020 6 Years 1.3486 62,200,000 62,200,000
Total Outstanding Bonded Indebtness $2,894,125,000 1 Date of final maturity has been changed from the original final maturity due to refunded debt payments.
Source: CCSD Budget and Accounting Departments

Fina
ncia
l Sec
tion
1292014-15 Comprehensive Annual Budget Report |
Debt Service Funds - Summary Of Revenues, Expenditures, And Changes In Fund BalanceFor Fiscal Years 2012-13 Through 2014-15
Debt Service2012-13Actuals
2013-14Estimated
Actuals2014-15
Final Budget2013-14 vs. 2014-15
Amount PercentRevenues and resources:
Local revenues $298,150,491 $292,495,000 $307,800,000 $ 15,305,000 5.2 %Proceeds of refunding bonds 199,248,293 324,725,000 437,590,000 112,865,000 34.8 %Transfers from other funds 91,982,730 97,695,000 87,280,000 (10,415,000) (10.7)%Opening fund balance 276,954,144 175,795,693 67,855,693 (107,940,000) (61.4)%Total revenues and resources 866,335,658 890,710,693 900,525,693 9,815,000 1.1 %
Expenditures and other uses:Principal 329,110,000 339,665,000 312,475,000 (27,190,000) (8.0)%Interest 171,213,890 157,105,000 142,320,000 (14,785,000) (9.4)%Purchased services 641,881 1,210,000 2,405,000 1,195,000 98.8 %Payments to refund escrow agent 189,574,194 324,875,000 435,185,000 110,310,000 34.0 %Total expenditures and uses 690,539,965 822,855,000 892,385,000 69,530,000 8.4%
Ending fund balance 175,795,693 67,855,693 8,140,693 (59,715,000) (88.0)%
Total applications $866,335,658 $890,710,693 $900,525,693 $ 9,815,000 1.1 %Source: CCSD Budget and Accounting Departments
Debt Service Funds - Projected BudgetsFor Fiscal Years 2014-15 Through 2017-18Fund Expenditure Appropriations by Major Object
Description2014-15Budget
2015-16Projected
2016-17Projected
2017-18Projected Growth Rate
Revenues:Property taxes $ 306,215,000 $ 331,900,000 $ 349,980,000 $ 369,980,000 5.7 %Interest on investments 1,560,000 80,000 - - - %Other local revenues 25,000 20,000 20,000 20,000 - %Total Revenues 307,800,000 332,000,000 350,000,000 370,000,000 5.7 %
Expenditures:Principal 312,475,000 280,805,000 289,590,000 294,840,000 1.8 %Interest 142,320,000 125,495,000 111,645,000 97,225,000 (12.9)%Purchased services 2,405,000 - - - - %Total Expenditures 457,200,000 406,300,000 401,235,000 392,065,000 (2.3)%
Excess (Deficiency) of Revenuesover Expenditures (149,400,000) (74,300,000) (51,235,000) (22,065,000)
Other Sources and (Uses):Proceeds of refunding bonds 437,590,000 - - - Payment to refunding escrow agent (435,185,000) - - - Transfer from other funds 87,280,000 86,845,000 86,855,000 86,600,000 Total Other Sources and (Uses): 89,685,000 86,845,000 86,855,000 86,600,000
Opening Fund Balance - July 1 67,855,693 8,140,693 20,685,693 56,305,693
Ending Fund Balance - June 30 $8,140,693 $20,685,693 $56,305,693 $120,840,693
Source: Budget Department

130 | Clark County School District
The number of schools maintained and the age of the schools places unrelenting demands on the available modernization funds. The CIP provides for the possibility of a full replacement of a building or a wing of a building, replacement and/or major renovation of building components once the useful life has been reached. The plan also addresses major renovations needed for mandated modification and changing educational program needs.
After fulfilling the growth demands of the District, more than one-third of the funding from the CIP has been or will be expended on renovation and modernization projects. Modifications are made at schools to bring their facilities up to date in design and function. Modernization is much more than merely a cosmetic effort. It is essential work intended to extend the life of the facility and provide improved physical facilities essential for student achievement. Almost all projects have to install new security systems, new playground shade structures, access to the wide area network, new computers, and replacement of worn or unsafe furniture.
Capital Projects Funds
The various capital projects funds are used to account for projects related to land and building acquisition, construction, and improvements to schools and other District-owned properties. The District maintains a demand-responsive and dynamic construction program to construct and renovate facilities, and to provide technology and equipment upgrades as necessary to meet the District facilities requirements. This program is described in the Capital Improvement Plan (CIP).
The 1998 Capital Improvement Program – The Capital Improvement Plan (CIP) was a financial plan for the acquisition of land and buildings, construction of new buildings, improvement or replacement of District-owned facilities and infrastructure, and the upgrade of technology. Those capital improvements were projects with long useful lives that acquired buildings and land, provided land improvements, constructed new buildings, and expanded, upgraded, or repaired existing facilities or infrastructure. Capital project expenditures transpired over two or more years and generally required recording the project over multiple fiscal year budgets. Most of the capital projects were funded with bonded debt due to the significant costs involved and the need to spread the acquisition cost of the asset over several years.
Five Year Capital Improvement Plan (CIP)For Fiscal Years 2014-15 Through 2018-19Descriptions FY 2014-15 FY 2015-16 FY 2016-17 FY 2017-18 FY 2018-19
1998 Capital Improvement Program:Land Acquisition $ 3,000,000 $ - $ - $ - $ - New Construction: Other Facilities 10,000,000 15,000,000 - - - Rehab/Modernization 52,000,000 35,000,000 - - - Fund Total 65,000,000 50,000,000 - - -
Governmental Services Tax Fund:Rehab/Modernization 13,700,000 13,700,000 13,700,000 13,700,000 13,700,000 Purchase of Portable Classrooms 2,000,000 2.000,000 2,000,000 2,000,000 2,000,000 Relocation of Portable Classrooms 5,500,000 5,500,000 5,500,000 5,500,000 5,500,000 Fund Total 21,200,000 21,200,000 21,200,000 21,200,000 21,200,000
Building And Sites Fund:Site Improvements 750,000 750,000 750,000 750,000 750,000 Fund Total 750,000 750,000 750,000 750,000 750,000
Capital Replacement Fund:Student Information System 1,600,000 - - - - Fund Total 1,600,000 - - - -
Total All Capital Funds $88,550,000 $71,950,000 $21,950,000 $21,950,000 $21,950,000Source: CCSD Facilities and Bond Financial Management

Fina
ncia
l Sec
tion
1312014-15 Comprehensive Annual Budget Report |
when economic conditions in the County have substantially improved to continue a similar capital improvement program without increasing the existing property tax levy.
County Room Tax Proceeds
The Board of County Commissioners was authorized to increase the Clark County room tax rate by one percent beginning August 1997. Proceeds from this tax are deposited in the District’s fund for capital projects. Also, effective July 1, 1999, the five-eighths of one percent of the room tax previously provided to the Las Vegas Convention and Visitors Authority is now a revenue component of the District’s Capital Projects Fund.
Real Property Transfer Tax Proceeds
This bill also authorized an increase in the real property transfer tax from 65 cents to $1.25 for each $500 of value. Proceeds from this 60 cents increase are deposited in the District’s Capital Projects Fund.
Capital Improvement Plan (CIP) Process
The Capital Improvement Plan (CIP) is updated annually to outline the planned capital improvements within the available financial resources by the Facilities and Bond Fund Financial Management office. Input is shared from the Demographics and Zoning Department, the Real Property Management Department, the Facilities Division Planning and Design team, and Construction Management. The Instructional Division, the Maintenance Department, the Technology Division, and the Purchasing Department also contribute during the planning and construction phases. The CIP is reviewed frequently by the Bond Oversight Committee (BOC) and approved by the Board of Trustees (BOT) through a formal revision process.
The five-year CIP is prepared showing the planned expenditures in the various capital funds for the next five years. Although the five-year CIP shows projects scheduled throughout the five-year plan, it is only those expenditures shown in the first year of the plan that are adopted as part of the current fiscal year budget. The five-year CIP takes into account the execution, completion, and close-out of previously approved projects, and the start-up of future projects. The 2014-15 through 2018-19 five-year CIP, includes a revision to the program based on updated revenue projections, enrollment projections, and additional needs and was formally approved by the Board of Trustees in July 2014.
Capital Improvement Program Revenue Sources Nevada is a state that historically has not provided assistance for school construction and modernization projects. Seeking voter approval to pass bond questions has been the only feasible way of obtaining financing to build schools at the pace needed. The District has received the approval of Clark County voters for bond questions consistently since 1988. During the 1997 Legislature, the District sought the enactment of laws providing more effective methods of supplementing bond funds for school construction.
Assembly Bill 353 (AB 353), approved in 1997, provided the District with ongoing and reliable revenues to address the financing of land acquisition for schools, and the design, new construction, and repair of school facilities. This bill provided three proactive solutions to fund construction.
Freeze on Property Tax Rates for Long-Term Bonding
In 1998, the Board authorized a ballot initiative seeking approval to freeze property tax rates for long-term bonding that would enable the District to issue general obligation bonds until 2008 while maintaining a property tax levy of .5534 for school bond debt service. In the 1998 election, voters provided approval for the bond initiative which froze the tax rate for school construction for a decade. It is anticipated that a similar ballot proposal will be requested

132 | Clark County School District
Major Capital Projects Funds
1998 Capital Improvement Program
Legislative Assembly Bill 353 (AB 353) provided the District the opportunity to offer a proactive solution to the voters of Clark County by financing public school construction and renovation as needed without increasing the property tax rate.
Voters authorized the issuance of bonds through June 2008, to be repaid within the existing property tax levy, allowing greater flexibility in responding to the imminent need to provide seats for new students and to repair and renovate
existing school facilities. General obligation bonds issued under AB 353 were approved only after determination by the Board and after receiving approval from the Clark County Oversight Panel for School Facilities and the Debt Management Commission.
In addition to property tax supported bonds, AB 353 provided additional sources of capital funding for the District with approval of the room tax and the real property transfer tax. AB 353 provides safeguards to taxpayers through the tax freeze, more stringent debt reserve requirements, and requiring bond issuance approval by both the Oversight Panel for School Facilities and the Debt Management Commission.
1998 Capital Improvement ProgramBuilding and Modernization Plan
Descriptions Program TotalPercent of
Total ProgramNumber
of Schools
Land Acquisition $ 213,575,000 4.4%
New School ConstructionSpecial/Alternative 35,605,000 0.7% 2Elementary 1,119,390,000 22.8% 61Middle 630,760,000 12.9% 22Senior High 654,620,000 13.4% 11Career and Technical Academy 481,400,000 9.8% 5
Total New School Construction 2,921,775,000 59.6% 101
Replacement SchoolsElementary 181,360,000 3.7% 8Middle 106,470,000 2.2% 2Senior High 77,210,000 1.6% 1Special Schools 49,880,000 1.0% 2
Total Replacement Schools 414,920,000 8.5% 13
Phase ReplacementsElementary 29,510,000 0.6% 3Senior High 100,115,000 2.0% 2Career & Technical Academy 33,700,000 .7% 1
Total Phase Replacements 163,325,000 3.3% 6
Additions to Existing SchoolsElementary 32,980,000 0.7% 4Middle 7,325,000 0.1% 1Senior High 65,775,000 1.3% 10
Total Additions to Existing Schools 106,080,000 2.1% 15
Rehabilitation and ModernizationModernization/Upgrade 785,320,239 16.0% 229Furniture and Equipment Upgrade/Replacement 129,999,400 2.7% 229Technology Upgrades 81,975,361 1.7% 229Portables 21,500,000 0.4%
Total Rehabilitation and Modernization 1,018,795,000 20.8%
Satellite Bus Yards 61,530,000 1.3% 2
Total 1998 Capital Improvement Plan $ 4,900,000,000 100.0%Source: CCSD Facilities and Bond Financial Management

Fina
ncia
l Sec
tion
1332014-15 Comprehensive Annual Budget Report |
The 1998 Capital Improvement Program was approved by the Board on May 28, 1998, and approved by voters in November 1998. The original program totaling $3.526 billion was projected to meet the needs of the District through 2008. The program was allocated for $115 million in land acquisition, $2.526 billion for construction of 88 new schools, $31 million for construction of two new bus yards, and $854 million for modernization of older schools.
The program was last reviewed by the Bond Oversight Committee on April 17, 2014 who is determining whether to prepare a current revision of the program based upon updated revenue projections, enrollment projections, and additional needs. The previous CIP revision approved continuation of the construction of new schools, adjusted the budgets of the career and technical high schools, replacement schools, phased replacement of schools and transportation facilities, and increased funding for modernization of older schools.
New School Completion ScheduleFiscal Years 2001-2015
School Year
Special SchoolAlternative
SchoolElementary
School Middle School
High School Career and Technical Academy
Replacement Schools Total
2000-01 - 4 2 - - 62001-02 - 7 5 1 & 1 AHS 1 RES 152002-03 - 6 2 - 1 RES 92003-04 - 7 3 2 1 RES 132004-05 - 7 3 3 - 132005-06 - 7 3 1 1 RHS 122006-07 1 SS 6 2 1 - 102007-08 - 6 2 1 1 RES & 1 RMS 112008-09 1 AS 4 - 1 & 1 CTA 4 RES & 1 RMS 122009-10 - 3 - 1 & 2 CTA - 62010-11 - 4 - 1 CTA - 52011-12 - - - - 2 RSS 22012-13 - - - - - -2013-14 - - - - - -2014-15 - - - - - -
Totals 2 61 22 16 13 114RES = Replacement Elementary School AHS = Alternative High SchoolRMS = Replacement Middle School CTA = Career and Technical AcademyRHS = Replacement High School RSS = Replacement Special SchoolSource: CCSD Facilities and Bond Financial Management
The current program (scheduled for completion in June 2015 at a total of $4.9 billion) includes:
• Land acquisition funding for future school sites at a cost of $214 million
• Construction of 101 new schools at a cost of $2.92 billion:1. Sixty-one elementary schools, twenty-two middle schools,
eleven high schools2. Four career and technical academy high schools, one
alternative high school3. One special school and one alternative school
• Construction of 13 replacement schools as mandated by Assembly Bills 368, 396, and 499 at a cost of $415 million
• Construction of six phased replacement schools at a cost of $163 million
• Renovation of existing schools, including additions, modernizations, lifecycle replacement and life/safety upgrades at a cost of $1.12 billion
• Construction of two regional bus transportation centers at a cost of $62 million.

134 | Clark County School District
Student Enrollment Projections
The Demographics and Zoning Department utilizes current birth rates and cohort projection techniques, including review of the number of new residents moving into Clark County and the advancement of students through grade levels, to calculate the student enrollment projections. The District has maintained a reliable accuracy rating compared to actual enrollments in previous years’ projections.
Student enrollment has increased by over 37,000 students during the past ten years. The fiscal 2013-14 official student enrollment was 314,598 and is projected to increase to 317,970 during 2014-15. Current projections indicate that school population will increase steadily over the next three years.
Cost of Building New Schools
It is useful to look at several factors when analyzing the cost of building new schools. Although single designs are frequently used for new schools, the specific site adaptations, construction, and equipment needs will vary for each school. A formula is necessary to account for the variables to accommodate escalating prices, in addition to providing a contingency for unforeseen events.
Site development costs can add significantly to the school’s projected cost. Site development costs are those costs related to preparing the site for construction and occupation. Activities may include leveling the site, installing utility services, and building roads and other infrastructure to the school. Costs can range between $3 million and $10.5 million per school for site development.
The figures in this summary reflect the current average “turnkey costs.” The budgets for these costs are developed using the estimated construction cost as a base and adding set percentages for design fees, telecommunications (including the linking of the security, intercom, clock and telephone systems), inspection and administrative costs, contingency costs, and furnishings.
The average turnkey costs of schools by type are:
Elementary School, $27.4 millionMiddle School, $40 million High School, $105.7 million
Career and Technical Academy, $115 million
New School Construction
Since 1990, the District has addressed its rapidly growing student population through the efficient use of prototype designs for new schools. Experienced school design architects have carefully expanded the current prototype. The input of educators has been utilized to incorporate the space design needed for a successful educational program at each site. The designs also incorporated the most economical life cycle cost to operate and maintain the facility. The current prototype design has been repeated for the construction of almost every new school built during the past two decades. This practice has saved significant time and millions in design and construction fees.
Cost Saving Measures
The District views its responsibility to expend scarce capital funding wisely. Management practices and construction protocols are constantly monitored to achieve maximum efficiency. Due to this proactive approach, additional funding was realized to enable the modernization of far more schools than originally projected. Measures that have resulted in significant savings include the packaging of multiple projects for bidding, peer reviews, focusing on energy efficient designs, considerable scrutiny of change orders, and careful monitoring of inspection practices. Value engineering is the process of reviewing the design of a facility before it is advertised for competitive bidding contributes to significant savings being realized and provides guidelines for future construction projects.
Energy Efficiency
The District has accomplished hundreds of major modernizations at existing school sites replacing major mechanical systems in older schools with more energy efficient systems. This has generated significant savings to the General Fund for electricity and water consumption.
The replacement of a chiller at a high school with more energy efficient systems saves approximately $25,000 each year in energy costs. By replacing multiple systems at a high school site by including a new HVAC system, roof, electrical and lighting upgrades, and adding day lighting, results in savings in excess of $100,000 per year in energy consumption costs.
Solar Photovoltaic Systems
The District utilizing ARRA grant funding and cash rebates from NV Energy has installed solar photovoltaic systems at 35 schools and the Vegas PBS building. The systems generate electricity by converting sunlight into electric current at a substantial savings of at least $330,000 annually.
Fina
ncia
l Sec
tion
1352014-15 Comprehensive Annual Budget Report |
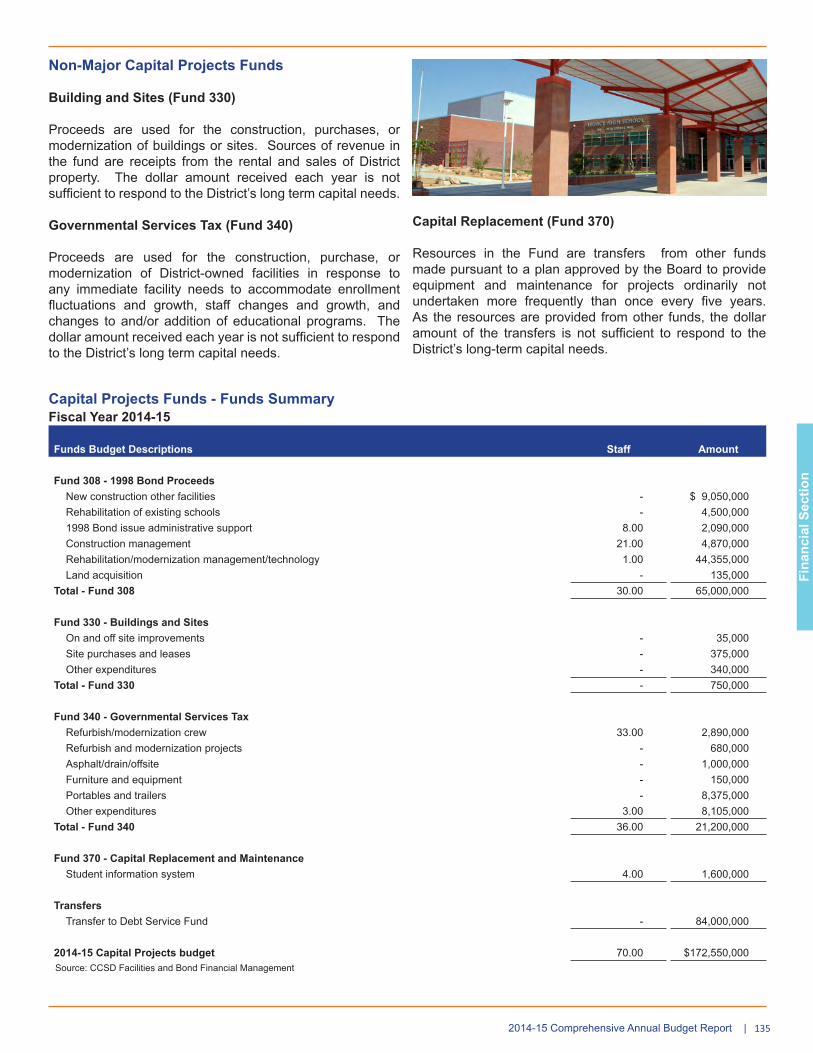
Non-Major Capital Projects Funds
Building and Sites (Fund 330)
Proceeds are used for the construction, purchases, or modernization of buildings or sites. Sources of revenue in the fund are receipts from the rental and sales of District property. The dollar amount received each year is not sufficient to respond to the District’s long term capital needs.
Governmental Services Tax (Fund 340)
Proceeds are used for the construction, purchase, or modernization of District-owned facilities in response to any immediate facility needs to accommodate enrollment fluctuations and growth, staff changes and growth, and changes to and/or addition of educational programs. The dollar amount received each year is not sufficient to respond to the District’s long term capital needs.
Capital Projects Funds - Funds SummaryFiscal Year 2014-15
Funds Budget Descriptions Staff Amount
Fund 308 - 1998 Bond ProceedsNew construction other facilities - $ 9,050,000 Rehabilitation of existing schools - 4,500,000 1998 Bond issue administrative support 8.00 2,090,000 Construction management 21.00 4,870,000 Rehabilitation/modernization management/technology 1.00 44,355,000 Land acquisition - 135,000
Total - Fund 308 30.00 65,000,000
Fund 330 - Buildings and SitesOn and off site improvements - 35,000 Site purchases and leases - 375,000 Other expenditures - 340,000
Total - Fund 330 - 750,000
Fund 340 - Governmental Services TaxRefurbish/modernization crew 33.00 2,890,000 Refurbish and modernization projects - 680,000 Asphalt/drain/offsite - 1,000,000 Furniture and equipment - 150,000 Portables and trailers - 8,375,000 Other expenditures 3.00 8,105,000
Total - Fund 340 36.00 21,200,000
Fund 370 - Capital Replacement and MaintenanceStudent information system 4.00 1,600,000
TransfersTransfer to Debt Service Fund - 84,000,000
2014-15 Capital Projects budget 70.00 $172,550,000 Source: CCSD Facilities and Bond Financial Management
Capital Replacement (Fund 370)
Resources in the Fund are transfers from other funds made pursuant to a plan approved by the Board to provide equipment and maintenance for projects ordinarily not undertaken more frequently than once every five years. As the resources are provided from other funds, the dollar amount of the transfers is not sufficient to respond to the District’s long-term capital needs.

136 | Clark County School District
Capital Projects Funds - Expenditures SummaryFor Fiscal Years 2010-11 Through 2014-15
Description2010-11Actual
2011-12Actual
2012-13Actual
2013-14Estimated
Actual2014-15
Final BudgetRegular Programs
InstructionSalaries $517,439 $179,139 $175,710 $25,000 $50,000 Benefits 129,945 51,275 44,454 10,000 25,000 Purchased services 1,513,238 1,158,552 687,201 50,000 50,000 Supplies 30,070,840 3,147,648 5,029,679 735,000 750,000 Other 342 - - - -
Other Direct SupportSupplies 1,428,941 79,742 256,955 50,000 50,000
Undistributed ExpendituresInstructional Staff Support
Salaries - - 79,324 400,000 400,000 Benefits - - 27,087 200,000 200,000 Purchased services - - 592,280 1,225,000 1,000,000 Purchased services 1,463,005 - 487,246 1,000,000 1,000,000
Oper./Maint. Plant ServicesSalaries 1,712,761 1,288,627 2,325,744 2,500,000 2,500,000 Benefits 417,805 324,585 541,912 580,000 600,000 Purchased services 1,154,671 1,644,117 238,528 475,000 1,025,000 Supplies 386,278 278,387 550,793 2,650,000 2,000,000 Property - - - 925,000 750,000 Other 840 - 700 - -
Student TransportationProperty 18,653,104 - - 5,000 - Salaries 27,105 50,847 50,502 - 55,000 Benefits 9,693 19,485 19,029 - 25,000 Purchased services 238,484 68,541 107,448 65,000 130,000 Property - - 2,640 55,000 50,000 Other 1,368 - 11,013 10,000 15,000
Site ImprovementsSalaries 109,228 75,363 96,125 29,000 35,000 Benefits 6,935 12,093 21,491 11,000 15,000 Purchased services 9,343,921 26,100,354 12,715,308 5,120,000 5,525,000 Supplies 25,475 7,979 28,132 25,000 20,000 Other 5,614 34,792 50 - -
Architecture/EngineeringSalaries 4,209 - - 4,000 4,000 Benefits 1,067 - - 1,000 1,000 Purchased services 66,857 11,278 93,420 85,000 100,000
Building Acq. and Const.Salaries 469,807 1,438,770 845,019 750,000 565,000 Benefits 105,357 350,637 171,243 225,000 180,000 Purchased services 17,200,810 35,497,033 22,573,572 7,775,000 6,835,000 Supplies 688,524 753,741 2,667,551 2,120,000 4,300,000 Other 38,392 36,983 13,933 25,000 25,000
Building ImprovementsSalaries 5,595,973 4,271,379 3,102,910 1,210,000 1,000,000 Benefits 1,141,795 1,047,519 753,427 355,000 200,000 Purchased services 105,808,821 107,159,680 43,320,333 15,890,000 50,795,000 Supplies 3,437,834 1,266,171 2,511,120 495,000 1,025,000 Other 31,065 19,816 13,311 5,000 50,000
Other Facilities Acq. and Const. 5,296,226 4,447,519 4,105,447 4,070,000 7,200,000
Interfund transfers 145,994,345 112,552,980 112,681,421 95,465,000 84,000,000
Total expenditures and uses $353,098,114 $303,375,032 $216,942,058 $144,620,000 $172,550,000 Source: CCSD Facilities and Bond Financial Management

Fina
ncia
l Sec
tion
1372014-15 Comprehensive Annual Budget Report |
Capital Projects Funds - Summary of Revenues, Expenditures, And Changes In Fund BalanceFor Fiscal Years 2012-13 Through 2014-15
2012-13Actuals
2013-14Estimated Actuals
2014-15Final Budget 2013-14 Vs. 2014-15
Description Staff Amount Staff Amount Staff Amount Amount PercentRevenues and resources: Local revenues $109,660,956 $114,820,000 $118,865,000 $4,045,000 3.5 % Federal revenues 5,809,522 5,765,000 6,075,000 310,000 5.4 % Transfers from other funds 1,339,813 2,325,000 1,600,000 (725,000) (31.2)% Opening fund balance 392,493,638 292,361,871 270,651,871 (21,710,000) (7.4)% Total revenues and resources 509,303,929 415,271,871 397,191,871 (18,080,000) (4.4)%
Expenditures and uses: Salaries 112.00 9,253,814 69.00 7,693,000 70.00 9,484,000 1,791,000 23.3 % Employee benefits 2,665,099 2,267,000 3,026,000 759,000 33.5 % Purchased services 80,848,036 31,715,000 66,535,000 34,820,000 100.0 % Supplies 11,435,910 6,435,000 8,595,000 2,160,000 33.6 % Property and equipment 14,638 1,000,000 815,000 (185,000) (18.5)% Other expenditures 43,140 45,000 95,000 50,000 100.0 % Transfers to other funds 112,681,421 95,465,000 84,000,000 (11,465,000) (12.0)% Total expenditures and uses 216,942,058 144,620,000 172,550,000 27,930,000 19.3 %
Ending fund balance 292,361,871 270,651,871 224,641,871 (46,010,000) (17.0)%
Total Applications 112.00 $509,303,929 69.00 $415,271,871 70.00 $397,191,871 $(18,080,000) (4.4)%Source: CCSD Budget and Accounting Departments
Capital Projects Funds - Summary Of Budget CategoriesFor Fiscal Years 2012-13 Through 2014-15
2012-13 2013-14 2014-15General Ledger Accounts Description Staff
Actual Staff
Estimated Actual Staff Final Budget
5118080000 Administrative Specialist 2.00 163,514 - - - - 5118130000 Assistant Directors 1.00 95,701 - - - - 5118170000 Coordinators and Specialists 3.00 245,342 3.00 295,000 3.00 295,000 5118190000 Directors 4.00 311,947 4.00 495,000 4.00 495,000 5118855000 Coordinator I 1.00 50,241 1.00 90,000 1.00 90,000 5118860000 Coordinator II 6.00 446,728 1.00 95,000 1.00 95,000 5118865000 Coordinator III 11.00 1,311,965 6.00 550,000 6.00 550,000 5117010000 Analysts/Planners 2.00 125,112 - - - 55,000 5117030000 Classified - 10,769 - 235,000 - 310,000 5117400000 Data Management Specialist 5.00 344,920 2.00 145,000 2.00 145,000 5117405000 Systems Analysts/Specialists 1.00 95,048 1.00 100,000 1.00 100,000 5117430000 Telecommunications - 43,024 - - - - 5117650000 Secretarial and Clerical 15.00 821,886 10.00 515,000 11.00 565,000 5117725000 Classified Labor 30.00 2,381,070 3.00 2,121,000 3.00 1,729,000 5117800000 Grounds - - - 4,000 - - 5117805000 Maintenance 14.00 1,413,514 33.00 2,640,000 33.00 4,650,000 5117905000 Inspectors 17.00 1,393,031 5.00 405,000 5.00 405,000 5200000000 Employee benefits - 2,665,100 - 2,264,500 - 3,026,000 5300000000 Professional and techincal services - 5,164,193 - 3,395,000 - 10,105,000 5400000000 Property services - 75,627,260 - 28,353,000 - 56,430,000 5500000000 Other purchased services - 56,584 - - - - 5600000000 Supplies - 11,435,910 - 6,435,000 - 8,595,000 5700000000 Property/equipment - 14,637 - 985,000 - 815,000 5800000000 Other expenses - 43,139 - 32,500 - 95,000 5910000000 Interfund transfers - 112,681,421 - 95,465,000 - 84,000,000
Total Capital Budget 112.00 $216,942,058 69.00 $144,620,000 70.00 $172,550,000 Source: CCSD Facilities and Bond Financial Management

138 | Clark County School District
Capital Projects Funds - Projected BudgetsFor Fiscal Years 2014-15 Through 2017-18Fund Expenditure Appropriations by Major Object
Description2014-15Budget
2015-16Projected
2016-17Projected
2017-18Projected Growth Rate
Revenues:Real estate transfer taxes $ 22,175,000 $ 18,250,000 $ 18,500,000 $ 19,000,000 2.7 %Hotel room taxes 72,000,000 66,500,000 66,750,000 67,000,000 0.4 %Governmental services taxes 23,400,000 22,000,000 22,500,000 23,000,000 2.2 %Interest on investments 1,095,000 1,000,000 750,000 500,000 (33.3)%Other local revenues 195,000 50,000 50,000 50,000 - %Federal Revenues 6,075,000 6,075,000 6,070,000 6,070,000 - %Total Revenues 124,940,000 113,875,000 114,620,000 115,620,000 0.9 %
Expenditures:Salaries 9,484,000 3,000,000 3,000,000 3,000,000 - %Employee benefits 3,026,000 1,000,000 1,000,000 1,000,000 - %Purchased services 66,535,000 11,700,000 11,700,000 11,700,000 - %Supplies 8,595,000 5,255,000 5,255,000 5,255,000 - %Property and equipment 815,000 750,000 750,000 750,000 - %Other expenditures 95,000 245,000 245,000 245,000 - %Total Expenditures 88,550,000 21,950,000 21,950,000 21,950,000 - %
Excess (Deficiency) of Revenuesover Expenditures 36,390,000 91,925,000 92,670,000 93,670,000
Other Sources and (Uses):Transfers from other funds 1,600,000 - - - Transfers to other funds (84,000,000) (81,945,000) (81,955,000) (81,700,000)Total Other Sources and (Uses) (82,400,000) (81,945,000) (81,955,000) (81,700,000)
Opening Fund Balance - July 1 270,651,871 224,641,871 234,621,871 245,336,871
Ending Fund Balance - June 30 $224,641,871 $234,621,871 $245,336,871 $257,306,871
Fina
ncia
l Sec
tion
1392014-15 Comprehensive Annual Budget Report |
Proprietary Funds
The Proprietary Funds are comprised of the Food Services Fund (Enterprise Fund) and the Graphic Arts Center and Risk Management Funds (Internal Service Funds).
Enterprise Fund
An enterprise fund may be used to report any activity for which a fee is charged to external users for goods or services.
Food Services Fund
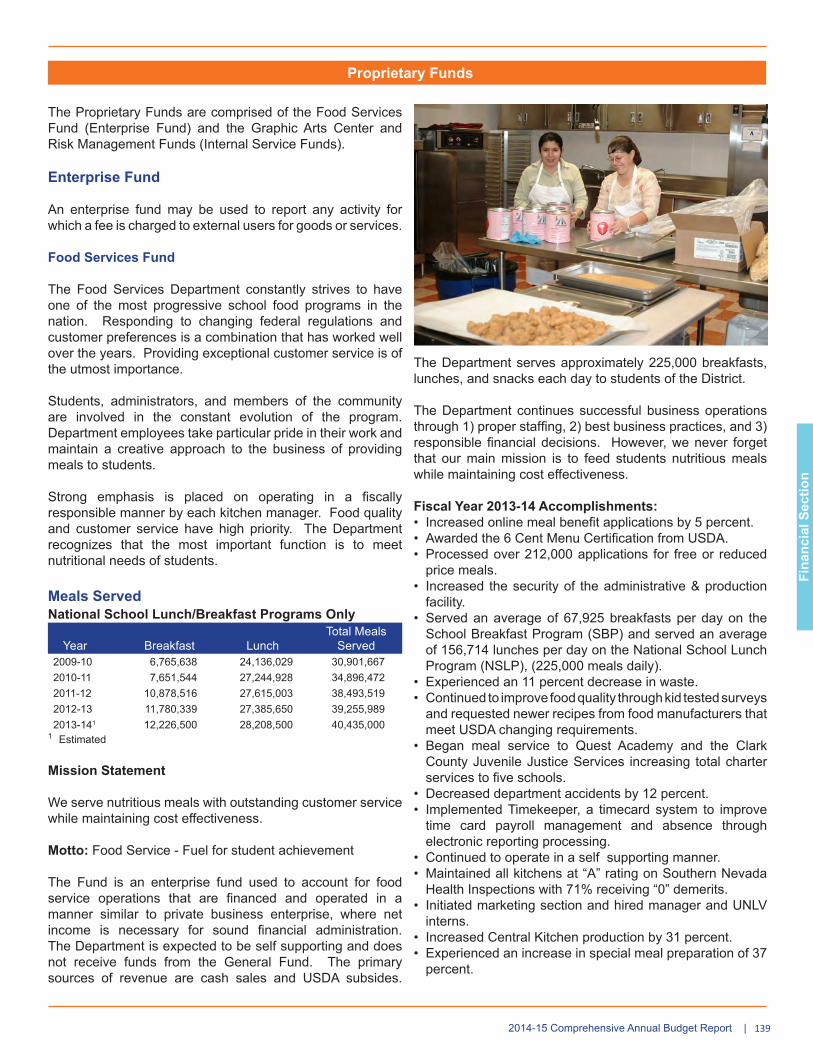
The Food Services Department constantly strives to have one of the most progressive school food programs in the nation. Responding to changing federal regulations and customer preferences is a combination that has worked well over the years. Providing exceptional customer service is of the utmost importance.
Students, administrators, and members of the community are involved in the constant evolution of the program. Department employees take particular pride in their work and maintain a creative approach to the business of providing meals to students.
Strong emphasis is placed on operating in a fiscally responsible manner by each kitchen manager. Food quality and customer service have high priority. The Department recognizes that the most important function is to meet nutritional needs of students.
Meals ServedNational School Lunch/Breakfast Programs Only
Year Breakfast LunchTotal Meals
Served2009-10 6,765,638 24,136,029 30,901,6672010-11 7,651,544 27,244,928 34,896,4722011-12 10,878,516 27,615,003 38,493,5192012-13 11,780,339 27,385,650 39,255,9892013-141 12,226,500 28,208,500 40,435,000
1 Estimated
Mission Statement
We serve nutritious meals with outstanding customer service while maintaining cost effectiveness.
Motto: Food Service - Fuel for student achievement
The Fund is an enterprise fund used to account for food service operations that are financed and operated in a manner similar to private business enterprise, where net income is necessary for sound financial administration. The Department is expected to be self supporting and does not receive funds from the General Fund. The primary sources of revenue are cash sales and USDA subsides.
The Department serves approximately 225,000 breakfasts, lunches, and snacks each day to students of the District.
The Department continues successful business operations through 1) proper staffing, 2) best business practices, and 3) responsible financial decisions. However, we never forget that our main mission is to feed students nutritious meals while maintaining cost effectiveness.
Fiscal Year 2013-14 Accomplishments:• Increased online meal benefit applications by 5 percent.• Awarded the 6 Cent Menu Certification from USDA.• Processed over 212,000 applications for free or reduced
price meals.• Increased the security of the administrative & production
facility.• Served an average of 67,925 breakfasts per day on the
School Breakfast Program (SBP) and served an average of 156,714 lunches per day on the National School Lunch Program (NSLP), (225,000 meals daily).
• Experienced an 11 percent decrease in waste.• Continued to improve food quality through kid tested surveys
and requested newer recipes from food manufacturers that meet USDA changing requirements.
• Began meal service to Quest Academy and the Clark County Juvenile Justice Services increasing total charter services to five schools.
• Decreased department accidents by 12 percent.• Implemented Timekeeper, a timecard system to improve
time card payroll management and absence through electronic reporting processing.
• Continued to operate in a self supporting manner.• Maintained all kitchens at “A” rating on Southern Nevada
Health Inspections with 71% receiving “0” demerits.• Initiated marketing section and hired manager and UNLV
interns.• Increased Central Kitchen production by 31 percent. • Experienced an increase in special meal preparation of 37
percent.

140 | Clark County School District
Fiscal Year 2014-15 Objectives:• Implement project to expand the Central Kitchen and
Warehouse facilities.• Begin contracted food service to Lincoln County School
District at their request.• Implement automated food service personnel system.• Increase the lunch participation rate by 5 percent (71,300
meals).• Increase the breakfast participation rate by 5 percent
(164,550 meals).• Purchase 53 foot emergency meal production & delivery
trailer.• Reestablish catering section.• Continue to upgrade equipment and vehicle/trailer fleet.• Establish guard force for the Tropical facility (Warehouse
storage and Central Kitchen preparation).• Establish real time food service purchasing section to
increase best business practices. • Maintain financial solvency.
The increase in net assets is a result of Food Services being awarded the 6 Cent Menu Certification, for complying with the meal requirements for the National School Lunch Program under the Healthy, Hunger Free Kids Act of 2010. There was also a shift to higher margin free meals from full pay meals reflecting the general economic conditions in the District during fiscal year 2014.
Food Services Fund - Summary of Income, Expenses, And Changes In Net AssetsFor Fiscal Years 2012-13 Through 2014-15
Food Service Description
2012-13 Actuals
Staff Amount
2013-14Estimated Actuals
Staff Budget
2014-15Final Budget
Staff Budget2013-14 vs. 2014-15
$ Change % ChangeOperating Income:
Sales $17,415,957 $19,380,000 $19,540,000 $160,000 0.8 %
Operating Expenses: Salaries 439.87 25,194,870 531.38 29,140,000 513.80 26,295,000 (2,845,000) (9.8)% Employee benefits 9,650,179 11,725,000 10,205,000 (1,520,000) (13.0)% Purchased services 4,612,141 4,320,000 4,325,000 5,000 0.1 % Supplies 61,283,203 64,470,000 65,940,000 1,470,000 2.3 % Depreciation 1,874,252 2,200,000 2,200,000 - - % Other expenses 2,592,253 2,820,000 2,980,000 160,000 5.7 % Total Operating Expenses 105,206,898 114,675,000 111,945,000 (2,730,000) (2.4)%
Operating Loss (87,790,941) (95,295,000) (92,405,000) 2,890,000 3.0 %
Nonoperating Income: Federal subsidies 86,588,858 90,500,000 91,400,000 900,000 1.0 % Commodities received 7,491,229 7,500,000 7,575,000 75,000 1.0 % State subsidies 919,538 450,000 450,000 - - % Investment income 12,335 100,000 135,000 35,000 35.0 % Other income (581,604) - - - - % Total Nonoperating Income 94,430,356 98,550,000 99,560,000 1,010,000 1.0 %
Net Gain (Loss) 6,639,415 3,255,000 7,155,000 3,900,000 (100.0)%Transfers from other funds 1,086,387 1,150,000 1,150,000 - - %Beginning Net Assets 49,777,776 57,503,578 61,908,578 4,405,000 7.7 %
Ending Net Assets 439.87 $57,503,578 531.38 $61,908,578 513.80 $70,213,578 $8,305,000 13.4 % Source: CCSD Budget and Accounting Departments

Fina
ncia
l Sec
tion
1412014-15 Comprehensive Annual Budget Report |
Internal Service Funds
Internal Service Funds are used to account for the financing of goods or services provided by one department or agency of a government to other departments or agencies on a cost-reimbursement basis. Budgeting for Internal Service Funds is designed to accumulate the total cost of operations for providing a particular service. Graphics Production services and Risk Management operations currently provide the activities for this fund.
Graphic Arts Center Fund
Mission
The mission of the Graphic Arts Center is to provide superior services and support for the students and employees of the District with a continuing commitment to improvement and education; to serve as responsible custodians of taxpayer funds ensuring maximum value for each dollar spent; and uphold the highest ethical and legal standards ensuring that all suppliers and customers are treated equally and fairly.
Services
The Center is comprised of several sections including Design, Printing, Copying, and Forms. The Printing and Copying sections utilize large graphic machinery, including high-speed copiers and multi-color presses, to serve the District’s requirements.
Fiscal Year 2013-14 Accomplishments:• Initiated more cost efficient equipment configuration• Developed new product lines• Consolidated operations• Increased usage of online ordering tool• Reduced salary expense to align with lower revenues
Fiscal Year 2014-15 Objectives:• Install more capable, lower cost copy center equipment• Identify new capabilities to generate customer savings • Continue staff development in all areas• Expand online direct-to-print offerings• Continue to monitor income and expenses and adjust as
needed
Performance Measures 2011-12 2012-13 2013-14Copy center income $ 764,607 $ 716,043 $ 657,159Printing income 766,052 657,760 596,526Graphic service income 11,760 20,640 23,640Color copy income 185,927 226,118 191,132Subcontracting income 43,396 104,137 110,170Art and darkroom Income 143,158 115,527 100,741
Total income $1,868,281 $1,853,600 $1,679,368
Salary expenses $1,329,314 $1,125,294 $949,217
Risk Management Fund
Mission Statement
The mission of Risk Management is to effectively protect the District’s human, financial, and physical assets and resources from the consequences of losses.
Services
The Department is responsible for identifying the risk exposures of the District and recommending the most efficient and cost effective methods for handling those exposures. Methods include transferring risk through the purchase of insurance; assisting other departments with loss control; and administering the self-insured claims for property damages, public liability, motor vehicle liability, school board legal liability, workers’ compensation, boiler and machinery, and crime.
The Department continued to provide the following services in accordance with its mission using the most efficient and cost effective methods:
• Providing loss control services for other departments, including risk assessments and safety training
• Administering the self-insured claims for property damages, public liability, motor vehicle liability, school board legal liability, workers’ compensation, boiler and machinery, and crime
• Transferring risk though the purchase of insurance• Collaborating with local, State, and federal agencies to
ensure compliance with all applicable safety and health requirements
Fiscal Year 2013-14 Accomplishments:• Collaborated with the Purchasing Department to request
proposals from prospective suppliers for the workers’ compensation pharmacy benefit management program, managed care organization, and medical bill review services and negotiated the terms of a new agreements
• Reviewed new industrial insurance laws enacted during the 2013 Nevada Legislative Session and made revisions to current procedures; including, but not limited to revising forms and informing employees of changes
• Further developed the safety assessment tracking portion of the RMIS, including a location hierarchy for District sites that is current and all inclusive
• Coordinated the merger of Environmental Services and Risk Management staff and functions to reduce redundancies and capture information more efficiently
• Began work on providing a more effective return-to-work program for employees who have been injured on the job
• Continued the development of the online chemical inventory system to include other areas within schools

142 | Clark County School District
Fiscal Year 2014-15 Objectives:• Convert the self-administered claims management
program to a Third Party Administrator for the processing of all workers compensation and liability claims
• Complete the integration of the environmental duties into the Department’s standardized procedures and become the Risk & Environmental Services Department
• Collaborate with the Purchasing Department to request proposals from prospective suppliers for the insurance broker services and investigate other methods of risk financing
• Integrate historical information from the environmental services unit into RIMS and eliminate numerous paper records
• Work with the new Third Party Administrator and Human Resources to develop a more effective return-to-work program for employees who have been injured on the job
• Launch a District-wide campaign to inform employees of changes to the administration of the workers compensation program
Internal Service Funds - Summary Of Income, Expenses, And Changes In Net AssetsFor Fiscal Years 2012-13 Through 2014-15
Internal Service Description
2012-13Actuals
Staff Amount
2013-14Estimated Actuals Staff Budget
2014-15Final Budget
Staff Budget2013-14 vs. 2014-15
$ Change % ChangeOperating Income: Local sources $16,751,869 $17,830,000 $17,830,000 $ - - %
Operating Expenses: Salaries 53.00 3,236,860 76.25 4,010,000 92.25 5,535,000 1,525,000 38.0 % Employee benefits 1,207,078 1,525,000 2,190,000 665,000 43.6 % Purchased services 4,066,128 4,575,000 7,335,000 2,760,000 60.3% Supplies 824,057 765,000 775,000 10,000 1.3 % Property - 100,000 100,000 - - % Depreciation 133,088 45,000 45,000 - - % Other expenses 11,424,992 14,730,000 14,190,000 (540,000) (3.7)%
Total Operating Expenses 20,892,203 25,750,000 30,170,000 4,420,000 17.2 %
Operating Income (Loss) (4,140,334) (7,920,000) (12,340,000) (4,420,000) (55.8)%
Nonoperating income 33,441 140,000 185,000 45,000 32.1 %
Beginning Net Assets 24,420,218 20,313,325 12,533,325 (7,780,000) (38.3)%
Ending Net Assets 53.00 $20,313,325 76.25 $12,533,325 92.25 $378,325 $(12,155,000) (97.0)%Source: CCSD Budget and Accounting Departments
Performance Measures 2011-12 2012-13 2013-14Number of Claims Property/Liability count 1,535 1,491 1,522 Workers’ Compensation count 1,412 1,455 1,403Total Insurance PremiumsProperty, Liability, and Workers’ Compensation $2,429,456 $2,448,503 $2,471,987Claim Count Ratio Property/Liability per $1,000 Premium 0.63 0.62 0.62 Workers’ Compensation per $100,000 10.86 10.21 10.54Third-Party Recoveries Property/Liability $235,918 $178,533 $219,282 Workers’ Compensation $158,755 $227,396 $187,763Managed Care Savings Workers’ Compensation $1,337,915 $1,978,550 $1,723,007
The decrease of net assets is a result of an anticipated increase in risk assessment services and the purchase and implementation of the student health office software program and related equipment. The Department, in its expanded role, also has added staffing increases for risk control positions, including safety assessments and training, and environmental compliance operations transferred from the General Operating Fund. It is anticipated that insurance premiums will need to be increased during 2014-15.