OTC 17826 rev8
13
Copyright 2006, Offshore Technology Conference This paper was prepared for presentation at the 2006 Offshore Technology Conference held in Houston, Texas, U.S.A., 1–4 May 2006. This paper was selected for presentation by an OTC Program Committee following review of information contained in an abstract submitted by the author(s). Contents of the paper, as presented, have not been reviewed by the Offshore Technology Conference and are subject to correction by the author(s). The material, as presented, does not necessarily reflect any position of the Offshore Technology Conference, its officers, or members. Papers presented at OTC are subject to publication review by Sponsor Society Committees of the Offshore Technology Conference. Electronic reproduction, distribution, or storage of any part of this paper for commercial purposes without the written consent of the Offshore Technology Conference is prohibited. Permission to reproduce in print is restricted to an abstract of not more than 300 words; illustrations may not be copied. The abstract must contain conspicuous acknowledgment of where and by whom the paper was presented. Write Librarian, OTC, P.O. Box 833836, Richardson, TX 75083-3836, U.S.A., fax 01-972-952-9435. Abstract The interest of towing techniques for the installation of flowlines and risers has greatly increased in recent years, particularly for deep-water field developments. Surface tow presents particular interest although it is more delicate to engineer compared to other tow methods. This paper presents experimental data and feed back from surface towing trial operation performed by Acergy. Numerical models of tow operation can now be developed through dedicated software to allow engineers to better assess the behavior of the pipeline. During the Girassol project the limitations identified by engineering analysis were compared with data collected on field during operations to further improve the knowledge of the tow method and propose innovative and competitive alternatives to existing methods. A new surface towing technique adapted for long pipeline is presented which uses a wave configuration (patent pending). The paper also identifies the limits of application of the surface wave tow method in terms of pipe diameter, flowline length, environmental conditions, etc. The fabrication and overall costing aspects are addressed and compared with other pipe laying techniques. Introduction For the last three decades, the towing techniques have been used for large diameter carrier pipe denoted as bundles (including production lines, service lines, umbilicals etc.) on field development with constraining flow assurance requirements /1/2/3/4/. In recent years, the interest of towing techniques for the installation of flowline and risers has greatly increased, particularly for deep-water field development. Basically the reasons for selecting a tow method as opposed to a conventional laying ship or barge is due to: • either fabrication requirements where the pipe cross section consists of the use of a bundle design, 1 Previously Stolt Offshore • or economic reasons in the case the field development location is remote and the installation scope does not justify the mobilisation of a conventional laying spread /5/. Deep water field development requires the utilisation of a dedicated installation spread designed to cope with the high tensions and the large amount of permanent work to be transported and installed. This represents a substantial investment for the contractor and the utilisation of such spreads also has to be shared between several regional markets. As a result projects developing deep-water fields in remote areas generally account for high mobilisation cost to bring appropriate installation spread in the region. Also there are increasing number of subsea fields with shorter flowlines (less than 20km) making the use of towed pipelines more attractive. Other positive issues include: the recent developments in engineering software and design codes allows better evaluation of pipe behavior and fatigue damage evaluation; recent deepwater operations allow to reduce and manage the risks successfully and effectively, and high performance DP tugs are available world wide. Therefore the deep water and ultra deep water market and associated constrains and recent technology development provide the motivation to revisit towing installation techniques which have a high local content as an alternative to more conventional installation techniques. The development of the Girassol field (bundled riser and production flowlines) /1/ has proved that towing techniques were still technically and commercially competitive compared to conventional surface transportation and installation spread even in a deep water environment. The successful installation of the Hyperflow Riser Towers and production bundles at the Girassol field, combined with the results of experimental data from the early sixties, motivated the Acergy engineering team to further improve the knowledge of the tow method and propose innovative and competitive alternatives to existing methods. Acergy developed a new surface towing technique (patent pending), which uses a wave configuration and allows a better and more flexible control of the line during the tow. The fabrication and overall aspects are addressed and compared with other pipe laying techniques. Surface tow through an experimental approach. The behavior of the pipe when floating on surface of an ocean is difficult to model accurately without the assistance of sophisticated software operated from high performance computer. Those softwares did not exist in the sixties when the first surface towing operations were considered for pipeline installation. At the time engineers had to perform trials to OTC 17826 Development of Towing Techniques for Deep Water Flowlines and Risers Vincent Alliot, Haiyan Zhang and Dominique Perinet, Acergy 1 ; and Sanjay Sinha, Chevron Corporation
Transcript of OTC 17826 rev8

Copyright 2006, Offshore Technology Conference
This paper was prepared for presentation at the 2006 Offshore Technology Conference held inHouston, Texas, U.S.A., 1–4 May 2006.
This paper was selected for presentation by an OTC Program Committee following review ofinformation contained in an abstract submitted by the author(s). Contents of the paper, aspresented, have not been reviewed by the Offshore Technology Conference and are subject tocorrection by the author(s). The material, as presented, does not necessarily reflect any positionof the Offshore Technology Conference, its officers, or members. Papers presented at OTC aresubject to publication review by Sponsor Society Committees of the Offshore TechnologyConference. Electronic reproduction, distribution, or storage of any part of this paper forcommercial purposes without the written consent of the Offshore Technology Conference isprohibited. Permission to reproduce in print is restricted to an abstract of not more than 300words; illustrations may not be copied. The abstract must contain conspicuous acknowledgmentof where and by whom the paper was presented. Write Librarian, OTC, P.O. Box 833836,Richardson, TX 75083-3836, U.S.A., fax 01-972-952-9435.
AbstractThe interest of towing techniques for the installation offlowlines and risers has greatly increased in recent years,particularly for deep-water field developments. Surface towpresents particular interest although it is more delicate toengineer compared to other tow methods. This paper presentsexperimental data and feed back from surface towing trialoperation performed by Acergy. Numerical models of towoperation can now be developed through dedicated software toallow engineers to better assess the behavior of the pipeline.During the Girassol project the limitations identified byengineering analysis were compared with data collected onfield during operations to further improve the knowledge of thetow method and propose innovative and competitivealternatives to existing methods. A new surface towingtechnique adapted for long pipeline is presented which uses awave configuration (patent pending). The paper also identifiesthe limits of application of the surface wave tow method interms of pipe diameter, flowline length, environmentalconditions, etc. The fabrication and overall costing aspects areaddressed and compared with other pipe laying techniques.
IntroductionFor the last three decades, the towing techniques have beenused for large diameter carrier pipe denoted as bundles(including production lines, service lines, umbilicals etc.) onfield development with constraining flow assurancerequirements /1/2/3/4/. In recent years, the interest of towingtechniques for the installation of flowline and risers has greatlyincreased, particularly for deep-water field development.Basically the reasons for selecting a tow method as opposed toa conventional laying ship or barge is due to:• either fabrication requirements where the pipe cross
section consists of the use of a bundle design,
1 Previously Stolt Offshore
• or economic reasons in the case the field developmentlocation is remote and the installation scope does notjustify the mobilisation of a conventional laying spread/5/.
Deep water field development requires the utilisation of adedicated installation spread designed to cope with the hightensions and the large amount of permanent work to betransported and installed. This represents a substantialinvestment for the contractor and the utilisation of such spreadsalso has to be shared between several regional markets. As aresult projects developing deep-water fields in remote areasgenerally account for high mobilisation cost to bringappropriate installation spread in the region. Also there areincreasing number of subsea fields with shorter flowlines (lessthan 20km) making the use of towed pipelines more attractive.Other positive issues include: the recent developments inengineering software and design codes allows better evaluationof pipe behavior and fatigue damage evaluation; recentdeepwater operations allow to reduce and manage the riskssuccessfully and effectively, and high performance DP tugs areavailable world wide. Therefore the deep water and ultra deepwater market and associated constrains and recent technologydevelopment provide the motivation to revisit towinginstallation techniques which have a high local content as analternative to more conventional installation techniques.
The development of the Girassol field (bundled riser andproduction flowlines) /1/ has proved that towing techniqueswere still technically and commercially competitive comparedto conventional surface transportation and installation spreadeven in a deep water environment. The successful installationof the Hyperflow Riser Towers and production bundles at theGirassol field, combined with the results of experimental datafrom the early sixties, motivated the Acergy engineering teamto further improve the knowledge of the tow method andpropose innovative and competitive alternatives to existingmethods. Acergy developed a new surface towing technique(patent pending), which uses a wave configuration and allows abetter and more flexible control of the line during the tow. Thefabrication and overall aspects are addressed and comparedwith other pipe laying techniques.
Surface tow through an experimental approach.The behavior of the pipe when floating on surface of an oceanis difficult to model accurately without the assistance ofsophisticated software operated from high performancecomputer. Those softwares did not exist in the sixties when thefirst surface towing operations were considered for pipelineinstallation. At the time engineers had to perform trials to
OTC 17826
Development of Towing Techniques for Deep Water Flowlines and RisersVincent Alliot, Haiyan Zhang and Dominique Perinet, Acergy1; and Sanjay Sinha, Chevron Corporation

2 OTC 17826
confirm the stress level and fatigue damage generated by actionof the surface sea motion.
Acergy performed or participated, from 1960 to 1975 in aseries of full-scaled tests aiming at better understanding theeffect surface towing operation on a pipe.
The deep water tow operation for Saharan Natural Gas(1960-1962).
The Saharan project aimed to lay a gas export pipelineacross the Mediterranean Sea between Mostaganem in Algeriaand Cartagena in Spain. Due to the water depth (2500m) andthe length of the laying route (70km), this project wasextremely challenging at the 1960s. (Figure 1).A fabrication yard was set up at the location of Djebel Diss andthe testing program covered the following operation to validatethe method:1. Launching of pipe stalks from fabrication facilities to
shallow water.2. Towing from shallow water to site and upending of first
end.3. Surface tie-in connection between two pipeline sections
(Figure 2 and Figure 3).4. Laying and control of the pipe along a curved route.5. Controlling and descending of the pipeline with the
adjustable buoyancy elements.6. Reversibility of the laying operation.
The submerged weight of the pipeline with buoyancymodule attached was adjusted to be negatively buoyant of about20N/m. The length of the pipe sections were 3600m. Themeans and the spreads used at the time were extremely basic:two 1200 HP tugs for the tow operation, the radio positioning“Rana” to cover the operations, the tie-in ship Salvor equippedwith lateral thrusters to provide a better control.
During several months of testing the team did notexperience any loss or damage of the pipe or installationequipment. The proposed tow method (Figure 3) and pipelineassembly were validated successfully.
Surface tow trials in the North Sea (November-December1975).
In 1975, the French associative research group Pipe AcierProfond conducted a full-scale test. The objectives were toprove the feasibility of such operations in rough sea states andto correlate full-scale test measurements with theoreticalresults. Two configurations were tested: surface tow andsubsurface conditions.
The pipe used for the trials was a X65 16” OD with a wallthickness of 15.88mm. The string was 1000m long and wasfitted with 50 buoyancy elements, 16 " diameter, 10 m longeach: Half of the floats was attached along the pipe for thesurface condition and released in a sling attach configurationfor the suburface application. The pipe was fabricated in thearea of Cromarty Firth (disused Evanton airport, nearInvergordon-Inverness). The tow operation took place in thearea of Moray Firth.
The surface tow test was conducted from the 23rd to the 29th
of November 1975 in sea states reaching Hs=4m at a maximumspeed of 6 knots. (Figure 4)
The subsurface tow test was conducted from the 1st ofDecember to 6th of December 1975 in sea state reaching Hs=8mand wind of 60knots.
The pipe string was equipped with an instrumentationsystem for the measurement and record of 32 parametersincluding strain gauges for horizontal and vertical bending, loadcells for towing force and forces on the floats, accelerometers.Wave was also measured and spectra were determined.
The collection and review of data concluded to thefeasibility study both for surface and subsurface operations.The stress level was in the range of those calculated.
Deep Water Tow Operation for Girassol Project (2001)The Girassol field development, offshore Angola in 1,400m ofwater, has stringent operating requirement due to flowassurance and flexibility requirements. The established solutionwas the selection of freestanding Hyperflow Riser Towers,insulated flowline bundles and mid-depth export system. Theseinnovative concepts required substantial development,qualification and testing throughout the project. The installationwas a critical part, and the lessons learnt are useful referencesfor other deepwater development.
Towing of the Hyperflow Riser Towers:The Hyperflow Riser Towers were towed on the sea surface
600km from the Lobito yard to the Girassol site. Once onlocation, they were upended, connected to the riser toweranchor.
Towing the structure in a buoyant state had been decidedfor safety reasons and to ensure the reversibility of theoperation at any stage of the installation program. The towingspread involved the DP lead tug Seaway Explorer and the trailtug Seacore Voyager, with the American Pride as guard andassistance vessel during the towing operation.
An extensive testing program was performed before thetowing to validate the towing engineering:
• Towing tests at tow tank facilities (Figure 5).• Upending tests at military facilities in south of France.• Full-scale tower tow test in Scotland to confirm that the
external skin of the tower did not peel off.• Trial surface tow test with Explorer and Seacor
Voyager to validate vessel control procedure and trainoffshore personnel.
The trail towline consisted of a ballast chain, whichcontrolled the depth of the Hyperflow Riser Tower buoyancytank and act as a spring to a constant holdback tow tension. Asafety surface buoy is also attached to the tower to prevent itfrom descending too deep in case of accidental flooding or lossof the ballast chain by the trail tug.
After the Hyperflow Riser Tower had left Lobito Bay, thebuoyancy tank was submerged to a depth of –50m from surfaceby progressively deploying the ballast chain from the trail tugto reduce the stress generated by waves (Figure 6).
Two motion recording units (MRU) were installed on thefirst Hyperflow Riser Tower (one at the foot extremity and theother one 100m from the extremity) to collect motion dataduring the towing operation. American Pride, equipped with aDatawell buoy, recorded the seastate conditions so that theactual structure fatigue damage ratio could be estimateddirectly on site during the towing operation. Tension meters

OTC 17826 3
installed onboard recorded both trail and lead tensions. Anacoustic transponder with a depth sensor monitoredcontiguously transmitted the depth of the buoyancy tank to thetrail tug. The 600km-tow route was carefully engineered usingfatigue simulator software developed specifically for thatpurpose.
The lead tug towed the structure using 80%-90% of itspower at a tow speed, which varied from 3.5knots (kt) to 4.2ktand a maximum dynamic tension reaching 1700kN. The trailtug applied a constant back tension of 300kN.
The tow master and ship captains were monitoring thebehavior of the Hyperflow Riser Tower and towing vesselsusing a tug management system and Differential GlobalPositioning System installed on board each ship. The convoybehaved extremely well during the whole towing operation andboth captains did not experience any problems controlling theirrespective routes.
The three towing operations were carried out successfullywithout structures damage reported after inspection. Thecumulative fatigue damage was well below the targeted limit.
Towing and fatigue analysis for the Hyperflow RiserTowers:
The towing and fatigue analysis is an area where closeinterface and cooperation between design and installationengineering is essential. A 3-D numerical model using Orcaflexsoftware was first developed to evaluate the fatigue damagegenerating by environmental conditions.
A test tank program was carried out next on a scale modelto verify and validate the numerical analysis. Both approachesconfirmed the behavior of the tower in towing conditions.
Fatigue damage response amplification operators (FatigueRAOs) were thus established. Weather statistics in Angola wereanalyzed to predict a typical scenario based on wave occurrencefor yearly seastate conditions. The limiting seastate wereidentified in terms of wave incidence (Figure 7 and Figure 8).
A software simulator was developed to be used to optimizethe towing routes, provide a live structure fatigue damage ratioduring the operation, and also confirm the weather window.
The as-built fatigue ratio was finally calculated byinputting the seastate and tow conditions into the simulator.After the tow, the data collected at MRU was analyzed. Thecomparison showed that the motion along the Hyperflow RiserTower was similar and the fatigue damage induced was lessbased on MRU data that those predicted by simulator. (Figure9).
Resonance phenomenon of a long string pipe towedon surface
Resonance phenomenon is resulting from the amplifiationof a periodic " quasi-static loading “, when the naturalfrequency of the structure is close of the loading period.
In the case of a pipe string, there is an infinite possibilityfor the natural modes of vibration .The natural mode number'n' is defined by
The shape of the vibration Xn(x) :
Xn(x) = sin(n.π .x/L ) = sin(π .x/Ln)
With Ln equal to half of wave length: Ln=L /n
The natural period Tn
Tn = 2.L2 /(n2/π) EIm / =2.Ln2/π EIm /
In the above formula, m is the total unit mass including ownmass of pipe and of floats cumulated with the hydrodynamicadded mass. The value of m is typically 600 kg/m for a 16 "pipe and 5000 kg/m for a tower. EI is the bending stiffness, inthe range of 90000 kN.m2 for a 16 " pipe and 500 000 kN.m2for a tower. In the case of a 1000m string the first naturalperiod is in the range of half an hour for both cases, which isobviously well above potential wave periods. The naturalmodes with a frequency in the range of wave frequencies arebetween the tenth and the twentieth modes.
The resonance may be an issue only if the quasi-staticloading is not too small. Such cases occur when the wavelength Lw. is equal to wave length of the mode n with samefrequency, in the case where wave direction is in line with pipestring The resonance period Tr is equal to both natural periodand wave period with following conditions.
Lw = 2Ln
Lw = gTr2/(2.π)Ln 2= π.Tr/2 . mEI /The condition 2.Ln = Lw is obtained if
Tr = 2.π. 6 4 )./( gmEIWith here above cases the resonance critical period Tr isbetween 9 and 10 s.In the case where there is an angle θ between pipe direction andpipe string (Figure 10), the condition Lw = 2.Ln has to bemodified in
Lw = 2.Ln.cos(θ)
The impact of the angle on the critical resonance period is
Tr = 2.π .6 44 )./()(cos. gmEI θ
Main parameter for the amplification factor between thequasi-static and dynamic responses is the damping. Theevaluation of the hydrodynamic part of this damping remains amajor issue.
A New Surface Tow Technique – Surface Wave TowConfiguration
Based on operation experiences and considerationspresented above, Acergy has developed a new towconfiguration – Surface Wave Tow configuration (patentpending). This approach is to keep the pipe surface or sub-surface most of the time, but can cope with a variety of waterdepths as well (Figure 11): e.g. off-bottom tow in very shallowwater.
The surface wave tow eliminates the need for applying apermanent tension during the tow and thus allows laying thepipe along a curved route. Numerical simulations have shown

4 OTC 17826
that a pipe length of up to 10km could be towed either onsurface or subsurface with only a lead and trail tugs. Pipes of20km could also be towed in a similar manner with theassistance 3 additional guard vessels. Regarding pipe fatiguedamage and marine traffic risk during surface tow, the Girassolexperience has demonstrated that the numerical models canpredict pipe behavior relatively accurately (except forresonance phenomenon) and the marine activities can bemonitored by the guard vessels assistance.
Tow Arrangement DesignThe pipe is made globally positively buoyant, thus the bollardpull requirement is reduced. The buoyancy modules aredistributed along the pipeline as positively and negativelybuoyant sections to give an undulated wave shapeconfiguration. This makes the buoyancy adjustment operationmuch easier compared to those in a control depth tow. A leadtug provides the bollard pull required for the tow, a trail tugmaintains the back tension required for controlling thecurvature of the pipeline, guard vessels adjust the pipeelevation by means of a ballast chain attached (Figure 12).Adjusting both extremities and intermediate elevations alsoallows the controlling the pipe curvature and for shorterpipelines this can be done without the assistance of the guardvessels. Guard vessel can be disconnected from the pipe andintervene rapidly on both side of the pipe. A tug radiomanagement system assists the tow master in co-ordinating theconvoy. In case of lateral current the tow heading has to beadjusted and aligned with the vector combining towing speedand lateral current as shown in Figure 13.
During laying one pipe extremity is deployed within atarget area using a deadman anchor and the pipe is laid with anS shape the buoyancy installed along the pipe is acting as astinger to support the line. Tugs are positioned to orientate theline and take into consideration the subsea current profiles.
Physics of A Pipeline Towing SystemAs all tow systems, Surface Wave Tow configuration
consists of a pipeline, chains, towline wires, and tow vessels(lead tug, trail tug etc). The success of the tow operationdepends on the careful and accurate consideration of thebehavior of each component and its interaction with betweeneach other under environmental conditions.
When the towed pipeline gets very long (>5m), the risk ofdamage increases because they are directly exposed toenvironmental loading. The physics of a towed pipeline incurrents and waves is extremely complex. Statically thereexists a significant structural nonlinearity, dynamically acombination of quadratic nonlinear hydrodynamic drag forceand an usual near-tangential inertial force. Moreover, these arefurther complicated by the horizontal/axial dynamic interactionof the pipeline, tow wires and tow vessels, especially when thetowed pipeline is long, and tow wire is flexible, the mass of thetowing vessels is comparable with that of the pipeline.
For a traditionally long pipeline tow systems, the responsesof the pipeline is very sensitive to the longitudinal, or surge,component of excitation due to its geometric characteristics. Inorder to soften these phenomena, flexible tow wire could beused. For the Surface Wave Tow system, the wave shapes builtin the configuration play a very favorable role in the axial
dynamics by absorbing some portion of the dynamic forceexcitation from the tow vessels.
Although a towed pipeline experiences large deformationcompared to its diameter, this deformation can be assumed tobe small compared to its global dimensions such as pipe lengthor maximum sagging. Under this small deflection assumption,the governing equations for a slender beam element (Figure 14and Figure 15) is:
),('')(
)('')4(
)4(
txfTyyEIycymm
xfTyyEI
yza
yz
=−+++
=−
&&& (1)
where:EI : bending stiffnessT : line tensionm : mass per unit length
2
41
Dma ρπ=
c : a damping coefficient of the pipe)(xf y : a static force
),( txf y : a dynamic forceThe static force )(xf y consists of pipe self weight, drag
forces, hydrostatic pressure force on the pipeline. The dynamicforce ),( txf y is made of drag and inertia forces on the pipe.The hydrostatic pressure forces on curved pipe can becalculated by:
( ) ( )( )[ ]( ) ( )( )[ ] θθθθθ
θθθθθddArArrAPAPdFddArArrAPAPdF
ooiiooiiy
ooiiooiix
cossincossinsincos⋅−−+−=⋅−−+−=
(2)where:θ : angle from x-axis to the axis of a pipe elementiP : internal hydrostatic pressure
oP : external hydrostatic pressure
iA : pipe internal cross section area
oA : pipe external cross section area
ir : specific weight of pipe internal fluid
or : specific weight of pipe external fluidr : specific weight of fluid
The extended form of Morison’s equation can be used tocalculated the hydrodynamic drag and inertia forces:
( ) ACvvaDCaDF drrraww ρ21
+⋅⋅+⋅= (3)
where:wF : wave forceD : mass of fluid displaced by the bodywa : fluid acceleration relative to earth
aC : added mass coefficient for the body
ra : fluid acceleration relative to the bodyr : density of waterrv : fluid velocity relative to the body
dC : drag coefficient for the body

OTC 17826 5
A : drag areaOffshore engineers usually consider only the component of
the current normal to the pipeline for the calculation of dragforces. This is quite reasonable for most common offshorestructures such as risers since the forces due to a tangentialcomponent are negligible compared to those due to a normalone. In the case of towed pipelines, however, circumstances aretotally different. When the towed pipe is long and experiencehigh tow speeds with a small angle of attack, the total frictionaldrag force due to tangential component of a current is quitelarge and it directly influences the structural behavior of thepipeline in the forms of tow tension. Also it contributes to themaximum tow wire tension, which is critical in selecting thetow vessels with proper bollard pull capabilities.
From the governing equations of the pipelines and themechanical property of the towlines, three principalnonlinearities can be identified:
1. The deformation (curvature) – dependent tension ofpipelines.
2. The nonlinear drag force on pipelines, proportional tothe square of the relative velocity between a pipelineand fluid.
3. The nonlinear tension-axial deformation of towlines.
Numerical Assessment of Surface Wave TowConfiguration
Although an analytical solution of the governingequilibrium equations of the pipeline is possible if manysimplifications are made, as a result of these simplifications, thesolution lacks accuracy and practical applicability. Therefore anumerical technique must be utilised, which is the mostpowerful and accurate technique for non-linear analysis. Itallows calculation of non-linear drag forces due to relative pipeand fluid motions and modification of the stiffness matrixaccording to instantaneous system response on the basis ofgeometric non-linearity.
In order to investigate the feasibility of the Surface WaveTow configuration, numerical analysis using Orcaflex softwarewas performed to ensure the pipelines have acceptable levels ofdeformations and stress due to forces induced by currents,waves and surface vessel motion during the tow operation. TheSurface Wave Tow system was also examined for thesensitivity and limits of applications in terms of keyparameters.
Surface Wave System Computation ModelFour types of pipeline (20km) were studied for typical tow
operations using Surface Wave Tow configuration. The pipedata and the net buoyancy required are presented in Table 1.The pipelines are design for 1800m-2500m water depth withOD of 14”-24”. Buoyancy modules were distributed along the20km of pipe to provide 3 positively buoyant sections of about-55N/m and 4 negatively buoyant sections of about 55N/m. Thebuoyancy is assumed to be syntactic foam made ofmicrospheres, macrospheres and epoxy matrix. The specificgravity of the foam is taken as 460kg/m3, based on a deep-water project in West Africa. A preliminary float design ispresented in Figure 16. The guideline of designing the floatwas considered as:
• Minimal extra drag force introduced by float on thepipeline
• Deep water pressure resistance for recovery and reuse• ROV friendly• Maximum float group spacing allowed by pipe stress
level for maximum offshore installation/release rate• Clamp attachment without welding requirement on the
pipeline.Tow convoy was included in the model and vessel motion
was simulated by RAO data of the lead/trail tugs and guardvessels respectively. The tow wires were assumed to be a 6x19rope with 3” wire core.
Numerical Simulation ResultsDynamic simulations were performed to check the pipeline
responses under hydrodynamic loading due to wave/current,towing vessel motion etc. Main results from analysis andoperational parameters for a typical tow operation are presentedin Table 2. Figure 17 and Figure 18 demonstrate the 20” OD(1.025”WT) pipeline configuration profile (vertical and lateral)during the towing operation under different heading angles.Note that the scales in the figures are different: the pipelinelength in 5000m, while the vertical and lateral in 50m. Figure19 through Figure 21 give the tension, stress and bendingmoment distribution alone the pipeline during the towing.
The bollard pull requirement for the towing operation wasfound to be proportional to the pipe submerged weight. Pipes#3 (20”) and #4 (14”) had similar submerged weights, so werethe maximum pipe tension levels during the tow. Pipe #2 (20”1.025”WT) had the heaviest submerged weight (1019N/m),which led to highest tow tension (>200te).
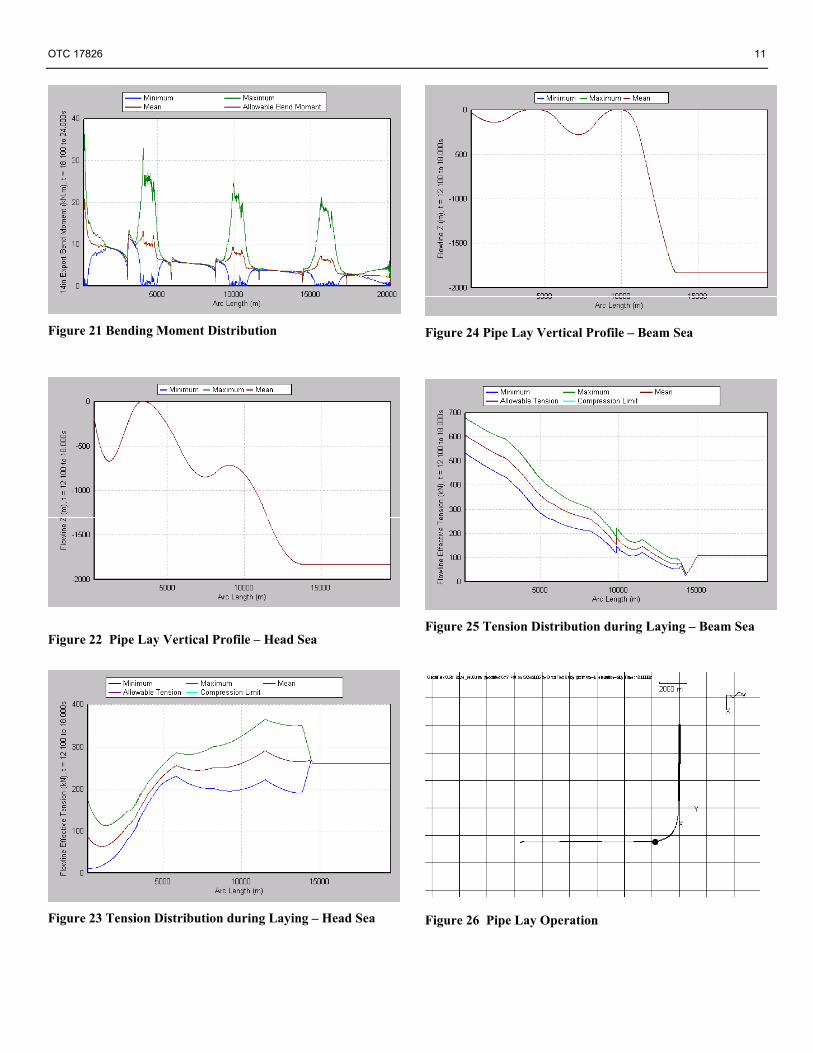
When the pipeline was subject to lateral current, it wouldmove near to the horizontal plane and also depart from itsstraight path. The beam sea condition would generate thelargest lateral displacement, stress and tension level in the pipe(Table 2, Figure 18).
When the pipe is under mean static condition (no current),the pipe vertical profile is uniformly distributed along the20km, with the maximum vertical displacement in the middlesags. When the towing started and the pipe was movingforward, large vertical displacement would always accumulatedtowards the end (last sag) of the pipeline. The head seagenerated largest displacement (Figure 17).
While the pipe sections close to the lead tug experiencedhighest tension and von Mises stress level, the section close tothe trail tug had largest bending moment (also bending stress).
A typical deep-water normal lay operation was alsochecked for the surface Wave tow configuration. The resultsare presented in Figure 22 through Figure 27.
Sensitivity StudyThe impact of the pipeline length was investigated. For
pipeline #2 (20”OD 1.025”WT), 3 optional towing lengths(5km, 10km, 15km) were modeled and results compared withthose of the 20km tow. Static configurations for the shortertows were set up first by adjusting the distance between thelead tug and trail tug to achieve the same static pipeline tension(51te) as the base case 20km long tow under mean staticcondition. Then identical dynamic loading (head sea – load

6 OTC 17826
case 2) was applied and simulated. As expected, the maximumpipeline tension, stress (Figure 28) and vertical displacement(Figure 29) could be reduced significantly if the pipeline lengthto be towed was shortened. A greater than 200te bollard pullrequirement for a 20km tow would turn to a 100te tow for the5km pipe and under same loading condition. The formercondition indicated a two-lead tug operation with higher risk,while the latter a one-lead tug tow with lower risks.
For the 5km tow system, the impact of the tow speed wasalso checked for pipe #4 (14”OD 0.75”WT). In addition to themean static condition (0 knot current), head sea conditions withcurrents of 2.5knots to 6.5knots with 1knot increment wereapplied and the results are given in Figure 30 through Figure32. Assuming a 200te bollard pull capacity for tow tug, thelimiting speed for the combined surface current is about5.5knots, which is corresponding to 4 knot towing speed if thesurface current is 1.5knots head sea. The associated maximumdynamic tow tension was 170te. It is also shown that the higherthe towing speed, the deeper the last sag of the pipe: 37m inwater depth for a 5.5knots towing (combined current speed).
To investigate the influence of the tow wire stiffness,dynamic simulations were performed with different axialstiffness of the tow wire, EA/100, EA/10, EA, EA*10, andEA*50 are compared (Figure 33). The impact on the piperesponses due to stiffer tow wires (EA*10, EA*50) is found tobe negligible. However when the tow wire is very soft(EA/100), the tension would decrease by 19% (Figure 35), andthe pipe vertical displacement near the trail tug end willincrease significantly (-283m to -486m) (Figure 34).
Commercial ViabilityThe cost comparison aspect must take into considerationseveral aspect prior to conclude on the commercial viability ofa tow solution) /6/. Table 3 provides some elements to take intoconsideration when evaluating the overall performance of asurface tow operation.
ConclusionsTowing and laying along curved route long infield lines fordeep-water field development is technically feasible. This typeof operation was engineered and validated at the start of theoffshore industry in 1960 and the results found is still validalthough progress made in software analytical tool allows toextend the method to longer pipeline by changing the way thebuoyancy is distributed along the line. The tow method can beeconomically attractive if both the cost of the buoyancy and thecost of extra connection to make up the entire length arecomparable with the cost of mobilisation of large laying ship.
AcknowledgementsThe authors wish to thank Acergy for supporting thedevelopment and improvement of the tow technique. Theauthors also wish to thank Total, Chevron and many otherOperators worldwide for their contribution in this work. Theauthors wish also to acknowledge Acergy for supporting thispaper and the contribution from the various Project Teams whohave been instrumental in developing the knowledge associatedwith the surface tow technique.
Reference:1. Alliot, V., and Carré, RO, OTC paper 14211: “Girassol Riser
Tower Installation”, Offshore Technology Conference, Houston,2002.
2. Brown, R.J., “Completion of Placid Deep Water Green CanyonPipelines”, Deep Offshore Technology Conference, Marbella,1989.
3. Tatsuta, M., Kimura, H., “Offshore pipeline construction by anear-surface tow”, Offshore Technology Conference, Houston,1986.
4. Miller, D.M., Frazer, I., and Brevig, P., “The Heidrun Field _Marine Operations”, Offshore Pipeline Technology Conference,OTC 8101, 1996.
5. Hagood, S., Hajji, T. and Perera, E., “Pipeline tow cutsinstallation costs offshore Tunisia”, Oil and Gas Journal, Vol. 93,no. 9, 1995.
6. Alliot, V., Zhang, H. and Christiani, E., “Pipeline TowingMethods for Ultra-Deep Water Conditions – Lessons from thePast Used to Achieve the Requirements of the Future”, DeepOffshore Technology Conference, Vitoria, Brazil 2005.

OTC 17826 7
70km
2600m
2600m
Figure 1 Route and Subsea Survey
Figure 2 Pipeline Surface Tie-in Operation
Figure 3 Towing and Laying Method for Mostaganem-
Cartagena Pipeline Project
Figure 4 Surface tow trial North Sea November 1975
Figure 5 Hyperflow Riser Tower Model Test at Tow Tank
Figure 6 Girassol Hyperflow Rise Tower Towing Configin Lobito Bay

8 OTC 17826
Figure 7 Hyperflow Riser Tower Towing Route to GirassolField
Figure 8 Fatigue Diagram of Hyperflow Riser Towerduring Tow
Figure 9 Fatigue Diagram Ratio along the Tower
Figure 10 Wave length incidence matching self period of thestructure
Figure 11 Wave Tow Methods
Figure 12 Surface Wave Tow Installation Arrangement
Ln
Wave
θ
Lwave
2 .Ln.cos θ

OTC 17826 9
Figure 13 Tow Arrangement for Beam Current Condition
Figure 14 Free Body Diagram of a Slender Beam Element
Figure 15 Hydrostatic Pressure Force on Curved Pipe
Table 1 Pipeline Data
#1 #2 #3 #4mm 610 508 508 356in 24 20 20 14
mm 26 26 22 19in 1.025 1.025 0.875 0.75
Pipe design water depth1 m 1800 2500 1800 2500Steel Grade density X65 kg/m3Mass in air kg/m 375 310 266 158Sea water density kg/m3Submerged weight N/m 755 1019 585 563Net buoyancy requirement Te 1540 2025 1160 1114Total Pipe Length kmNote: Assuming no buckle arrestors are included along the pipeline.
Pipe Type
7850
1025
20
Wall thickness(WT)
Outside diameter(OD)
Parameters Unit
Figure 16 Preliminary Float Design

10 OTC 17826
Table 2 Result Summary
Wave/Current
Direction
Combined Surface CurrentSpeed
Effective Tension
von Mises Stress
Max WaterDepth
Max LateralDispl.
(from) (knots) (kN) (Mpa) (m) (m)24"OD 1.025"WTCase1 Head 0 508 25 -172 0Case2 Head 3.5 1721 49 -247 0Case3 Beam 3.5 1969 59 -189 215Case4 Beam 3.2 1653 57 -190 32920"OD 1.025"WTCase1 Head 0 549 25 -181 0Case2 Head 3.5 2113 59 -263 0Case3 Beam 3.5 2453 72 -195 95Case4 Beam 3.2 2006 62 -207 19120"OD 0.875"WTCase1 Head 0 534 24 -177 0Case2 Head 3.5 1369 38 -234 0Case3 Beam 3.5 1563 43 -191 69Case4 Beam 3.2 1308 44 -197 11814"OD 0.75"WTCase1 Head 0 544 34 -183 0Case2 Head 3.5 1330 69 -238 0Case3 Beam 3.5 1509 80 -198 38Case4 Beam 3.2 1280 72 -197 24
Pipe ProfileCondition
Load Case
Max Pipe Loads
Figure 17 Vertical Profile – During Tow under Current
Figure 18 Pipeline Lateral Displacement
0
500
1000
1500
2000
2500
3000
0 2000 4000 6000 8000 10000 12000 14000 16000 18000 20000
Arc Length (m)
Max
Effe
ctiv
e Te
nsio
n (k
N)
24"OD 1.025"WT
20"OD 1.025"WT
20"OD 0.875"WT
14"OD 0.75"WT
Figure 19 Tension Distribution
Figure 20 Stress Distribution
OTC 17826 11
Figure 21 Bending Moment Distribution
Figure 22 Pipe Lay Vertical Profile – Head Sea
Figure 23 Tension Distribution during Laying – Head Sea
Figure 24 Pipe Lay Vertical Profile – Beam Sea
Figure 25 Tension Distribution during Laying – Beam Sea
Figure 26 Pipe Lay Operation

12 OTC 17826
Figure 27 Pipe Lay Operation
Figure 28 Pipeline Length Sensitivity (Tension/Stress)
Figure 29 Pipeline Length Sensitivity (Vertical Profile)
Figure 30 Velocity Sensitivity (Max. Tension/Stress)
0
500
1000
1500
2000
2500
0 500 1000 1500 2000 2500 3000 3500 4000 4500 5000
Arc Length (m)
Tens
ion
(kN
)
0knot (Static)
2.5knots
3.5knots
4.5knots
5.5knots
6.5knots
Figure 31 Velocity Sensitivity (Tension Distribution)
-45
-40
-35
-30
-25
-20
-15
-10
-5
00 500 1000 1500 2000 2500 3000 3500 4000 4500 5000
Arc Length (m)
Wat
er D
epth
(m)
0knot
2.5knots
3.5knots
4.5knots
6.5knots
5.5knots
Figure 32Velocity Sensitivity (Vertical Profile

OTC 17826 13
0
500
1000
1500
2000
2500
3000
Nominalx0.01
Nominalx0.1
Nominalx1
Nominalx10
Nominalx50
Tow Wire Stiffness
Tens
ion
(kN
)
-600
-500
-400
-300
-200
-100
0
Max
. Pip
elin
e D
epth
(m
Max. Tow TensionMax. Sag Depth
Figure 33 Tow Wire Stiffness Sensitivity
-500
-400
-300
-200
-100
0
0 5000 10000 15000 20000Arc Length (m)
Wat
er D
epth
(m)
Nominal Stiffness
Nominal Stiffness x 0.01
Figure 34 Pipe Elevation – Stiffness Sensitivity
0
500
1000
1500
2000
2500
0 5000 10000 15000 20000Arc Length (m)
Pipe
line
Tens
ion
(kN
)
Nominal Stiffness
Nominal Stiffness x 0.01
Figure 35 Tension Distribution – Stiffness Sensitivity
Table 3 Commercial Impact Comparison