Osmotic- and Stroke-Induced Blood-Brain Barrier Disruption ... · Osmotic- and Stroke-Induced...
259
Osmotic- and Stroke-Induced Blood-Brain Barrier Disruption Detected by Manganese-Enhanced Magnetic Resonance Imaging A dissertation submitted to the faculty of Worcester Polytechnic Institute in partial fulfillment of the requirements for the degree of Doctor of Philosophy in Biomedical Engineering by David G. Bennett June 2007 Approved: Christopher H. Sotak, Ph.D. Major Advisor Professor Department of Biomedical Engineering Worcester Polytechnic Institute George D. Pins, Ph.D. Associate Professor Department of Biomedical Engineering Worcester Polytechnic Institute Yitzhak Mendelson, Ph.D. Professor and Interim Head Department of Biomedical Engineering Worcester Polytechnic Institute Karl G. Helmer, Ph.D. A. A. Martinos Center for Biomedical Imaging Charlestown, Massachusetts Peter Grigg, Ph.D. Professor Department of Physiology University of Massachusetts Medical School
Transcript of Osmotic- and Stroke-Induced Blood-Brain Barrier Disruption ... · Osmotic- and Stroke-Induced...

Osmotic- and Stroke-Induced Blood-Brain Barrier Disruption
Detected by Manganese-Enhanced Magnetic Resonance
Imaging
A dissertation submitted to the faculty of
Worcester Polytechnic Institute
in partial fulfillment of the requirements for the degree of Doctor of Philosophy in
Biomedical Engineering
by
David G. Bennett
June 2007
Approved:
Christopher H. Sotak, Ph.D. Major Advisor
Professor Department of Biomedical Engineering
Worcester Polytechnic Institute
George D. Pins, Ph.D. Associate Professor
Department of Biomedical Engineering Worcester Polytechnic Institute
Yitzhak Mendelson, Ph.D. Professor and Interim Head
Department of Biomedical Engineering Worcester Polytechnic Institute
Karl G. Helmer, Ph.D. A. A. Martinos Center for Biomedical Imaging
Charlestown, Massachusetts
Peter Grigg, Ph.D. Professor
Department of Physiology University of Massachusetts Medical School
ACKNOWLEGEMENTS
As I look back on my time at WPI it is apparent that I owe a debt of gratitude to several
individuals who assisted me in good times and bad. First and foremost, I am thankful for having
the support of my wonderful wife Alexia and close friends of ours. Alexia is a woman of
seemingly infinite patience and love. She stood steadfast by my side during summer weekend
imaging trials, periods of frustration, and months of writing. Alexia’s support and encouragement
helped make this work possible. Thank you for everything my love. I love you.
My start to a career in MRI began with the generous support of TJ and Maura McCartney
back in 1994. Maura, you started me on this career path with your generous assistance and I wish
I could celebrate and thank you in person now. You truly came to me at a decisive time in my life
and for this I am humbly grateful. My memory of you is crystal clear and my affections have not
changed over the years since your passing. I hope to see you again. May God bless you.
I am very thankful for having been a part of Prof. Christopher Sotak’s lab. Through his
wealth of scientific knowledge and demand for scientific rigor Chris provides a rich research
environment that is demanding yet open to new ideas. Chris, you are well aware of my successes
and failures and through each of these I have grown as a person and as a scientist. I sincerely
thank you for your efforts in steering me towards success. As another member of Chris’ lab
during my time at WPI, Dr. Karl Helmer was a key resource for scientific and personal advice.
Karl, since your parting from the lab I have missed our discussions, both scientific and political!
Thank you for all forms of your support during my time at WPI.
I very much enjoyed the time I spent with Dr. Yitzhak Mendelson, both in the classroom
and in informal discussions. Dr. Mendelson’s friendly demeanor made it easy to talk about
graduate student life in general and he provided perspective from someone with a background
similar to mine. Dr. Nils Henninger and James Bouley provided invaluable surgical assistance

during my experiments. Nils, your scientific skepticism was most appreciated and motivated me
further towards experimental rigor. And Nils please remember, it’s manganese, not magnesium! I
thank you very much for everything and I am glad to consider you both a friend.
I am grateful for the efforts of my dissertation committee members; Drs. Chris Sotak, Karl
Helmer, Yitzhak Mendelson, Peter Grigg, and George Pins. I appreciate their time spent reading
my dissertation and attending committee meetings. I also appreciate their suggestions during my
defense discussion and I will strive to reach their level of scientific achievement and personal
success.
I thank Dr. Erica Henning for starting me on the MEMRI experiments, answering my
questions via email while she was at the NIH and for all of our conversations, scientific or
otherwise-oriented. I also thank Dr. Jeremy Wellen for his help and advice before he left the lab. I
wish we had had the opportunity to work together more. And for Siva, Govind, Salman, Pallavi,
and Ronn; thank you all for the conversations and comic relief. I will miss you all and I will leave
you with yet another lecture: write often and early!

i
TABLE OF CONTENTS
Abstract v Chapter 1 - Basic Principles of MRI 1
1.0 Basic Physical Principles of Nuclear Magnetic Resonance 1 1.1 Introduction 1 1.2 Electromagnetic Wave Theory 1
1.2.1 The Electric and Magnetic Field 1 1.2.2 Generation of an Electromagnetic Wave 3
1.3 Nuclear Energy States 5 1.4 The Free Induction Decay Signal 13
1.4.1 Sampling the MR Signal 14 1.5 Relaxation in the MR Experiment 16
1.5.1 Mechanism of Spin-Lattice (T1) and Spin-Spin (T2) Relaxation 16 1.5.2 The Spin-Echo RF Pulse Sequence 20
1.6 Measurement of Relaxation Times 23 1.6.1 T1 Relaxation Measurement Techniques 23 1.6.2 T2 Relaxation Measurement by Carr-Purcell-Meiboom-Gill Pulse Sequence 25
2.0 Magnetic Resonance Imaging 27 2.1 Spatial Localization of a MR Signal 27
2.1.1 Magnetic Field Gradients for MRI 27 2.1.2 The Fourier Transform 29 2.1.3 Basic Properties of the Fourier Transform 31 2.1.4 Slice Select Gradients and the RF Excitation Pulse 32
2.1.4.1 Slice Dephasing 33 2.2 Spatial Encoding of the MR Signal 35
2.2.1 Phase-Encoding 36 2.2.2 Frequency-Encoding 37
2.3 Spin-Echo MRI 38 2.3.1 Spin-Echo MRI Pulse Sequence 38
2.4 The Gradient-Echo and Gradient-Echo (GRE) MRI 42 2.5 Image Contrast Based on Tissue T1 and T2 Relaxation Times 45 2.6 Multi-Slice Spin-Echo MRI 49 2.7 Echo-Planar Imaging 51
2.7.1 Echo-Planar Imaging Methods for Traversing k-space 52 2.8 Diffusion-Weighted Imaging 55
2.8.1 Diffusion of Water 56 2.8.2 Stejskal-Tanner Diffusion-Weighted Pulse Sequence 57 2.8.3 Quantification of Diffusion-Weighted Images: The ADC Map 58 References 59
Chapter 2 – Characteristics and Manipulation of the Blood-Brain Barrier (BBB) 61 2.1 Blood-Brain Barrier (BBB) Background 61 2.2 Anatomy of the BBB 61

ii
2.2.1 Brain Capillary Epithelium 62 2.3 Techniques to Determine BBB Permeability 65
2.3.1 Quantification of BBB Permeability Using the Brain-Perfusion Technique 65 2.3.2 A Semi-Quantitative Measure of BBB Permeability Using Evans Blue (EB) Dye 67
2.4 Hyperosmotic Disruption of the BBB 68 2.4.1 Characteristics of Reversible Osmotic BBB Disruption 69 2.4.2 Mannitol and Arabinose as Hyperosmolar Infusates for BBB Disruption 71
2.5 The BBB and Cerebral Edema 76 2.6 MRI Detection of BBB Disruption 79
2.6.1 Gd-DTPA Used to Detect Regions of Pathological BBB Disruption 80 References 81
Chapter 3 – Theory and Application of Manganese-Enhanced Magnetic 85 Resonance Imaging (MEMRI) Introduction 85
3.1 Magnetic Resonance Contrast Agent Physics 85 3.1.1 Effect of Contrast Agents on MR Parameters 86 3.1.2 Relaxation Effects of Paramagnetic Ion Metal Complexes 87
3.2 Manganese as a Calcium (Ca2+) Analog 90 3.2.1 Neurotransmission in Brain: The Role of Calcium Channels 91 3.2.2 Mn2+ Passage into Cells via Voltage-Gated Calcium Channels 92
3.3 Manganese Toxicity and Cellular Effects of Manganese 96 3.3.1 Mn2+ In Vivo After Intravenous (I.V.) Infusion 100
3.4 Mn2+ Transport Across the BBB 104 3.5 Mn2+ as MR Contrast Agent – Mn2+-Enhanced Magnetic Resonance Imaging
(MEMRI) 105 3.5.1 MEMRI with Mn-DPDP 105 3.5.2 MEMRI with MnCl2 107
3.5.2.1 A Review of Experiments in Brain Imaging with MnCl2 108 References 118
Chapter 4 – Nonspecific T1-Weighted Manganese Enhancement in Rat Brain Correlates with Evans Blue Staining After Osmotic Blood-Brain Barrier Disruption 123 Abstract 124
4.1 Introduction 125 4.1.1 Challenges in MEMRI 125 4.1.2 Evans Blue as a Marker for Osmotic BBB Disruption 127 4.1.3 Co-Infusion of MnCl2 and Evans Blue (EB) Dye as a Qualitative Method for
Validating MnCl2 Distribution in Brain 128 4.1.4 Experimental Design to Test Mechanisms of Nonspecific MEMRI Signal-
Enhancement 129 4.1.5 Relevance of Experiments to Future Work 129
4.2 Methods 130 4.2.1 Animal Preparation 130 4.2.2 Osmotic BBB Disruption and MnCl2+Evans Blue (EB) Administration 131 4.2.3 Timing of Drug Administration 132 4.2.4 Level of Anesthetic During MnCl2+EB Infusion 132

iii
4.2.5 EB Stain Histology 132 4.2.6 MRI Measurements 133 4.2.7 Data Analysis 133 4.2.8 Statistical Analysis 135
4.3 Results 135 4.3.1 MEMRI Signal-Enhancement 135 4.3.2 Evans Blue (EB) Stain 138 4.3.3 Correlation Between Regions of MEMRI Signal-Enhancement and Evans Blue
(EB) Staining 142 4.4 Discussion 145
4.4.1 Isoflurane and Halothane Level and Nonspecific MEMRI Signal-Enhancement 146 4.4.2 Nonspecific T1-Enhancement after Osmotic BBB Disruption 147 4.4.3 Cellular Uptake of MnCl2+Evans Blue (EB) Dye after Osmotic BBB Disruption 149 4.4.4 Limitations 150 4.4.5 Conclusions 151 References 152
Chapter 5 – Brain Damage and Mismatch Between Manganese-Enhanced MRI (MEMRI) and Diffusion-Weighted MRI in the Absence of Specific Neuronal Stimuli: Potential Pitfalls in MEMRI After Osmotic BBB Disruption 154 Abstract 155
5.1 Introduction 156 5.1.1 MEMRI Background 156 5.1.2 Side Effects of Osmotic BBB Disruption 156
5.2 Methods 158 5.2.1 Animal Preparation 158 5.2.2 Osmotic BBB Disruption and MnCl2+EB Administration 159 5.2.3 MRI Measurements 160 5.2.4 EB and 2,3,5 TriphenylTetrazolium Chloride (TTC) Histology 161 5.2.5 Data Analysis 162 5.2.6 Statistical Analysis 167
5.3 Results 167 5.3.1 Animal Physiology 167 5.3.2 Brain Edema 169 5.3.3 MEMRI Signal-Enhancement 171 5.3.4 ADC Deficit 174 5.3.5 TTC Lesion Area 177 5.3.6 MEMRI-DWI Mismatch 182 5.3.7 Correlation of MEMRI-DWI Mismatch to TTC Lesion Area 185
5.4 Discussion 187 5.4.1 Nonspecific MEMRI Signal-Enhancement: Relation to Anesthesia and Blood
Gases 187 5.4.2 Brain Edema After Osmotic BBB Disruption 188 5.4.3 Is MEMRI Signal-Enhancement Indicative of Tissue Damage? 190 5.4.4 Brain Damage Verified by TTC Lesion 191 5.4.5 MEMRI-DWI Mismatch 192 References 197
iv Chapter 6 – Blood-Brain Barrier Disruption in Embolic Stroke Detected by Manganese-Enhanced Magnetic Resonance Imaging (MEMRI) 200 Abstract 201
6.1 Introduction 202 6.1.1 Stroke Background 204 6.1.2 Stroke and the BBB 205 6.1.3 The Embolic Stroke Model and Associated BBB Injury 207 6.1.4 Intracellular Calcium Level Increase During Stroke – Implications for MEMRI 209
6.2 Methods 210 6.2.1 Animal Preparation 210 6.2.2 Embolic Middle Cerebral Artery Occlusion (eMCAO) 211 6.2.3 MR Imaging 212 6.2.4 MnCl2 + Evans Blue (EB) Infusion Protocol 212 6.2.5 EB and 2,3,5 TriphenylTetrazolium Chloride (TTC) Histology 213 6.2.6 Data Analysis 213
6.3 Results 216 6.3.1 MEMRI Signal-Enhancement 216 6.3.2 ADC Deficit 217 6.3.3 MEMRI-DWI Mismatch & Match 218 6.3.4 MEMRI Signal-Enhancement and ADC Correlation With Evans Blue and TTC
Histology 219 6.4 Discussion 223
6.4.1 MEMRI Signal-Enhancement: Detection of Hemorrhagic Transformation During Acute Stages of Embolic Stroke? 223
6.4.2 MEMRI Signal-Enhancement in Stroke: Mechanisms Related to Cell Calcium Uptake 225
References 228 Chapter 7 – Summary 231 Appendix
I. The Author’s Curriculum Vitae II. Select Conference Proceedings

v
ABSTRACT
Manganese (Mn2+) has recently gained acceptance as a magnetic resonance imaging (MRI)
contrast agent useful for generating contrast in the functioning brain. The paramagnetic properties of
Mn2+, combined with the cell’s affinity for Mn2+ via voltage-gated calcium channels, makes Mn2+
sensitive to cellular activity in the brain. Compared with indirect measures of brain function, such as
blood oxygenation level dependent (BOLD) functional MRI, manganese-enhanced MRI (MEMRI)
can provide a direct means to visualize brain activity.
MEMRI of the brain typically involves osmotic opening of the blood-brain barrier (BBB) to
deliver Mn2+ into the interstitial space prior to initiation of a specific neuronal stimulus. This
method assumes that the BBB-disruption process itself does not induce any apparent stimuli or cause
tissue damage that might obscure any subsequent experimental observations. However, this
assumption is often incorrect and can lead to misleading results for particular types of MRI
applications.
One aspect of these studies focused on characterizing the confounding effects of the BBB-
opening process on MRI measurements typically employed to characterize functional activity or
disease in the brain (Chapters 4 and 5). The apparent diffusion coefficient (ADC) of tissue water
was found to decrease (relative to the undisrupted contralateral hemisphere) following BBB opening,
obscuring similar ADC changes associated with ischemic brain tissue following stroke. Brain
regions exhibiting reduced ADC values following osmotic BBB disruption also experienced
permanent tissue damage, as validated by histological measures in the same vicinity of the brain.
Non-specific MEMRI-signal enhancement was also observed under similar conditions and was
found to be correlated to regions with BBB opening as verified by Evans Blue histological staining.

vi In this case, MEMRI may prove to be a useful alternative for monitoring BBB-permeability changes
in vivo.
MEMRI was also investigated as a method for visualizing regions of BBB damage following
ischemic brain injury (Chapter 6). BBB disruption following stroke has been investigated using
gadolinium-based MRI contrast agents (e.g., Gd-DTPA). However, as an extracellular MRI contrast
agent, Gd-DTPA is not expected to provide information regarding cell viability or function as part of
MR image contrast enhancement. By comparison, brain regions with ischemia-induced BBB
damage, and blood-flow levels sufficient to deliver Mn2+, show MEMRI-signal enhancement that
correlates to regions with tissue damage as verified by histological staining. This approach should
allow us to better understand the factors responsible for ischemia-induced BBB damage.
Furthermore, MEMRI should be a useful tool for monitoring therapeutic interventions that might
mitigate the damage associated with BBB disruption following stroke.
CHAPTER 1
Basic Principles of MRI
Basic Physical Principles of MR Electromagnetic Wave Theory
Nuclear Energy States The Free Induction Decay Signal Relaxation in the MR Experiment Measurement of Relaxation Times
Magnetic Resonance Imaging Spatial Localization of a MR Signal Spatial Encoding of the MR Signal
Spin-Echo MRI The Gradient-Echo and Gradient-Echo (GRE) MRI
Image Contrast Based on Tissue T1 and T2 Relaxation Times Multi-Slice Spin-Echo MRI
Echo-Planar Imaging Diffusion-Weighted Imaging

Basic Principles of MRI 1 1.0 Basic Physical Principles of Nuclear Magnetic Resonance
1.1 Introduction
This chapter is an introduction to the basic theory of magnetic resonance imaging (MRI). The
topics covered include the MR theory and methods that pertain specifically to the research described
in this dissertation. The MR theory is discussed at a depth that should provide a basic understanding
of spin-echo, gradient echo, echo-planar and diffusion-weighted MR imaging.
1.2 Electromagnetic Wave Theory
The electromagnetic wave is of fundamental importance for the generation of a magnetic resonance
image. A brief discussion of the basic components of an electromagnetic wave, the electric and
magnetic field, and what portions of the wave are important to magnetic resonance imaging (MRI)
are presented here.
1.2.1 The Electric and Magnetic Field
Generation of the electric and magnetic field by charged particles
The concept of a ‘field’ can be described with a common force that surrounds us: gravity. To every
point in space we can assign a vector g that represents the force F exerted on some mass m by earth’s
gravity. The gravitational field is then written as g = F/m. In a similar fashion we can talk of a
vector E that represents the force F that a positive electric charge q experiences when placed near a
charged rod. The electric field is then described as E = F/q. The direction of the vector E is the same
as F; it is the direction the stationary positively-charged particle would accelerate towards the rod.
The electric field, therefore, is representing the force of one electrically-charged particle on another.
Can it then be said that the magnetic field is a representation of a magnetically-charged particle on

Basic Principles of MRI 2
N
S
another? The answer to date is no, i.e., there are no known magnetic charges. It is the moving
electrical charge that generates a magnetic field.
Properties of the Magnetic Field
A charged particle moving in the presence of a magnetic field B does not experience acceleration but
can have its direction changed. The magnetic field deflects a moving charge by a force FB maximally
when the charged particle is moving perpendicular to the direction of the magnetic field: FB =
qvBsin(θ) where θ is the angle between the direction of the moving particle and the direction of the
magnetic field, q is the measure of electric charge, and v is the velocity of the charge. The measure
of magnetic field strength is the newton / (ampere * meter) or more simply and more commonly
referred to as the Tesla (1 T = 1 N/(A * M) ) (1). As reference a small toy magnet (refrigerator
magnet) has a magnetic field strength of ~ 10-2 T, the magnetic field at the surface of the earth is ~
10-4 T and a clinical MRI scanner is at 1.5 T. Figure 1.1 shows an example of the magnetic-field
profile of a bar magnet.
Figure 1-1: Magnetic field lines for a typical bar magnet. Note the linearity of the field in the middle of the magnet; this
is an important characteristic of magnets for magnetic resonance imaging and will be discussed later.

Basic Principles of MRI 3
1.2.2 Generation of an Electromagnetic Wave
Electric and magnetic fields can be generated by point charges and bar magnets, respectively, as
discussed in the previous section. What is required to generate a magnetic resonance image is a
propagating magnetic field (which moves in a direction perpendicular to the main magnetic field of
the MRI scanner). A convenient way to generate a relatively small and switchable magnetic field is
by passing an electric current through a small loop of wire that surrounds the sample we are
interested in imaging. The small loop of wire and the circuit that completes it is referred to as a LC
oscillator.
Induced Magnetic Field in Wire Loop
For a single loop of wire carrying a current I, a fairly homogenous magnetic field is generated near
the center of the loop as shown in Figure 1-2:
Figure 1-2: Current flow in single loop of wire (A) and a side view of resultant magnetic field lines (B).
Current (I) flow x
y
z +Z
A B

Basic Principles of MRI 4
The LC Oscillator
The electric charge and current in the LC oscillator circuit fluctuates at a particular frequency given
by ω = 1/√LC where L and C are the inductance and capacitance values in the circuit. The oscillation
frequency of the LC circuit is more commonly named the resonant frequency. For MRI applications
the frequency of oscillation of the magnetic field needed for MR signal generation is in the radio-
frequency (RF) range. Therefore, the ‘coil’ (or coils) used to generate MR images are commonly
referred to as RF coils. When an LC oscillator (or resonator) is used to acquire images in a 2 Tesla
MR scanner, the resonant frequency of the LC circuit must be tuned to 2 Tesla * 42.57 MegaHertz/
Tesla (MHz/T) or ~ 85 MHz. The special constant, 42.57 MHz/T, will be discussed later in this
chapter.
The single loop of wire shown in Figure 1-3 is one of many ways of generating a resonating
magnetic field within a tissue of interest. Multiple loops of wire wound tightly together (solenoid)
are also commonly used with the advantage of a highly homogeneous magnetic field produced
Capacitor (C)
Inductor (L) Sample for imaging (water phantom, tumor tissue, etc…)
MR signal to and from MR scanner
Figure 1-3: LC oscillator circuit. The capacitor shown is adjustable to allow the user to tune the coil to an exact
frequency (the resonant frequency of the coil can change due to stray capacitance values in the sample among
several other variables). The inductor shown is a single loop of copper wire. In this form the RF coil is referred to as
a ‘surface coil’.

Basic Principles of MRI 5 within the diameter of the coil. The transfer of energy from the coil to the tissue (sample) of interest
(via the magnetic field produced by the coil) is the primary goal of the LC oscillator and all RF coils
used for MRI. Water molecules within the tissue of interest become ‘excited’ by the magnetic energy
produced by the coil. The means by which the tissue becomes excited is the subject of the next
section.
1.3 Nuclear Energy States
Atomic structure and angular momentum
Atomic structure is defined by an atom’s nuclear configuration and its orbiting electron(s). The
nucleus of the atom consists of protons (charge = +e, where e is the charge of an electron: -1.60 x 10-
19 Coulomb) and neutrons (charge = 0); both of which are referred to as nucleons. The electron(s)
that orbit(s) the nucleus are each negatively charged and possess both spin and orbital angular
momentum. The angular momentum associated with a charged particle generates a magnetic field
(referred to as the magnetic dipole moment or MDM) which is a vector quantity with both
magnitude and direction. The magnetic field associated with electrons is referred to as the electron
MDM. Since nuclei can also possess spin and orbital angular momentum and are positively charged,
the associated magnetic field is referred to as the nuclear MDM. For MRI, the MDM of the 1H
isotope of hydrogen is simply that associated with the single proton in the nucleus (Figure 1-4). The
proton MDM is the fundamental physical property that is exploited to generate an MR image.

Basic Principles of MRI 6
P
µ
Figure 1-4: Single proton (1H isotope of hydrogen) showing the angular momentum vector (P) and the antiparallel
nuclear MDM (µ) vector that is created by the moving positive charge associated with the proton.
A convenient way to represent the relationship between the nuclear MDM and its angular
momentum is to consider the ratio of the two quantities. This ratio is referred to as the magnetogyric
(or gyromagnetic) ratio and is written as γ = µ/P = -(e/2me), where e and me are the charge and mass
of the proton, respectively, when considering the 1H isotope of hydrogen.
The ‘spin’ of a nucleus
The laws of quantum mechanics require that the angular momentum of the proton shown in Figure
1-4 be quantized, i.e., the magnitude of the nuclear spin angular momentum can only be represented
by specific discrete values:
2/1)]1([ += IIP ηρ
(1.1)

Basic Principles of MRI 7
6 Protons
7 Neutrons
Spin Pairs Resulting Spin (I)
0
1/2
13C Nuclear Config.
)2/( 0 πγhBmE ii −=
where π2/h=η (h = Planck’s constant = 6.63 x 10⁻³⁴ kgּmּs-1) and I is the nuclear spin quantum
number. The value of I depends on the structure of the nucleus; specifically, the number of protons
and neutrons. Each proton and neutron has an associated spin of ½. In the nucleus, the pairing of two
protons (or two neutrons) results in a cancellation of the spin from each partner. Consequently, the
net spin of a particular nucleus is determined by the number of unpaired protons and/or neutrons in
the nucleus. For example, the 13C nucleus has six protons and seven neutrons. The six protons form
three pairs whose spins cancel. The seven neutrons form three spin pairs and with one neutron
remaining unpaired. As a result, the net spin associated with the 13C isotope is simply that
contributed by the single unpaired neutron (i.e., I = ½), as shown in Figure 1.5.
Figure 1-5: Spin pairs for the 13C nucleus. Paired protons and neutrons result in a net zero spin for each pair. It is the
unpaired neutron that gives 13C a spin of I = ½.
Nuclei in an external magnetic field
For nuclei with a non-zero value of I, the nuclear MDM can adopt certain orientations with
respect to the direction of an applied external magnetic field. For spin-½ nuclei, such as 1H or 13C,
the nuclear MDM can be oriented in a ‘spin-up’ or ‘spin-down’ state which corresponds to the
nuclear MDM being either parallel or antiparallel to the external magnetic field, respectively. In the
absence of an applied external magnetic field, the two spin states have the same energy (i.e., they are
said to be degenerate). However, in the presence of an applied external magnetic field – usually
designated as Bo – the energy associated with each state is different and given by:
(1.2)

Basic Principles of MRI 8
0
Bo ON
m+1/2 (spin up)
m-1/2 (spin down)
∆E = γhBo/2π
Bo OFF
E
where γ is the magnetogyric ratio, h is Planck’s constant, Bo is the external magnetic field strength,
and i is the particular spin state (either +½ or -½ in the case of 1H). Equation 1.2 indicates that the
energy of the proton MDM is quantized in units of γhBo/2π and varies with the external magnetic
field strength Bo. Figure 1-6 shows the two energy levels associated with the proton MDM in the
absence and presence of the Bo field.
Figure 1-6: Energy of the proton (1H) MDM in the absence and presence of an external magnetic field Bo. The
quantization of the proton MDM implies that the MDM can occupy only one of two possible energy states.
When a sample containing spin-½ nuclei is placed into an external magnetic field, the nuclei will
distribute themselves between the two energy states according to the Boltzmann distribution. The
number of nuclei in a particular energy state, NI, is given by:
KT
E
I
I
eN
−
=
where EI is the energy of state I, K is the Boltzmann constant (1.38 x 10⁻²³ Joules/Kelvin), and T is
temperature (Kelvin scale). The ratio of nuclei in each state is given by:
KTE
KTE
KTE
ee
eNN /
/
/
2/12/12/1
2/1
/ ∆−−
−
− ==−
,
where N-1/2 and N1/2 are the populations of nuclei in the upper and lower states, respectively, and ∆E
is the energy difference between the two states. Writing the total population of nuclei as NT = N-1/2 +
(1.3)
(1.4)

Basic Principles of MRI 9 N1/2, the difference in population between the two states as ∆N = N1/2 - N-1/2 , and using the Taylor
series approximation KTEe
/2/1−− ~ 1 - ∆E/KT, the difference in population between the two energy
states, ∆N, can be written as:
KT
ENN T
2
∆=∆ .
For an MRI experiment, the MR signal is directly proportional to the population difference,
∆N, between the two states. The population difference can be expressed in terms of the net nuclear
magnetization vector, M, which is defined as the sum of all the individual nuclear magnetic
moments, µ:
∑ −==
I
Im zmmNM µ ,
where Nm is the number of nuclei in state m and µzm is the z-component of all the nuclear magnetic
moments in state I. If the system is at the Boltzmann equilibrium, then the net nuclear magnetization
vector is designated as Mo, where the subscript denotes the equilibrium condition.
From a quantum-mechanical point of view, the MRI experiment involves transitions between
energy states. For spin-½ nuclei, transitions from the lower to the higher energy state are induced by
applying energy [in the form of radiofrequency (RF) radiation] that exactly equals the difference in
energy between the two states (i.e., ∆E = γhBo/2π). Since the difference in energy between the two
states is also given by ∆E = hυ, where υ is the frequency of electromagnetic radiation (in this case
RF), then the RF frequency that satisfies the “resonance” condition is given by:
υ = γBo/2π.
Equation 1.7 can be thought of as the quantum-mechanical version of the magnetic resonance
equation.
Classical Description of MR
The net nuclear magnetization, M (from Eq. 1.6), can be depicted in the classical sense using
vector diagrams. Figure 1-7 shows a vector diagram for a single nuclear MDM and a diagram for a
collection of nuclear MDMs that give rise to the net magnetization vector, M, in the laboratory frame
of reference. If the system is at the Boltzmann equilibrium, then the net nuclear magnetization vector
is designated as Mo, where the subscript denotes the equilibrium condition.
(1.5)
(1.6)
(1.7)

Basic Principles of MRI 10
θ
µ
Bo
x
y
z
x
y
z Mo
a b
Figure 1-7: a) A single nuclear magnetic dipole moment (MDM), µ, in the presence of the external magnetic field, Bo.
The Bo field exerts a force on µ, resulting in a precessional motion of µ about Bo. b) A collection of nuclear MDMs
precessing about Bo with an excess population (of two) oriented in the Bo direction. Although the transverse (x-y)
components of the MDMs cancel each other out, there is a net z-component of magnetization, Mo (if the system is at the
Boltzmann equilibrium), which corresponds to the population difference between the two orientations. The Cartesian-
coordinate system is defined in this case as the ‘laboratory’ frame of reference.
In the presence of an external magnetic field, Bo, aligned along the z-direction of a Cartesian
coordinate reference frame, individual nuclear MDMs will precess about Bo as a result of the force
exerted on them by Bo. The precessional frequency, ω (in rad/s), is given by the Larmor equation:
ω = γBo.
Notice that the Larmor equation has a form analogous to the resonance equation (Eq. 1.7) derived
from the quantum-mechanical model.
In the presence of a radiofrequency field, B1, that is perpendicular to the main magnetic field,
Bo, and to M, the motion of M in the laboratory frame of reference (a fixed frame of reference with
respect to the laboratory surroundings) can be described by a set of differential equations known as
(1.8)

Basic Principles of MRI 11 the Bloch equations (2). The Bloch equations also include the relaxation parameters T1 and T2 (more
on these parameters in Section 1.4) which account for the motion of the Mz and Mxy components of
M, respectively, during their return to the Boltzmann equilibrium (after the RF field is turned off).
By considering first the single magnetic moment (Figure 1-7a), the rate of change of µ with respect
to time is given by:
)( 0xBdt
dµγ
µ= ,
which describes the precessional motion of µ around Bo. An analogous Bloch equation can also be
written for the net magnetization vector M as:
)( 0xBMdt
Mdγ=
By adding the contributions that describe the behavior of the magnetization under the influence of
the B1 field as well as relaxation, the full Bloch equations for each component of M are summarized
as follows:
210 sin
T
MtMBMB
dt
dM x
zy
x −+= ωγγ
210 cos
T
MtMBMB
dt
dM y
zx
y −+−= ωγγ
1
01
)()cos(sin
T
MMtMtMB
dt
dM z
yxz −
−+−= ωωγ
In this form the Bloch equations are tedious to solve. However, the task is made easier by a
coordinate system transformation into a frame of reference that is rotating at the precessional
frequency of the nuclei (i.e., a rotating reference frame). For example, consider a spinning merry-
go-round with several children aboard. To the observer standing next to the merry-go-round, the
children would appear to be spinning at the rotational frequency of the ride. However, if the
observer were to then jump on the merry-go-round with the children, the children would not appear
to be moving (i.e., they would appear to be stationary) in that frame of reference. Similarly, if the
magnetization vector M is observed from a frame of reference rotating at the precessional frequency
of the nuclei, then M will also appear to be stationary in that rotating frame of reference. In other
words, observing M in the rotating reference frame effectively removes the contribution of the
precessional term (i.e., γBoMy or –γBoMx) from the Bloch equations (e.g., Eqs. 1.11 and 1.12,
(1.9)
(1.10)
(1.12)
(1.11)
(1.13)

Basic Principles of MRI 12 respectively). Transforming to the rotating frame of reference (x′, y′, z′) from the fixed laboratory
frame of reference (x, y, z) requires the following definitions for the Cartesian components of
magnetization in the rotating reference frame:
Mx′ = Mxcos(ωt) - Mysin(ωt)
My′ = Mxsin(ωt) + Mycos(ωt)
Mz′= Mz.
The Bloch equations can then be re-written as:
2
''0
' )(T
MM
dt
dM x
y
x −−= ωω
z
y
x
yMB
T
MM
dt
dM1
2
''0
' )( γωω +−−−=
'11
0 )( y
zz MBT
MM
dt
dMγ−
−−= ,
and solved in this form to predict how the different components of magnetization behave under a
particular set of experimental conditions.
Figure 1-8 shows the observed path of M in the presence of an RF magnetic field, B1,
oscillating at the Larmor frequency for an observer in the laboratory frame of reference (Figure 1-8a)
and in the rotating frame of reference (Figure 1-8b). The RF coil in Figure 1-8 is positioned such that
when alternating current is passed through the coil, an oscillating magnetic field, B1, is generated
according to Ampere’s law. The B1 field is perpendicular to Bo and to M and exerts a torque on M
such that M tips away from Bo. The ‘tip angle’ θ can be adjusted by controlling the amplitude of the
B1 field and the duration, t, of the RF pulse that is applied to the coil. For a nucleus with a
gyromagnetic ratio γn, the flip angle θ is given by:
tBn 1γθ = .
The purpose of the B1 field then is to convert the z-component of magnetization (Mz), which is not
directly observable, into detectable transverse components of magnetization (i.e., Mxy). As shown in
Figure 1-8b, a 90o RF pulse creates the maximum transverse component of magnetization which in
turn yields the largest MR signal intensity.
(1.17)
(1.18)
(1.19)
(1.20)
(1.14)
(1.15)
(1.16)

Basic Principles of MRI 13
Figure 1-8: a) The RF magnetic field B1 and M in the fixed or laboratory frame of reference containing Bo. In this frame
of reference, the B1 field rotates at the Larmor precessional frequency of M. The effect of B1 and Bo together forces M to
tip away from the z-axis as well as precess about Bo at the same time (resulting in the complex spiral motion indicated in
the figure). At the time point shown in the figure, M has two nonzero components; Mz (longitudinal) and Mxy
(transverse) magnetization. b) The RF magnetic field B1 and M in the rotating frame of reference. In this frame of
reference, the B1 field now appears stationary and the effect of the Bo field on M is effectively removed. Consequently,
in the rotating reference frame, M only experiences the effect of the B1 field and is confined to rotate about B1 in the x′,
z′ plane. At the time point shown in the figure, M has rotated through 90o and thus has only a transverse component, Mxy.
1.4 The Free Induction Decay Signal
As long as the external magnetic field B1 is applied, the net magnetization vector M will continue
to precess about the B1 axis (in the rotating frame of reference). When the B1 field is removed (or no
longer oscillates at the Larmor frequency), M begins to return to the Boltzmann equilibrium state.
The MR signal can then be detected during this period. From Faraday’s law of induction, an
oscillating magnetic field – in this case Mxy – generates (or induces) an electromotive force (emf) in
the RF coil (that has a geometry and orientation to specifically detect transverse components of
magnetization). The small emf oscillating in the RF coil is referred to as the free induction decay
(FID). ‘Free’ refers to the process being free of any applied forces, ‘induction’ refers to the emf
induced in the coil, and ‘decay’ refers to the fact that the amplitude of the induced emf decays over
time. The FID is amplified and then digitized for subsequent signal processing (e.g., Fourier
transformation) to extract the frequency components of the signal. A typical FID and the
corresponding RF detection coil arrangement in the laboratory frame of reference are shown in
Figure 1-9.
x
z
y
z′
x′
y′
B1
θM = Mxy
B0
B1
RF Coil
Mxy
Mz
M
a b

Basic Principles of MRI 14
z
Mxy 1 2
3
4 5 6 7 8
x
y
B
z
Mxy 1 2
3 4 5
6
7 8
x
y
A
Sign
al A
mpl
itude
(arb
itrar
y un
its)
Sign
al A
mpl
itude
(arb
itrar
y un
its)
Figure 1-9: Detection of transverse magnetization, Mxy. The Cartesian coordinate systems depict Mxy vectors at different
time points in the absence (A) or presence (B) of transverse magnetization decay. The graphs depict the corresponding
amplitude of Mxy (in terms of signal intensity) as a function of time. The phase of the signal depicted by numbered points
on graphs depends on the initial position of the Mxy vector in the transverse plane relative to the position of the RF
detection coil. The decaying Mxy signal is referred to as the free induction decay (FID). The FID shape is the result of a
sinusoid multiplied by an exponential. The decay rate is dependent on T2* relaxation (more on T2
* relaxation in Section
1.4.1).
1.4.1 Sampling the MR Signal
The MR signal is a continuous signal (i.e., analog) while signals that computers deal with are
discrete or digital signals. Therefore, MR signals must be sampled and stored digitally (i.e.,
digitized) before the FT can be applied to generate a MR image. A minimum sampling rate is
necessary for correct digitization of the MR signal (and any time-domain signal) and is determined
*5 1*
2*
*3
*4
6*
*7
8
*1
*1
*2
*
*4
*5
*6
*7
*8
*1
*2 *4
*5
*6
*7
*8
*1
*2 *4
*5
*6
*7
*8
*1
*2
*2T
t
e
−
3 3 3 * *
Time (t)

Basic Principles of MRI 15 according to the Nyquist Sampling Theorem. The Nyquist Sampling Theorem states that to correctly
digitize a signal the sampling rate must be twice the highest frequency contained within the signal.
This concept is shown graphically in Figure 1-10:
Figure 1-10: Examples of correct and incorrect sampling of a time domain signal. Sample rate in A) is greater than twice
the highest frequency component in the signal and the resulting reconstruction (digitization) of the signal is accurate.
Sample rate in B) is less than twice the highest frequency component in the signal and the resulting digitization of the
signal does not accurately represent the original signal. In this example (B), the frequency of the reconstructed signal is
exactly half of the sampled signal.
A) Correct Sampling Rate (> 2*max freq.) Correct Reconstruction
B) Incorrect Sampling Rate (< 2*max freq.) Incorrect Reconstruction
Basic Principles of MRI 16
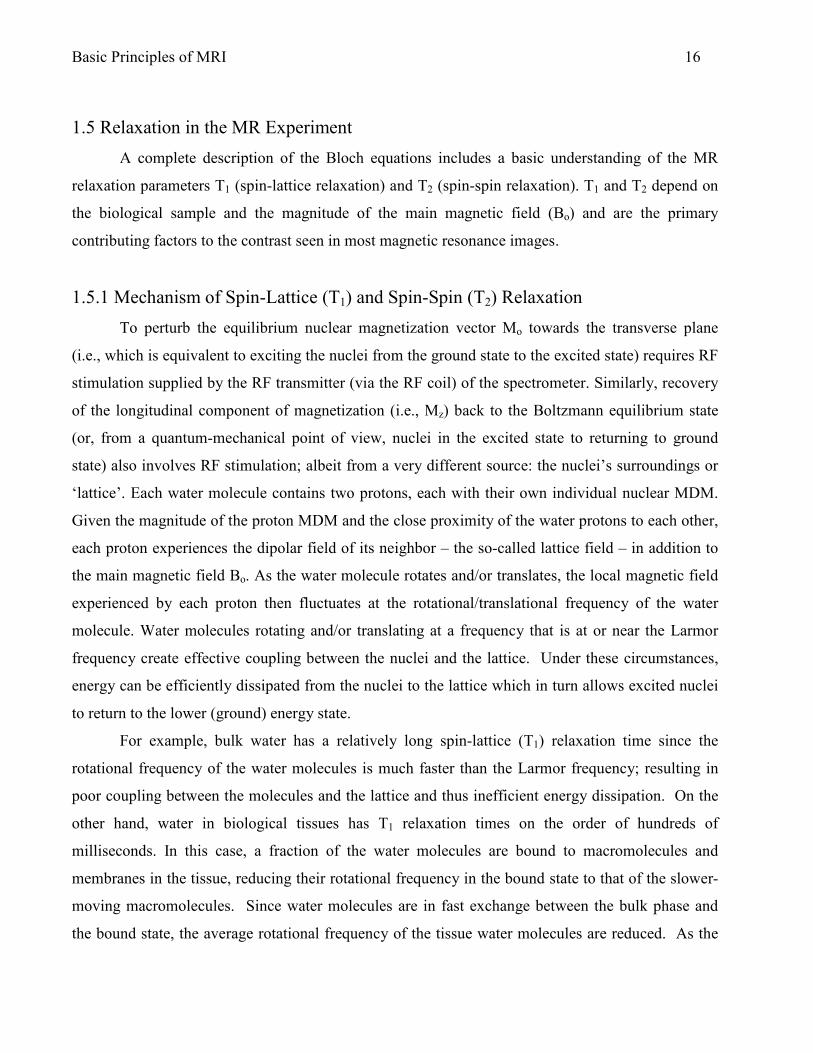
1.5 Relaxation in the MR Experiment
A complete description of the Bloch equations includes a basic understanding of the MR
relaxation parameters T1 (spin-lattice relaxation) and T2 (spin-spin relaxation). T1 and T2 depend on
the biological sample and the magnitude of the main magnetic field (Bo) and are the primary
contributing factors to the contrast seen in most magnetic resonance images.
1.5.1 Mechanism of Spin-Lattice (T1) and Spin-Spin (T2) Relaxation
To perturb the equilibrium nuclear magnetization vector Mo towards the transverse plane
(i.e., which is equivalent to exciting the nuclei from the ground state to the excited state) requires RF
stimulation supplied by the RF transmitter (via the RF coil) of the spectrometer. Similarly, recovery
of the longitudinal component of magnetization (i.e., Mz) back to the Boltzmann equilibrium state
(or, from a quantum-mechanical point of view, nuclei in the excited state to returning to ground
state) also involves RF stimulation; albeit from a very different source: the nuclei’s surroundings or
‘lattice’. Each water molecule contains two protons, each with their own individual nuclear MDM.
Given the magnitude of the proton MDM and the close proximity of the water protons to each other,
each proton experiences the dipolar field of its neighbor – the so-called lattice field – in addition to
the main magnetic field Bo. As the water molecule rotates and/or translates, the local magnetic field
experienced by each proton then fluctuates at the rotational/translational frequency of the water
molecule. Water molecules rotating and/or translating at a frequency that is at or near the Larmor
frequency create effective coupling between the nuclei and the lattice. Under these circumstances,
energy can be efficiently dissipated from the nuclei to the lattice which in turn allows excited nuclei
to return to the lower (ground) energy state.
For example, bulk water has a relatively long spin-lattice (T1) relaxation time since the
rotational frequency of the water molecules is much faster than the Larmor frequency; resulting in
poor coupling between the molecules and the lattice and thus inefficient energy dissipation. On the
other hand, water in biological tissues has T1 relaxation times on the order of hundreds of
milliseconds. In this case, a fraction of the water molecules are bound to macromolecules and
membranes in the tissue, reducing their rotational frequency in the bound state to that of the slower-
moving macromolecules. Since water molecules are in fast exchange between the bulk phase and
the bound state, the average rotational frequency of the tissue water molecules are reduced. As the

Basic Principles of MRI 17 average rotational frequency of the water molecules approaches the Larmor frequency, the
molecules will couple more effectively to the lattice; resulting in more efficient energy transfer from
the excited protons to their surroundings and thus reduced T1 relaxation times. The rotational rate
and, therefore, the T1 relaxation time of bound water depends on the size of the macromolecule
involved as shown in Figure 1-11.
The theory of Bloembergen, Purcel, and Pound (3) provides a quantitative estimate of T1 and T2
relaxation times based on the correlation time (τc) of the molecule. The correlation time is defined
as the time required for a molecule to rotate though 1/2π of a cycle (i.e., 1 radian or 57.3o) or the
“average” time between molecular collisions. The R1 (1/T1) and R2 (1/T2) relaxation rates also
depend on the Larmor resonant frequency (ω0) of the nuclei as well as a number of other nuclear
parameters as given by:
++
+=
220
2201 41
4
1
1
c
c
c
cKT τω
ττω
τ (1.21)
++
++=
220
2202 41
2
1
53
2
1
c
c
c
c
c
K
T τωτ
τωτ
τ , (1.22)
where 62
422
160
3
rK
πγµ η
= , µ = the MDM of the particular nucleus, ћ = h/2π = Planck’s constant divided
by 2π, γ = the gyromagnetic ratio of the nuclear species, and r = the separation between the protons
in the water molecule (i.e., the dipole-dipole separation).
Figure 1-11 shows the relationship between molecular correlation times and T1 and T2
relaxation times for various sized molecules. Note that as the molecular size increases (i.e.,
decreasing τc) the T1 relaxation time decreases and attains a minimum where the average
rotational/translational frequency of the molecules (1/τc) matches the Larmor frequency. As the
molecular size increases further, the T1 relaxation time also increases due to the increasing mismatch
between the average molecular rotational/translational frequency and the Larmor frequency. In the
case of the transverse relaxation time, T2 also decreases with increasing molecular size. However,
the additional 3τc term in Eq. 1.22 (as compared to Eq. 1.21 for T1) causes the T2 relaxation time to
continue to decrease (rather than increase as seen for T1) as the molecular size continues to increase.

Basic Principles of MRI 18
Figure 1-11: Plot of T1 and T2 relaxation times versus molecular correlation time (τc) (from Eqs. 1.21 and 1.22). Note
that for bulk water the T1 and T2 relaxation times are nearly identical (this is the so-called ‘extreme narrowing’ regime)
while for larger molecules, such as lipids and proteins, T1 and T2 differ significantly. The dependency of T1 on the main
magnetic field strength, Bo, is clearly demonstrated for medium-sized and large molecules. The minimum in the T1
curves is the point at which the rotational frequency of the molecules (i.e,, 1/τc) equals the Larmor frequency.
The transverse or spin-spin relaxation time, T2, characterizes the rate of decay of the Mxy
magnetization that is created following the rotation of Mz magnetization into the transverse plane
following the application of an RF pulse. In the case of an FID, the time constant associated with
the decay of the transverse magnetization is denoted by T2*, which contains contributions from a
variety of sources. The R2* relaxation rate (i.e., 1/ T2
*) is given by:
T1,T
2 (sec
onds
)
Molecular correlation time, τc (seconds)
B0 (Tesla)
1.0
0.1
2.0
4.7
9.4
Small molecules (water)
Medium-sized molecules (lipids)
Large-sized molecules (proteins)
T1
T2
)(2)(2)(2)(2*2
11111
DIFFUSIONLITYSUSCEPTIBIOUSINHOMOGENEINTRINSIC TTTTT+++= (1.23)

Basic Principles of MRI 19 In addition to the intrinsic fields that contribute to T2, inhomogeneities in the main magnetic field Bo,
local magnetic field inhomogeneities arising from differences in magnetic susceptibility (e.g., at air-
tissue interfaces), and molecular diffusion in the presence of magnetic field inhomogeneities all
result in loss of phase coherence among the individual nuclear MDMs as they precess in the
transverse plane. Ideally, it would be desirable to have T2* dominated by intrinsic field effects (i.e.,
only the first term on the right-hand side of Eq. 1.23). Although the other terms in Eq. 1.23 can
often contribute significantly to the decay of the transverse magnetization, there are compensatory
measures that can be taken to mitigate their effects (discussed in the next section). The effect of T2*
on the FID signal is shown in Figure 1-12.
Figure 1-12: Two FID envelopes, one with a decay envelope dominated by T2 effects (spin-spin interactions) only, the
other dominated by T2* effects (spin-spin interactions, magnetic field inhomogeneities, susceptibility, and diffusion).
e-t/T2
e-t/T2*
Sign
al A
mpl
itude
(Arb
itrary Uni
ts)
t

Basic Principles of MRI 20 1.5.2 The Spin-Echo RF Pulse Sequence
There are no experimental methods for removing the intrinsic-field effects from the decay of the
transverse magnetization. However, magnetic field inhomogeneities can be corrected using the spin-
echo RF pulse sequence. Magnetic field inhomogeneities arise from imperfections in the main Bo
field as well as local (within the sample) magnetic field inhomogeneities that are due to differences
in magnetic susceptibility at the interface of two dissimilar materials (e.g., at air/tissue interfaces).
To understand how the spin-echo RF pulse sequence works, consider a race-track analogy
with four runners of varying abilities (Runner #4 > #3 > #2 > #1). Before the start of the race, the
runners position themselves at the appropriate starting positions and can be considered to be ‘in
phase’ with each other. At the sound of the starter’s gun the runners are off. After 15 seconds, the
runners are given a signal to turn around and head back to the starting line, running at the same
speed as they were during the first 15-second interval. After another 15 seconds, the runners return
to exactly the same starting positions (i.e., they return to their ‘in phase’ positions). This mock race
is depicted in Figure 1-13:

Basic Principles of MRI 21
Figure 1-13: Mock foot race of four runners of varying abilities (Runner #4>#3>#2> #1). The runners are “in phase”
with each other at the start of the race. Fifteen seconds into the race, the runners are given a signal to turn around and
head back to the starting line. Fifteen seconds later, the runners are back “in phase” with each other at their original
starting positions.
The mock foot race depicted in Figure 1-13 can be extended to the transverse magnetization vector
created after a 90° pulse is applied to Mo (i.e., Mz is moved completely into the transverse plane
leaving only Mxy) in the rotating frame of reference. Following the 90° pulse, the in-phase Mxy
magnetization vector begins to precess in the transverse plane. As individual nuclear MDMs within
the spin ensemble experience small magnetic field differences, some precess faster than others
resulting in a loss of phase coherence due to T2* effects. After a time (TE/2), the analogous foot race
‘turn around!’ signal is given to the dephasing nuclear MDMs in the form of a 180° RF pulse. The
START
1 2 3 4
START + 15 seconds
Turn Around!
1 2
3
4
START + 30 seconds
1 2 3 4

Basic Principles of MRI 22 RF pulse rotates each nuclear MDM 180° about the x′ axis, effectively reversing the relative
positions of the nuclear MDMs. After another TE/2 time period, all of the nuclear MDMs come
back into phase producing a ‘spin-echo’ signal. The spin-echo signal looks similar to two FIDs back
to back. At this point, the transverse magnetization vector is only attenuated by the intrinsic T2
relaxation effects. The process of spin-echo formation is shown graphically in Figure 1-14 using
vectors in the rotating frame of reference:
Figure 1-14: Formation of the spin-echo by a sequence of 90° - 180° RF pulses. This experiment was first performed by
Hahn and colleagues in 1950 (4).
90°x RF Pulse
x′ y′
z′
x′ y′
z′
+ Time
180x° RF Pulse @ time TE/2
x′ y′
z′ Mo
Mxy
z′
y′ x′
+ Time TE/2
x′ y′
z′ Spin dephasing
Dephased spins ‘flipped’ about x′ axis
Spin-echo formation @ time TE
=
fast slow
fast
slow
Bo

Basic Principles of MRI 23 1.6 Measurement of Relaxation Times
Measurement of T1 and T2 relaxation times can be accomplished using several methods. Inversion
recovery and the Carr-Purcell-Meiboom-Gill pulse sequence for T1 and T2 measurements,
respectively, are very robust and commonly used methods for relaxation measurements.
1.6.1 T1 Relaxation Measurement Techniques
Measurement of the T1 relaxation time requires that a series of data is acquired at various time
intervals and then fitted to a model equation to estimate the T1 relaxation time constant. The model
fitting equation can be derived by solving the Bloch equation for the longitudinal (Mz) component of
magnetization under a particular set of experimental conditions. For example, recall that the Bloch
equation describing the T1 relaxation time (Eq. 1.19) is as follows:
'11
0 )( y
zz MBT
MM
dt
dMγ−
−−= .
Solving this equation for the case where the Mz magnetization recovers from zero (i.e., immediately
following a 90o RF pulse) for a system that was initially at the Boltzmann equilibrium yields the
following expression:
)1()( 10
T
t
z eMtM−
−= , (1.24)
where Mz(t) is the magnitude of the longitudinal magnetization at some time, t, following the
application of the 90o RF pulse, Mo is the Boltzmann equilibrium magnetization, and T1 is the
longitudinal relaxation time constant. The recovery of the longitudinal magnetization is a first-order
rate process and thus is well-modeled by an exponential function. Consequently, one way to think of
T1 is that it is the time required for the longitudinal magnetization to recover 63% of its original
equilibrium value after perturbation by an RF pulse. A plot of the longitudinal magnetization as a
function of time under these experimental conditions is shown in Figure 1-15.

Basic Principles of MRI 24
0.63*M0
M0
0
M0(1-e-1)
Sign
al Int
ensity
Time
Figure 1-15: Recovery of longitudinal magnetization after the rotation of Mo into the xy plane by a 90o RF pulse as
modeled by Eq. 1.24. The T1 ‘time’ is the time at which longitudinal magnetization recovers to 63% of its original value.
Alternatively, if Eq. 1.19 is solved for the case where the Mz magnetization recovers from -Mo (i.e.,
immediately following a 180o inversion RF pulse) for a system that was initially at the Boltzmann
equilibrium, then the model equation is slightly different from that in Eq. 1.24. In this case, an
additional factor of 2 precedes the exponential term as shown in the following expression:
)21()( 10
T
t
z eMtM−
−= . (1.25)
A plot of the longitudinal magnetization as a function of time under these experimental conditions is
shown in Figure 1-16.

Basic Principles of MRI 25
Figure 1-16: Recovery of longitudinal magnetization after rotation by a 180o RF pulse onto the –z axis as modeled by
Eq. 1.25. In this case, the 180o RF pulse ‘inverts’ the magnetization; hence the term ‘inversion recovery’.
1.6.2 T2 Relaxation Measurement by Carr-Purcell-Meiboom-Gill Pulse Sequence
Application of successive 180° RF pulses following a 90°-180° pulse sequence will result in a train
of spin-echoes whose amplitudes decay exponentially after each 180° RF pulse. The decay rate of
each individual echo is governed by T2* effects while the decrease in amplitude of each successive
echo is governed by intrinsic T2 effects. The echo train depicted in Figure 1-17 was first
demonstrated by Carr and Purcell in 1954 (5).
Time
M0(1-2e-1) 0.26 * M0
0
M0

Basic Principles of MRI 26
Figure 1-17: After an initial 90° and 180° RF pulse one spin-echo is formed at time TE after the 90° pulse. Continued
application of successive 180° pulses, at time intervals equal to TE after the initial 180° pulse, results in a train of spin-
echoes each of which reforms and decays according to the T2* of the sample. The decrease in amplitude in each
successive spin-echo is attributable to the intrinsic T2 relaxation and, in some cases, to T2 relaxation combined with
molecular diffusion effects.
The echo train length in a Carr-Purcell echo train is determined by the T2 of the sample and the
magnitude of the signal is given by:
( )( )
−
−
= 32
22
32 τγτ DtG
T eetS
where G(t) is any magnetic field gradient that affects the nuclear magnetic moments in the sample, D
is the self-diffusion coefficient of the sample, and τ = TE/2 (as shown in Figure 1-17). To reduce the
effects of diffusion (more on this topic in Section 2.7), the time τ should be minimized (on the order
of 500-1000 µsec) to ensure the decaying signal amplitude of each echo in a Carr-Purcell echo train
is due mostly to the intrinsic T2 relaxation time.
One disadvantage of the Carr-Purcell sequence is that imperfections in the applied 180° RF
pulses can give erroneous estimates for the T2 relaxation time. This issue was addressed by Carr and
Purcell in 1958, however, a more elegant solution was proposed by Meiboom and Gill in the same
year (6). By changing the phase of the 180o RF pulse so that the B1 field is oriented along the y-axis
(1.26)
TE
RF
180x° 180x° 180x°
90x°
e-t/T2 * e-t/T
2
TE TE

Basic Principles of MRI 27 (rather than the x-axis as shown in Figure 1-17), flip-angle errors associated with imperfections in
the 180o RF pulses are compensated for by the even-order echoes. Consequently, the Carr-Purcell
Meiboom-Gill (CPMG) pulse sequence is the preferred method for accurately measuring the
intrinsic T2 relaxation times.
2.0 Magnetic Resonance Imaging
2.1 Spatial Localization of a MR Signal
To obtain an MR image from biological samples requires encoding of the spatial information into
the MR signal. Within the plane of the image, spatial encoding in two dimensions is required. The
two most common methods of spatially encoding the MR signal are the so-called frequency-
encoding and phase-encoding schemes. Frequency- and phase-encoding in MRI requires the
application of linear magnetic field gradients across a particular region of interest (or field of view)
within the sample. The linear magnetic field gradients allow the spatial location of nuclei in the
sample to be uniquely encoded into the frequency and phase of the measured MRI signal.
2.1.1 Magnetic Field Gradients for MRI
The magnetic field gradients used for MR imaging are created by unique sets of copper coils
mounted on a former within the bore of a (typically) superconducting MRI magnet. MR images can
be generated in any plane of a 3-D sample by separately controlling currents in each of the X,Y, or Z
gradient coils. The typical geometries of the gradient coils are shown in Figure 1-18:
Figure 1-18: Typical geometries and orientations of copper conducting bands (or ‘coils’) that, when energized, produce
linear magnetic field gradients in the X,Y, and Z directions, respectively. Depending on the imaging sequence used,
electric current in the gradient coils can be (for very short periods of time) as high as 30 Amperes (and higher for echo-
planar imaging applications) in order to create linear gradients with strengths of approximately 10-30 mT/m.
x
z
y
Bore of Magnet
X Gradient Coils
x
z
y
Y Gradient Coils
x
z
y
Z Gradient Coils

Basic Principles of MRI 28
The magnetic field gradient produced by each of the gradient coils shown in Figure 1-18 is
superimposed on the main Bo field to create a magnetic field that varies linearly in strength as a
function of distance from the center of the magnet. Consequently, in the presence of a magnetic field
gradient, the nuclei placed within the bore of the magnet will have precessional frequencies that vary
linearly with respect to their position within the magnet. A ‘steeper’ gradient will allow for a greater
difference in precessional frequencies for nuclei that are closely spaced; allowing for higher spatial
resolution in MR images. In addition to encoding spatial information in the phase and frequency of
the MR signal, RF pulses – applied in concert with magnetic field gradients – can be used to
selectively excite nuclei within a particular region of the sample. This approach essentially provides
the 3rd dimension of spatial localization for the MR image (with frequency and phase encoding
providing spatial localization in the 2-dimensional plane of the image). “Slice selection” is achieved
by applying amplitude-modulated RF pulses in conjunction with a linear magnetic field gradient.
The ‘bandwidth’ (BW) of the RF pulse together with the slope of the gradient determines the
thickness of the desired MR image ‘slice’. The co-dependency of MR image slice thickness, gradient
slope, and RF BW is shown in Figure 1-19.
Figure 1-19: The MR slice thickness can be adjusted by varying the slope (i.e., strength) of the magnetic field gradient
(blue lines) for a given RF excitation bandwidth (BW). Adjustment of ωo, the resonant (Larmor) frequency, controls the
position of the slice. The slice thicknesses that arise from the two different gradient strengths are given by ∆x1 and ∆x2,
respectively. Note that slice thickness is also dependent on RF pulse bandwidth (BW).
x (or y or z) coordinate of slice
ωo BW
gradient slope for slice 1
∆x1
∆x2
gradient slope for slice 2

Basic Principles of MRI 29
As can be seen in Figure 1-19, the slice profiles defined by ∆x1 and ∆x2 are rectangular in
shape. To excite a rectangular bandwidth in the “frequency domain” requires that the RF pulse be
amplitude modulated based on the Fourier equivalent in the “time domain” (where the RF pulse is
generated). In this case, the Fourier transformation can be used to determine the specific functional
form of the RF amplitude modulation needed to excite the desired bandwidth of frequencies.
2.1.2 The Fourier Transform
The Fourier transform (FT), named after the French mathematician Jean Baptiste Joseph Fourier
(1768-1830), is a mathematical operation that transforms a time-domain signal into its equivalent
frequency-domain representation. Consider a signal in the time domain oscillating at only one
frequency; the FT of this signal has a peak at that particular frequency. If a time-domain signal
oscillates at two or more frequencies, the FT of the signal will have peaks at the unique frequencies
in the signal. The amplitude of the FT peaks provides information about the strength of the time-
domain signal at that particular frequency. Figure 1-20 and 1-21 show examples of the FT of two
basic time-domain signals (sinusoids).

Basic Principles of MRI 30
Figure 1-20: Oscillating time domain signal with a period of 25 ms and its corresponding Fourier transform
(FT).
Figure 1-21: Combination (multiplication) of two oscillating time-domain signals with periods of 10 ms and 100 ms. The
signal with the dark line is the combined signal for which the FT is shown in the adjacent figure. Note the difference in
amplitude in the two peaks of the FT and the difference in amplitude of the two time-domain signals (the amplitudes of
the FT representation are not exact but are qualitative for display purposes).
The FT is used in a wide array of signal processing applications, but, for the purposes of this thesis
(and for basic MR theory), it is sufficient to look at a limited number of FT properties. The interested
reader is referred to Oppenheimer and Schafer (7) for a more detailed description of the FT (DFT,
FFT) and its properties and applications to digital signal processing.
FT
0 100 Time (ms)
0 100 Frequency (Hz) 40
FT
0 100 Frequency (Hz)
10 0 100 Time (ms)
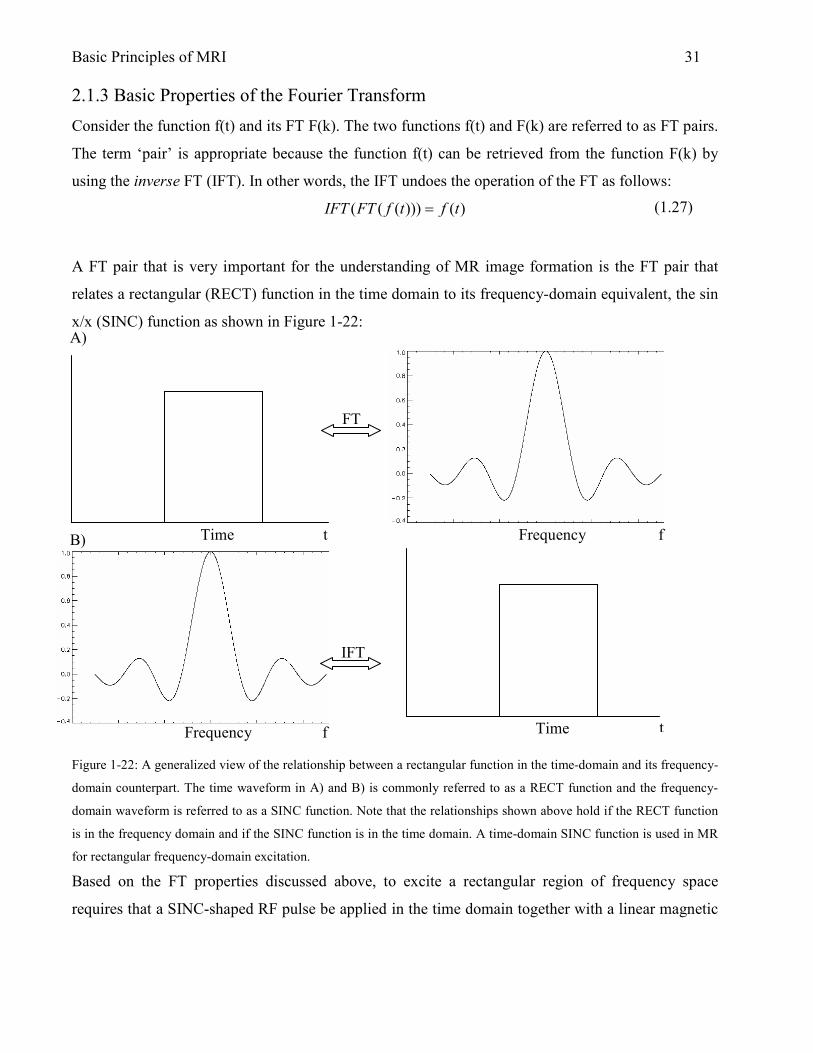
Basic Principles of MRI 31 2.1.3 Basic Properties of the Fourier Transform
Consider the function f(t) and its FT F(k). The two functions f(t) and F(k) are referred to as FT pairs.
The term ‘pair’ is appropriate because the function f(t) can be retrieved from the function F(k) by
using the inverse FT (IFT). In other words, the IFT undoes the operation of the FT as follows:
)()))((( tftfFTIFT =
A FT pair that is very important for the understanding of MR image formation is the FT pair that
relates a rectangular (RECT) function in the time domain to its frequency-domain equivalent, the sin
x/x (SINC) function as shown in Figure 1-22:
Figure 1-22: A generalized view of the relationship between a rectangular function in the time-domain and its frequency-
domain counterpart. The time waveform in A) and B) is commonly referred to as a RECT function and the frequency-
domain waveform is referred to as a SINC function. Note that the relationships shown above hold if the RECT function
is in the frequency domain and if the SINC function is in the time domain. A time-domain SINC function is used in MR
for rectangular frequency-domain excitation.
Based on the FT properties discussed above, to excite a rectangular region of frequency space
requires that a SINC-shaped RF pulse be applied in the time domain together with a linear magnetic
FT
f t Time Frequency
A)
B)
IFT
t Time Frequency f
(1.27)

Basic Principles of MRI 32
Time 0 t
field gradient of the appropriate strength. MR hardware can approximate the SINC function in the
time domain by using a series of short ‘hard’ or rectangular pulses as shown in Figure 1-23:
Figure 1-23: Narrow rectangular pulses of varying
amplitude and polarity can be combined to approximate
a SINC function in the time-domain. A perfect
rectangular pulse in the frequency-domain is not possible
because a SINC pulse in the time domain must be
truncated to a finite length.
2.1.4 Slice Select Gradients and the RF Excitation Pulse
The function of slice-select gradients is to change the Larmor frequency of spins across the sample
in a position dependent manner as shown in Figure 1-24. Slice-select gradients change the Larmor
frequency of spins across the sample to allow a RF excitation pulse to transfer energy to one
particular slice. The slice-select gradient and RF excitation pulse are typically applied
simultaneously during slice selection.

Basic Principles of MRI 33 A) Selection of one slice of a particular thickness in a hypothetical human head.
2.1.4.1 Slice Dephasing
Ideally, after application of a 90° RF excitation pulse, all nuclear MDMs are precessing at the same
frequency in the transverse plane and are in phase with each other. In the case of a slice selection
pulse, however, this is not true. As the 90° RF excitation pulse begins to rotate magnetization into
the transverse plane, the nuclei experience a large magnetic field inhomogeneity from the slice
selection gradient since it is being applied at the same time. The result is that the nuclear MDMs
quickly dephase; significantly reducing the amount of transverse magnetization available for
subsequent spatial encoding and signal detection. Fortunately, the dephasing effect of the slice-
selection gradient can be reversed by applying an additional magnetic field gradient pulse
immediately following the 90° RF excitation pulse. In order to rephase all of the nuclei within the
z1 z2 z3
Magnet center (‘isocenter’)
-z +z z=0
ω2 ω3
Resonant Frequency
ω0 ω1
RF Excitation time
freq
ω3
BW
B) Typical pulse sequence diagram for slice selection and excitation.
RF
GZ
GY
GX
t
t
t
t
slice-select spin re-phasing
Figure 1-24: A) Schematic of slice-select gradient and RF
excitation pulse in hypothetical human head. When the RF
excitation pulse is generated with a center frequency at ω3 ±
BW/2, the spins within a slice at a particular location along the
z-axis are excited. B) A pulse-sequence diagram indicating the
timing of the RF pulse and the slice-select gradient. The need
for a ‘re-phasing’ gradient is discussed in Section 2.1.4.1.
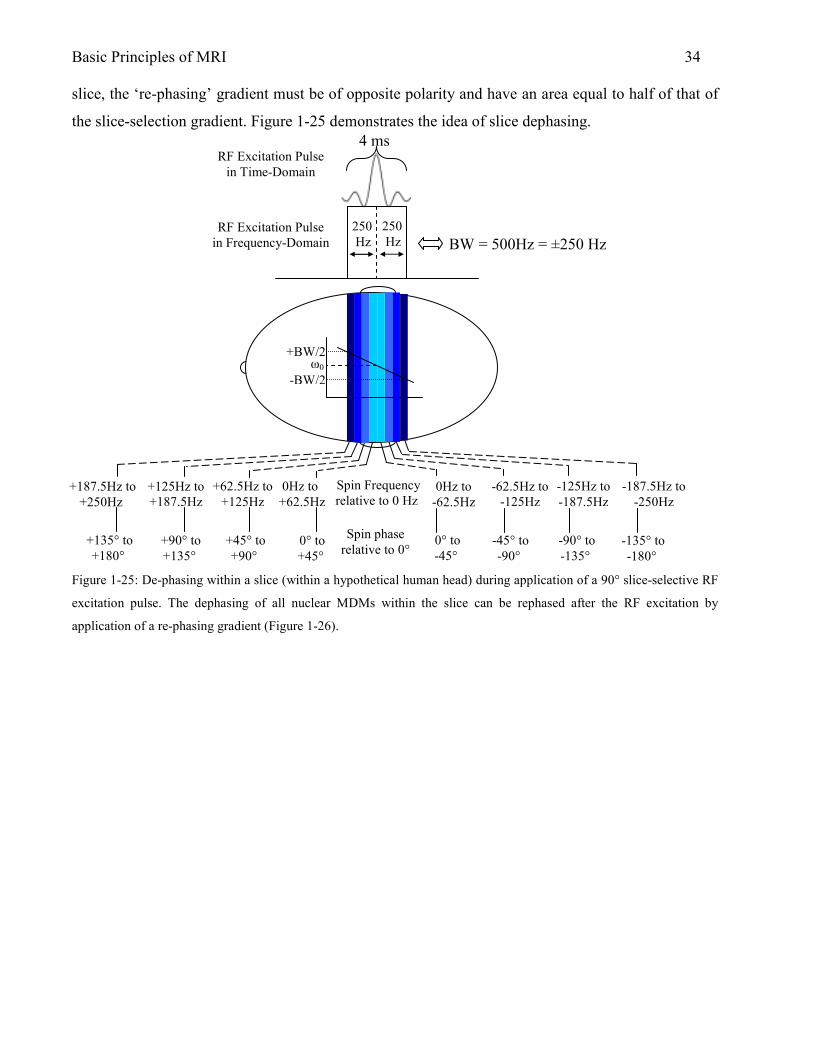
Basic Principles of MRI 34 slice, the ‘re-phasing’ gradient must be of opposite polarity and have an area equal to half of that of
the slice-selection gradient. Figure 1-25 demonstrates the idea of slice dephasing.
Figure 1-25: De-phasing within a slice (within a hypothetical human head) during application of a 90° slice-selective RF
excitation pulse. The dephasing of all nuclear MDMs within the slice can be rephased after the RF excitation by
application of a re-phasing gradient (Figure 1-26).
slice-select gradient
4 ms
BW = 500Hz = ±250 Hz
RF Excitation Pulse in Time-Domain
RF Excitation Pulse in Frequency-Domain
+187.5Hz to +250Hz
+125Hz to +187.5Hz
+62.5Hz to +125Hz
0Hz to +62.5Hz
0Hz to -62.5Hz
-62.5Hz to -125Hz
-125Hz to -187.5Hz
-187.5Hz to -250Hz
Spin Frequency relative to 0 Hz
+135° to +180°
+90° to +135°
+45° to +90°
0° to +45°
0° to -45°
-45° to -90°
-90° to -135°
-135° to -180°
Spin phase relative to 0°
ω0 +BW/2
-BW/2
250 Hz
250 Hz

Basic Principles of MRI 35
Figure 1-26: Slice-selection re-phasing gradient used to restore the phase coherence of the transverse magnetization
following de-phasing due to the slice-selective RF pulse. For complete restoration of phase coherence, the re-phasing
gradient must have an amplitude-duration product (area under curve) equal to half that of the slice-selective RF
excitation pulse. Note that the re-phasing gradient can have any shape (not necessarily rectangular) as long as the
amplitude-duration product is equal to the amplitude-duration product of half of the slice-selective RF pulse.
2.2 Spatial Encoding of the MR Signal
The MR signal received by the RF coil includes the vector sum of all signals from all voxels within a
particular FOV. The problem arises then as to how to make the signal from each voxel spatially
distinct in order to create a two-dimensional image. Considering that all time-domain signals have
associated amplitude, frequency, and phase, a means of encoding spatial information into some of
these parameters is needed for MRI. Since the amplitude of the signal is used to create signal-
intensity contrast between different regions of the image, only the frequency and phase of the MR
signal are available for spatial encoding.
4 ms
A
2 ms A/2
OR
4 ms
Equal Area Opposite Sign
Reversal of slice select gradient
2 ms
A
250 Hz
250 Hz

Basic Principles of MRI 36 2.2.1 Phase-Encoding
After slice-selective excitation and re-phasing of nuclei within a particular slice, the phase and
frequency of the transverse magnetization can then be used to encode the 2-dimensional spatial
information in the plane of the slice. If a magnetic field gradient is applied for a short period of time
in a different direction (relative to that of the slice-selection gradient), the nuclei will begin to
precess at different rates depending on their position along that gradient direction. When the gradient
is turned off, the nuclei will return to their original precession frequency. However, the relative
phase between the precessing nuclei will be different, depending upon their relative position along
the phase-encoding-gradient direction. Consider a hypothetical slice through a human head
immediately following slice selection perpendicular to the z-gradient direction. The plane of the slice
is divided into rows and columns which represent individual volume elements (or voxels) within the
plane of the image. At Time 1 in Figure 1-27, all spins are in-phase and are precessing (or are about
to precess) at the same frequency. At Time 2, a phase-encoding gradient is applied along the y-axis
for a finite period of time, producing a phase shift among the nuclei in various voxels, the magnitude
of which depends upon their relative position along the phase-encoding gradient direction. At Time
3, immediately after the phase-encoding gradient has been turned off, the spins resume the same
precessional frequency they had at Time 1, however, the phase imparted to the nuclei by the phase-
encoding gradient is retained and measured during the detection period.

Basic Principles of MRI 37
Figure 1-27: Phase-encoding of nuclei in a sample based on position along a gradient in the y-direction. A phase-
encoding gradient is applied for a finite time period, causing the nuclei to acquire a phase-shift that is unique to their
particular position along the magnetic field gradient direction (Time Point 2). At Time Point 3, the phase-encoding
gradient is turned off, however, the nuclei retain their respective phase shifts acquired during the second time period.
2.2.2 Frequency-Encoding
Just as the y-gradient was used for phase-encoding in the previous section, the x-gradient can be
used to spatially encode the remaining dimension of information. The concept of frequency-
encoding is similar to phase-encoding and can be demonstrated again using Figure 1-27. Observation
of Time Point 2 in Figure 1-27 reveals a difference in spin frequency between rows as a result of the
brief y-gradient. To make each voxel unique in phase and frequency it is clear that a gradient along
the x-axis (Figure 1-27) will also change the frequency of precession within each voxel as a function
of position along the x-gradient axis. For generation of an MR image, the frequency-encoding
gradient must be 1) applied in a direction perpendicular to the phase-encoding gradient and 2)
applied in concert with the acquisition (digitization) of the MR signal (the frequency-encode
gradient is therefore sometimes referred to as the read or readout gradient). To generate a MR
image, phase- and frequency-encoding can be used together with slice-selective RF pulses in a
carefully timed manner. The timing of the slice-selective RF pulses and the phase and frequency-
Time Point 1: immediately after slice-selective RF excitation and re-phasing; all nuclei in each voxel precess at the same rate.
Time Point 2: phase-encoding gradient (y) applied for finite time period; nuclei in each voxel have different precession rates based on relative position along gradient axis.
Time Point 3: phase-encoding gradient off; nuclei in each voxel return to original precession rates but retain relative phase differences accumulated during the phase-encoding period.
y
x

Basic Principles of MRI 38 encoding gradients can be diagrammed using a so-called pulse sequence. The spin-echo pulse
sequence is described in the next section.
2.3 Spin-Echo MRI
The MR spin-echo method is one of the most commonly-used methods for generating MR
images. The RF and gradient pulses needed to create the spin-echo are played out at specific time
intervals diagrammed by a pulse sequence. The MR signals generated and acquired during the
execution of the pulse sequence are stored in a 2-dimensional matrix commonly referred to as the k-
space (or time-domain) representation of the raw data.
2.3.1 Spin-Echo MRI Pulse Sequence
The spin-echo pulse sequence shown in Figure 1-28 represents the timing diagram necessary to
generate a MR signal that will be stored in one ‘row’ in ‘k-space,’ which is the time-domain
representation of the image data. Most of the components of Figure 1-28 are those discussed in
previous sections. The portions of Figure 1-28 that have not been mentioned are 1) the gradient
representation along the ‘GY’ axis and 2) the positive gradient pulse applied along the x direction
before the 180° refocusing pulse. The amplitude of the phase-encoding gradient pulse shown along
the ‘GY’ axis changes each time the pulse sequence is repeated (typically 128 or 256 times for an
image with 128x128 or 256x256 matrix size, respectively). The positive GX gradient pulse in Figure
1-28A serves the same function as the re-phasing portion of the slice-selection gradient. In this case,
however, the re-phasing gradient compensates for de-phasing that will occur during the subsequent
acquisition of the signal during the frequency-encoding (i.e., readout) period; when the frequency-
encoding gradient is being applied. The polarity of the de-phasing gradient is the same as that of the
frequency-encoding gradient when the de-phasing gradient precedes the 180° refocusing pulse (since
the 180o pulse effectively reverses the precessional direction of the de-phasing gradient), as shown in
Figure 1-28A. If the de-phasing gradient pulse immediately precedes the frequency-encoding period
(as shown in Figure 1-28B), then its polarity is opposite that of the gradient applied during the
frequency-encoding period. When the area under the de-phasing gradient pulse is half that of the
frequency-encoding-gradient pulse, the nuclei will come back into phase (i.e., refocus) resulting in a
gradient-echo (which is also the same point at which the RF spin-echo is formed). The MR signal
receiver is turned on at the beginning of the readout-gradient period in order to acquire the entire

Basic Principles of MRI 39
Figure 1-28: A) Timing diagram of the spin-echo MR pulse sequence. A slice-selective 90o RF pulse creates transverse
magnetization within the selected slice. The amplitude of the phase-encoding gradient (GY in this case) is varied
incrementally between successive repetition time (TR) intervals as a part of creating a 2-dimensional k-space
representation of the raw time-domain data (one row at a time). The second dimension of spatial information in the
plane of the image is obtained by acquiring the spin-echo signal in the presence of a frequency-encoding gradient. In A),
the de-phasing gradient for the frequency-encoding period is applied before the 180° refocusing pulse. Note that the FID
generated after the slice rephase gradient (GZ) is not measured at that point so as to allow for subsequent phase- and
frequency-encoding of the measured spin-echo signal. The time between the middle of the 90o slice-selective RF pulse
and the apex of the spin-echo signal is referred to as the time to echo or TE time. EAOS = Equal Area Opposite Sign,
EA = Equal Area. B) The spin-echo pulse sequence can also be implemented by applying a de-phasing gradient just prior
to the frequency-encoding period; however, in this case, the polarity must be opposite to that of the readout gradient.
MR Signal
GX
spin de-phase spin re-phase
EA
GY
RF
GZ
slice re-phase
EAOS
MR Signal Receiver ON
90° 180°
A)
B)
frequency-encode (readout) gradient
GX
spin de-phase
spin re-phase
EAOS
Spin-Echo
TE
FID

Basic Principles of MRI 40 echo. The digitized spin-echo signal for a particular value of the phase-encoding gradient is used to
fill one row of k-space. The sequence is then repeated, incrementally varying the amplitude of the
phase-encoding gradient, until the desired number of k-space rows has been acquired.
To better understand how the entire k-space acquisition process works; consider the series of
spin-echo pulse sequences in Figure 1-29. The time between each 90o RF pulse is referred to as the
repetition time or TR. Each new TR period begins with a 90o RF pulse and the only difference from
one TR interval to the next is a change in the amplitude of the phase-encoding gradient (e.g., GY in
Figure 1-29). For the first TR period in the series, the phase-encoding gradient amplitude is typically
at its most extreme (negative or positive) value. At the end of the first TR interval, the data acquired
during the readout-gradient period is stored as the outer-most (in this case ‘bottom’) row or line of k-
space. During each subsequent TR interval, a new line of k-space is filled which corresponds to the
particular value of the phase-encoding-gradient amplitude during that interval. This process
continues until the desired image resolution in the phase-encoding direction has been achieved. For
example, a spin-echo image with a 256x256 matrix will have 256 different phase-encoding steps
(requiring 256 TR intervals), with the spin-echo signal being digitized with 256 points during the
frequency-encoding period of each TR interval. Note in Figure 1-29 that the amplitude of the
received MR signal increases as the phase-encoding-gradient amplitude decreases. This is because
the phase-encoding-gradient pulse, just like any other gradient, causes de-phasing of the signal
(proportional to the area of the pulse) and a concomitant reduction in signal amplitude. The outer
lines of k-space contain the high-spatial-frequency information (e.g., sharp edges) in the image. The
center lines of k-space contain the low-spatial-frequency and signal-intensity information within the
image (e.g., general shapes in the image (8)).

Basic Principles of MRI 41
RF
GZ
GX
Signal
GY
TR
90° 180° 90° 180° 90° 180° 90° 180° 90° 180°
Figure 1-29: Spin-echo MRI pulse sequence and placement of raw-data into k-space as a function of the phase-encoding-
gradient amplitude. Each line (row) of k-space corresponds to a particular value of the phase-encoding-gradient amplitude
during the respective TR interval. Large phase-encoding-gradient amplitudes result in progressively smaller MR signals
due to the increased de-phasing of the transverse magnetization during the phase-encoding period. Consequently, the center
lines of k-space, where the phase-encoding-gradient is low, contain the low-spatial-frequency and signal-intensity
information in the image whereas the high-spatial-frequency information is contained in the outer lines of k-space.
kx
ky

Basic Principles of MRI 42
The MR data acquired in k-space are the 2-dimensional time-domain representation of the
data. The k-space data are then converted into the spatial (i.e., frequency) domain via a 2-
dimensional Fourier transformation in order to create the MR image. The k-space data acquired in a
typical MRI experiment can be represented as shown Figure 1-30. Raw data acquired during each
step of the phase-encoding process (e.g., during the acquisition/readout period of a TR interval)
comprise a row of complex data points from the digitized spin-echo signal. The real (‘Re’) and
(‘Im’) part of each complex data point arise from the fact that the signal is measured in quadrature;
using two channels that are 90o out of phase with each other.
Figure 1-30: Raw MR data storage format typically used during the acquisition of 2-dimensional k-space data for a
128X128 image. Each data point is acquired using quadrature detection (i.e., two receiver channels that are 90o out of
phase with each other) and stored as a complex (real and imaginary) pair. A complex 2-dimensional Fourier transform is
then used to convert the k-space data into the spatial (i.e., frequency) domain.
Following a complex 2-dimensional Fourier transformation, each point in the MR image is still
represented as a complex pair. However, for display purposes, the real and imaginary parts of the
data are separated and only the real part is used for image display.
2.4 The Gradient-Echo and Gradient-Echo (GRE) MRI
The gradient-echo (GRE) method is frequently used for MRI applications that require fast
imaging times. Formation of a GRE has already been discussed to some extent (e.g., in the context
of Figure 1-28B), but will be revisited here for clarity. Consider Figure 1-31, where an echo is
shown forming after de-phasing and re-phasing of nuclei using a magnetic field gradient. Note that
the echo is formed at the point where the duration-amplitude product (area) of the de-phasing
Re Re Re Re Re Im Im Im Im Im …….. Re Re Re Re Re Im Im Im Im Im ……..
Phase-Encode Step #1
Phase-Encode Step #2
∆Tsample
Phase-Encode Step 128
Digital Sample #1 (acquired during readout-gradient period)
Digital Sample #128 (acquired during readout-gradient period)

Basic Principles of MRI 43 gradient pulse is equal to the duration-amplitude product (area) of the first half of the readout (or, in
this case, re-phasing) gradient pulse.
Figure 1-31: Formation of a gradient echo (GRE) by reversing the gradient polarity. A GRE is formed when the
duration-amplitude product of the de-phasing gradient is equal to the duration-amplitude product of the first half of the
readout gradient pulse.
Since the GRE imaging pulse sequence does not use a 180° RF pulse to refocus transverse
magnetization, the echo time (i.e., TE) of the imaging sequence can be significantly reduced. To
further minimize the TE time, the re-phasing gradient pulses for both slice-selection and frequency-
encoding can be applied simultaneously in the phase-encoding-gradient period. To reduce the
imaging time by decreasing the repetition time (TR), the RF pulses used for GRE imaging typically
do not rotate longitudinal magnetization completely into the transverse plane (i.e., the flip angle – α
in Figure 1.32 – is generally much less than 90o). As a result, a substantial fraction of the
longitudinal magnetization remains along the z-axis. In this case, the longitudinal magnetization
does not require as much time to recover to the Boltzmann equilibrium (relative to a 90o RF pulse)
and successive applications of the reduced-tip-angle pulse can be applied more frequently.
A
2 ms A/2
4 ms
Equal Area Opposite Sign
MR Signal
GX (readout)
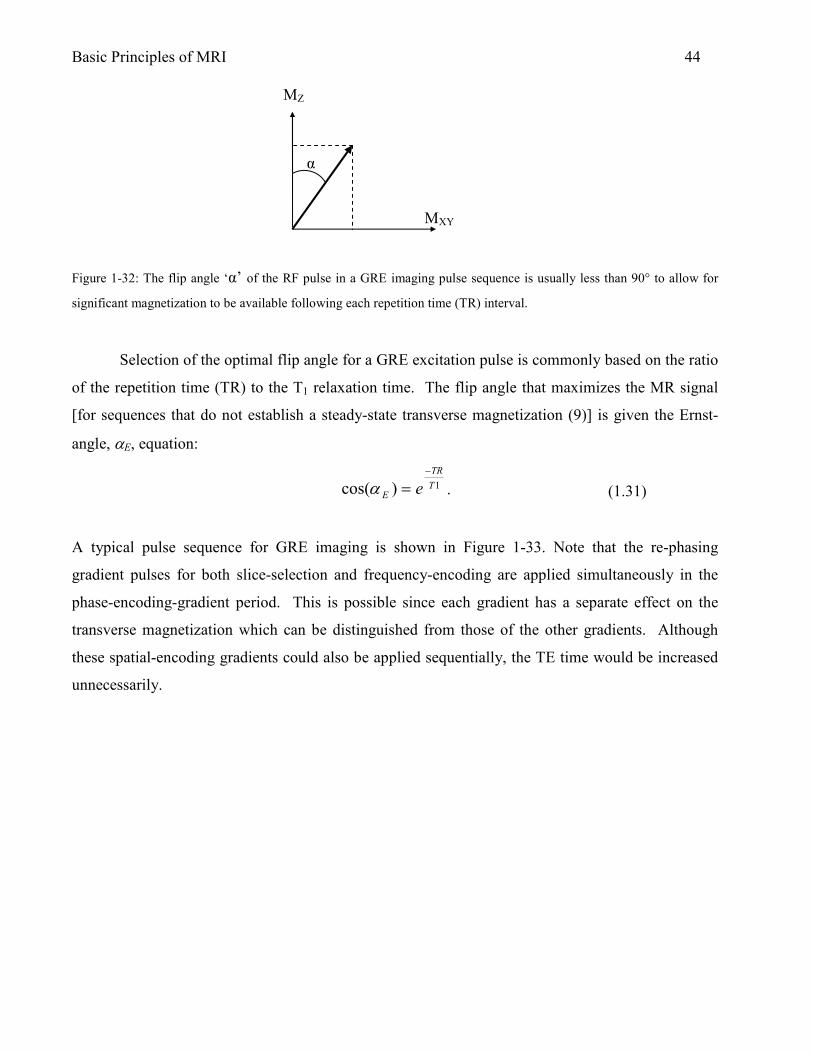
Basic Principles of MRI 44
Figure 1-32: The flip angle ‘α’ of the RF pulse in a GRE imaging pulse sequence is usually less than 90° to allow for
significant magnetization to be available following each repetition time (TR) interval.
Selection of the optimal flip angle for a GRE excitation pulse is commonly based on the ratio
of the repetition time (TR) to the T1 relaxation time. The flip angle that maximizes the MR signal
[for sequences that do not establish a steady-state transverse magnetization (9)] is given the Ernst-
angle, αE, equation:
1)cos( T
TR
E e
−
=α .
A typical pulse sequence for GRE imaging is shown in Figure 1-33. Note that the re-phasing
gradient pulses for both slice-selection and frequency-encoding are applied simultaneously in the
phase-encoding-gradient period. This is possible since each gradient has a separate effect on the
transverse magnetization which can be distinguished from those of the other gradients. Although
these spatial-encoding gradients could also be applied sequentially, the TE time would be increased
unnecessarily.
(1.31)
α
MXY
MZ

Basic Principles of MRI 45
Figure 1-33: Gradient-echo (GRE) MRI pulse sequence. The flip angle, α, of the slice-selective RF pulse is typically less
than 90o so that the residual longitudinal magnetization can recover to the Boltzmann equilibrium in a shorter period of
time. As a result, the repetition time (TR) can be shortened, significantly reducing the total imaging time.
2.5 Image Contrast Based on Tissue T1 and T2 Relaxation Times
Most tissue contrast in MR images is derived from differences in tissue proton density
(N(H)) and the T1 and T2 relaxation times. MR images with tissue contrast (i.e., signal-intensity
differences) based on relative differences in N(H), T1, or T2 are referred to as N(H)-weighted, T1-
weighted, or T2-weighted images, respectively. For spin-echo MRI, the signal intensity in a voxel,
S(TE, TR) in Eq. 1.32, is dependent on the user-adjustable MRI parameters TE and TR as well as
tissue N(H), T1 and T2 (10):
212
)2/(
)1]([),( T
TE
T
TR
T
TETR
eeeHNTRTES
−−−−
+−= .
GY
RF
GZ
α°
GX
phase- encode
slice select
frequency- encode (readout)
MR Signal
TE
Spin Density Factor
T1 Factor
T2 Factor
(1.32)
α°
TR

Basic Principles of MRI 46 T1- and T2-weighted spin-echo imaging is commonly used for neurological applications in the brain
due to the large differences among T1 and T2 relaxation times between tissues. For example, the T1
value of white matter, gray matter and cerebrospinal fluid (CSF) in the brain is ~780 ms, ~920 ms,
and ~4000 ms, respectively, at 1.5T (11,12). The significant difference in T1 relaxation times
between brain white and gray matter makes it possible to differentiate between these tissues in a T1-
weighted MR image. Consider the T1 recovery curves in Figure 1-34. To optimize the T1-weighted
MRI contrast between the two tissues, a TR value is chosen that maximizes the signal-intensity
difference between the two curves. For the case shown in Figure 1-34 the optimal TR time is 850 ms
based on the TR that coincides with the apex of the signal-intensity difference curve. The optimal
TR, in this case, is also equal to the average of the tissue T1 values.
Figure 1-34: T1 recovery for white and gray matter in the human brain and difference in signal intensity between white
matter and gray matter as a function of TR. To produce the highest contrast between white and gray matter in a MR
image, a TR is chosen that maximizes the signal intensity difference between the two tissues. In this case, the TR that
maximizes the signal intensity difference between white and gray matter is also equal to the average value of the tissue
T1 values (850 ms).
M0
Net L
ongi
tudi
nal M
agne
tizatio
n
white matter T1 recovery
gray matter T1 recovery
TR time (seconds)
Signal intensity difference between white and gray matter
max
~ avg T1 value of white and gray matter
CSF T1 recovery

Basic Principles of MRI 47
2)1]([),( T
TE
eHNTRTES−
=
For a visual example, consider the images of human brain in Figure 1-35. In this case the TR values
were varied from 400 ms (leftmost image) to 6000 ms (rightmost image) while the TE value was
held constant at 20 ms. Contrast between white and gray matter is evident at TR/TE = 800/20 ms. At
TR/TE = 6000/20 ms the white/gray matter contrast appears reversed compared to the white/gray
matter contrast at TR/TE = 800/20 ms. MR images of brain acquired at TR/TE = 800/20 ms (and
400/20 ms) are primarily T1-weighted and at TR/TE = 6000/20 ms MR images are primarily N(H)-
weighted.
Figure 1-35: Series of adult human brain images to demonstrate changes in contrast between white and gray matter (and
CSF) as TR is changed (TE constant at 20 ms). The leftmost image (TR/TE = 400/20 ms) is primarily T1-weighted while
the rightmost image (TR/TE = 6000/20 ms) is primarily N(H)-weighted. In T1-weighted adult human brain images white
matter appears white (or relatively bright) and gray matter appears gray (or relatively dark). There is considerable
contrast between white and gray matter (as well as CSF) in the rightmost image due to differences in proton density
between the two tissue brain tissues as well as CSF. Images here were acquired using a 1.5T clinical scanner and have
resolution of approximately 940 µm.
To acquire T2-weighted spin-echo images, it is important to use long TR values to minimize the
effect of T1-weighting on the image. For example, notice that as the TR value approaches a value on
the order of 5T1, the “T1 factor” term in Eq. 1.32 approaches one. In that case, the MR signal
intensity within each voxel will depend primarily on the N(H) and T2 relaxation time of the tissue as
well as the TE value used in the spin-echo MRI pulse sequence as:
.
TR/TE = 400/20 ms
(1.33)
TR/TE = 800/20 ms TR/TE = 1600/20 ms TR/TE = 6000/20 ms
white matter
gray matter

Basic Principles of MRI 48 Inspection of Eq. 1.33 also reveals that a N(H)-weighted spin-echo MR can be acquired by
maximizing TR (~4-5T1) and minimizing the TE value (e.g., 5-10 ms); the right-most image in
Figure 1-35 being a good example.
For T2-weighted spin-echo MRI, TE is typically long (on the order of 80-100 ms). The T2-
relaxation-time values for white matter, gray matter and cerebrospinal fluid (CSF) in the human
brain are 67, 77, and 180 ms, respectively. The N(H) values are 0.61, 0.69 and 1.00, respectively
(11), normalized relative to CSF, which has the maximum value. By minimizing T1-relaxation-time
effects (i.e., using Eq. 1.33), the MRI signal-intensity-decay curves, as a function of the TE value,
are as shown in Figure 1-36.
As with T1-relaxation-time recovery curves, the T2-relaxation-time decay curves indicates
that for optimal contrast between tissues based on differences in the T2 relaxation times, a TE value
is chosen that maximizes the MRI signal-intensity differences between the respective tissues and/or
CSF.
Figure 1-36: T2 decay curves for cerebral spinal fluid (CSF), and white and gray matter in the human brain. The long T2
relaxation time of CSF, relative to those of white and gray matter, results in higher CSF signal intensity relative to white
and gray matter on T2-weighted brain MR images. The optimal TE time to maximize contrast between white and gray
matter and CSF is the TE time that maximizes the signal intensity difference between white matter and gray matter and
CSF (~51 ms and ~65 ms respectively as indicated on the graph). In this case the TE times that maximize contrast
Signal intensity difference curve for: CSF and white matter CSF and gray matter
max
max
~ avg T2 value of CSF and white (or gray) matter

Basic Principles of MRI 49 between white and gray matter and CSF do not coincide with the average T2 value (~125 ms) of CSF and white (or gray)
matter.
For a visual example, consider the human brain images in Figure 1-37. Here, the TE values
were varied from 50 ms to 200 ms while TR was held constant at 3000 ms. In Figure 1-37 the
change in contrast between white (and gray) matter and CSF is apparent as TE increases. As TE
increases signal from CSF is stronger relative to surrounding brain matter as predicted by the T2
decay curves in Fig. 1-36.
Figure 1-37: Series of adult human brain images to demonstrate changes in contrast between CSF and white and gray
matter as TE is changed (TR constant at 3000 ms). The leftmost image (TR/TE = 3000/50 ms) is primarily proton-
density-weighted while the rightmost image (TR/TE = 3000/200 ms) is primarily T2-weighted. Note the sharp decline in
white and gray matter signal intensity as TE becomes longer as predicted by T2 decay curves in Fig. 1-36. CSF signal
intensity remains strong relative to white and gray matter providing excellent contrast between CSF and brain tissue at
TE = 100-200ms. Images here were acquired using a 1.5T clinical scanner and have resolution of approximately 940
µm.
2.6 Multi-Slice Spin-Echo MRI
Consider a spin-echo MRI pulse sequence with TR/TE of 250/11 milliseconds and a desired
matrix size of 256x256. The time needed to acquire such an image (assuming no averaging of slice
data) is 250 ms * 256 = 128 seconds (1 minutes and 4 seconds). If it was desired to acquire 8 slices
at different positions (for example, through the human brain), and each slice was acquired
sequentially, then the imaging time increases by a factor of 8 to 512 seconds (8 minutes 32
seconds). As an alternative, the imaging time can be reduced significantly using a multi-slice, spin-
echo MRI pulse sequence, where additional slices are obtain at other positions within the brain
TR/TE = 3000/50 ms TR/TE = 3000/100 ms
TR/TE = 3000/150 ms
TR/TE = 3000/200 ms

Basic Principles of MRI 50 during the residual portion of the TR interval following the acquisition of the first slice. Consider the
timing diagram of the spin-echo MRI pulse shown in Figure 1-38. If the TE value and the data
acquisition period are such that the first slice is acquired in 50 ms, then the residual time left in the
TR interval is 200 ms before the 90o RF pulse is applied again at the same slice position (for
example, to acquire the next line of k-space for that slice).
Figure 1-38: Timing diagram for a spin-echo MRI pulse sequence showing the time needed to acquire a single slice and
the residual time in the TR interval before the 90o RF pulse is applied again at the same slice position (for example, to
acquire the next line of k-space for that slice).
During the residual 200 ms in the TR interval shown in Figure 1-38, several other slices (up to four)
at different slice positions could be excited. Usually, all slices in a multi-slice scan have the same
thickness requiring the same RF excitation bandwidth and the same slice-select gradient. Therefore,
for a multi-slice spin-echo imaging pulse sequence, the RF excitation pulses that select the other
slices must have a different center frequency with respect to each other. Figure 1-38 can now be
redrawn (Figure 1-39) to include four additional 90° RF excitation pulses during the residual TR
period. The center frequency of each 90° RF excitation pulse is usually chosen to provide an
interleaved acquisition of the slices (e.g., a slice order of 1, 3, 5, 2, and 4 in this case). This
interleaved scheme reduces “cross-talk” between adjacent slices.
RF
Signal
GX
TR = 250 ms
90° 180°
GZ
GY
90°
Time to acquire a single slice = 50ms
Residual Time in the TR interval = 200ms

Basic Principles of MRI 51
Figure 1-39: One repetition time (TR) interval of a multi-slice spin-echo MRI pulse sequence (the time to acquire a
single slice is 50 ms and TR – 250 ms). By acquiring five slices within one TR period, the total imaging time is reduced
by a factor of five. The slice positions are determined by the respective center frequencies, ‘CF’, of the corresponding
RF excitation pulses.
2.7 Echo-Planar Imaging
RF
Signal
GX
90° 180°
GZ
GY
TR = 250ms
90° 180° 90° 180° 90° 180° 180° 90° 90°
ω0 CF1
CF2 CF3
CF4 CF5
slice 1 slice 3 slice 5 slice 2 slice 4 slice 1
GZ
CF1 CF3 CF5 CF2 CF4
1 2 3 4 5 slice #

Basic Principles of MRI 52 In 1977, Sir Peter Mansfield recognized that k-space could be filled completely following a single
RF excitation (13), eliminating the need to fill k-space one line at a time (or one line per TR period).
Using the echo-planar imaging (EPI) technique, images could potentially be acquired in 30 to 100
ms (14). Unfortunately, however, the MRI hardware required to implement the pulse sequence was
not available at the time and it took a number of years before EPI became a practical reality. By
1991, Stehling et al. (14) reported various uses for EPI such as flow imaging, water diffusion
imaging, brain imaging, and functional brain imaging.
2.7.1 Echo-Planar Imaging Methods for Traversing k-space
To traverse k-space in a “single shot,” EPI employs a number of data acquisition strategies
that differ from the trajectory path employed by more conventional MRI methods (e.g., spin-echo or
GRE MRI).
Gradient-echo EPI (GRE EPI)
Figure 1-40 compares the conventional k-space trajectory with that of the GRE EPI
implementation. The k-space trajectory for a conventional MRI pulse sequence is shown in Figure
1-40a. For each line of k-space, following the RF excitation pulse, a single echo is acquired at a
particular value of the phase-encoding-gradient amplitude. During the intervening TR interval, the
phase-encoding-gradient amplitude is incremented, and then the next line of k-space is acquired. In
the case of GRE EPI, however, following the acquisition of the first echo, the phase-encoding-
gradient amplitude is incremented and then a second echo (i.e., line of k-space) is acquired in the
same “TR” interval. This process is then repeated until all of the lines of k-space are acquired
during a single data acquisition interval. After the initial RF excitation pulse, the GRE EPI pulse
sequence forms a “train” of gradient echoes by rapidly switching the polarity of the readout gradient
and digitizing the signal at the same time. During the switching time between each echo acquisition,
a “blipped” phase-encoding gradient is applied to advance to the next line of k-space (Figure 1-40b).
The entire k-space dataset can typically be acquired in 30-100ms (15). The GRE EPI pulse sequence
used to traverse k-space as shown in Figure 1-40b is shown in Figure 1-41.

Basic Principles of MRI 53
Figure 1-40: A) Conventional 2D-FT MRI k-space trajectory; acquisition of each line of k-space requires a separate RF
excitation and TR period. B) GRE EPI k-space trajectory; following a single RF excitation, all lines of k-space are
acquired in a “single shot.”
ky
kx
ky
kx
A B

Basic Principles of MRI 54
Figure 1-41: GRE EPI MRI pulse sequence. The echo time (TE) for the sequence occurs at a time when the duration-
time product of the positive-going “blipped” phase-encoding–gradient pulses (GY) is equal to the duration-time product
of the initial GY de-phasing gradient pulse. The successive accumulation of gradient duration-time product by positive-
going GY pulses is represented by the first four positive-going GY pulses. All of k-space is filled before complete signal
dephasing due to T2* effects (~30-100ms).
Spin-echo EPI (SE EPI)
The spin-echo EPI MRI pulse sequence is essentially the same as the GRE EPI method except that a
180° RF refocusing pulse applied at a time TE/2 after the initial 90° RF excitation pulse. Phase and
frequency-encoding is SE EPI, as shown in Figure 1-42, is the same as for GRE EPI.
MR Signal
T2*
GY
GX
GZ
slice select
RF
α°
TE

Basic Principles of MRI 55
Figure 1-42: SE EPI MRI pulse sequence. As is the case for GRE EPI, the echo time (TE) for the gradient echoes formed
in the sequence occurs at a time when the duration-time product of the positive-going “blipped” phase-encoding-gradient
pulses (GY) is equal to the duration-time product of the initial GY de-phasing gradient pulse. For SE EPI, the RF spin-
echo produced by refocused magnetization (at time TE/2 after the 180° refocusing pulse) occurs at the same TE time as
for the gradient echos. The successive accumulation of gradient duration-time product by positive-going GY pulses is
represented by the first four positive-going GY pulses. All of k-space is filled before complete signal dephasing due to
T2/T2* effects (~30-100ms). The blipped phase-encoding scheme results in the k-space trajectory shown in Figure 1-40b.
2.8 Diffusion-Weighted Imaging
Diffusion-weighted imaging (DWI) is used extensively in clinical and animal studies. For brain
imaging, DWI is sensitive to changes in brain water content and mobility. DWI finds clinical
application in imaging tissue pathologies such as inflammation, edema, cell swelling, cell necrosis,
MR Signal
T2*
GY
GX
GZ
RF
90°
TE
180°

Basic Principles of MRI 56 membrane damage, demyelination, axonal loss, and gliosis (16). A brief explanation of water
diffusion theory is provided before discussing DWI in detail.
2.8.1 Diffusion of Water
All fluids have an associated diffusion constant D which provides a quantitative description of how
the molecules within the fluid move among themselves. The movement of molecules within a fluid
is governed by random thermal agitation and is generally referred to as Brownian motion (after
Robert Brown of Scotland, 1827). The movement of fluid molecules within heterogeneous media,
such as cells with the brain is less random due to the presence of physical boundaries that interfere
with the translation of the molecules. For molecules in the bulk phase, the average displacement of
the molecules as a function of time can be represented by a Gaussian probability distribution:
Dt
X
etD
tXP 4
2
4
1),(
−
=π
For the case of diffusion with no preferential direction, diffusion is said to be isotropic. For
molecular diffusion in media with restricting boundaries, diffusion can be anisotropic. In anisotropic
diffusion, a diffusion tensor is used to represent the degree of diffusion of molecules in nine different
directions as follows:
=
DzzDzyDzx
DyxDyyDyx
DxzDxyDxx
D
where Dxx, Dyy, and Dzz represent the diffusion constants along the reference frame axes. The
diffusion tensor is symmetric since Dij = Dji and, therefore, the tensor can be accurately represented
by the six elements: Dxx, Dyy, Dzz, Dxy, Dxz, Dyz. In MR the net displacement of diffusing
molecules is a variable of interest. Equation 1.34 only tells us the probability of finding a molecule
at position X after a time t. Another means to characterize the net displacement of diffusing
molecules is via the Einstein equation:
( ) ( )nt
rrDnDtrr
22
22 >′−<
=⇒>=′−<
where n = # dimensions, t = time allowed for diffusion to occur and <(r-r’)2> is defined as the square
of the net distance traveled by a molecule undergoing random diffusion as shown in Figure 1-43:
(1.34)
(1.35)

Basic Principles of MRI 57
GY
RF
GZ
90°
180°
GX
GD GD
∆
δ
g
Figure 1-43: Random walk of a molecule undergoing random diffusion. The molecule accumulates a net displacement, r-
r’, over time.
2.8.2 Stejskal-Tanner Diffusion-Weighted Pulse Sequence
MR can be used to measure the displacement of diffusing water molecules by application of
a pair of magnetic field gradients surrounding the 180° RF refocusing pulse of a spin-echo imaging
pulse sequence. This technique developed by Stejskal and Tanner in 1965 (17) is referred to as the
‘pulsed magnetic field gradient’ (PFG) technique. A typical Stejskal-Tanner PFG diffusion-weighted
spin-echo MRI pulse sequence is shown in Figure 1-44.
position r at time t1
position r’ at time t2
r – r’

Basic Principles of MRI 58 Figure 1-44: Stejskal-Tanner PFG diffusion-weighted spin-echo MRI pulse sequence. The amplitude of the spin-echo is
determined by the separation (∆), duration (δ), and amplitude (g) of the diffusion-sensitive gradient pulses (GD). The
diffusion time tD is determined by ∆ and δ as tD = ∆ - δ/3 (16).
The first of the diffusion-sensitive-gradient pulses (GD) in the Stejskal-Tanner pulse sequence
is designed to de-phase nuclear magnetization prior to the 180o refocusing pulse (which in turn
inverts the phase of the nuclei). For molecules that are not moving (i.e., not diffusing), the second
diffusion-sensitive-gradient pulse (which has an area identical to the first) completely removes the
phase shifts imparted by the first diffusion-sensitive gradient pulses. Consequently, there is no loss
of phase coherence for static molecules and the associated MR signal intensity is unaffected. For
moving (i.e., diffusing) molecules, however, the second diffusion-sensitive-gradient pulse does not
completely remove the phase shifts encoded by the first diffusion-sensitive-gradient pulse. This is
because of the spatial displacement of the diffusing molecules to a different location along the
direction of the applied magnetic field gradient. Consequently, the transverse magnetization from the
nuclei in diffusing molecules will experience a loss of phase coherence and a concomitant reduction
in the MR signal intensity. The magnitude of the MR signal reduction will be directly proportional to
the area of the diffusion-sensitive-gradient pulses, the diffusion time, and the magnitude of the
diffusion coefficient. For molecules in regions of restricted diffusion (e.g., brain white and gray
matter), the signal intensity in a diffusion-weighted MRI (DWI) will be higher than for molecules in
regions with relatively free diffusion (e.g., CSF). Using the Stejskal-Tanner pulse sequence, the
degree to which the DWI signal intensity is attenuated (i.e., the degree of diffusion-weighting)
depends on the factors ∆, δ, g, and D as follows:
2),( T
TE
bD
o eeMbTES
−−=
−∆=3
222 δδγ gbwhere .
The ‘b-value’ shown in Eq. 1.36 is the parameter that determines the amount of diffusion weighting
applied to a DWI. The b value has units of seconds/mm2 and typically range from 20 s/mm2 (low
diffusion weighting) to 1500 s/mm2 (high diffusion weighting).
2.8.3 Quantification of Diffusion-Weighted Images: The ADC Map
(1.36)

Basic Principles of MRI 59 To quantify diffusion in vivo using DWI requires the acquisition of at least two images; one with
little or no diffusion-weighting (i.e., b = 0 or close to 0) and one with relatively high diffusion-
weighting (e.g., b on order of 1400 s/mm2). The Stejskal-Tanner formula can then be used to solve
for the diffusion coefficient based on the two images as follows (16):
bDTES
bTES−=
)0,(
),(ln .
For molecular diffusion in biological systems that contain restricting barriers (e.g., cell membranes),
the value for D, as shown in Eq. 1.37, is often referred to as the apparent diffusion coefficient
(ADC). In this case, the ADC value is reduced compared to that of molecular diffusion in the bulk
phase and its value often depends on the amount of time that the molecules are allowed to diffuse
(i.e., the diffusion time). The ADC can be calculated using Eq. 1.37 by plotting the left hand of the
equation as a function of b-value (as shown in Figure 1-45).
Figure 1-45: Calculation of the ADC by linear fitting of the natural log of the signal intensities from two (or more) DWIs
(asterisks) as a function of b value. The ADC value is calculated from the slope of the line.
REFERENCES 1. Haliday D., Resnick R. Fundamentals of Physics: John Wiley and Sons; 1989. 2. Bloch F., Hansen W.W., Packard M. Nuclear Induction. Phys Rev 1946;69:127 3. Bloembergen N., Purcell E.M., Pound R.V. Relaxation effects in nuclear magnetic resonance
absorption. Phys Rev 1948;73:679-712 4. Hahn E.L. Spin Echos. Phys Rev 1950;80:580-594
(1.37)
)0,(
),(ln
TES
bTES
b-value (s/mm2)
0 100 200 300 400 500 ….. 1500 *
*
slope = ADC

Basic Principles of MRI 60 5. Carr H.Y., Purcell E.M. Effects of diffusion on free precession in nuclear magnetic resonance
absorption. Phys Rev 1954;94:630. 6. Meiboom S., Gill D. Modified Spin-Echo Method for Measuring Nuclear Relaxation Times.
Sci Instrum 1958;29:688. 7. Oppenheim A.V., Schafer R.W. Discrete-Time Signal Processing. Oppenheim A.V., editor.
Englewood Cliffs, NJ: Prentice Hall; 1989. 8. Paschal C.B., Morris H.D. K-Space in the Clinic. JMRI 2004;19:145-159 9. Elster A.D., Burdette J.H. Questions and Answers in Magnetic Resonance Imaging. Mosby,
editor. St. Louis: Mosby; 2001. 10. Stark D.D., Bradley W.G. Jr. Magnetic Resonance Imaging. St. Louis: Mosby; 1999. 11. NessAiver M. All you really need to know About MRI Physics. Maryland: University of
Maryland Medical Center; 1997. 12. Rooney W.D., Johnson G., Li X., Cohen E.R., Kim S-G., Ugurbil K., Springer C.S. Magnetic
Field and Tissue Dependencies of Human Brain Longitudinal 1H2O Relaxation in vivo. Magn Reson Med 2007;57:308-318.
13. Mansfield P. Multi-planar image formation using NMR spin echoes. J Phys C 1977;10:L55-L58.
14. Stehling M.K., Turner R., Mansfield P. Echo-Planar Imaging: Magnetic Resonance Imaging in a Fraction of a Second. Science 1991;254:43-50.
15. Edelman R.R., Wielopolski P., Schmitt F. Echo-planar imaging. Radiology 1994;192:600-612.
16. Tofts P. Quantitative MRI of the Brain. Chichester: John Wiley & Sons Ltd; 2003. 17. Stejskal E.O., Tanner J.E. Spin diffusion measurements: SEs in the presence of a time-
dependent field gradient. J Chem Phys 1965;42:288.
CHAPTER 2
Characteristics and Manipulation of the
Blood-Brain Barrier (BBB)
Blood-Brain Barrier (BBB) Background
Anatomy of the BBB Brain Capillary Epithelium
Techniques to Determine BBB Permeability Quantification of BBB Permeability using the Brain-Perfusion Technique
A Semi-Quantitative Measure of BBB Permeability Using Evans Blue (EB) Dye
Hyperosmotic Disruption of the BBB Characteristics of Reversible Osmotic BBB Disruption
Mannitol and Arabinose as Hyperosmolar Infusates for BBB Disruption
The BBB and Cerebral Edema
MRI Detection of BBB Disruption Gd-DTPA Used to Detect Regions of Pathological BBB Disruption

Characteristics and Manipulation of the BBB 61 2.1 Blood-Brain Barrier (BBB) Background
The concept of a blood-brain barrier (BBB) was conceived in the early 1900s with
experiments performed by Lewandowsky, Ehrlich, and Goldmann. Lewandowsky noticed during his
experiments that the stain Prussian blue did not pass from the brain blood vessels into the brain (1).
Ehrlich performed similar experiments using the stain Trypan Blue and found that while the whole
body became stained with the dye, the brain was always an exception. Goldmann’s experiments with
Trypan Blue infusion into the cerebral spinal fluid allowed him to conclude that there was some
form of barrier separating nervous tissue from brain tissue (1). Early investigators were therefore
focused on determining the structure and function of the barriers separating blood, brain tissue and
cerebrospinal fluid (CSF).
The modern concept of the BBB was not conceived until 1965 by Crone et al. (2). The BBB
was found to be capable of regulating the active transport of substances into the brain at a time when
it was generally accepted that substances crossed the BBB only by passive diffusion. Then, in 1967,
in an attempt to better understand the anatomy of the BBB, Reese and Karnovsky (3) determined
that the BBB consisted of endothelial cells that lined the cerebral vasculature. By 1976, it was
apparent that the function of the BBB was to regulate the interfaces between blood and the nervous
system (4). Methods to quantify the permeability of the BBB were established in 1963 by Crone (5)
and in 1978 by Ohno et al.(6).
Experimental osmotic disruption of the BBB was first performed in the 1940s (7) and was
quantified using Evans Blue dye by Rapoport in 1972 (8). Damage to the BBB can result from
various insults such as trauma, oxygen deprivation, autoimmune disorders, brain tumor,
hypertension, and excessive osmotic infusions (meant to transiently open the BBB). Osmotic BBB
disruption in particular has also been shown to result in significant brain edema and long-term brain
damage in animals. Magnetic resonance imaging (MRI) technology, aided by advances in MR
contrast-agent design, has advanced our understanding of the function of the BBB and the effects of
pathologies on the BBB.
2.2 Anatomy of the BBB
The role of the BBB is to separate the brain from the systemic blood circulation. The BBB
selectively excludes certain blood constituents from being transported into the brain and maintains

Characteristics and Manipulation of the BBB 62 the homeostasis of the central nervous system. Brain capillaries, therefore, must have the means to
allow certain substances into the brain while excluding others. In the early days of BBB research, the
capillaries of the brain were not thought to be different in structure to the capillaries of the
musculoskeletal system. Scientists, therefore, were curious as to why Trypan Blue dye failed to stain
the animal brain once injected intra-arterial. Arguments were made leading to a hypothesis that the
Trypan Blue dye simply had nowhere to go into the brain due to an extremely small extracellular
brain space (9). Ironically, this idea had already been disproved by Goldmann (10). Goldmann’s
second experiment included an injection of Trypan Blue into the CSF – which resulted in complete
staining of the brain – suggesting that there was indeed sufficient extracellular volume to
accommodate the diffusing Trypan Blue dye stain to diffuse into. Unfortunately, it was not until
1967 that researchers identified the true anatomical basis of the BBB as being the ultrastructure of
the brain-capillary endothelium (3). In addition to brain-capillary endothelial cells, the BBB is
comprised of astroglia, perivascular macrophages, pericytes, and a basal lamina (11). An artist’s
view of the capillary is provided in Figure 2-1.
Figure 2-1: Artist’s representation of a brain blood vessel and the surrounding endothelium, astrocyte, pericyte and
neuron. A tight junction is also shown (black bar). From http://bloodbrainbarrier.med.ucla.edu.
2.2.1 Brain Capillary Epithelium
Tight Junctions
Capillaries of the brain vasculature are lined with endothelial cells that are closely packed
together and are apparently linked by ‘tight junctions.’ With the use of electron microscopy, the tight

Characteristics and Manipulation of the BBB 63 junctions of endothelial cells came to be classified as zonula occludens (1). Other types of contact or
junctions between cells exist such as macula adherens, and zonula adherens. In the adherens-type
junction, cells remain separated by approximately 200 Å and are held together by electron-dense
material (1). From Figure 2-2, the function of the tight junctions becomes clear; prevention of certain
solutes from entry into the brain. A close-up view of a tight junction is provided in Figure 2-3. The
permeability or ‘leakiness’ of the BBB to ions is believed to be a function of the number of ‘tight-
junction elements’ that exist within an endothelial-cell tight junction (1). The electrical resistance
across a tight junction (in Ohm/cm2) is a function of the number of tight-junction elements (12) and
reflects the strength of the barrier to passage of ions from blood to brain.
Figure 2-2: Tight junction (arrows) between two endothelial cells (E) prevent electron-dense lanthanum (dark areas in
vessel lumen) from penetrating into brain (http://www.ohsu.edu/bbb/forprof_program.html).

Characteristics and Manipulation of the BBB 64
Figure 2-3: Close-up view of the tight junction between two endothelial cells. The number of tight-junction elements
within the tight junction determines the electrical resistance of the tight junction to ions.
Pits and Vesicles
Small semi-circular-shaped invaginations (vesicles), with a diameter of approximately 50-
100 nm, line the inner (or luminal) membrane (opposite to the basement membrane); with muscle-
capillary-endothelial cells containing fewer vesicles than cerebral-capillary-endothelial cells. The
vesicles can move further into the endothelial membrane to become pits (9) and a chain of pits can
form a tubule. It is believed that within tubules, solutes can be transferred from vesicle to vesicle,
thus allowing certain solutes from the blood to be ‘carried through’ the endothelial cell membrane as
summarized in Figure 2-4.
E1 E2
Tight-junction element
Endothelial cell cytoplasm
tight junction

Characteristics and Manipulation of the BBB 65
Figure 2-4: Solute transport across the BBB. Vesicles move from the lumen membrane into the endothelial cell to form
pits; which combine with existing pits to form a chain or tubule. Part or all of the vesicle contents are shared (or
transferred) between pits in the tubule until the solute reaches the brain (13).
2.3 Techniques to Determine BBB Permeability
By its nature, the BBB has limited permeability to substances in the blood. As previously
discussed, the endothelial cells that line the cerebral capillaries are responsible for BBB function and
integrity. Since the discovery of the anatomical nature of the BBB, researchers have been improving
upon methods for quantifying the permeability of the BBB. The commonly available techniques for
measuring the permeability of the brain include (but are not limited to) the IV administration
technique, the brain-perfusion technique, the indicator-diffusion technique, the brain-uptake-index
(BUI) technique, or the single-injection external-registration technique (9). For purposes of this
dissertation, discussion will be limited to the brain-perfusion technique.
2.3.1 Quantification of BBB Permeability Using the Brain-Perfusion Technique
With the brain-perfusion technique of Takasato et al. (14), one brain hemisphere of an
anesthetized animal is perfused by retrograde infusion of a particular fluid into the common (or
external) carotid artery. The uptake into the brain of the perfusate can then be observed after
sacrificing the animal and removing the brain. A diagram for the brain-perfusion technique is shown
in Figure 2-5. The perfusion rate is such that blood flow to the right hemisphere is minimized and
perfusion pressure does not rise significantly above normal blood pressure of the animal. The brain-
Endothelial cell 1
vesicle moves
xfer vesicle contents to existing pits
Vessel Lumen
Brain
vesicle
vesicle
Endothelial cell 2

Characteristics and Manipulation of the BBB 66 perfusion technique allows close scrutiny of the composition of fluid entering the brain. Osmolality,
pH, protein concentrations and ionic content of the perfusate can be varied over a wider range versus
perfusate administered systemically. Disadvantages of the brain-perfusion technique include
perfusion of one hemisphere only and possible brain hypoxia due to low blood flow to the perfused
hemisphere for the typical 30-120 second infusion.
Figure 2-5: Brain-Perfusion Technique of Takasato et al. (14). For this technique, the external carotid artery is typically
severed leaving a small ‘stump’ for insertion of tubing that will deliver fluid to the brain. The stump of the external
carotid artery is then permanently ligated. The tubing is inserted into the internal carotid artery to ensure flow of fluid
directly to the brain. The pterygopalatine artery is permanently ligated to prevent leakage of fluid through this route. The
common carotid artery is left open until immediately before the infusion. A temporary clamp can be placed appropriately
on the carotid artery to ensure delivery of perfusion fluid to the brain and not towards the heart. Also, temporary
clamping of the carotid – instead of permanent ligation – helps to maintain the physiological state of the animal. ACA,
anterior cerebral artery; MCA, middle cerebral artery; PCA, posterior cerebral artery. Reproduced from Ref. (14).

Characteristics and Manipulation of the BBB 67 2.3.2 A Semi-Quantitative Measure of BBB Permeability Using Evans Blue (EB) Dye
Evans Blue (EB) dye has been used extensively in animals as a marker for BBB integrity
(15-21). The dye in pure form [MW = 960.82 Daltons (Da)] is known to remain within the cerebral
vasculature; unable to penetrate the healthy BBB. Evans Blue dye binds to serum albumin in blood
after approximately five minutes. Wolman et al. (22) used electrophoretic-pattern analysis of free
EB, cat plasma, and EB in a sample of cat plasma to determine the temporal dynamics of EB binding
to serum albumin. After binding to serum albumin, the EB-albumin complex has a molecular weight
of ~68 KDa. The chemical formula, name, and structure for EB dye are provided in Figure 2-6.
Figure 2-6: A) The empirical chemical formula and name for Evans Blue dye. B) Chemical Structure for Evans Blue
dye.
Quantifying the permeability of the BBB using EB staining can be complicated by the fact
that EB binds to serum albumin after five minutes within blood. If EB is infused into an animal with
an experimentally or pathologically disrupted BBB, the degree of BBB disruption depends on when
the animal was sacrificed relative to the time of EB infusion. For example, an animal that is
sacrificed less than five minutes after i.v. infusion of EB will show EB staining in the brain that is
indicative of BBB permeability to molecules of size 970 Da or less. Consequently, experimental use
of EB as a marker for BBB permeability requires careful timing of EB infusion relative to animal
sacrifice.
A) C34H24N6O14S4Na4
tetrasodium 6,6'-((3,3'-dimethyl-(1,1'-biphenyl-4,4'diyl)bis(azo)bis(4-amino-5-hydroxy-1,3-naphthalenedisulphonate)
B)

Characteristics and Manipulation of the BBB 68 Evans Blue Solution Preparation
Evans Blue typically comes in powdered form (and is a known carcinogen). Most animal
studies using EB as a marker for BBB integrity use a dose of 2ml/kg of 2% (2 g EB in 100 ml saline)
EB. The powder dissolves readily in saline and the solution is tolerated well by the animal.
EB Staining Histology
Prior to removing the brain for histological examination, many studies suggest perfusing the
animal by removing the blood via a controlled infusion of physiologically buffered saline into the
heart until a colorless liquid prevails. This procedure prevents the vascular EB from staining the
brain during the removal process. If perfusion of the animal is not possible, an infusion of EB into
one hemisphere (using other hemisphere as control) may suffice to control for EB staining in brain
by vascularized EB at time of sacrifice. Evans Blue staining of the brain is typically graded on a
scale of 0-3 or 4 where 0 is no staining visible to the naked eye, and 3 or 4 is a deep blue staining.
2.4 Hyperosmotic Disruption of the BBB
Transport of certain molecules across the BBB is accomplished by transcellular diffusion (of
lipophilic substances) and several transport mechanisms are shown in Figure 2-7.
Figure 2-7: Various transport routes across the BBB. Taken from Ref. (23).

Characteristics and Manipulation of the BBB 69 The most important factors that determine delivery of a substance from the blood into the brain are
lipid solubility (expressed as the octanol/water partition coefficient), molecular mass, and charge
(23). Certain substances – such as chemotherapeutic drugs – do not have the necessary
characteristics for transport across the BBB. Therefore, another means of transport across the BBB is
needed for efficacious delivery of drugs from the blood into the brain (and into brain tumors). As
early as 1945, it was recognized that high osmolar solutions destroyed the cerebrovascular
membranes (7). In 1961, Dodge et al. (24) reported an increase in staining of the brain by Trypan
Blue after hyperosmotic infusions of NaCl, sucrose and urea into rat brain. In the early 1970s,
Thompson and Rapoport suggested that the infusion of hyperosmotic solutions into brain resulted in
dehydration of cerebral endothelial cells with resultant widening of tight junctions. Solutes not
normally able to cross an intact BBB, such as the Evans Blue-albumin complex, were shown to
penetrate the BBB for a limited time after hyperosmotic infusions into cerebral vasculature (8,25).
For delivery of clinically useful drugs across the BBB, the disruption of the BBB by osmotic means
must be a controlled transient event. Infusion of hyperosmolar solutions into the intracarotid artery is
the most studied and proven method for a transient (or reversible) opening of the BBB (23).
Hyperosmolar solutions available for use as a BBB disruption agent are mannitol, arabinose, urea,
sucrose, and lactamide to name a few. For purposes of this dissertation, only the sugars mannitol and
arabinose will be discussed further.
2.4.1 Characteristics of Reversible Osmotic BBB Disruption
The action of shrinking endothelial cells using hyperosmotic solutions is consistent with what
is known about osmotic shrinkage in cells in general. Consider first the definition of osmolality and
solution osmotic pressure. The molality (m) of a solution is moles of solute per kg of solvent.
Osmolality is defined by:
where k corresponds to a solute species (ion or non-electrolyte) and Φk is the molal osmotic
coefficient of that species (8). If k is an electrolyte, k = 1 to v where v is the number of moles of ions
formed from 1 mole of an electrolyte. If k is not an electrolyte, then v = 1. Solution osmotic
pressure, П, is defined as:
∑∑==
′=Φ=v
k
k
v
k
kk mmosmolality11
2.1

Characteristics and Manipulation of the BBB 70
where R is the gas constant and T is absolute temperature (in Kelvins) (8). Φ can be calculated from
molal freezing-point depressions using the following equation:
The final volume of a cell after osmotic shrinkage can be quantified as:
where σ is defined as:
If the BBB is indeed opened by cell shrinkage, then certain conditions are expected to apply:
1) Opening of the BBB should be a reversible event. Indeed, as shown by Cosolo et al. (20),
the BBB is permeable to Evans Blue tracer only up to ten minutes after BBB disruption by
hyperosmolar mannitol. After ten minutes, it is likely that the endothelial cells begin to return to
their normal size after shrinkage (thus reestablishing the tight junction contacts). This is in
agreement with Eq. 2.4, which suggests that cell volume should return to normal if the cell
environment returns to its original tonicity.
2) The osmotic agent should not act on the endothelial cells as a drug. As Eq. 2.4 indicates,
osmotic pressure and cell shrinkage depend only on the concentration of solute and not on any drug
action of the solute.
3) With increasing molality BBB opening should increase. Experiments by Rapoport et al.
(16) (see also Table 2-1) showed that BBB opening occurred only when the sugar infusate
(arabinose or mannitol) was made at a specific concentration (threshold concentrations for BBB
opening used in Rapoport’s experiments were reported in terms of molarity (M)).
∑ ′=∏m
kmRT 2.2
C
Cdepressionpofreezingmolalο
ο
858.1
,int=Φ 2.3
( )( )
ΠΠ
=final
initialinitialfinal VV
σσ
2.4
Π
′=∑k
kkmRT σσ 2.5

Characteristics and Manipulation of the BBB 71
4) The osmotic threshold for BBB opening should be inversely related to endothelial cell
membrane permeability. The endothelial-cell membrane permeability increases with increasing lipid
solubility of the solute. Therefore, for highly lipid-soluble solutes, the osmotic threshold for BBB
disruption is low. Figure 2-8 shows the correlation between lipid solubility (expressed as the
octanol/water partition coefficient) and BBB permeability.
Figure 2-8: Correlation between lipid solubility and BBB permeability. From Ref. (23).
2.4.2 Mannitol and Arabinose as Hyperosmolar Infusates for BBB Disruption
Mannitol
Mannitol is a sugar whose chemical name and empirical chemical formula are hexan-
1,2,3,4,5,6-hexol and C6H8(OH)6, respectively. The chemical structure of mannitol is shown in
Figure 2-9. The solubility of mannitol in water is 1g mannitol to 5.5 ml water (1g/5.5ml).
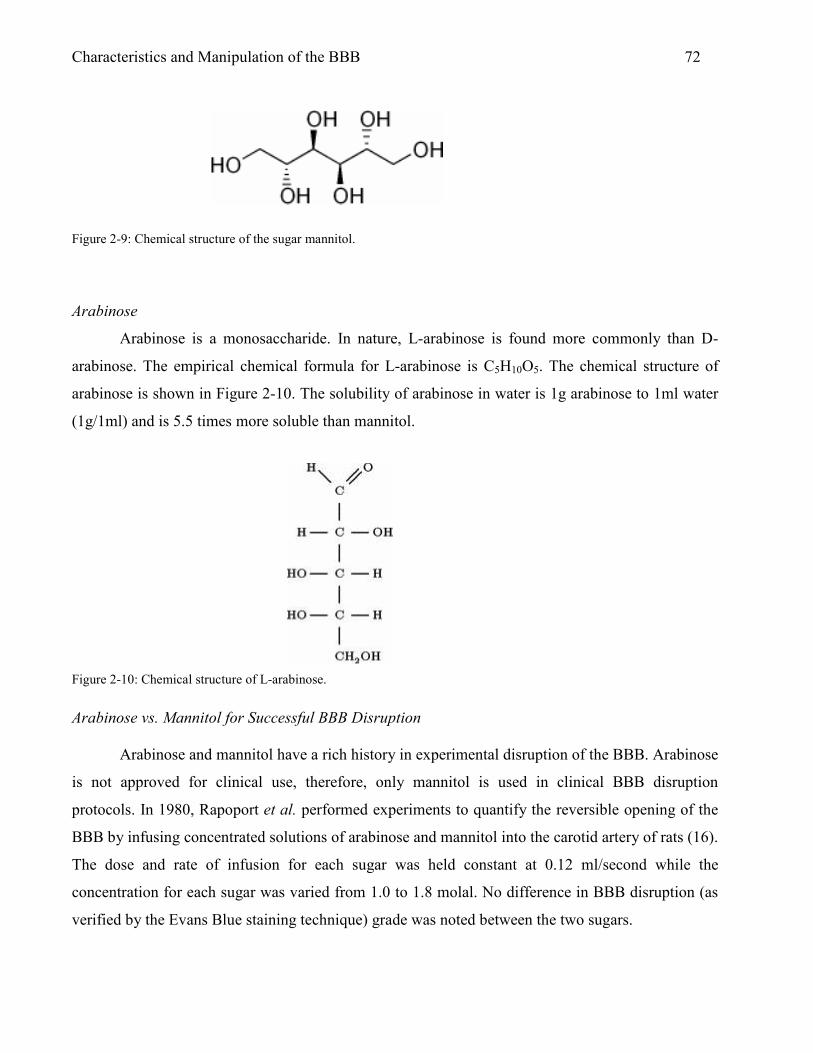
Characteristics and Manipulation of the BBB 72
Figure 2-9: Chemical structure of the sugar mannitol.
Arabinose
Arabinose is a monosaccharide. In nature, L-arabinose is found more commonly than D-
arabinose. The empirical chemical formula for L-arabinose is C5H10O5. The chemical structure of
arabinose is shown in Figure 2-10. The solubility of arabinose in water is 1g arabinose to 1ml water
(1g/1ml) and is 5.5 times more soluble than mannitol.
Figure 2-10: Chemical structure of L-arabinose.
Arabinose vs. Mannitol for Successful BBB Disruption
Arabinose and mannitol have a rich history in experimental disruption of the BBB. Arabinose
is not approved for clinical use, therefore, only mannitol is used in clinical BBB disruption
protocols. In 1980, Rapoport et al. performed experiments to quantify the reversible opening of the
BBB by infusing concentrated solutions of arabinose and mannitol into the carotid artery of rats (16).
The dose and rate of infusion for each sugar was held constant at 0.12 ml/second while the
concentration for each sugar was varied from 1.0 to 1.8 molal. No difference in BBB disruption (as
verified by the Evans Blue staining technique) grade was noted between the two sugars.

Characteristics and Manipulation of the BBB 73
Results from Rapoport’s experiments have been reproduced and shown in Figure 2-11. For
additional experiments to determine optimal concentration and infusion duration for the
hyperosmotic solution, arabinose was used due to its lower solubility. Rapoport et al. reported that a
concentration of 1.6 molal arabinose results in significant BBB disruption as compared to control
(saline infusion) when infused at 0.12ml/sec for at least 30 seconds. A 20-second infusion resulted in
less distinct BBB disruption and a 10-second infusion resulted in little or no BBB disruption as
compared to control. Based on studies of Rapoport et al. in animal models, there is clearly an
optimal concentration and infusion time required for effective BBB disruption.
Figure 2-11: Results from BBB disruption experiments by Rapoport et al. (16) Solutions of saline, arabinose, or
mannitol were infused for 30 seconds into the right external carotid artery. Staining of the brain was determined 15 min
to 2 h after infusion. Grade of staining is as follows: 0 = no staining, 3+ = deep blue stain. For the experimental protocol
of Rapoport et al., a 1.6 molal solution of either arabinose or mannitol was needed for reliable disruption of the BBB.
Numbers in parentheses indicate the number of animals in which the infusate was not seen to pass into the internal
carotid artery (i.e., infusate was likely infused towards the heart). NOTE: At 1.8 molal, mannitol is supersaturated and
precipitates out at 37° C, possibly resulting in microinfarcts in brain after infusion.
In a separate study using only mannitol as the hyperosmolar solute, Cosolo et al. (20)
determined the best dose and rate of infusion of 1.4 molar (mol/liter) mannitol to be 0.25 ml s-1 kg-1.
Furthermore, in the study of Cosolo et al., EB did not stain the brain when infused 10 minutes after
mannitol infusion. The degree of Evans Blue staining in the brain was maximal only when EB was

Characteristics and Manipulation of the BBB 74 infused up to five minutes after mannitol infusion. Figure 2-12 represents data of Cosolo et al. which
clearly suggests a transient opening of the BBB after mannitol infusion.
Taken together, the results of Rapoport et al. and Cosolo et al. suggest that optimal
disruption of the BBB requires careful control over the concentrations, dose, and rate of infusion of
the osmotic solutions. Furthermore, cerebral infusion of hyperosmotic solutions requires that the
infusate is filtered with high-quality syringe filters in order to avoid the injection of microemboli.
Additionally, if 1.4 M (25%) mannitol is used, the solution must be warmed to 37° C before infusion
to prevent precipitation of infusate within the tubing prior to entry into the animal’s blood stream.
Figure 2-12: Results from BBB disruption experiments by Cosolo et al. (20). Mannitol was infused at 0.25 ml s-1 kg-1 for
30s. Evans Blue staining (measured on scale 0-4) of ipsilateral hemisphere occurred only when the dye was injected
before mannitol or < 10min after mannitol administration.
Other Factors Influencing Osmotic BBB Disruption
In addition to the above requirements for the osmotic agents, the anesthetic type partial
pressure of carbon dioxide (PaCO2) during animal experiments have been shown to be factors in the
degree of BBB disruption achieved using hyperosmolar infusions (26). Figure 2-13 shows results
from Remsen et al. indicating a clear dependence of anesthesia and PaCO2 on the degree of BBB
disruption. These studies noted a significant difference in blood pressure between animal groups
anesthetized with propofol and those anesthetized with isoflurane. These results were consistent with
those of Gumerlock et al. (21); who, in earlier studies, had linked cardiovascular parameters to the
degree of BBB disruption. Gumerlock et al. showed that the use of a volatile anesthetic

Characteristics and Manipulation of the BBB 75 (methoxyflurane) resulted in poor BBB disruption using 1.4 M mannitol administered at 0.12 ml/s
for 35 seconds. However, after the blood pressure was normalized (to levels achieved using
pentobarbitol) by pharmacological manipulation, good BBB opening was achieved with the
methoxyflurane anesthetic. The investigators concluded that “Osmotic BBB [disruption] is
maximized within specific cardiovascular parameters and probably correlates best with a normal
cardiac output/index” (21).
Figure 2-13: From Remsen et al. (26). (A) Percent good BBB disruptions by Evans Blue staining (2-3+) after infusion of
arabinose, mannitol or saline at 0.12 ml/s for 30 seconds in low (25-30 mm Hg) and high (45-50 mm Hg) PaCO2
animals. (B) Percent good BBB disruptions by Evans Blue staining in animals infused with arabinose or mannitol at 0.09
ml/s under propofol and 0.12 ml/s under isoflurane anesthesia.
While these findings may be true, there was no examination of the possible effects on the
endothelial membrane by the anesthetics. For example, isoflurane (a volatile anesthetic similar to
methoxyflurane) is a lipophilic agent and decreases cerebral metabolism. Therefore, the lipophilicity
of the anesthetic may change the characteristics of endothelial cells in the cerebral vessel; the surface
area of perfused capillaries in the brain, or both. Chi et al. (27) investigated these claims and found a
decrease in the transport of small hydrophilic molecules across the BBB during isoflurane
anesthesia. Chi et al. suggested that the apparently limited BBB permeability due to the presence of
B

Characteristics and Manipulation of the BBB 76 hydrophilic molecules was related to the effect of isoflurane on the perfused-capillary-surface-area
product; but, may also be due to the effect of isoflurane on the lipid bilayers of endothelial cells. In
any case, the literature suggests that isoflurane protects the BBB from disruption to some degree.
Brain Changes Associated with Osmotic BBB Disruption
Osmotic disruption of the BBB is not without consequence. Several groups have investigated
the aftermath of osmotic BBB disruption in animals and have found changes in the brain. These
include ischemic neuronal death (28), collapsed, acidophilic neurons with macrophage response
(29), and pronounced watery swelling of astrocytic processes and expansion of dendrites and axons
(30). Additionally, several labs have show changes in brain structure after osmotic disruption,
including results from the WPI NMR laboratory (to be presented later). Therefore, for experiments
relying on delivery of substances across the BBB for later use by brain cells, osmotic BBB
disruption, if used, must be accompanied by evidence of the brain-cell health/status at some
appropriate time point following infusion of hyperosmotic perfusate.
2.5 The BBB and Cerebral Edema
Edema in the brain is defined formally as abnormal accumulation of fluid within the brain
parenchyma, producing a volumetric enlargement of tissue (31). This is not to be confused with
brain swelling which can occur as a result of increased cerebral blood volume (CBV), cerebral spinal
fluid (CSF) volume, or a combination of increased water content, CBV and CSF volume (32).
Several different types of cerebral edema are known to exist: vasogenic, ischemic, osmotic,
interstitial, and cytotoxic. Cerebral edema and the BBB are linked because in some cases; the former
causing the latter and vice versa. Figure 2-14 shows characteristics of various brain edema types
(from (33)). Of particular interest for the current dissertation is vasogenic edema.
Vasogenic Edema
Vasogenic edema is swelling that results from damage to cerebral vessels, regardless of the
origin of insult. Trauma, cerebrovascular insults, and brain disorders which result in increased BBB
permeability, and associated entry of serum proteins into brain parenchyma, are essential elements of
vasogenic brain edema (31). Therefore, damaged endothelial-cell membranes of the BBB are one
obvious mechanism for extravasation of extraneous fluid from blood into brain, but may be only part

Characteristics and Manipulation of the BBB 77 of a larger process. Permeability of the BBB can be affected by several other mechanisms, such as
enhanced vesicular transport, creation of transcellular channels, opening of the tight junctions, and
hypertension; each of which can lead to vasogenic edema. In addition, certain chemicals such as
bradykinin, serotonin, histamine, arachnidonic acid, leukotrienes, and free radicals can affect BBB
permeability, resulting in vasogenic edema formation (34). The clinical implications of vasogenic
brain edema are coma, cerebral herniation, and death.
Figure 2-14: Characteristics of different traumatic brain edema types. From Ref. (33)
Retention of Brain Water Essential for Vasogenic Edema
Damage to cerebral endothelial cells may allow for the entry of proteins and water into brain,
but this is not the primary cause of edema because water is known to move in and out of brain fairly
easily. A study by Vorbrodt et al. (35) showed that proteins that have traversed the BBB can be
taken up in pinocytotic vesicles of endothelial cell membranes and digested or transported back into
the blood vessel lumen. However, excess volumes of water left behind are retained, resulting in the
formation and persistence of vasogenic brain edema (31).

Characteristics and Manipulation of the BBB 78
)]()[()( ∏∏ −−−= tissueplasmatissueplasma
pv PPLflowJ σ
Brain Defense Against Vasogenic Edema
The brain has mechanisms which can protect against excessive edema; first and foremost is
the BBB, which serves to maintain brain homeostasis. The inter-endothelial tight junctions of
cerebral capillaries have a high resistance to fluid flow (hydraulic conductivity) (36), as compared to
peripheral capillaries, and thus do not support vesicular transport of proteins or fluid. Since the brain
does not have a lymphatic system, the continuous capillary endothelium is essential in preventing
fluid entry into brain. Any plasma protein that does enter brain, and is not metabolized by astrocytes,
must make its way through brain parenchyma slowly until it reaches the CSF, which is recycled
every 8 hours (36). The structure of the brain also provides protection from edema. Gray matter is a
dense tangle of cellular structures and offers significant resistance to edema fluid flow. White matter,
however, has a more orderly arrangement of cells and therefore is less resistant to the flow of edema
fluids. In addition, the brain is resistant to distortion by increased hydrostatic pressure and to fluid
flow under a hydrostatic pressure gradient (36).
Spread of Edema
Although the structure of the gray matter (and to a lesser extent white matter) in the brain
may prevent the flow of edema fluid, the resistance of tissue elements may eventually be overcome.
The force at which edema spreads is characterized by the Starling equation applied to fluid flow
from blood into tissue:
where Jv is the flow of fluid across the cerebral vessel wall, Lp is the hydraulic conductivity of the
endothelial membrane, Pplasma is the intravascular hydrostatic pressure influenced by the systemic
blood pressure, Ptissue is the brain tissue hydrostatic pressure, σ is the osmotic reflection coefficient
(where a value of 0 indicates high or total permeability of the BBB to the solute, and 1 indicates low
or no permeability of the BBB to the solute), Пplasma is the osmotic pressure in plasma, and Пtissue is
the osmotic pressure in the brain tissue. Substances of different molecular weights have been shown
to flow at the same rate from the site of BBB injury, suggesting a bulk flow of edema fluid (37). The
speed and extent of distribution of edema fluid throughout brain is determined by the size of the
BBB injury, arterial blood pressure and pressure gradients between edematous tissue and the CSF
(31,32). The spread of edema stops when the fluid flow across BBB-injured sites is matched by the
2.6

Characteristics and Manipulation of the BBB 79 clearance of edema fluid; which is again dependent on the size of the BBB injury and the arterial
blood pressure.
Brain Response to Vasogenic Edema After Hyperosmotic BBB Disruption
Edema formation is not common during the acute stage of hyperosmolar infusion, when brain
shrinkage is most likely to occur. Studies have shown that during acute hypernatremia
(hyperosmolarity), the loss of brain water was less than expected because the brain is capable of
accumulating solute to stabilize its volume (38). However, disruption of the BBB by hyperosmotic
means is always associated with some degree of brain edema (23). Therefore, it should be expected
that some cellular response to acute decreases in brain water volume is present within endothelial
cells, astrocytes, glia, microglia, neurons or all brain cells during and after hyperosmotic insults to
cerebrovasculature. It is well known that cells exposed to hypertonic extracellular fluid shrink,
reflecting the osmometer characteristics of the cell, but the cell tends to return to its original volume
by so-called regulatory cell-volume increase (RVI) (39). Due to volume-regulatory ion transport,
RVI is accomplished within minutes of a cells exposure to hypertonic solute (39). During vasogenic
edema, glia are known to influence extracellular K and Cl composition as well as metabolize serum
albumin that may have crossed an injured BBB (36). In addition, astrocytes (macroglia) initiate
calcium (Ca2+) signaling in response to many stimuli, including extracellular hypoosmolarity.
Therefore, if the BBB is to be disrupted using hyperosmolar infusions, careful attention to the type
and dynamics of the brain response is required.
2.6 MRI Detection of BBB Disruption
With the use of an extracellular MR contrast agent, such as gadopentate dimeglumine
(gadolinium diethylenetriaminepentaacetic acid or Gd-DTPA), that does not cross a normally intact
BBB, pathologies of the BBB are more easily detectable in human or animal subjects. After i.v.
infusion, pathological alteration of the BBB allows passage of Gd-DTPA into the brain extravascular
extracellular space (EES (40)), where it collects and results in positive localized enhancement in a
MR image. Gd-DTPA remains in the extracellular space for many minutes or hours; after which it
diffuses back into the vasculature and is excreted by the kidneys (40). Use of i.v.-administered Gd-
DTPA to enhance the contrast of MR images is sometimes referred to as dynamic contrast-enhanced
magnetic resonance imaging or DCE-MRI. Gd-DTPA can also be used to detect areas of BBB

Characteristics and Manipulation of the BBB 80 detection as a binary event, i.e., to detect if enhancement is seen or not. When the degree of BBB
disruption is of interest, methods such as DCE-MRI can be used to provide additional information
regarding the response of tissue pathologies (as they relate to BBB disruption) to therapy (41).
2.6.1 Gd-DTPA Used to Detect Regions of Pathological BBB Disruption
Gd-DTPA-enhanced MRI allows detection of BBB disrupted regions in the brain. Therefore,
MRI can detect BBB disruption resulting for a number of different pathologies such as multiple
sclerosis (MS), brain tumor, and stroke.
Multiple Sclerosis
MS is recognized by inflammatory demylenated lesions in brain white matter. Demyelinated,
but less inflammatory lesions, are also observed in the cortex and normal appearing white matter
(NAWM) of the brain (40). Figure 2-15 shows a MS lesion in the brain using two different MR
techniques; Gd-DTPA enhancement and T2-weighting. Note the difference in the shape of the lesion
between the two images. The Gd-DTPA image indicates BBB damage in the area shown. Gd-DTPA-
enhancing MS lesions microscopically show perivascular inflammation with demyelination and
some myelin breakdown, while non-enhancing MS lesions show little inflammation and near
complete loss of myelin (42).
Figure 2-15: A) Example of a ring-enhancing lesion on a contrast-enhanced T1-weighted MR image. B) The same lesion
as seen on a T2-weighted image. From Ref. (43).

Characteristics and Manipulation of the BBB 81
Figure 2-16: Magnetic resonance images exhibiting evidence of early BBB disruption. Hyperintense signal in the
patient’s left central and precentral sulci is caused by extravasation of Gd-DTPA contrast agent into the cerebral spinal
fluid. Note that enhancement resides primarily in the sulci; the adjacent parenchyma is unexceptional. From Ref. (44).
Stroke
The integrity of the BBB is compromised as a result of a reduction or loss of blood flow to
brain. In clinical situations, reperfusing occluded arteries is the most effective treatment for acute
stroke (44,45). Reperfusion injury is possible, however, and may lead to exacerbated BBB and
neuronal damage. Latour et al. showed that early detection of BBB damage by Gd-DTPA-enhanced
MRI may be a useful target for adjunctive therapy to reduce the negative side-effects of occluded
artery reperfusion, thus improving the clinical outcome of stroke. Results from Latour et al. are
shown in Figure 2-16.
REFERENCES 1. Davson H., Welch K., Segal M. The Physiology and Pathophysiology of the Cerebrospinal
Fluid: Churchill Livingstone; 1987. 2. Crone C. Facilitated transfer of glucose from blood to brain tissue. J Physiology (Lond)
1965;181:103-113.

Characteristics and Manipulation of the BBB 82 3. Reese T.S., Karnovsky M.J. Fine structural localization of a blood-brain barrier to
exogeneous peroxidase. J Cell Biol 1967;34:207-217. 4. Rapoport Stanley I. Blood-Brain Barrier in Physiology and Medicine. Press Raven, editor.
New York: Raven Press; 1976. 5. Crone C. The permeability of capillaries in various organs as determined by use of the
indicator diffusion method. Acta Physiol Scand 1963;58:292-305. 6. Ohno K., Pettigrew K.D., Rapoport S.I. Lower limits of cerebrovascular permeability to
nonelectrolytes in the conscious rat. Am J Physiol 1978;235:H299-H307. 7. Broman T., Lindberg-Broman A.M. An experimental study of disorders in the permeability
of the cerebral vessels ("the blood-brain barrier") produced by chemical and physico-chemical agents. Acta Physiol Scand 1945;10:102-125.
8. Rapoport S.I., Hori M., Klatzo I. Testing of a hypothesis for osmotic opening of the blood-brain barrier. Am J Physiol 1972;223:323-331.
9. Neuwelt E.A. Implications of the Blood-Brain Barrier and Its Manipulation. New York: Plenum Publishing; 1989. 633 p.
10. Goldmann E.E. Vitalfarbung am Zentralnervensystem. Abh Preuss Akad Wiss Phys-Math 1913;1:1-60.
11. Bradbury M.W. The blood-brain barrier: transport across the cerebral endothelium. Circ Res 1985;57:213-222.
12. Claude P. , Goodenough D.A. Fractured faces of zonulae occludentes from "tight" and "leaky" epithelia. J Cell Biol 1973;58:390-400.
13. Clough G., Michel C.C. The role of vesicles in the transport of ferritin through frog endothelium. J Physiology (Lond) 1981;315:127-142.
14. Takasato Y., Rapoport S.I., Smith Q.R. An in situ brain perfusion technique to study cerebrovascular port in the rat. Am J Physiol 1984;247:H484-H493.
15. Ohno K., Fredericks W.R., Rapoport S.I. Osmotic Opening of the Blood-Brain Barrier to Methotrexate in the Rat. Surg Neurol 1979;12:323-328.
16. Rapoport S.I., Fredericks W.R., Ohno K., Pettigrew K.D. Quantitative aspects of reversible osmotic opening of the blood-brain barrier. Am J Physiol 1980;238:R421-R431.
17. Ziylan Y.Z., Robinson P.J., Rapoport S.I. Differential Blood-Brain Barrier Permeabilities to [14C]Sucrose and [3H]Inulin after Osmotic Opening in the Rat. Experimental Neurology 1983;79:845-857.
18. Ziylan Y.Z., Robinson P.J., Rapoport S.I. Blood-brain barrier permeability to sucrose and dextran after osmotic opening. Am J Physiol 1984R634-R638.
19. Farrell C.L. , Shivers R.R. Capillary Junctions of the Rat Are Not Affected by Osmotic Opening of the Blood-Brain Barrier. Acta Neuropathol (Berl) 1984;63:179-189.
20. Cosolo W.C., Martinello P., Louis W.J., N. Christophidis. Blood-brain barrier disruption using mannitol: time course and electron microscopy studies. Am J Physiol 1989R443-R448.
21. Gumerlock M.K., Neuwelt E.A. The Effects of Anesthesia on Osmotic Blood-Brain Barrier Disruption. Neurosurgery 1990;26:268-277.
22. Wolman M., Klatzo I., Chui E., Wilmes F., Nishimoto K., Fujiwara K., Spatz M. Evaluation of the Dye-Protein Tracers in Pathophysiology of the Blood-Brain Barrier. Acta Neuropathol (Berl) 1981;54:55-61.
23. Kroll R.N., Neuwelt E.A. Outwitting the Blood-Brain Barrier for Therapeutic Purposes: Osmotic Opening and Other Means. Neurosurgery 1998;42:1083-1100.

Characteristics and Manipulation of the BBB 83 24. Dodge P., Sotas J.F., Karlsson B. Influence of hypertonicity of the body fluids on the BBB.
Trans Amer neurol Ass 1961;86:12-16. 25. Thompson A.M. Hyperosmotic effects on brain uptake of non-electrolytes. Lassen C.C
Crone and N., editor. Munksgaard, Copenhagen; 1970. 459-467 p. 26. Remsen L.G., Pagel M.A., McCormick C.I., Fiamengo S.A., Sexton G., Neuwelt E.A. The
Influence of Anesthetic Choice, PaCO2, and Other Factors on Osmotic Blood-Brain Barrier Disruption in Rats with Brain Tumor Xenografts. Anesth Analg 1999;88:559-567.
27. Chi O.Z. Effects of Isoflurane on Transport across the Blood-Brain Barrier. Anesthesiology 1992;76:426-431.
28. Suzuki M., Iwasaki Y., Yamamoto T., Konno H., Kudo H. Sequelae of the osmotic blood-brain barrier opening in rats. J Neurosurg 1988;69:421-428.
29. Salahuddin T.S., Johansson B.B., Kalimo H., Olsson Y. Structural Changes in the Rat Brain After Carotid Infusions of Hyperosmolar Solutions: A Light Microscopic and Immunohistochemical Study. Neuropathol Appl Neurobiol 1988;14:467-482.
30. Salahuddin T.S., Johansson B.B., Kalimo H., Olsson Y. Structural changes in the rat brain after carotid infusions of hyperosmolar solutions. Acta Neuropathol 1988;77:5-13.
31. Klatzo I. Pathophysiological aspects of brain edema. Acta Neuropathol (Berl) 1987;72:236-239.
32. Neuwelt E.A. Implications of the Blood-Brain Barrier and Its Manipulation. New York: Plenum Publishing; 1989.
33. Unterberg A.W., Stover J., Kress B., Kiening K.L. Edema and Brain Trauma. Neurosci 2004;129:1021-1029.
34. Wahl M., Unterberg A., Baethmann A., Schilling L. Mediators of Blood-Brain Barrier Dysfunction and Formation of Vasogenic Brain Edema. JCBFM 1988;8:621-634.
35. Vorbrodt A.V., Lossinsky A.S., Wisniewski H.M., Suzuki R., Yamaguchi T., Masaoka H., Klatzo I. Ultrastructural observations on the transvascular route of protein removal in vasogenic brain edema. Acta Neuropathol (Berl) 1985;66:265-273.
36. Rapoport S.I. Brain edema and the blood-brain barrier. In: KMA Welch LR Caplan, DJ Reis, BK Siesjo, B Weir, editor. Primer on cerebrovascular diseases. London: Academic Press; 1997.
37. Reulen H.J., Graham R., Spatz M. et al. Role of pressure gradients and bulk flow in dynamics of vasogenic edema. J Neurosurg 1977;46:24-35.
38. Gullans S.R. Control of Brain Volume During Hyperosmolar and Hypoosmolar Conditions. Annu Rev Med 1993;44:289-301.
39. Lang F., Busch G.L., Ritter M., Volki H., Waldegger S., Gulbins E. Functional Significance of Cell Volume Regulatory Mechanisms. Phys Rev 1998;78:247-306.
40. Tofts P. Quantitative MRI of the Brain. Chichester: John Wiley and Sons Ltd; 2004. 41. Tofts P.S., Kermode A.G. Measurement of the Blood-Brain Barrier Permeability and
Leakage Space Using Dynamic MR Imaging. 1. Fundamental Concepts. Magn Reson Med 1991;17:357-367.
42. Katz D. , Taubenberger J.K., Cannella B., McFarlin D.E., Raine C.S., McFarland H.F. Correlation between magnetic resonance imaging findings and lesion development in chronic, active multiple sclerosis. Ann Neurol 1993;34:661-669.
43. Petrella J.R., Grossman R.I., McGowan J.C., Campbell G., Cohen J.A. Multiple Sclerosis Lesions: Relationship between MR Enhancement Pattern and Magnetization Transfer Effect. Am J Neuroradiol 1996;17:1041-1049.

Characteristics and Manipulation of the BBB 84 44. Latour L.L., Kang D-W., Ezzeddine M.A., Chalela J.A., Warach S. Early Blood-Brain
Barrier Disruption in Human Focal Brain Ischemia. Ann Neurol 2004;56:468-477. 45. Brott T., Bogousslavsky J. Treatment of acute ischemic stroke. New Engl J Med
2000;343:710-722.

CHAPTER 3
Theory and Application of Manganese-Enhanced
Magnetic Resonance Imaging (MEMRI)
Introduction to MEMRI
Magnetic Resonance Contrast Agent Physics Effect of Contrast Agents MR Parameters
Relaxation Effects of Paramagnetic Ion Metal Complexes
Manganese (Mn2+) as Calcium Analog Neurotransmission in Brain: The Role of Calcium Channels M Passage into Cells via Voltage-Gated Calcium Channels
Manganese Toxicity and Cellular Effects of Manganese Mn2+ In Vivo After Intravenous (I.V.) Infusion
Mn2+ Transport Across the Blood-Brain Barrier (BBB)
Mn2+ as MR Contrast Agent – Mn2+-Enhanced Magnetic Resonance Imaging (MEMRI) MEMRI with Mn-DPDP
MEMRI with MnCl2 A Review of Experiments in Brain Imaging with MnCl2

Theory and Application of MEMRI 85
Introduction
Manganese-enhanced magnetic resonance imaging (MEMRI) is a relatively new MR
technique for functional and anatomical MR imaging based on unique physiological response
mechanisms to divalent manganese (Mn2+). Lin and Koretsky first used MEMRI for functional brain
imaging. Following infusion of MnCl2 into the brain extracellular space, regions of the rat brain that
responded to electrical forepaw stimulation could be visualized using MEMRI (1). Following Lin
and Koretsky’s work, a number of MEMRI studies of functional brain imaging were published. For
example, MEMRI was used to trace odor-induced activation in the olfactory bulb of mice (2); for in
vivo trans-synaptic tract tracing in murine striatum (3); for in vivo characterization of
neuroarchitecture in rat brain (4); and for visualization of cortical spreading depression (CSD) in rat
brain (5).
One of the characteristics that makes Mn2+ a unique MR contrast agent for visualizing brain
function is its ability to enter cells through voltage-gated calcium channels (6). Manganese competes
with calcium for cellular entry, is retained in cells for substantially longer time periods than calcium,
and supports exocytosis (6,7). Once inside the cell, the paramagnetic properties of Mn2+ change the
MR relaxation times of water protons in the cell; resulting in localized signal increases in T1-
weighted MR images in regions of Mn2+ uptake (1). The ability of MEMRI to image brain function
is limited by MnCl2 toxicity in vivo, heterogeneous distribution of Mn2+ in the brain extracellular
space, and non-specific brain activation by environmental stimuli. This chapter reviews some of the
concepts needed to understand the use of MEMRI for the applications presented in this dissertation.
These include MR-contrast-agent physics, Mn2+ in biological systems, and Mn2+ as a MR contrast
agent.
3.1 Magnetic Resonance Contrast Agent Physics
The selection of an appropriate MR contrast agent depends on several important factors such
as the tissue of interest, the type of contrast desired (i.e., positive or negative enhancement), and the
experimental setting (i.e., clinical or animal research). In the design of MR contrast agents, several
characteristics must be considered to effectively enhance the MR signal in vivo and to prevent
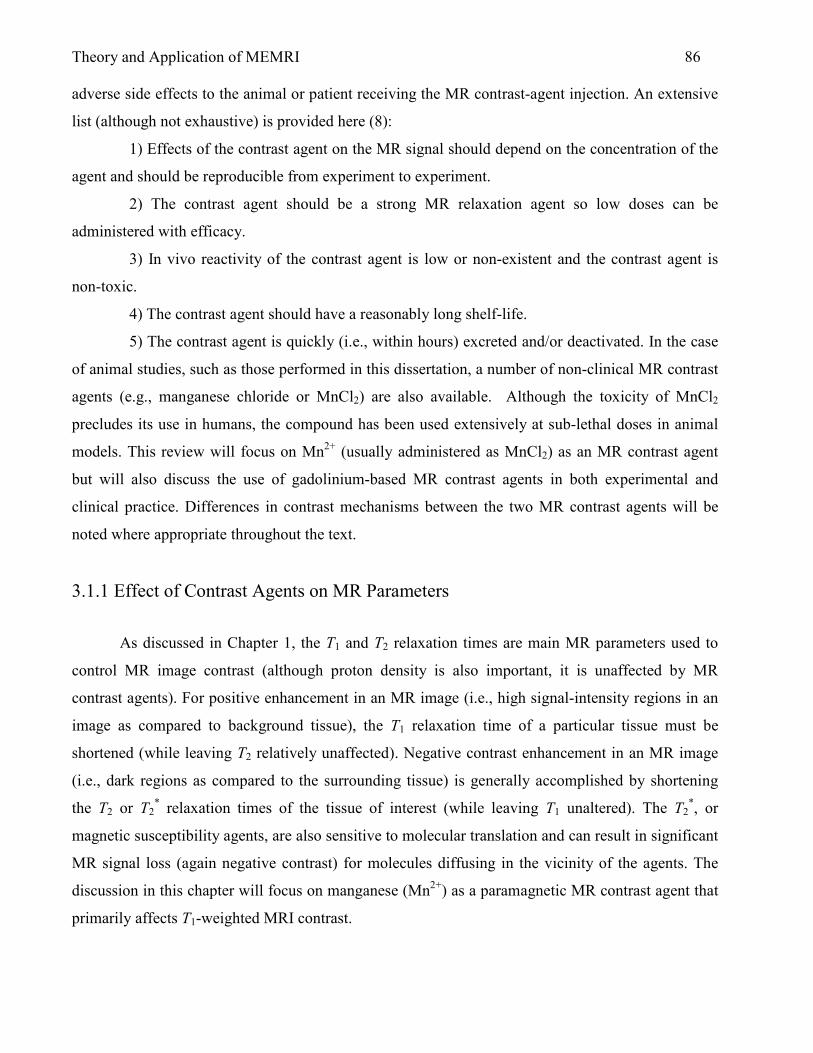
Theory and Application of MEMRI 86 adverse side effects to the animal or patient receiving the MR contrast-agent injection. An extensive
list (although not exhaustive) is provided here (8):
1) Effects of the contrast agent on the MR signal should depend on the concentration of the
agent and should be reproducible from experiment to experiment.
2) The contrast agent should be a strong MR relaxation agent so low doses can be
administered with efficacy.
3) In vivo reactivity of the contrast agent is low or non-existent and the contrast agent is
non-toxic.
4) The contrast agent should have a reasonably long shelf-life.
5) The contrast agent is quickly (i.e., within hours) excreted and/or deactivated. In the case
of animal studies, such as those performed in this dissertation, a number of non-clinical MR contrast
agents (e.g., manganese chloride or MnCl2) are also available. Although the toxicity of MnCl2
precludes its use in humans, the compound has been used extensively at sub-lethal doses in animal
models. This review will focus on Mn2+ (usually administered as MnCl2) as an MR contrast agent
but will also discuss the use of gadolinium-based MR contrast agents in both experimental and
clinical practice. Differences in contrast mechanisms between the two MR contrast agents will be
noted where appropriate throughout the text.
3.1.1 Effect of Contrast Agents on MR Parameters
As discussed in Chapter 1, the T1 and T2 relaxation times are main MR parameters used to
control MR image contrast (although proton density is also important, it is unaffected by MR
contrast agents). For positive enhancement in an MR image (i.e., high signal-intensity regions in an
image as compared to background tissue), the T1 relaxation time of a particular tissue must be
shortened (while leaving T2 relatively unaffected). Negative contrast enhancement in an MR image
(i.e., dark regions as compared to the surrounding tissue) is generally accomplished by shortening
the T2 or T2* relaxation times of the tissue of interest (while leaving T1 unaltered). The T2
*, or
magnetic susceptibility agents, are also sensitive to molecular translation and can result in significant
MR signal loss (again negative contrast) for molecules diffusing in the vicinity of the agents. The
discussion in this chapter will focus on manganese (Mn2+) as a paramagnetic MR contrast agent that
primarily affects T1-weighted MRI contrast.
Theory and Application of MEMRI 87 3.1.2 Relaxation Effects of Paramagnetic Ion Metal Complexes
Divalent manganese (Mn2+) ions possess five unpaired electrons and are therefore
paramagnetic by nature. Each unpaired electron in the Mn2+ ion possesses an electron MDM (just as
in the case of nuclei, electron spin pairing results in a net cancellation of the respective electron
MDMs). The five unpaired electron MDMs then sum to form a net electron MDM for Mn2+, which
in turn co-adds with any external magnetic field that may be present (9). The presence of unpaired
electrons in a paramagnetic ion is mandatory for the ability of the ion to affect the T1 and T2
relaxation times of nearby water protons (10). The relaxation rate of the paramagnetic ion is
proportional to the spin quantum number S by S*(S+1) (10). Consequently, ions with the largest
values of S have been exploited most often as MR contrast agents. For example, S=7/2 for Gd3+ and
S=5/2 for Fe3+, Dy3+, and Mn2+. When a paramagnetic ion is introduced into a solvent (such as
water), the longitudinal and transverse relaxation rates of the solvent nuclei, R1 (1/T1) and R2 (1/T2),
respectively, increase. The magnetic fields associated with the paramagnetic center of the MR
contrast agent then add to the observed relaxation rate of the solvent. This relationship is represented
in Eq. 3.1:
icparamagnetcdiamagnetiobservedTTT
+
=
2,12,12,1
111,
where the diamagnetic component of relaxation is that of the solvent in the absence of the
paramagnetic metal ion. The paramagnetic component of (1/T1,2)observed is dependent upon the
random diffusional translation of the solvent and the paramagnetic complex as well as the chemical
interactions that occur between the solvent and the metal ion. Since the strength of the local
magnetic field associated with the paramagnetic center diminishes rapidly as a function of distance,
the paramagnetic contribution to the solvent T1 relaxation time is not significant unless the solvent is
in close proximity to the paramagnetic center. This generally requires a direct chemical interaction
between the solvent and the paramagnetic complex. If this is not the case, then the paramagnetic
effect will only be transmitted by diffusional interactions between the solvent and metal-ion
complex; resulting in a much weaker effect. The chemical interactions that occur between solvent
nuclei and the paramagnetic complex can be summarized by three distinct types: primary
3.1

Theory and Application of MEMRI 88 coordination sphere interaction, second coordination sphere interaction, and outer sphere relaxation
(9). These chemical interactions can be represented schematically as shown in Figure 3-1.
Figure 3-1: Chemical and non-chemical interactions between solvent molecules (in this case water) and a paramagnetic
metal complex (M) that enhance the relaxation time of the solvent molecules. A) Solvent molecule primary coordination
sphere; B) Solvent molecules binding indirectly (e.g., by hydrogen bonding) to the paramagnetic complex in its second
coordination sphere; and C) translational diffusion of the solvent molecule in the outer sphere of the paramagnetic metal
(or metal complex) with no direct or indirect chemical binding interaction between the two species. Reconstructed from
Ref. (9).
Relaxation mechanisms by water-molecule binding to the primary and second coordination sphere of
the metal ion are typically lumped into one relaxation effect referred to as “inner-sphere relaxation”
(A and B of Figure 3-1). Relaxation mechanisms by translational diffusion of the water molecule
past the metal ion is commonly referred to as “outer sphere relaxation” (10).
Inner-Sphere Relaxation
In contrast agent design, it is important to consider the formation of a ‘coordinate covalent’
molecular bond between a water molecule and the primary coordination sphere of the paramagnetic
ion. As the number of water molecules that are able to bind or interact with the paramagnetic ion
increase, the relaxation effect also increases. Since water molecules are in rapid chemical exchange
between the outer and inner spheres of the paramagnetic complex, the residence time – or the time
each water molecule spends bound to the metal complex – is important. If the residence time is
short, many water molecules in the vicinity of the paramagnetic complex have an opportunity to bind
on the time scale of the MR experiment. A rapid exchange rate – on the order of one microsecond or

Theory and Application of MEMRI 89 less – is desirable for a significant relaxation effect (10). The effect of inner-sphere relaxation on the
longitudinal relaxation rate, R1 (1/T1) is given by Eq. 3.2 (9).
( )MM
M
T
qPsphereinner
T τ+=
11
1,
where PM is the mole fraction of metal ion, q is the number of water molecules bound per metal ion,
T1M is the T1 relaxation time of the water protons bound to the metal, and τM is the residence time of
the bound water. Clearly, as the residence time of the bound water decreases, the relaxation rate
(1/T1) increases. As the number of bound water molecules (q) increases, the relaxation rate
increases. Finally, as might be expected in the design of an MR contrast agent, an increase in the
concentration of the MR contrast agent (PM) also increases the relaxation rate.
Outer-Sphere Relaxation
No direct bonding of chemical exchange is involved with outer-sphere relaxation effects of
paramagnetic ions. The primary determinant of the outer-sphere relaxation properties of the
paramagnetic ion is the rotational and translational diffusion properties of the ion. The faster a
contrast agent can diffuse throughout solvent the greater the relaxation effect of the contrast agent
because more water molecules are encountered and affected along its diffusional path. This is an
important aspect of MR contrast-agent design because paramagnetic ions are typically chelated with
a ligand, such as diethylenetriamenepentaaceticacid (DTPA), to minimize toxicity. In so doing, the
rotational and translational diffusion rate of the chelated paramagnetic complex is reduced, resulting
in a less efficient relaxation effect.
The outer-sphere relaxation effect is also dependent on how close water molecules can get to
the magnetic dipole field at the center of the paramagnetic complex. If the attached chelates are too
large, water molecules may only experience little or no effect from the paramagnetic ion dipole,
resulting in low relaxation efficiency of the contrast agent (10). Indeed, the paramagnetic effect
depends strongly on the distance between the metal ion and water proton, as shown in Eq. 3.3,
6
1
reffecticparamagnet ∝ ,
3.2
3.3

Theory and Application of MEMRI 90 where r is the mean distance between the paramagnetic center and the resonating water protons (11).
The effect of outer-sphere relaxation on longitudinal relaxation is represented in general form by Eq.
3.4 and incorporates the effects of translational diffusion and electronic relaxation (9).
[ ])(3)(7)1(1
113
222
1eDIeDS
D
SIS
sphereouter
TITId
SSNC
T′′′′ +
+=
τωτω
τγγπ η
In Eq. 3.4, C is a numerical constant, NS is the number of metal ions per cubic centimeter, d is the
closest distance achieved between the metal complex and solvent molecule, and τD is the
translational diffusion time. τD depends on the diffusion coefficients of the metal complex and water,
DS and DI, respectively, as given by Eq. 3.5
)(3
2
IS
DDD
d
+=τ .
During the process of designing MR contrast agents, organic ligands are chemically bonded
to the metal ion to form a metal chelate. Complexation ensures in vivo stability (minimizing the
toxicity of the free metal) but also reduces the chemical exchange capability (and the inner-sphere
relaxation effect) of the MR contrast agent. Therefore, enhancing the effects of outer-sphere
relaxation is also an important consideration in the design of MR contrast agents.
3.2 Manganese as a Calcium (Ca) Analog
Divalent manganese (Mn2+) has an ionic radius similar to calcium (Ca2+) (.92Å for Mn2+ vs.
1.14Å for Ca2+) and is handled similarly to Ca by biological systems (6). The uptake of Mn2+ by
active brain cells results in localized contrast enhancement in T1-weigthed MR images. This makes
Mn2+ a useful brain anatomical and functional contrast agent. The mechanism of Mn2+ uptake by
brain cells and the consequence regarding MR imaging and in vivo toxicity are discussed here.
3.4
3.5
Theory and Application of MEMRI 91 3.2.1 Neurotransmission in Brain: The Role of Calcium Channels
The topic of neurotransmission in brain is vast and is not covered in detail in this section.
However, a review of neuronal structure and function will serve as an appropriate foundation upon
which the role of calcium channels in neurotransmission can be based.
Brain Neuron Structure and Neurotransmission
The neuron is unique in structure among mammalian cells. Three unique elements make up
the neuron: the axon, specialized for intracellular information transfer; the dendrite, very often the
site at which information is received from other neurons; and the synapse, which is the point of
information transfer between neurons (12). Figure 3-5 is an artist’s depiction of two adjacent
neurons and one synapse between them. Communication between neurons is made possible by
electrical impulses or action potentials along the axon and by chemical transmission of information –
via neurotransmitters – across the synapse. Arrival of an action potential at the presynaptic terminal
(signal-emitting neuron in Figure 3-2) initiates a sequence of events that leads to the release of
neurotransmitters to the postsynaptic neuron (signal-receiving neuron in Figure 3-2). As part of this
sequence, the opening of Ca channels causes a rapid influx of Ca into the presynaptic cleft, due to
the steep concentration gradient of Ca across the cell membrane (external [Ca] ~ 1mM, internal [Ca]
~ 0.1µM) (13). In response to a transient rise in cytoplasmic calcium concentration,
neurotransmitters are released from the presynaptic terminal to the postsynaptic terminal.

Theory and Application of MEMRI 92
Figure 3-2: Two neurons separated by a synapse. From
www.niaaa.nih.gov/Resources/GraphicsGallery/Neuroscience/synapse.htm
3.2.2 Mn2+ Passage into Cells via Voltage-Gated Calcium Channels
Due to its similar ionic radius and charge, Mn2+ enters cells via voltage-gated calcium
channels (VGCCs). Methods to show Mn2+ accumulation in cells through VGCCs have been
performed by several groups using in vitro techniques. Drapeau et al. (6) used pinched-off
presynaptic nerve endings (synaptosomes) isolated from rat brain to compare uptake of Ca2+ and
Mn2+ after nerve stimulation. The time course of Mn2+ uptake was similar to that of Ca2+, suggesting
one mechanism for mediating cellular uptake of Ca2+ and Mn2+. Figure 3-3 shows the Ca2+ and Mn2+
uptake time course from Drapeau et al. (6). To further support the hypothesis that Mn2+ enters cells
through VGCCs, Drapeau et al. tested an organic calcium-channel antagonist (blocker), verapamil,
for its effectiveness in preventing cellular uptake of Mn2+. Results from these experiments are shown
in Figure 3-4. Verapamil has also been used to inhibit uptake of Ca2+ and Mn2+ in frog motor nerve
terminals. Narita et al. (14) showed a decline in the frequency of miniature end-plate

Theory and Application of MEMRI 93
Figure 3-3: The time course of K-stimulated Ca2+ or Mn2+ uptake in striatal synaptosomes. The solutions with radiotracer
Ca2+ (filled circles) or Mn2+ (open circles) contained 0.02mM of both these divalent cations. Reproduced from Ref. (6).
Figure 3-4: The effect of verapamil (80µM) on the K-stimulated uptake of Ca2+ and Mn2+. The first bar of each pair
shows the uptake in the absence of verapamil. The second bar shows the uptake in the presence of verapamil (V).
Reproduced from Ref. (6)
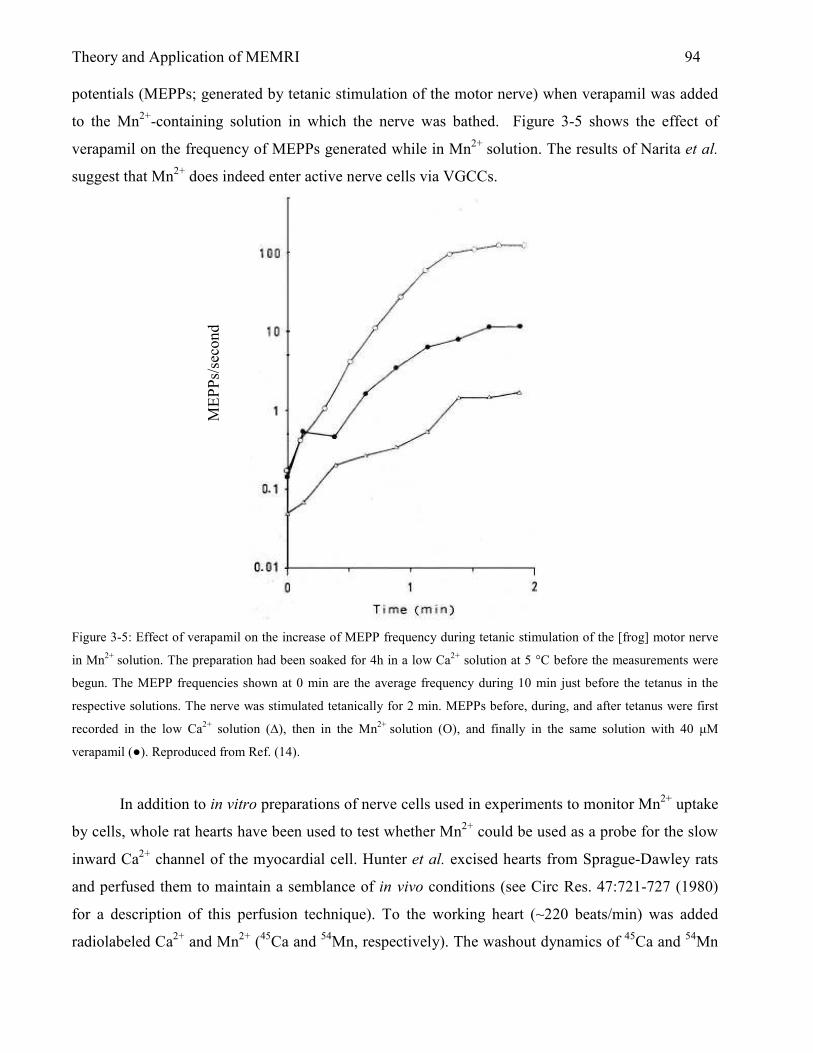
Theory and Application of MEMRI 94 potentials (MEPPs; generated by tetanic stimulation of the motor nerve) when verapamil was added
to the Mn2+-containing solution in which the nerve was bathed. Figure 3-5 shows the effect of
verapamil on the frequency of MEPPs generated while in Mn2+ solution. The results of Narita et al.
suggest that Mn2+ does indeed enter active nerve cells via VGCCs.
Figure 3-5: Effect of verapamil on the increase of MEPP frequency during tetanic stimulation of the [frog] motor nerve
in Mn2+ solution. The preparation had been soaked for 4h in a low Ca2+ solution at 5 °C before the measurements were
begun. The MEPP frequencies shown at 0 min are the average frequency during 10 min just before the tetanus in the
respective solutions. The nerve was stimulated tetanically for 2 min. MEPPs before, during, and after tetanus were first
recorded in the low Ca2+ solution (∆), then in the Mn2+ solution (O), and finally in the same solution with 40 µM
verapamil (●). Reproduced from Ref. (14).
In addition to in vitro preparations of nerve cells used in experiments to monitor Mn2+ uptake
by cells, whole rat hearts have been used to test whether Mn2+ could be used as a probe for the slow
inward Ca2+ channel of the myocardial cell. Hunter et al. excised hearts from Sprague-Dawley rats
and perfused them to maintain a semblance of in vivo conditions (see Circ Res. 47:721-727 (1980)
for a description of this perfusion technique). To the working heart (~220 beats/min) was added
radiolabeled Ca2+ and Mn2+ (45Ca and 54Mn, respectively). The washout dynamics of 45Ca and 54Mn
MEPP
s/se
cond

Theory and Application of MEMRI 95 were monitored and showed that the cellular retention of Mn2+ was longer than that of Ca2+, as
shown in Figure 3-6 (15).
Figure 3-6: Comparison of 45Ca and 54Mn washout from rat heart. Hearts were perfused in the working mode for 10 min
with the basal perfusate containing either 45Ca (●) or 54Mn (o). Reproduced from Ref. (15).
Data from Figure 3-6 were used to determine that the selective accumulation of Mn2+ by the
heart ‘compartment’ is 8 times greater than that for Ca2+. This compartment was suggested to be the
heart cell and the method of entry was tested by using the Ca2+ channel blocking agent verapamil.
Table 3-1 shows data from the Hunter et al. study, indicating that an inhibition of cellular Mn2+
accumulation was observed for hearts that were perfused with verapamil following perfusion with
Mn2+.

Theory and Application of MEMRI 96
Table 3-1: Hearts were perfused with basal perfusate for 5-min in the working mode before turning on the perfusion
pump which added verapamil, oligomycin or ethanol (control) to the perfusate. Reproduced from Ref. (15).
In addition to evidence showing the accumulation of Mn2+ within the cell via passage
through VGCCs, Hunter et al. show that of the Mn2+ that enters cells, 30% is taken up by
mitochondria. The accumulation of Mn2+ in mitochondria is suggested to occur via a mechanism of
Ca2+-Mn2+ co-transport (15,16). The very slow rate of Mn2+ efflux from brain mitochondria is
believed to contribute to brain mitochondria accumulation and uptake of Mn2+ in brain tissue in
general. Apparently, brain mitochondria possess a mechanism for Mn2+ influx – but no method for
Mn2+ clearance – other than by the slow Na+-dependent mechanism (17). Ample evidence suggests
that Mn2+ can enter cells through VGCCs.
Additional experiments show that Ca2+ and Mn2+ compete for the same entry routes into the
cell. This suggests that Mn2+ could affect the function of the cell with possible adverse physiological
effects to the cell in vitro or in vivo. Indeed, Mn2+ is known to be toxic in humans and animals at
certain doses and MEMRI studies must confront this matter, especially for experiments in vivo. For
infusions of low doses of Mn2+ that are not toxic, it is still important to consider the effects that Mn2+
may have on the cell after transport via VGCC’s. These effects may alter the outcome of MEMRI
experiments in brain; for example, those that rely on normal brain response to external stimuli, or the
outcome of MEMRI experiments in other organs, such as the liver.
3.3 Manganese Toxicity and Cellular Effects of Manganese
Manganese Toxicity
Several heavy metals, such as lead (Pb), mercury (Hg), nickel (Ni), zinc (Zn), barium (Ba),
and manganese (Mn2+), are known to be toxic in animals and humans. Most heavy metals interfere

Theory and Application of MEMRI 97 with the voltage-gated entry of Ca2+ into the nerve terminal and interfere with normal rapidly-acting
Ca-buffering processes and ATP-dependent processes for maintenance of internal Ca2+ balance (18).
Figure 3-7 shows the sites of action in the neuromuscular junction which may be affected by heavy
metals.
Figure 3-7: Simplified representation of the neuromuscular junction showing sites of action and processes which may be
affected by heavy metals: (1) action potential propagation; (2) voltage-gated entry of Ca2+ into the nerve terminal; (3)
interaction of Ca2+ with vesicles and plasmalemma at “active zones” to affect exocytosis; (4) buffering of Ca2+ by Na+-
Ca2+ exchange and ATP-driven Ca2+ pumps; (5) maintenance of membrane potential by ATP-dependent Na+-K+ pumps;
(6) diffusion of acetylcholine (ACh) (neurotransmitter) within the synaptic cleft and hydrolysis of ACh by
acetylcholinesterase; (7,8) interaction of ACh with endplate receptors; and (9) maintenance of endplate potential and
other membrane properties. Reproduced from Ref. (18).
Some heavy metals are clearly more toxic than others. Our main concern is the toxicity of
Mn2+. First, however, it is important to consider that Mn2+ is an essential trace element and is present
within all mammalian cells. In humans, the normal body content of Mn2+ is 12 to 20 mg (218 to 364
µmol) (19). Normal dietary levels of Mn2+ are not likely toxic due to the regulation of
gastrointestinal absorption. Mn2+ has important metabolic functions for the cell as a coenzyme in
protein synthesis (19) and appears to be important for the proper function of the pancreas according
to experimental evidence which showed that Mn2+ stimulates enzyme secretion from the rat pancreas
(20). The toxicity of Mn2+ in man is typically a result of exposure to high levels of Mn2+ in dust
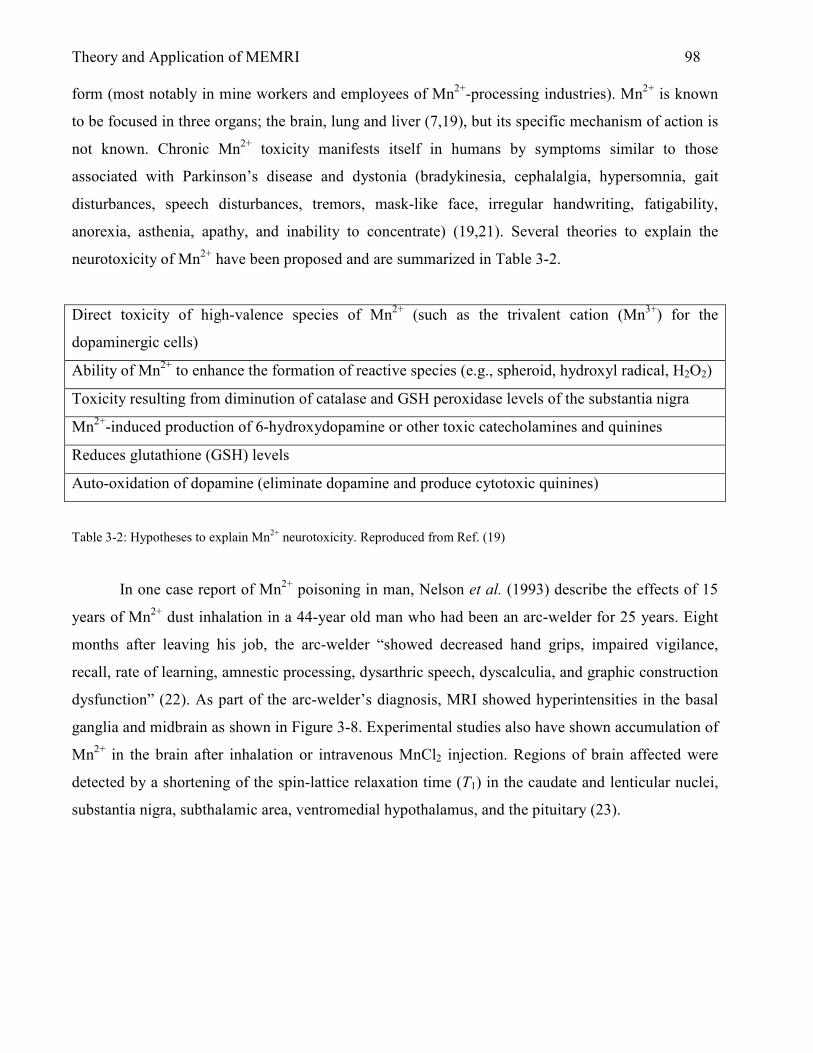
Theory and Application of MEMRI 98 form (most notably in mine workers and employees of Mn2+-processing industries). Mn2+ is known
to be focused in three organs; the brain, lung and liver (7,19), but its specific mechanism of action is
not known. Chronic Mn2+ toxicity manifests itself in humans by symptoms similar to those
associated with Parkinson’s disease and dystonia (bradykinesia, cephalalgia, hypersomnia, gait
disturbances, speech disturbances, tremors, mask-like face, irregular handwriting, fatigability,
anorexia, asthenia, apathy, and inability to concentrate) (19,21). Several theories to explain the
neurotoxicity of Mn2+ have been proposed and are summarized in Table 3-2.
Direct toxicity of high-valence species of Mn2+ (such as the trivalent cation (Mn3+) for the
dopaminergic cells)
Ability of Mn2+ to enhance the formation of reactive species (e.g., spheroid, hydroxyl radical, H2O2)
Toxicity resulting from diminution of catalase and GSH peroxidase levels of the substantia nigra
Mn2+-induced production of 6-hydroxydopamine or other toxic catecholamines and quinines
Reduces glutathione (GSH) levels
Auto-oxidation of dopamine (eliminate dopamine and produce cytotoxic quinines)
Table 3-2: Hypotheses to explain Mn2+ neurotoxicity. Reproduced from Ref. (19)
In one case report of Mn2+ poisoning in man, Nelson et al. (1993) describe the effects of 15
years of Mn2+ dust inhalation in a 44-year old man who had been an arc-welder for 25 years. Eight
months after leaving his job, the arc-welder “showed decreased hand grips, impaired vigilance,
recall, rate of learning, amnestic processing, dysarthric speech, dyscalculia, and graphic construction
dysfunction” (22). As part of the arc-welder’s diagnosis, MRI showed hyperintensities in the basal
ganglia and midbrain as shown in Figure 3-8. Experimental studies also have shown accumulation of
Mn2+ in the brain after inhalation or intravenous MnCl2 injection. Regions of brain affected were
detected by a shortening of the spin-lattice relaxation time (T1) in the caudate and lenticular nuclei,
substantia nigra, subthalamic area, ventromedial hypothalamus, and the pituitary (23).

Theory and Application of MEMRI 99
Figure 3-8: Left: Axial T1-weighted image (TR/TE, 500/15ms) at the level of the basal ganglia. Increased signal intensity
in the globus pallidus (arrows) that is bilateral and symmetrical reflects shortened T1 relaxation due to the paramagnetic
effect of Mn2+. Right: T2-weighted image (TR/TE, 2500/70ms) is unremarkable. Some decreased signal intensity in the
basal ganglia is normally expected for this age of patient. Reproduced from Ref. (22). Note: Although the author
suggests here that the T2 image is ‘unremarkable’, this is not clear since the regional T2 hypointensities correspond very
closely to the regions of T1 hyperintensity shown in the T1 image. Therefore, the T2 hypointensities may also be due to
high local concentrations of paramagnetic Mn2+. Discoloration in left side of image is due to artifacts from scanning
images from reference material.
Adverse Effects of Intracellular Mn2+
Mn2+ is required for the basic metabolic regulation of the cell. For example, Mn2+ is
complexed to the astrocytic enzyme, glutamine synthetase, involved in the synthesis of the
excitatory and neurotoxic amino acid glutamate. Also, Mn2+ is an important cofactor for the outer-
mitochondrial form of superoxide dismutase which is a major enzyme protecting cells from
oxidative stress (24,25). Mn2+ homeostasis necessary to maintain normal cell function can be
disrupted by overexposure of Mn2+. In cases of Mn2+ overexposure, cell death can be provoked by
apoptosis and necrosis. Apoptosis, however, is not the only means of cytotoxic actions of Mn2+.
Roth and colleagues showed that inhibitors of apoptotic markers, including the caspase family of
proteases and p38 kinase, failed to prevent Mn2+-induced cytotoxicity (26). Therefore, Mn2+ must
provoke other methods of cytotoxic events in the cell. Indeed, it has been shown that Mn2+ disrupts
Theory and Application of MEMRI 100 mitochondrial function by inhibiting the sodium-dependent and sodium-independent exporter of
mitochondrial calcium (17,27). Mn2+ also interferes with oxidative phosphorylation resulting in
depletion of ATP (28). Taken together, inhibition of mitochondria function and depletion of ATP
may be the prevalent mechanism behind Mn2+-induced cell death, even in the presence of apoptotic
signaling (25). Figure 3-9 shows the mechanisms that are known to regulate cellular transport and
toxicity of Mn2+.
3.3.1 Mn2+ In Vivo After Intravenous (I.V.) Infusion
Regions of Mn2+ Accumulation After I.V. Infusion
In the arc-welder case study, the primary route of entry of Mn2+ was through inhalation with
clear neurotoxic effects. After oral administration or ingestion, the gastrointestinal tract metabolizes
Mn2+. Manganese is then transported to the central nervous system (in Mn3+ form) by a path which
includes the portal venous circulation, binding to transferrin in blood and then transported across the
blood-brain barrier (BBB) via transferrin receptors (7). The rate at which Mn2+ is absorbed by the
gastrointestinal tract depends on the amount ingested or administered and the plasma levels of Mn2+.

Theory and Application of MEMRI 101
Figure 3-9: Mechanisms regulating Mn2+ cellular transport and toxicity. Mn2+ and iron are taken up into cells via
transferrin-dependent and independent pathways requiring the divalent metal transporter 1 (DMT 1). Mn2+ is also
transported into cells via the voltage-regulated Ca2+ channel (VR-Ca2+) and glutamate receptor Ca2+ channel (Glu Rec).
Once inside the cell, Mn2+ is transported into the mitochondria via the Ca2+ uniporter. Mn2+ interferes with mitochondrial
F1-ATPase and complex I (CI) causing a decrease in ATP production. Mn2+ inhibits Na+-dependent and –independent
export of Ca2+ out of the mitochondria causing activation of the permeability transition pore (PTP), which eventually
leads to disruption of mitochondrial function. Disruption of mitochondria leads to stress and possible reactive oxygen
species (ROS) promoting both apoptotic and necrotic cell death. Reproduced from Ref. (25).
The amount of Mn2+ absorbed in rats is anywhere between 1% and 4% (7,29). Intravenous
(i.v.) administration of Mn2+ is common and usually includes an infusion of solutions of MnCl2

Theory and Application of MEMRI 102 experimentally or Mn-DPDP clinically. Intravenous infusion bypasses some of the body’s
safeguards or ‘Mn2+ filters’, an idea supported by the fact that the median lethal dose of orally
administered MnCl2 in rats (7.5 mmol/kg) is 25 times higher than that after intravenous infusion (0.3
mmol/kg) in mice (30). After i.v. infusion, Mn2+ accumulates in liver, kidney, pancreas, heart and
brain. Of particular interest here is the accumulation of Mn2+ in brain after an i.v. infusion (and
without experimental blood-brain barrier disruption). Uptake of Mn2+ into brain after i.v. infusion is
a time-dependent phenomenon. Takeda et al. showed that 1h after i.v. infusion of 54MnCl2, 54Mn was
largely concentrated in the lateral and third ventricles including the choroid plexus. At 6 days after
injection, high levels of 54Mn were found in the thalamus, hypothalamus, hippocampus and other
subcortical brain regions (31). One day after i.v. infusion, Aoki et al. showed brain accumulation of
Mn2+ in ventricles, circumventricular organs without a blood-brain barrier such as Pit and
subfornical organ (32-34), olfactory bulb, hippocampus, basal ganglia, ventral striatum, brain stem
and spinal cord (4).
Mn2+ in Blood
After a bolus i.v. infusion of Mn2+ in rats, Mn2+ concentration in plasma decays according to
a bi-exponential equation. As indicated by the results of a study performed by Zheng et al., a bolus
i.v. injection of MnCl2 into male Sprague-Dawley rats results in the blood plasma concentration-time
profile shown in Figure 3-11. Concentration of Mn2+ in blood as a function of time was also given
as:
tt eetC 44.024.4 08.294.41)( −− +=
After i.v. bolus injection, therefore, Mn2+ appears to undergo two phases of elimination from the
body; an initial fast phase and a slower terminal phase. Zheng et al. found the initial fast clearance
phase to last for 1.8 hours while the slower terminal phase of Mn2+ clearance lasted 12 hours; at
which time the concentration of Mn2+ in plasma returned to normal values in all animals (35).
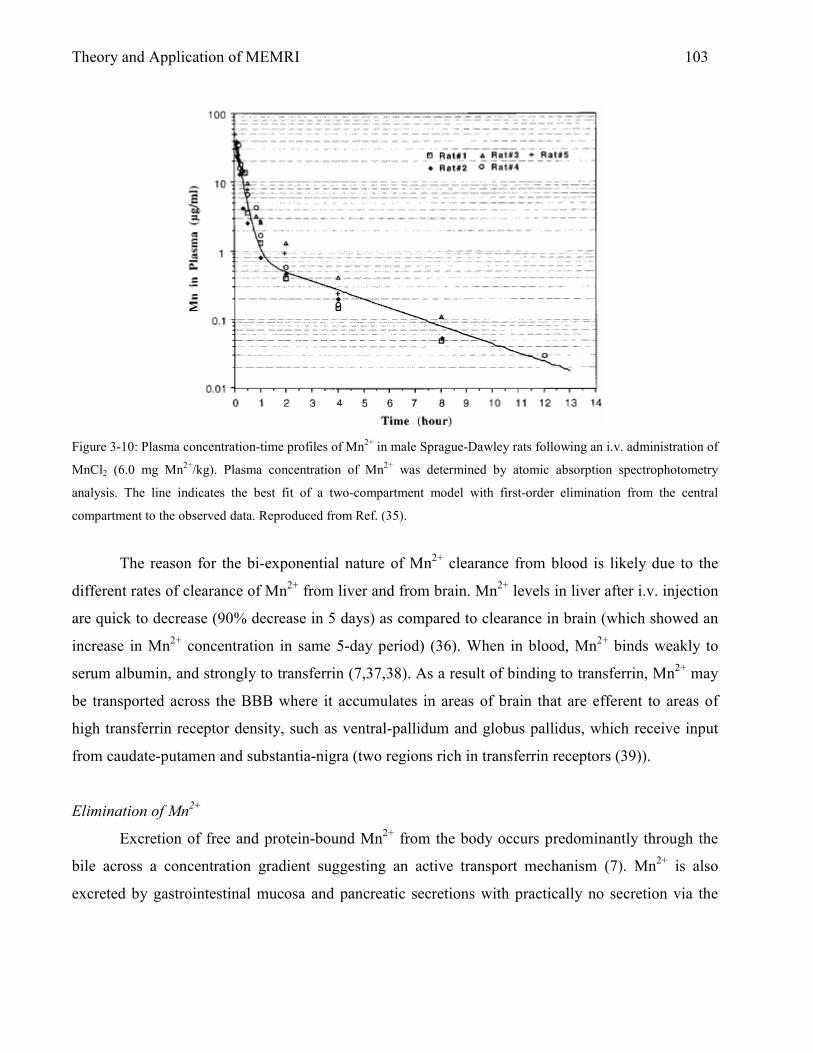
Theory and Application of MEMRI 103
Figure 3-10: Plasma concentration-time profiles of Mn2+ in male Sprague-Dawley rats following an i.v. administration of
MnCl2 (6.0 mg Mn2+/kg). Plasma concentration of Mn2+ was determined by atomic absorption spectrophotometry
analysis. The line indicates the best fit of a two-compartment model with first-order elimination from the central
compartment to the observed data. Reproduced from Ref. (35).
The reason for the bi-exponential nature of Mn2+ clearance from blood is likely due to the
different rates of clearance of Mn2+ from liver and from brain. Mn2+ levels in liver after i.v. injection
are quick to decrease (90% decrease in 5 days) as compared to clearance in brain (which showed an
increase in Mn2+ concentration in same 5-day period) (36). When in blood, Mn2+ binds weakly to
serum albumin, and strongly to transferrin (7,37,38). As a result of binding to transferrin, Mn2+ may
be transported across the BBB where it accumulates in areas of brain that are efferent to areas of
high transferrin receptor density, such as ventral-pallidum and globus pallidus, which receive input
from caudate-putamen and substantia-nigra (two regions rich in transferrin receptors (39)).
Elimination of Mn2+
Excretion of free and protein-bound Mn2+ from the body occurs predominantly through the
bile across a concentration gradient suggesting an active transport mechanism (7). Mn2+ is also
excreted by gastrointestinal mucosa and pancreatic secretions with practically no secretion via the
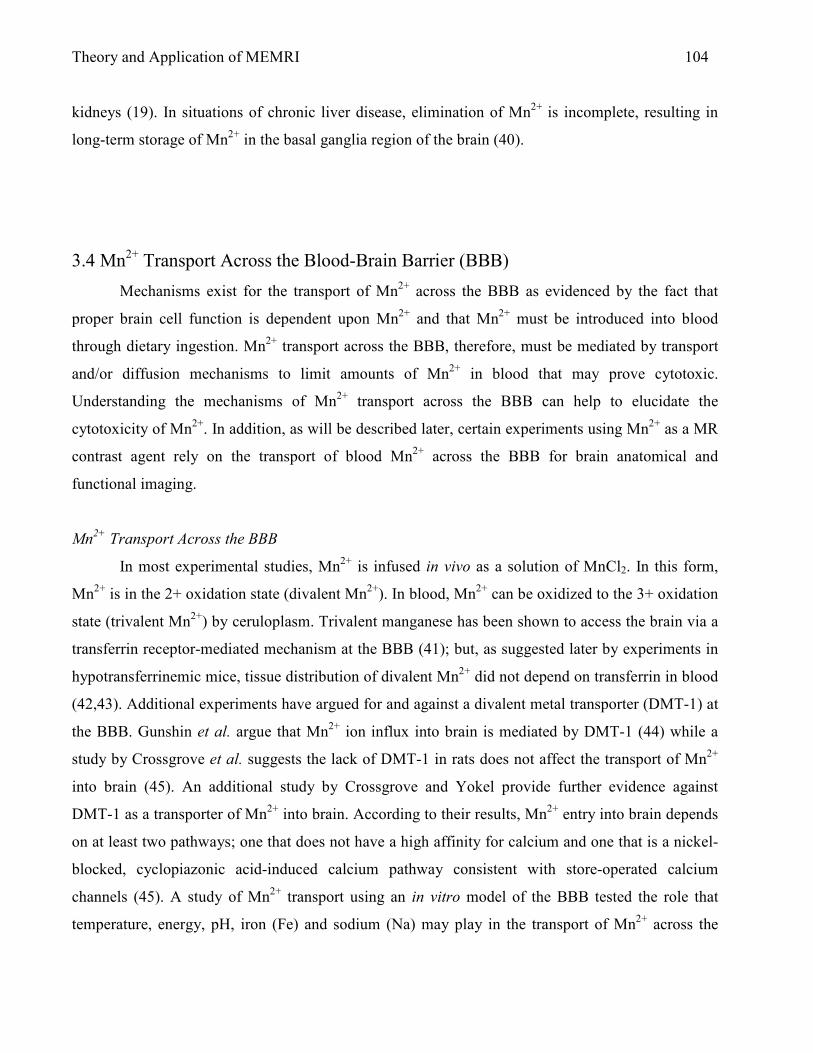
Theory and Application of MEMRI 104 kidneys (19). In situations of chronic liver disease, elimination of Mn2+ is incomplete, resulting in
long-term storage of Mn2+ in the basal ganglia region of the brain (40).
3.4 Mn2+ Transport Across the Blood-Brain Barrier (BBB)
Mechanisms exist for the transport of Mn2+ across the BBB as evidenced by the fact that
proper brain cell function is dependent upon Mn2+ and that Mn2+ must be introduced into blood
through dietary ingestion. Mn2+ transport across the BBB, therefore, must be mediated by transport
and/or diffusion mechanisms to limit amounts of Mn2+ in blood that may prove cytotoxic.
Understanding the mechanisms of Mn2+ transport across the BBB can help to elucidate the
cytotoxicity of Mn2+. In addition, as will be described later, certain experiments using Mn2+ as a MR
contrast agent rely on the transport of blood Mn2+ across the BBB for brain anatomical and
functional imaging.
Mn2+ Transport Across the BBB
In most experimental studies, Mn2+ is infused in vivo as a solution of MnCl2. In this form,
Mn2+ is in the 2+ oxidation state (divalent Mn2+). In blood, Mn2+ can be oxidized to the 3+ oxidation
state (trivalent Mn2+) by ceruloplasm. Trivalent manganese has been shown to access the brain via a
transferrin receptor-mediated mechanism at the BBB (41); but, as suggested later by experiments in
hypotransferrinemic mice, tissue distribution of divalent Mn2+ did not depend on transferrin in blood
(42,43). Additional experiments have argued for and against a divalent metal transporter (DMT-1) at
the BBB. Gunshin et al. argue that Mn2+ ion influx into brain is mediated by DMT-1 (44) while a
study by Crossgrove et al. suggests the lack of DMT-1 in rats does not affect the transport of Mn2+
into brain (45). An additional study by Crossgrove and Yokel provide further evidence against
DMT-1 as a transporter of Mn2+ into brain. According to their results, Mn2+ entry into brain depends
on at least two pathways; one that does not have a high affinity for calcium and one that is a nickel-
blocked, cyclopiazonic acid-induced calcium pathway consistent with store-operated calcium
channels (45). A study of Mn2+ transport using an in vitro model of the BBB tested the role that
temperature, energy, pH, iron (Fe) and sodium (Na) may play in the transport of Mn2+ across the
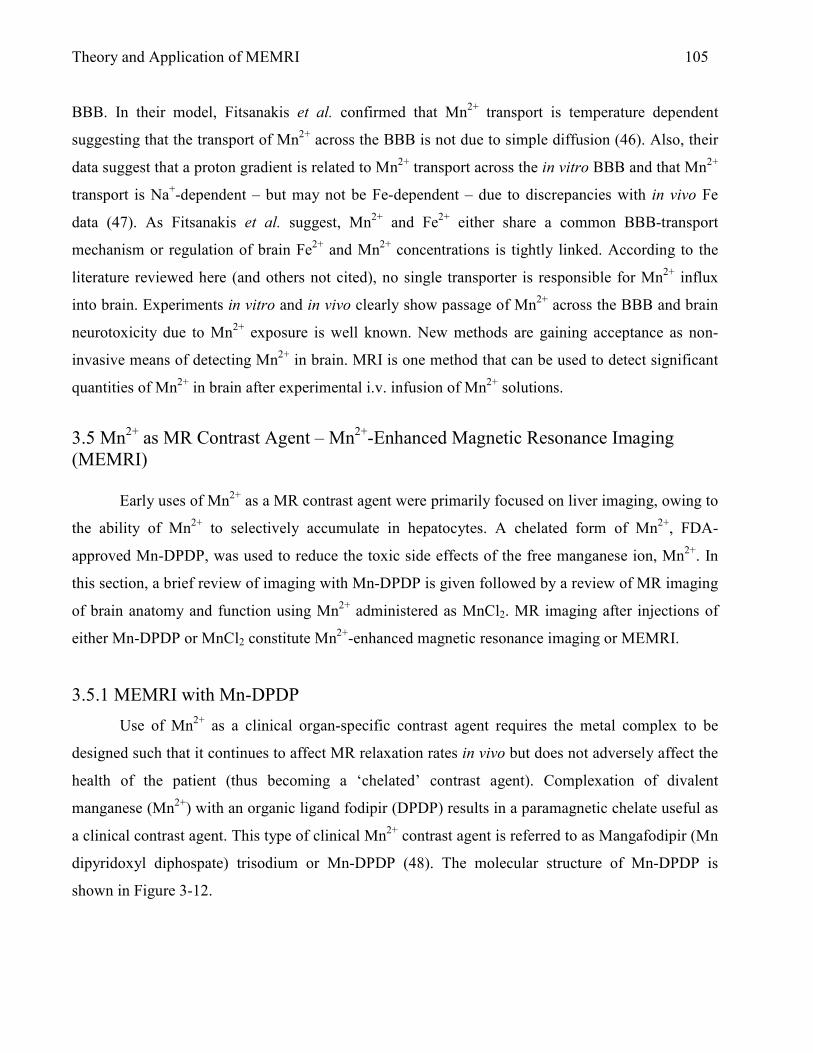
Theory and Application of MEMRI 105 BBB. In their model, Fitsanakis et al. confirmed that Mn2+ transport is temperature dependent
suggesting that the transport of Mn2+ across the BBB is not due to simple diffusion (46). Also, their
data suggest that a proton gradient is related to Mn2+ transport across the in vitro BBB and that Mn2+
transport is Na+-dependent – but may not be Fe-dependent – due to discrepancies with in vivo Fe
data (47). As Fitsanakis et al. suggest, Mn2+ and Fe2+ either share a common BBB-transport
mechanism or regulation of brain Fe2+ and Mn2+ concentrations is tightly linked. According to the
literature reviewed here (and others not cited), no single transporter is responsible for Mn2+ influx
into brain. Experiments in vitro and in vivo clearly show passage of Mn2+ across the BBB and brain
neurotoxicity due to Mn2+ exposure is well known. New methods are gaining acceptance as non-
invasive means of detecting Mn2+ in brain. MRI is one method that can be used to detect significant
quantities of Mn2+ in brain after experimental i.v. infusion of Mn2+ solutions.
3.5 Mn2+ as MR Contrast Agent – Mn2+-Enhanced Magnetic Resonance Imaging (MEMRI)
Early uses of Mn2+ as a MR contrast agent were primarily focused on liver imaging, owing to
the ability of Mn2+ to selectively accumulate in hepatocytes. A chelated form of Mn2+, FDA-
approved Mn-DPDP, was used to reduce the toxic side effects of the free manganese ion, Mn2+. In
this section, a brief review of imaging with Mn-DPDP is given followed by a review of MR imaging
of brain anatomy and function using Mn2+ administered as MnCl2. MR imaging after injections of
either Mn-DPDP or MnCl2 constitute Mn2+-enhanced magnetic resonance imaging or MEMRI.
3.5.1 MEMRI with Mn-DPDP
Use of Mn2+ as a clinical organ-specific contrast agent requires the metal complex to be
designed such that it continues to affect MR relaxation rates in vivo but does not adversely affect the
health of the patient (thus becoming a ‘chelated’ contrast agent). Complexation of divalent
manganese (Mn2+) with an organic ligand fodipir (DPDP) results in a paramagnetic chelate useful as
a clinical contrast agent. This type of clinical Mn2+ contrast agent is referred to as Mangafodipir (Mn
dipyridoxyl diphospate) trisodium or Mn-DPDP (48). The molecular structure of Mn-DPDP is
shown in Figure 3-12.

Theory and Application of MEMRI 106
Figure 3-11: Molecular structure of Mn-DPDP trisodium. Reproduced from Ref. (48).
Mn-DPDP is metabolized by dephosphorylation to Mn dipyridoxyl monophosphate (Mn-
DPMP) and Mn2+ dipyridoxyl ethylenediamene diacetate (Mn-PLED) and is simultaneously
transmetallated with zinc to the corresponding zinc compounds (49). Transmetallation releases the
Mn2+ from the ligand which is likely bound and transported to the liver by α2-macroglobulin and
albumin (49). In normally functioning liver, hepatocytes take up the majority of Mn2+ (50), which is
excreted in the feces via the bile (51). Liver metasteses take up little or no Mn2+, leading to a reliable
method for increasing contrast between normal and diseased liver tissue on MR images. The first
human liver MR imaging results using Mn-DPDP were reported by Lim et al. (52) in 1991. Images
(acquired using a 1.5T clinical MR scanner) from their experiments are shown in Figure 3-12.
Figure 3-12: MR images of the liver obtained a) before and b) 10 minutes after injection of Mn-DPDP (10µmol/kg,
0.016ml/sec). Reproduced from Ref. (52).

Theory and Application of MEMRI 107 Mn-DPDP continues to be used as a liver MR contrast agent and is helpful in preparing for liver
surgery. Joarder et al. used Mn-DPDP in preparation for MR-guided thermal ablation of liver tumor
(53). Clinical images (using a 0.5T open MR scanner) from their work are shown in Figure 3-13.
Figure 3-13: Axial FMSPGR images showing two colorectal metastases before (a) and after (b) Mn-DPDP.
Note improved delineation of the metastases adjacent to the IVC and portal and hepatic veins on the post-Mn-DPDP
scans. Mn2+ not only improves lesion conspicuity but also puncture planning, enabling the avoidance of structures such
as the IVC and portal vein in this case. Reproduced from Ref. (53)
3.5.2 MEMRI with MnCl2
Working With Solutions of MnCl2 – Dose, Concentration, pH, and Osmolarity
Manganese chloride is a salt that is readily available from any major biochemical company
and, in solution form, is the simplest way to deliver Mn2+ experimentally (i.e., in rats or mice). For
experiments detailed in this thesis, the hydrated form of Mn2+ chloride, MnCl2·4H2O (molecular
weight 197.9 g/mol) was used. Solutions of MnCl2 must be compatible with the biological system of
interest. Therefore, chemical properties of the solution such as osmolarity and pH should be
considered to reduce potential toxic side effects of Mn2+. Systemic infusions of MnCl2 solution
should use a [MnCl2] of 100mM to ensure the solution is neither hypertonic nor hypotonic (54).
Hypertonicity or hypotonicity may be more important for targeted injections such as stereotaxic
brain infusions. At 100mM, MnCl2 has a pH of 5.5-5.8 (54) significantly below the normal
physiological level. Bicine dissolved to 100mM in deionized water and pH adjusted to 7.4 with

Theory and Application of MEMRI 108 NaOH can be used to keep the pH of MnCl2 solutions to within the physiological range (54). Dosing
the MnCl2 infusion requires careful attention to the route of administration of Mn2+ and to the size of
the animal. Doses used in past MEMRI studies are summarized in Table 3-3.
Species Route Dose Reference
Rat Intravenous
Intravenous
Intra-arterial
Intravenous
54 mg/kg
60 mg/kg
53 mg/kg
175 mg/kg
Lin and Koretsky (1)
Duong et al (55)
Aoki et al (56)
Aoki et al. (57)
Mouse Nasal
Intravenous
Intravenous
Intraperitoneal
65 mg/kg
175 mg/kg
6.6 mg/kg
20 mg/kg
Pautler et al. (58)
Lee et al. (59)
Hu et al. (60)
Watanabe et al. (61)
Table 3-3: Systemic doses of MnCl2 used in current MEMRI experiments. Reproduced from Ref. (54)
3.5.2.1 – A Review of Experiments in Brain Imaging with MnCl2
Experiments using MnCl2 for experimental brain anatomical and functional imaging are
numerous. Therefore, this section is divided into brain imaging using MnCl2 with and without
disruption of the blood-brain barrier. MEMRI of brain with an intact BBB is useful for brain
anatomical imaging as well as general functional imaging (i.e., uptake of Mn2+ in neuron-rich areas
of hippocampus) while MEMRI of brain with a disrupted BBB is more appropriate for imaging of
specific brain function such as the response to stroke, cortical spreading depression, or forepaw
stimulation.
MEMRI with MnCl2 – Brain Imaging with Intact Blood-Brain Barrier (BBB)
Early imaging studies utilizing MnCl2 for Mn2+-induced contrast enhancement in MR images
were focused on determining the distribution of Mn2+ in the brain as part of Mn2+ neurotoxicity
studies. For example, London and colleagues (62) used i.p. injections of MnCl2 in rats to show that
brain uptake of MnCl2 occurs relatively rapidly in the ventricles and pineal and pituitary glands
(regions devoid of BBB), supporting further study of the toxicity of Mn2+ after accumulation in these
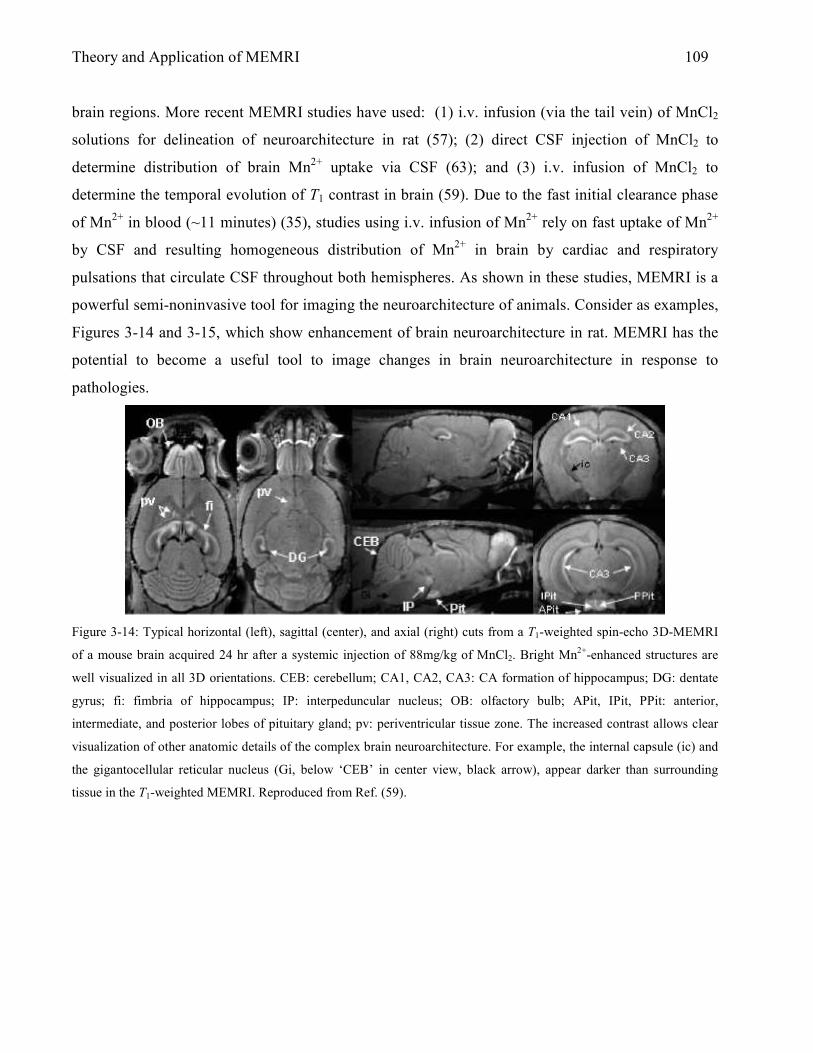
Theory and Application of MEMRI 109 brain regions. More recent MEMRI studies have used: (1) i.v. infusion (via the tail vein) of MnCl2
solutions for delineation of neuroarchitecture in rat (57); (2) direct CSF injection of MnCl2 to
determine distribution of brain Mn2+ uptake via CSF (63); and (3) i.v. infusion of MnCl2 to
determine the temporal evolution of T1 contrast in brain (59). Due to the fast initial clearance phase
of Mn2+ in blood (~11 minutes) (35), studies using i.v. infusion of Mn2+ rely on fast uptake of Mn2+
by CSF and resulting homogeneous distribution of Mn2+ in brain by cardiac and respiratory
pulsations that circulate CSF throughout both hemispheres. As shown in these studies, MEMRI is a
powerful semi-noninvasive tool for imaging the neuroarchitecture of animals. Consider as examples,
Figures 3-14 and 3-15, which show enhancement of brain neuroarchitecture in rat. MEMRI has the
potential to become a useful tool to image changes in brain neuroarchitecture in response to
pathologies.
Figure 3-14: Typical horizontal (left), sagittal (center), and axial (right) cuts from a T1-weighted spin-echo 3D-MEMRI
of a mouse brain acquired 24 hr after a systemic injection of 88mg/kg of MnCl2. Bright Mn2+-enhanced structures are
well visualized in all 3D orientations. CEB: cerebellum; CA1, CA2, CA3: CA formation of hippocampus; DG: dentate
gyrus; fi: fimbria of hippocampus; IP: interpeduncular nucleus; OB: olfactory bulb; APit, IPit, PPit: anterior,
intermediate, and posterior lobes of pituitary gland; pv: periventricular tissue zone. The increased contrast allows clear
visualization of other anatomic details of the complex brain neuroarchitecture. For example, the internal capsule (ic) and
the gigantocellular reticular nucleus (Gi, below ‘CEB’ in center view, black arrow), appear darker than surrounding
tissue in the T1-weighted MEMRI. Reproduced from Ref. (59).

Theory and Application of MEMRI 110
Figure 3-15: T1-weighted MRI of the hippocampal formation in the rat after systemic MnCl2 infusion. Horizontal slices
(Bregma: -6mm) of T1-weighted MRI from the hippocampus of a rat after MnCl2 administration: (C) 2 h, and (D) 24 h
after MnCl2 administration in the same rat. The characteristic arrowhead-shaped DG and hippocampal formation are
readily detected. fi = fimbria of hippocampus. Reproduced from Ref. (4).
MEMRI with MnCl2 – Brain Imaging after Blood-Brain Barrier (BBB) Disruption
MnCl2 has recently been shown to be a MR contrast agent that is directly sensitive to brain
activation (1). The implications of this approach is increased specificity over currently available
functional brain MRI techniques such as blood oxygenation level dependent (BOLD) imaging (64).
BOLD imaging tracks brain function by changes in hemoglobin oxygenation status and is, therefore,
not able to detect brain function directly. Since Mn2+ has been shown to enter active cells through
Ca2+ channels and Mn2+ is paramagnetic, active regions of brain can be imaged by MEMRI
providing an approach for direct imaging of brain function.
An experimental limitation to using Mn2+ as a brain-activation-specific MR contrast agent is
that the BBB must be disrupted to allow passage of Mn2+ into the brain interstitial space in a time-
efficient manner. Historically, for MEMRI experiments, osmotic disruption of the BBB has been the
method of choice for gaining Mn2+ access to the brain parenchyma. A summary of sugar solution
concentration, dose, route and rate of infusion, as well as anesthetics used during experiments is
given in Table 3-4. As is apparent in Table 3-4, a solution of concentrated mannitol is the substance
Theory and Application of MEMRI 111 of choice for osmotic BBB disruption in most MEMRI experiments. The common usage of mannitol
may be a historical trend based on the first MEMRI study used for brain activation. Also, mannitol is
approved for clinical use, which may explain the typical use of this compound for MEMRI studies.
The use of mannitol as a BBB-opening agent has some disadvantages. Because of the limited
solubility of 1.37 M (25%) mannitol at room temperature, the solution must be maintained at body
temperature (37 °C) or warmer to prevent precipitation of the solute prior to in vivo administration.
If 25% mannitol recrystallizes due to exposure to room temperature for an extended period of time,
infusion of the solute may result in microinfarcts in the brain (65). For the studies described in this
dissertation, solutions of arabinose were deemed to be a better choice for osmotic BBB disruption.
At 1.4 M arabinose will not precipitate out at room temperature because arabinose is 5.5 times more
soluble than mannitol (see Chapter 2 for more details on arabinose and mannitol). It is noteworthy
that of the studies listed in Table 3-4 no evidence of BBB disruption is provided. Some experiments
also fail to list the rate of mannitol infusions. It is well known that the rate of infusion of mannitol is
an important factor that determines the success of BBB disruption (66).

Theory and Application of MEMRI 112
Male Rat
Species
Osmotic
Agent
(OA)
OA Dose
(ml/kg) /
[OA]
(Molar)
OA Route of
Infusion / Rate
of Infusion
(ml/min)
Anesthetic Reference
Sprague-
Dawley
Mannitol 5 / 1.37 Right ECA /
???
1.8-2.5% halothane,
pancuronium bromide
Lin et al. (1)
Sprague-
Dawley
Mannitol 5 / 1.37 Right ECA /
2.3 – 2.7
1-2% halothane,
continuous
α-chloralose
Duong et al.
(55)
Wistar-
Hamamatsu
Mannitol 5 / 1.37 Right ECA /
???
enflurane,
urethane/
α-chloralose mixture
Morita et al.
(67)
Wistar Mannitol 5 / 1.37 Right ECA /
??? (“Bolus”)
diethyl ether,
2.0-2.3% halothane,
urethane/
α-chloralose mixture,
Pancuronium bromide
Aoki et al.
(56)
Wistar Mannitol 5 / 1.37 Right ECA /
0.83
diethyl ether, 1.2-1.5%
halothane, pentobarbital
Aoki et al.
(68)
Sprague-
Dawley
Mannitol 5 / 1.37 Right ECA /
??? (“Bolus”)
chloral hydrate, 1.2%
isoflurane
Henning et
al. (5)
Table 3-4: Summary of osmotic agent, dose, concentration, route and rate of infusion, and anesthetics used during
MEMRI experiments that employ osmotic disruption of the BBB for passage of Mn2+ into brain parenchyma.
Future MEMRI studies that depend on homogeneous delivery of Mn2+ to one hemisphere of
brain should incorporate evidence of BBB disruption to circumvent this discrepancy. A diagram
showing the arteries that need to be ligated to ensure flow of osmotic solution to one hemisphere of
brain (with the other hemisphere acting as control) is shown in Figure 3-16.

Theory and Application of MEMRI 113
Figure 3-16: Arteries in the rat brain that must be ligated to ensure flow of mannitol or arabinose to one hemisphere of
the brain for successful osmotic BBB disruption. The common carotid artery (CCA) can be permanently ligated without
ischemic damage to the brain. However, clamping the CCA temporarily (only during the osmotic infusion) is
recommended to ensure flow towards the brain during infusion while maintaining normal physiological state of the
animal for as long as possible. ACA; anterior cerebral artery, MCA: middle cerebral artery, PCA: posterior cerebral
artery. Recreated based on Ref. (31)
Although similar concentration, dose and route of infusion are used to deliver mannitol in the
studies of Table 3-4, there were some differences in concentration and route of delivery of MnCl2.
This information is summarized in Table 3-5. Infusion of MnCl2 via the femoral vein has the
advantage of fairly simple surgical preparation for catheter placement. However, MnCl2 infused into
the femoral vein is directed towards the heart and can result in cardiac arrest at high concentrations
of MnCl2 or at rapid infusion rates (unpublished results). Additionally, if MnCl2 infusion via the
femoral vein is initiated prior to osmotic disruption of the BBB, further stress on the heart by the
subsequent mannitol infusion (66) can lead to death. A safer route of MnCl2 infusion is via the
external carotid artery. The same catheter employed for BBB disruption can also be used for delivery

Theory and Application of MEMRI 114 of MnCl2, as long as the catheter is warmed (to 37 °C if mannitol is used and remains within tubing)
between infusions. An alternative is to flush the catheter with saline between infusions.
Male Rat Species Dose of MnCl2
[MnCl2]
MnCl2: Route of
infusion / Rate of
infusion
Reference
Sprague-Dawley 3.6 µmol/min
120 mM
Femoral vein /
1.8 ml/h
Lin et al. (1)
Sprague-Dawley 4.0 µmol/min
(0.7 - 1.0 ml)
120 mM
Femoral vein /
2.0 ml/h
Duong et al. (55)
Wistar-Hamamatsu 2.1 – 3.0 µmol/min
(1.1 – 1.6 ml)
100 mM
Femoral vein /
1.25 – 1.8 ml/h
Morita et al. (67)
Wistar 3.97 µmol/min
(1.7 ml)
74.5 mM
Right Carotid
Artery / 3.2 ml/h
Aoki et al. (56)
Wistar 1.0 µmol/min
(0.3ml)
10 mM
Right External
Carotid Artery /
4.5 ml/h
Aoki et al. (68)
Sprague-Dawley 3.97 µmol/min
(1.7 ml)
74.5 mM
Femoral vein /
3.2 ml/h
Henning et al. (5)
Table 3-5: MnCl2 dose, concentration, route and rate of infusion in previous MEMRI experiments.
MEMRI with MnCl2 – T1-Enhancement Due to the BBB-Disruption Process
Ideally, in MEMRI experiments that utilize osmotic BBB disruption, the BBB-opening
process itself should not result in Mn2+-induced T1-enhancement. Such enhancement may obscure or
confound any subsequent changes in T1 contrast that might arise from a specific neuronal stimulus.
Based on the six references in Table 3-4 and 3-5, two show dynamic data that includes MR signal
intensity before, during, and after mannitol infusion. This data is reproduced here as Figure 3-16 and
3-17.

Theory and Application of MEMRI 115
Figure 3-16: Time course of T1-weighted MRI signal intensity changes in the cortex (■), paraventricular hypothalamic
nucleus (●), lateral habenular nucleus (▲), lateral ventricle (○), and superior sagittal sinus (∆) in rat brain. Time 0 is the
start of MR imaging. The period of MnCl2 infusion is shown by the horizontal bar and the points at which the mannitol
and NaCl injections were given are shown by the arrows. Reproduced from Ref. (67).
Data points shown in Figures 3-16 and 3-17 are MR signal intensity values in various regions
of the brain as a function of time relative to the initiation of MnCl2, mannitol, glutamate, and NaCl
infusion. As shown in Figure 3-16, brain MR signal intensity changes due to MnCl2 infusion alone
do not vary as a function of time except in the lateral ventricle and the superior sagittal sinus.
Following mannitol infusion, however, significant signal changes are detected in the ventricle and
the cortex. Following BBB disruption (and with concurrent MnC12 infusion), the injection of
glutamate – an excitatory neurotransmitter – initiates Mn2+ uptake into excitable cells. The resulting
increase in T1-weighted MR signal intensity allows visualization of the excited brain regions. From
Figure 3-17, it is apparent that glutamate administration is associated with further MR signal-
intensity increases; however, the relative change is somewhat obscured by the previous signal
increase observed following BBB disruption by mannitol. Although the specifics of the two
experiments depicted in Figure 3-16 and 3-17 are different, such as delivery route and concentration
of MnCl2, there is a clear need to monitor MR signal intensity after disrupting the BBB. Non-

Theory and Application of MEMRI 116 specific changes in T1-contrast, such as those shown in Figure 3-16 and 3-17, could be
misinterpreted as brain activity resulting from a specific neuronal stimulus.
Figure 3-17: Typical dynamic activity-induced time-courses of relative signal intensities in the cortex and ventricle
obtained from the glutamate administration (filled symbols) and control (open squares) groups. The inset indicates
typical ROIs. The first set of images (#1-16) was obtained before D-mannitol administration, but after start of MnCl2
infusion. The second set (#17-32) was obtained before injection of glutamate, but after opening the BBB with mannitol.
The signal increases significantly, in a non-specific manner, following opening of the BBB. The third set (#33-48) was
obtained after glutamate injection. The signal intensity in the cortex of the glutamate-administration group (filled circles)
increases substantially after glutamate injection, but not in the control group following saline administration (open
squares). The fourth set (#49-64) was obtained during rest after cessation of the MnCl2 infusion. Reproduced from Ref.
(56).
MEMRI with MnCl2 after BBB Disruption – The Importance of Anesthetic Depth
In addition to non-specific T1-contrast due to the BBB disruption process, insufficient levels
of anesthetic have been shown to result in Mn2+-induced T1-contrast in MR images. Lin and
Koretsky showed that when halothane anesthetic level was reduced from 1.3% to 0.3%, large non-
specific signal intensity changes were seen in the Mn2+-loaded brain after BBB disruption by

Theory and Application of MEMRI 117 mannitol (1). Figure 3-18 is a reproduction of images acquired by this group under these
circumstances. Clearly, the level of anesthesia is critical for suppression of non-specific T1-
enhancement in MEMRI experiments. Curiously, however, the subject of anesthesia and the
electrical state of brain during MEMRI experiments has not been discussed in depth in the literature.
A brief discussion of depth of anesthesia, as it relates to MEMRI, has been reported as a subsection
in an article by Aoki et al. (57). An important conclusion by these investigators, with regard to
anesthetics and MEMRI, is that “the optimal anesthetic level is the one that suppresses overall
baseline activation without inhibiting activation of intentionally stimulated areas.” Much work is
needed to determine the proper level of anesthesia for suppression of baseline brain activity in
MEMRI experiments. Comparisons of different anesthetics and anesthetic mixtures are needed to
optimize the results from MEMRI experiments that rely on specific neuronal stimuli.

Theory and Application of MEMRI 118
Figure 3-18:T1-weighted MRI signal enhancement in the presence of MnCl2 due to light anesthesia (A, B, and C) and
compared with normal anesthesia (D, E, and F). (A,B) Representative images obtained from a rat anesthetized with 0.3%
halothane. The steady-state MnCl2 infusion (3.6 µmol/min) was started 25 min after lowering the halothane dose. (A) T1-
weighted image obtained 47 min after initiating MnCl2 infusion with intact BBB. (B) T1-weighted image taken 18 min
after unilateral BBB opening and 70 min after the onset of MnCl2 infusion. (C) Difference image formed from (B) – (A).
(D,E) Representative images obtained from a rat anesthetized with 1.3% halothane. (D) T1-weighted image obtained 37
min after initiating MnCl2 infusion with an intact BBB. (E) T1-weighted image taken 20 min after unilateral BBB
opening and 60 min after the onset of MnCl2 infusion. (F) Difference image formed from (D) – (E). Reproduced from
Ref. (1)
REFERENCES
1. Lin Y.J., Koretsky A.P. Manganese Ion Enhances T1-Weighted MRI during Brain Activation: An Approach to Direct Imaging of Brain Function. Magn Reson Med 1997;38:378-388.
2. Pautler R.G., Koretsky A.P. Tracing Odor-Induced Activation in the Olfactory Bulbs of Mice Using Manganese-Enhanced Magnetic Resonance Imaging. Neuroimage 2002;16:441-448.
3. Pautler R.G., Mongeau R., Jacobs R.E. In Vivo Trans-Synaptic Tract Tracing From the Murine Striatum and Amygdala Utilizing Manganese-Enhanced MRI (MEMRI). Magn Reson Med 2003;50:33-39.
A

Theory and Application of MEMRI 119 4. Aoki I., Lin Wu Y.J., Silva A.C., Lynch R.M., Koretsky A.P. In vivo detection of
neuroarchitecture in the rodent brain using manganese-enhanced MRI. Neuroimage 2004;22:1046-1059.
5. Henning E.C., Meng X., Fisher M., Sotak C. Visualization of Cortical Spreading Depression Using Manganese-Enhanced MRI. Magn Reson Med 2005;53:851-857.
6. Drapeau P., Nachshen D.A. Manganese Fluxes and Manganese-Dependent Neurotransmitter Release in Presynaptic Nerve Endings Isolated From Rat Brain. J Physiol 1984;348:493-510.
7. Aschner M., Aschner J.L. Manganese Neurotoxicity: Cellular Effects and Blood-Brain Barrier Transport. Neurosci and Biobehav Rev 1991;15:333-340.
8. Brasch R.C. Work in Progress: Methods of Contrast Enhancement for NMR Imaging and Potential Applications. Radiology 1983;147:781-788.
9. Lauffer R.B. Paramagnetic Metal Complexes as Water Proton Relaxation Agents for NMR Imaging: Theory and Design. Chem Rev 1987;87:901-927.
10. Runge V.M., Nelson K.L. Contrast Agents. In: Stark D., Bradley W.G. Jr., editors. Magnetic Resonance Imaging. 3 ed. Volume 1. St. Louis: Mosby, Inc.; 1998.
11. Runge V.M., Stewart R.G., Clanton J.A., Jones M.M., Lukehart C.M., Partain C.L., James A.E. Jr. Work in Progress: Potential Oral and Intravenous Paramagnetic NMR Contrast Agents. Radiology 1983;147:789-791.
12. Levitan I.B., Kaczmarek L.K. Signaling in the Brain. The Neuron: Cell and Molecular Biology. New York Oxford: Oxford University Press; 1997.
13. Augustine G.J. Synaptic Transmission. In: Purves Dale, editor. Neuroscience. 2 ed. Sunderland, MA: Sinauer Associates, Inc; 2001.
14. Narita K., Kawasaki F., Kita H. Mn and Mg influxes through Ca channels of motor nerve terminals are prevented by verapamil in frogs. Brain Res 1990;510:289-295.
15. Hunter D.R., Haworth R.A., Berkoff H.A. Cellular Manganese Uptake by the Isolated Perfused Rat Heart: a Probe for the Sarcolemma Calcium Channel. J Mol Cell Cardiology 1981;13:823-832.
16. Hunter D.R., Komai H., Haworth R.A., Jackson M.D., Berkoff H.A. Comparison of Ca2+, Sr2+, and Mn2+ Fluxes in Mitochondria of the Perfused Rat Heart. Circ Res 1980;47:721-727.
17. Gavin C.E., Gunter K.K., Gunter T.E. Manganese and calcium transport in mitochondria: implications for manganese toxicity. Neurotoxicology 1999;20:445-454.
18. Cooper G.P., Suszkiw J.B., Manalis R.S. Presynaptic Effects of Heavy Metals. In: Narahashi Toshio, editor. Cellular and Molecular Neurotoxicology. New York: Raven Press; 1984.
19. Misselwitz B., Muhler A., Weinmann H.J. A Toxicologic Risk for Using Manganese Complexes? A Literature Survey of Existing Data Through Several Medical Specialties. Invest Radiol 1995;30:611-620.
20. Argent B.E., Case R.M., Hirst F.C. The effects of manganese, cobalt, and calcium on amylase secretion and calcium homeostasis in rat pancreas. J Physiol 1982;323:353-375.
21. Barbeau A. Manganese and extrapyramidal disorders. Neurotoxicology 1984;5:13-36. 22. Nelson K., Golnick J., Korn T., Angle C. Manganese encephalopathy: utility of early
magnetic resonance imaging. British J Ind Med 1993;50:510-513. 23. Newland M.C., Cox C., Hamada R., Oberdoerster G., Weiss B. The clearance of manganese
chloride in the primate. Fundam Appl Toxicol 1987;9:314-328. 24. Zhang P., Anglade P., Hirsch E.C., Javoy-Agid F., Agid Y. Distribution of manganese-
dependent superoxide dismutase in the human brain. Neuroscience 1994;6:317-330.

Theory and Application of MEMRI 120 25. Roth J., Garrick M. Iron interactions and other biological reactions mediating the
physiological and toxic actions of manganese. Biochem Pharma 2003;66:1-13. 26. Roth J.A., Horbinski C., Higgins D., Lein P., Garrick M.D. Mechanisms of manganese-
induced rat pheochromocytoma (PC12) cell death and cell differentiation. Neurotoxicology 2002;23:147-157.
27. Gavin C.E., Gunter K., Gunter T.E. Mn2+ sequestration by mitochondria and inhibition of oxidative phosphorylation. Toxicol Appl Pharmacol 1992;115:1-5.
28. Chen C. J., Liao S. L. Oxidative stress involves in astrocytic alterations induced by manganese. Exp Neurol 2002;175:216-225.
29. Abrams E., Lassiter J. W., Miller W. J., Neathery M. W., Gentry R. P., Scarth R. D. Absorption as a factor in manganese homeostasis. J Anim Sci 1976;42:630-636.
30. Kreft B. P., Baba Y., Tanimoto A., Finn J. P., Stark D. D. Orally administered manganese chloride: enhanced detection of hepatic tumors in rats. Radiology 1993;186:543-548.
31. Takeda A., Akiyama T., Sawashita J., Okada S. Brain uptake of trace metals, zinc and manganese, in rats. Brain Res 1994;640:341-344.
32. Cottrell G. T., Ferguson A. V. Sensory circumventricular organs: central roles in integrated autonomic regulation. Regul Pept 2004;117:11-23.
33. Shibata O., Tanaka J., Nomura M. Non-NMDA glutamatergic receptors modulate acetylcholine release in the rat subfornical organ area. Auton Neurosci 2006;124:96-102.
34. McKinley M. J., McAllen R. M., Davern P., Giles M. E., Penschow J., Sunn N., Uschakov A., Oldfield B. J. The sensory circumventricular organs of the mammalian brain. Adv Anat Embryol Cell Biol 2003;172:III-XII, 1-122, back cover.
35. Zheng W., Kim H., Zhao Q. Comparative Toxicokinetics of Manganese Chloride and Methylcyclopentadienyl Manganese Tricarbonyl (MMT) in Sprague-Dawley Rats. Toxicol Sci 2000;54:295-301.
36. Klaassen C. D. Biliary excretion of manganese in rats, rabbits, and dogs. Toxicol Appl Pharmacol 1974;29:458-468.
37. Keefer R. C., Barak A. J., Boyett J. D. Binding of manganese and transferrin in rat serum. Biochim Biophys Acta 1970;221:390-393.
38. Davidsson L., Lonnerdal B., Sandstrom B., Kunz C., Keen C. Identification of Transferrin as the Major Plasma Carrier Protein for Manganese Introduced Orally or Intravenously or After In Vitro Addition in the Rat. J Nutrition 1989;119:1461-1464.
39. Nagy J.I., Carter D.A., Fibiger H.C. Evidence for a GABA-containing projection from the entopenduncular nucleus to the lateral habenula in the rat. Brain Res 1978;145:360-364.
40. Mosher T.J., Lacey P.G., Barron T.F., McNamara K.P., Devenyi A.G. Increased signal intensity in the basal ganglia on T1-weighted MRI correlates with elevated erythrocyte manganese in patients with chronic liver disease. 1994; San Francisco.
41. Aschner M., Gannon M. Manganese (Mn) Transport Across the Rat Blood-Brain Barrier: Saturable and Transferrin-dependent Transport Mechanisms. Brain Res Bull 1994;33:345-349.
42. Aschner M. The transport of manganese across the blood-brain barrier. Neurotoxicology 2006;27:311-314.
43. Dickinson T. K., Devenyi A. G., Connor J. R. Distribution of injected iron 59 and manganese 54 in hypotransferrinemic mice. J Lab Clin Med 1996;128:270-278.

Theory and Application of MEMRI 121 44. Gunshin H., Mackenzie B., Berger U. V., Gunshin Y., Romero M. F., Boron W. F.,
Nussberger S., Gollan J. L., Hediger M. A. Cloning and characterization of a mammalian proton-coupled metal-ion transporter. Nature 1997;388:482-488.
45. Crossgrove J. S., Yokel R. A. Manganese distribution across the blood-brain barrier. IV. Evidence for brain influx through store-operated calcium channels. Neurotoxicology 2005;26:297-307.
46. Fitsanakis V.A., Piccola G., Aschner J.L., Aschner M. Characteristics of manganese (Mn) transport in rat brain endothelial (RBE4) cells, an in vitro model of the blood-brain barrier. NeuroToxicology 2006;27:60-70.
47. Malecki E., Devenyi A., Beard J., Connor J. Transferrin response in normal and iron-deficient mice heterozygotic for hypotransferrinemia; effects on iron and manganese accumulation. Biometals 1998;11:265-276.
48. Tirkkonen B., Aukrust A., Couture E., Grace D., Haile Y., Holm K.M., Hope H., Larsen A., Lunde H.S., Sjogren C.E. Physicochemical Characterisation of Mangafodipir Trisodium. Acta Radiologica 1997;38:780-789.
49. Toft K.G., Hustvedt S.O., Grant D., Martinsen I., Gordon P.B., Friisk G.A., Korsmo A.J., Skotland T. Metabolism and Pharmacokinetics of MnDPDP in Man. Acta Radiologica 1997;38:677-689.
50. Ni Y., Petre C., Bosmans H., Miao Y., Grant D., Baert A. L., Marchal G. Comparison of manganese biodistribution and MR contrast enhancement in rats after intravenous injection of MnDPDP and MnCl2. Acta Radiol 1997;38:700-707.
51. Grant D., Zech K., Holtz E. Biodistribution and in vivo stability of manganese dipyridoxyl diphosphate in relation to imaging efficacy. Invest Radiol 1994;29:S249.
52. Lim K.O., Stark D.D., Leese P.T., Pfefferbaum A., Rocklage S.M., Quay S.C. Hepatobiliary MR Imaging: First Human Experience with MnDPDP. Radiology 1991;178:79-82.
53. Joarder R., de Jode M., Lamb G. A., Gedroyc W. M. The value of MnDPDP enhancement during MR guided laser interstitial thermoablation of liver tumors. J Magn Reson Imaging 2001;13:37-41.
54. Silva A.C., Lee J.H., Aoki I., Koretsky A.P. Manganese-enhanced magnetic resonance imaging (MEMRI): methodological and practical considerations. NMR In Biomed 2004;17:532-543.
55. Duong T.Q., Silva A.C., Lee S.P., Kim S.G. Functional MRI of calcium-dependent synaptic activity: cross correlation with CBF and BOLD measurements. Magn Reson Med 2002;43:383-392.
56. Aoki I., Tanaka C., Takegami T., Ebisu T., Umeda M., Fukunaga M., Fukuda K., Silva A.C., Koretsky A.P., Naruse S. Dynamic activity-induced manganese-dependent contrast magnetic resonance imaging (DAIM MRI). Magn Reson Med 2002;48:927-933.
57. Aoki I., Naruse S., Tanaka C. Manganese-enhanced magnetic resonance imaging (MEMRI) of brain activity and applications to early detection of brain ischemia. NMR In Biomed 2004;17:569-580.
58. Pautler R.G., Silva A.C., Koretsky A.P. In Vivo neuronal tract tracing using manganese-enhanced magnetic resonance imaging. Magn Reson Med 1998;40:740-748.
59. Lee J.H., Silva A.C., Merkle H., Koretsky A.P. Manganese-Enhanced Magnetic Resonance Imaging of Mouse Brain after Systemic Administration of MnCl2: Dose-Dependent and Temporal Evolution of T1 Contrast. Magn Reson Med 2004;53:640-648.

Theory and Application of MEMRI 122 60. Hu T.C., Pautler R.G., MacGowan G.A., Koretsky A.P. Manganese-enhanced MRI of mouse
heart during changes in inotropy. Magn Reson Med 2001;46:884-890. 61. Watanabe T., Natt O., Boretius S., Frahm J., Michaelis T. In vivo 3D MRI staining of mouse
brain after subcutaneous application of MnCl2. Magn Reson Med 2002;48:852-859. 62. London R.E., Toney G., Gabel S.A., Funk A. Magnetic Resonance Imaging Studies of the
Brains of Anesthetized Rats Treated With Manganese Chloride. Brain Res Bull 1989;23:229-235.
63. Lie C.H., D'Arceuil H.E., de Crespigny A.J. Direct CSF Injection of MnCl2 for Dynamic Manganese-Enhanced MRI. Magn Reson Med 2004;51:978-987.
64. Ogawa S., Menon R. S., Tank D. W., Kim S. G., Merkle H., Ellermann J. M., Ugurbil K. Functional brain mapping by blood oxygenation level-dependent contrast magnetic resonance imaging. A comparison of signal characteristics with a biophysical model. Biophys J 1993;64:803-812.
65. Rapoport S. I. Microinfarction: osmotic BBB opening or microcrystals in infusate? J Neurosurg 1991;74:685.
66. Cosolo W.C., Martinello P., Louis W.J., N. Christophidis. Blood-brain barrier disruption using mannitol: time course and electron microscopy studies. Am J Physiol 1989R443-R448.
67. Morita H., Ogino T., Seo Y., Fujiki N., Tanaka K., Takamata A., Nakamura S., Murakami M. Detection of hypothalamic activation by manganese ion contrasted T1-weighted magnetic resonance imaging in rats. Neurosci Lett 2002;326:101-104.
68. Aoki I., Ebisu T., Tanaka C., Katsuta K., Fujikawa A., Umeda M., Fukunaga M., Takegami T., Shapiro E., Naruse S. Detection of the Anoxic Depolarization of Focal Ischemia Using Manganese-Enhanced MRI. Magn Reson Med 2003;50:7-12.

CHAPTER 4
Nonspecific T1-Weighted Manganese
Enhancement in Rat Brain Correlates with Evans
Blue Staining After Osmotic Blood-Brain Barrier
Disruption
Introduction Challenges in MEMRI
Evans Blue as a Marker for Osmotic Blood-Brain Barrier (BBB) Disruption Co-Infusion of MnCl2 and Evans Blue (EB) Dye as a Qualitative Method for Validating MnCl2
Distribution in Brain Experimental Design to Test Mechanisms of Nonspecific MEMRI Signal-Enhancement
Relevance of Experiments to Future Work
Methods Animal Preparation
Osmotic BBB Disruption and MnCl2+Evans Blue (EB) Administration Timing of Drug Administration
Level of Anesthetic During MnCl2+EB Infusion EB Stain Histology MRI Measurements
Data Analysis Statistical Analysis
Results MEMRI Signal-Enhancement
Evans Blue (EB) Stain Correlation Between Regions of MEMRI Signal-Enhancement and Evans Blue Staining
Discussion Isoflurane and Halothane Level and Nonspecific MEMRI Signal-Enhancement
Nonspecific T1-Enhancement after Osmotic BBB Disruption Cellular Uptake of MnCl2+Evans Blue (EB) Dye after Osmotic BBB Disruption

Nonspecific MEMRI Signal-Enhancement Correlates with Evans Blue Staining 123
Nonspecific T1-Weighted Manganese
Enhancement in Rat Brain Correlates with Evans
Blue Staining After Osmotic Blood-Brain Barrier
Disruption
David G. Bennett1, Nils Henninger3, Marc Fisher3,4, Christopher H. Sotak1,2,4
Departments of Biomedical Engineering1 and Chemistry & Biochemistry2
Worcester Polytechnic Institute
Worcester, Massachusetts 01609
Department of Neurology3
University of Massachusetts Memorial Healthcare – Memorial Campus
Worcester, Massachusetts 01605
Department of Radiology4
University of Massachusetts Medical School
Worcester, Massachusetts 01605
Part of this work was presented at the 13th annual meeting of the International Society of Magnetic
Resonance in Medicine, Miami Beach, FL, USA, 2005.
Manuscript in Progress
Nonspecific MEMRI Signal-Enhancement Correlates with Evans Blue Staining 124
Abstract
Blood-Brain Barrier (BBB) opening was visualized using manganese-enhanced MRI
(MEMRI) following hyperosmotic disruption of the endothelial cells in the cerebral vasculature of
the rat brain. BBB disruption was verified histologically using Evans Blue (EB) staining. Evans Blue
dye was mixed with MnCl2 to provide a means of tracing the distribution of i.v. administered
Mn2+ in brain following osmotic BBB disruption. Nonspecific MEMRI signal increase (MEMRI
signal-enhancement) was observed following infusion of 5ml/kg 1.6M arabinose into the internal
carotid artery. Relative to the contralateral control region, MEMRI signal-enhancement was: (1)
81% ± 23% in animals anesthetized with 2% isoflurane (MnCl2+EB infused two minutes after
osmotic BBB disruption); (2) 77% ± 22% in animals anesthetized with 3% isoflurane (MnCl2+EB
infused two minutes after osmotic BBB disruption); (3) 76% ± 33% in animals infused with
MnCl2+EB ten minutes following osmotic BBB disruption (2% isoflurane anesthesia); and (4) 42%
in one animal infused with MnCl2 only. A significant difference (P < 0.05) in MEMRI signal-
enhancement was found between the animal infused with MnCl2 only (ten minutes after osmotic
BBB disruption, 2% isoflurane) and animals infused with MnCl2+EB (two minutes after BBB
disruption, 2% isoflurane). MEMRI signal-enhancement was seen in the hippocampus (CA1-CA3),
cortex, caudate putamen, hypothalamus and geniculate nucleus. A quantitative comparison of brain
regions with MEMRI signal-enhancement and those stained on Evans Blue histological sections
showed good correlation and correspondence between the two methods. It is not likely that MEMRI
signal-enhancement, as reported here, is due to the uptake of manganese into active brain cells as a
result of low anesthetic depth. We hypothesize that nonspecific MEMRI signal-enhancement is due
to diffuse uptake of Mn2+ by brain cells adjacent to endothelial-cell tight junctions undergoing
osmotic transitions or by irreversibly damaged neurons. The results from this study suggest that the
osmotic BBB-opening process itself gives rise to non-specific MEMRI signal-enhancement
following MnCl2 administration. This source of MEMRI signal-enhancement confounds the
interpretation of data from experiments that attempt to visualize a specific neuronal stimulus in the
brain using the same method. Alternatively, MEMRI may prove to be a useful method for imaging
experimental BBB disruption as a result of disease.

Nonspecific MEMRI Signal-Enhancement Correlates with Evans Blue Staining 125
Key words: manganese-enhanced MRI, blood-brain barrier, osmotic shock, rat brain
4.1 Introduction
Manganese has recently been reported as a cell membrane depolarization-dependent
magnetic resonance (MR) contrast agent useful for functional imaging (1), neuronal fiber tracking
(2,3), and ischemia detection in the brain (4,5). The manganese ion, Mn2+, has an ionic radius and
charge similar to calcium and is treated similarly to calcium in biological systems (6). With five
unpaired electrons, Mn2+ is a strong paramagnetic cation and thus useful as a MR contrast agent. The
T1 and T2 relaxation times of cellular water can be significantly reduced when Mn2+ enters glia
and/or neurons through voltage-gated calcium channels during nerve action potentials (1,6). This
mode of Mn2+ entry is supported by observations that the calcium-channel blocker verapamil can
inhibit the influx of Mn2+ into cells (7). The manganese-induced changes in T1 result in localized
increases in signal intensity on T1-weighted MR images (i.e., MEMRI signal-enhancement).
Experiments using MEMRI to image brain function rely on delivery of divalent manganese ion
(Mn2+) to the brain parenchyma via an osmotically-disrupted blood-brain barrier (BBB). Subsequent
brain activation results in cellular uptake of Mn2+ through voltage-gated calcium channels. Ideally,
the action of osmotic BBB disruption does not itself induce cellular uptake of Mn2+ that would give
rise to MEMRI signal-enhancement. However, if this is not the case, any change in T1 contrast by
the action of osmotic BBB disruption could potentially obscure subsequent MEMRI signal-
enhancement related to a specific neuronal stimulus.
4.1.1 Challenges in MEMRI
Non-Specific MEMRI Signal-Enhancement in MEMRI Experiments
Monitoring specific brain activity using MEMRI requires minimal activity in brain due to
baseline neuronal activity, environmental stimuli and/or physiological state of the animal. These
factors can be controlled by deep anesthesia, pain relief, immobilizing drugs, and physiological
monitoring during the experiment. Lin and Koretsky showed the importance of anesthetic depth in
preventing unintended (i.e., non-specific) brain activity during an MEMRI experiment (1). During
their experiment, halothane anesthetic was reduced from 1.3% to 0.3% resulting in non-specific
MEMRI signal-enhancement. Aoki et al. (4) also detected non-specific brain activity on MEMRI
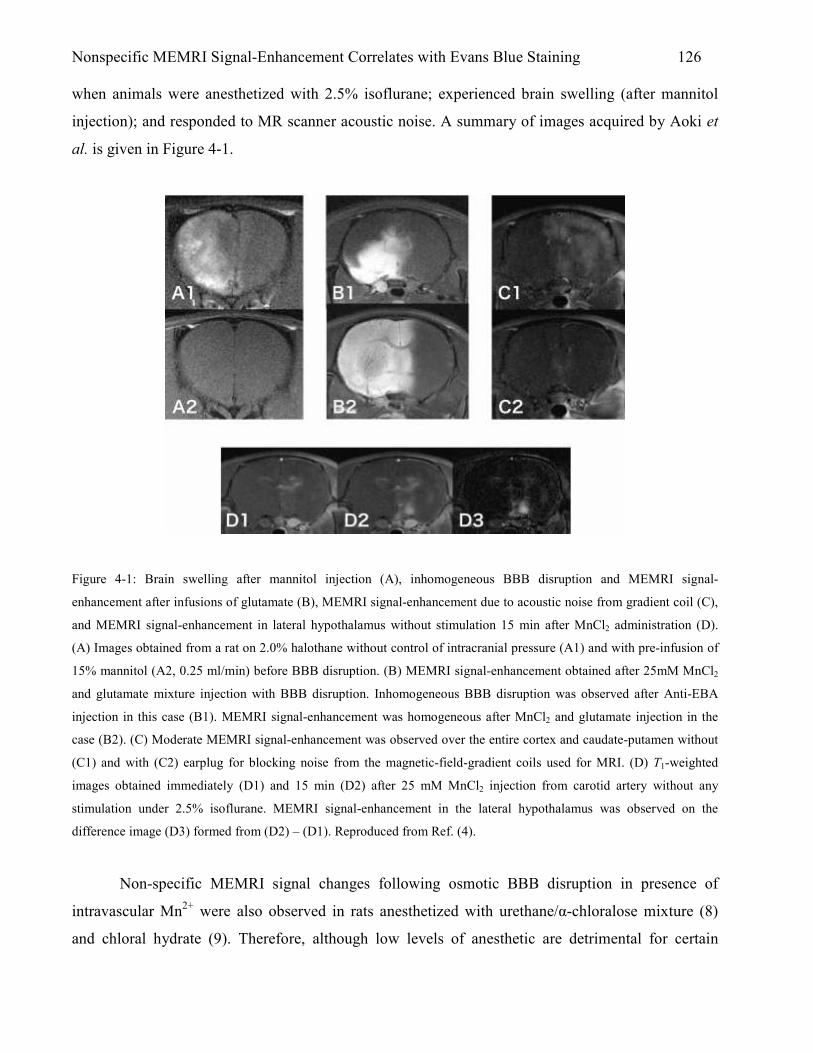
Nonspecific MEMRI Signal-Enhancement Correlates with Evans Blue Staining 126 when animals were anesthetized with 2.5% isoflurane; experienced brain swelling (after mannitol
injection); and responded to MR scanner acoustic noise. A summary of images acquired by Aoki et
al. is given in Figure 4-1.
Figure 4-1: Brain swelling after mannitol injection (A), inhomogeneous BBB disruption and MEMRI signal-
enhancement after infusions of glutamate (B), MEMRI signal-enhancement due to acoustic noise from gradient coil (C),
and MEMRI signal-enhancement in lateral hypothalamus without stimulation 15 min after MnCl2 administration (D).
(A) Images obtained from a rat on 2.0% halothane without control of intracranial pressure (A1) and with pre-infusion of
15% mannitol (A2, 0.25 ml/min) before BBB disruption. (B) MEMRI signal-enhancement obtained after 25mM MnCl2
and glutamate mixture injection with BBB disruption. Inhomogeneous BBB disruption was observed after Anti-EBA
injection in this case (B1). MEMRI signal-enhancement was homogeneous after MnCl2 and glutamate injection in the
case (B2). (C) Moderate MEMRI signal-enhancement was observed over the entire cortex and caudate-putamen without
(C1) and with (C2) earplug for blocking noise from the magnetic-field-gradient coils used for MRI. (D) T1-weighted
images obtained immediately (D1) and 15 min (D2) after 25 mM MnCl2 injection from carotid artery without any
stimulation under 2.5% isoflurane. MEMRI signal-enhancement in the lateral hypothalamus was observed on the
difference image (D3) formed from (D2) – (D1). Reproduced from Ref. (4).
Non-specific MEMRI signal changes following osmotic BBB disruption in presence of
intravascular Mn2+ were also observed in rats anesthetized with urethane/α-chloralose mixture (8)
and chloral hydrate (9). Therefore, although low levels of anesthetic are detrimental for certain

Nonspecific MEMRI Signal-Enhancement Correlates with Evans Blue Staining 127 MEMRI experiments, the timing of osmotic BBB disruption relative to Mn2+ infusion may also
contribute significantly to unwanted non-specific MEMRI signal-enhancement.
Delivery of Mn into Brain - Challenges at the Blood-Brain Barrier (BBB)
A technical challenge accompanying certain MEMRI experiments is the introduction of Mn2+
into the brain extracellular space prior to a specific neuronal stimulus. Mn2+ in blood plasma crosses
from blood into brain via carrier-mediated processes at the blood-brain barrier (BBB) but this
process is relatively slow. For MEMRI experiments investigating brain response to specific neuronal
stimuli, the Mn2+ must be present in the brain parenchyma at the time of neuronal stimulus to ensure
that different levels and/or regions of MEMRI signal-enhancement accurately reflect different levels
and/or regions of brain activity, respectively. The Mn2+ is generally delivered to the interstitial space
by disrupting the blood-brain barrier (BBB) by infusion of hyperosmolar sugar (mannitol or
arabinose) solution (osmotic BBB disruption). Recent MEMRI experiments report no MEMRI
signal-enhancement as a result of osmotic BBB disruption (1,9); however, these and other recent
MEMRI experiments have not reported evidence of the degree of BBB disruption (1,5,8-11).
Without evidence of BBB disruption, the distribution of Mn2+ in the brain prior to neuronal stimulus
is assumed to be spatially homogeneous. This assumption may prove false leading to inaccurate
interpretation of images during MEMRI experiments. Additionally, BBB disruption may be spatially
heterogeneous resulting in higher concentrations of Mn2+ being delivered to certain regions.
Heterogeneous MEMRI signal-enhancement in this situation can be difficult to interpret with respect
to the regional response to brain activation.
4.1.2 Evans Blue as a Marker for Osmotic BBB Disruption
The BBB – located at the cerebrovascular endothelium – prevents passage of proteins,
electrolytes, and water-soluble non-electrolytes from blood into the brain. To open the BBB to non-
permeable substances – such as chemotherapeutic drugs – the BBB can be disrupted by infusion of
hyperosmolar mannitol (12) or arabinose (13) solutions. Evans Blue (EB) dye (a tetrasodium diazo
organic salt with MW = 960.8 (14)) has been used for several decades as a means to measure the
integrity of the BBB in animals after hyperosmotic insult (13,15,16). The pure dye, or the dye bound
to serum albumin, is excluded from the brain by a healthy intact BBB.

Nonspecific MEMRI Signal-Enhancement Correlates with Evans Blue Staining 128 4.1.3 Co-Infusion of MnCl2 and Evans Blue (EB) Dye as a Qualitative Method for Validating
MnCl2 Distribution in Brain
After infusion into the bloodstream, Evans Blue (EB) dye binds quickly (≤ 5 min (17)) and
strongly (14) to albumin resulting in a molecule with molecular weight of approximately 68,500 Da.
Manganese can also bind to albumin in the blood plasma; however, depending on the residence time,
Mn2+ is oxidized to Mn3+ and then binds preferentially to transferrin at iron (Fe) binding sites
(18,19). Critchfield et al. (20) showed in vitro that 54Mn binds to several proteins and after 1 minute
and 1 hour approximately 15% and 40%, respectively, of the 54Mn in blood binds to transferrin.
During the early stages (< 30 min), most plasma Mn2+ is bound to a very low molecular weight
(VLMW) ligand (<1 kDa) which may be responsible for regulating the oxidation of Mn2+ to Mn3+
(20). The VLMW ligand is not albumin since the protein is known to have a molecular weight of
66.3 kDa (21). Additionally, there is almost no tendency for Mn2+ to bind to –SH groups or to
amines and Mn2+ has very low affinity for endogenous complexing ligands (log10k = 3, 4, 5, and 3,
for glycine, cysteine, riboflavin, and guanosine, respectively, where k is the affinity constant)
(22,23). Although Mn and EB bind to different serum proteins in blood – resulting in different size
molecules – in a solution containing Mn and EB, both protein complexes are expected to have
similar access to the brain parenchyma following osmotic disruption of the BBB.
Indeed, Ziylan and coworkers suggest that convective bulk flow contributes to molecular
size-independent BBB transfer following osmotic BBB disruption (24). The physiological evidence
to support bulk flow following osmotic BBB disruption is a transient increase of 1-1.5% in brain
water content 10 minutes after hyperosmolar arabinose infusion into rat brain (13). Consequently,
for blood infused with a solution of both Mn2+ and EB, the evidence suggests that since the two
substances will not compete for binding to the same serum protein, the protein complexes of both
compounds will be transported across the osmotically-disrupted BBB to a similar extent. One aim of
this study is to use EB dye to provide evidence of BBB opening in MEMRI experiments by co-
infusing EB dye with Mn2+ following disruption with hyperosmotic arabinose. Since EB dye is a
known marker for BBB integrity (12), co-infusing EB with Mn2+ should provide a qualitative and
quantitative marker for the degree of osmotic BBB disruption as well as the distribution of Mn2+ in
rat brain that could potentially contribute to MEMRI signal-enhancement.
Although T1 enhancement associated with the Mn2+ delivery process itself is undesirable, the
ability to visualize the spatial extent and degree of BBB disruption could be important. For example,
the lack of MEMRI signal-enhancement following a stimulus could result from ineffective delivery

Nonspecific MEMRI Signal-Enhancement Correlates with Evans Blue Staining 129 of Mn2+ to the parenchyma of brain regions that are expected to exhibit a neuronal response;
potentially confounding the interpretation of the experimental results. Alternatively, MEMRI may be
useful for visualizing pathology whose etiology involves BBB disruption.
4.1.4 Experimental Design to Test Mechanisms of Nonspecific MEMRI Signal-Enhancement
In this paper we evaluate the experimental conditions that may give rise to nonspecific
MEMRI signal-enhancement following Mn2+ delivery to the brain parenchyma via osmotic BBB
disruption. Quantitative characterization of the mechanistic and spatio-temporal aspects of these
changes would be helpful in separating MEMRI signal changes associated with Mn2+ delivery from
those associated with a particular response to a neuronal stimulus. Specifically, we have designed
experiments to test the dependency of non-specific MEMRI signal-enhancement on; 1) anesthetic
(isoflurane) level and 2) the timing of MnCl2+EB infusion relative to osmotic BBB disruption.
As noted by Aoki et al. (4) and Lin et al. (1) the anesthetic condition of the animal is
important for prevention of non-specific MEMRI signal change. However, in these past studies, data
from only one animal is provided. In the current study, therefore, we propose a controlled study of
anesthetic level and its effect on non-specific MEMRI signal-enhancement following osmotic BBB
disruption. In addition, because mannitol causes blood pressure fluctuations in rats that stabilize
approximately 2 min following bolus injection (25) we propose to test the dependency of non-
specific MEMRI signal- enhancement on the timing of MnCl2 infusion in relation to osmotic
challenge by infusing MnCl2+EB 2 and 10 minutes after osmotic BBB disruption. We restrict the
later MnCl2+EB infusion time to 10 minutes in order to correspond to the time window during which
the BBB is open to molecules of size large enough to allow entry of MnCl2 (MW=198), EB
(MW=961), and EB bound to serum albumin (MW=68,500) (24). We hypothesize that increasing
the level of anesthesia from 2% isoflurane to 3% isoflurane and delaying the infusion time of
MnCl2+EB from 2 to 10 minutes following osmotic BBBD will significantly reduce non-specific
MEMRI signal-enhancement.
4.1.5 Relevance of Experiments to Future Work
Ideally, following osmotic BBBD, no MEMRI signal-enhancement will be observed
allowing for subsequent neuronal stimulus to generate localized T1-weighted signal changes in brain.

Nonspecific MEMRI Signal-Enhancement Correlates with Evans Blue Staining 130 Specifically, in our pursuit of imaging experimental anoxic depolarization in brain in real-time (in-
bore), experimental methods that decrease or eliminate non-specific MEMRI signal changes would
be very helpful if not absolutely essential. Therefore, in this chapter we investigate methods to
reduce or eliminate unwanted MEMRI signal changes in brain. As a continuation of this work in
Chapter 5, we investigate other unwanted side effects of osmotic BBB disruption that can obscure
desired MEMRI signal-enhancement and changes in brain that would normally be related
specifically to anoxic depolarization and/or stroke. Indeed, Aoki et al. have suggested that anoxic
depolarization is detectable by MEMRI methods (5), but their work does not include histological
evidence of BBB disruption or of tissue damage by anoxic depolarization making their results
difficult to interpret.
4.2 Methods
4.2.1 Animal Preparation
This study was approved by the Institute Animal Care and Use Committee (IACUC) of the
University of Massachusetts Medical School (IACUC Protocol A-1756). Male Sprague-Dawley rats
(250-360g; Charles River Laboratories, Worcester, MA) were divided into five groups: infusion with
MnCl2+EB 2 minutes following BBB disruption while breathing 2% isoflurane (2% iso/2-min
group, N=3), infusion with MnCl2+EB 2 minutes following BBB disruption while breathing 3%
isoflurane (3% iso/2-min group, N=6), infusion with MnCl2+EB 10 minutes following BBB
disruption while breathing 2% isoflurane (2% iso/10-min group, N=4), infusion with EB only while
breathing 2% isoflurane (EB control group, N=2), and infusion with MnCl2 only while breathing 2%
isoflurane (MnCl2-only group, N=1). Data from the 2% iso/2-min group were compared to the 3%
iso/2-min group and the 2% iso/10-min group to monitor potential changes in MEMRI signal-
enhancement due to; 1) infusion of MnCl2+EB at 2 and 10 minutes following osmotic BBB
disruption and 2) an increase in anesthetic level. Three rats in the 3% iso/2-min group died due to
severe cardiac depression and were not used for data analysis. Rats were initially anesthetized with
5% isoflurane and maintained at 2% isoflurane during surgery. PE-50 and PE-10 polyethylene
catheters were placed in the left femoral vein (i.v.) for blood pressure and gas monitoring and right
external carotid artery (ECA) for drug administration, respectively.
For catheterization of the right ECA, a ventral midline incision was made in the neck. The
omohyoid muscle was separated longitudinally and retracted laterally to isolate and expose the right
Nonspecific MEMRI Signal-Enhancement Correlates with Evans Blue Staining 131 common carotid artery (CCA), ECA, internal carotid artery (ICA) and pterygopalatine artery (PPA).
The PPA was permanently ligated. Following temporary clamping of the CCA, the ECA was ligated
and a small incision was made into it for placement of the PE-10 catheter. The PE-10 catheter tip
was inserted such that the tip would not disturb blood flow in the CCA towards the ICA. After
properly securing the PE-10 catheter, the CCA clamp was removed allowing normal blood flow to
the right ICA (the CCA was clamped for 10 minutes on average). Cannulation of the right ECA
limited drug delivery to the right side of the brain allowing the left side to serve as control. During
the surgical procedures, body temperature was continuously monitored with a rectal probe and
maintained at 37.0 °C using a thermostatically-controlled heat lamp (Model 73ATD, YSI Inc.,
Yellow Spring, OH).
4.2.2 Osmotic BBB Disruption and MnCl2+Evans Blue Administration
To disrupt the BBB, 1.6 M L-arabinose or 1.4 M D-mannitol solution (5 ml/kg, Sigma, St.
Louis) was infused into the right ECA over a period of 55 seconds using an infusion pump (Model
PHD 2000; Harvard Apparatus, Holliston, MA). Two minutes prior to the 55-second infusion of L-
arabinose, a slow (6 ml/hr) infusion of L-arabinose – at the same concentration – was initiated and
continued for 1 minute in an effort to reduce vasogenic edema induced by the osmotic BBB
disruption (4). Physiologically buffered saline (PBS), containing 10mM manganese chloride
(MnCl2·H2O; Sigma, St. Louis) and 2% Evans Blue (EB) (Sigma, St. Louis), was infused into the
right ECA at a rate of 4.5 ml/hr using an infusion pump (Model 11; Harvard Apparatus, Holliston,
MA) until a volume equivalent to 2 ml/kg was infused. MnCl2+EB mixture solution was infused at 2
or 10 minutes following osmotic BBB disruption. Infusion of the MnCl2+EB solution in certain
animals commenced 2 minutes after arabinose injection to coincide with the optimal time window
during which the BBB is maximally open after osmotic disruption (5-10 minutes (12)). Infusion of
the MnCl2+EB solution in other animals at 10 minutes after arabinose was scheduled to coincide
with the optimal time window during which the physiological state of the animal begins to stabilize
following intraarterial infusion of hyperosmolar agents (25). To minimize the likelihood of
recrystallization in the catheter tubing during infusion, arabinose was chosen as the osmotic agent
because of its higher solubility relative to mannitol (a commonly used agent for osmotic BBB
disruption). To avoid introduction of any micro-emboli, all solutions were filtered with 0.22 µm
syringe filters (Nygene) prior to administration.

Nonspecific MEMRI Signal-Enhancement Correlates with Evans Blue Staining 132 4.2.3 Timing of Drug Administration
In order to evaluate the effects of administration of MnCl2+EB infusion time (relative to
BBB disruption) on non-specific MEMRI signal-enhancement, a group of animals received
MnCl2+EB infusion at 10 minutes after BBB disruption (N=4). Timing of infusions are summarized
in Figure 4-2.
4.2.4 Level of Anesthetic During MnCl2+EB Infusion
To determine the effect of different levels of anesthesia on non-specific MEMRI signal-
enhancement, animals were subdivided into two groups: infusion of MnCl2+EB with animals
spontaneously breathing 2% isoflurane in breathing-quality air (N=3) and infusion of MnCl2+EB
with animals spontaneously breathing 3% isoflurane in breathing-quality air (N=6).
Figure 4-2: Timing of MnCl2+EB infusion relative to arabinose infusion. 4.2.5 EB Stain Histology
Immediately following imaging, isoflurane anesthetic was increased to 5% and shortly
thereafter animals were decapitated. The brain was quickly removed, placed on a section of parafilm
and subsequently cooled for thirty minutes to facilitate handling. Brains were then dissected into six
2-mm slices that corresponded spatially to MR slices (first slice at 1mm ventral to the rhinal fissure
of olfactory bulb). After dissection, brain slices were placed in zinc formalin for fixation overnight.
0 1 2 3 4 5 6 7 8 9 10 11 12 13 14
Time (minutes)
WAIT
Arabinose for 55 sec
WAIT 2 (N=3) or 10 (N=4)
min
MnCl2+EB 2 ml/kg @4.5 ml/hr Arabinose @ 6 ml/hr
Stop MnCl2+ Evans Blue
250g Rat 360g Rat
13 14 15 16 17 18 19 20 21 22
OR

Nonspecific MEMRI Signal-Enhancement Correlates with Evans Blue Staining 133 The next day brain slices were scanned using a Hewlett-Packard Scanner (Model #3970) at a
resolution of 1200 dpi. For the EB control group, animals were perfused with 4% paraformaldehyde
via the aorta prior to sacrifice to remove EB from the brain capillary system prior to removal of the
brain. The EB group was used to test whether or not EB staining artifacts were present as a result of
trapped EB in the brain capillary system.
4.2.6 MRI Measurements
MR experiments were performed using a Bruker Biospin 2.0T/45 cm imaging spectrometer
equipped with ± 20 G/cm self-shielded gradients. T1-weighted imaging was performed with the
following acquisition parameters: TR/TE = 500.0/10.8 ms, FOV = 3 cm x 3 cm, matrix size =
128x128, six slices with 2-mm thickness, NEX = 8. The imaging plane was referenced to the rhinal
fissure at the boundary of the olfactory bulb. Acquisition time for one set of images was 8.5 minutes.
Animals were imaged continuously for approximately 2 hours to monitor changes in MEMRI signal-
enhancement. During imaging, animals were placed prone within a home-built animal holder. The
head of the animal was fixed within an 8-element, 4.3-cm diameter, birdcage 1H volume coil.
Animals were anesthetized with 2% or 3% isoflurane delivered at 1.5 L/min in breathing-quality air.
Body temperature was maintained at 37.0 ± 1°C in the magnet by circulated warm air using a T-type
thermocouple and a double-point feedback control system.
4.2.7 Data Analysis
MEMRI Signal-Enhancement
MR image reconstruction was performed using Paravision’s Image Processing and Display
Software (Xtip). Region of interest definitions and calculations were made using ImageJ (NIH)
software (Rasband, W.S., ImageJ, U. S. National Institutes of Health, Bethesda, Maryland, USA,
http://rsb.info.nih.gov/ij/, 1997-2006.). Regions of MEMRI signal-enhancement were determined by
correlation to a standard rat brain atlas (26), based on the slice location relative to the distance from
bregma. ROIs were user defined using ImageJ to distinguish between MEMRI signal-enhanced
regions and normal brain tissue. The percent-signal increase in T1-weighted images was calculated
by comparing MEMRI signal-enhanced regions in the ipsilateral hemisphere to the homologous
contralateral control regions on a slice-by-slice basis:

Nonspecific MEMRI Signal-Enhancement Correlates with Evans Blue Staining 134
100(%) ×−
=−CC
CCIC
SI
SISIIncreasetEnhancemenSignalMEMRI
where SIIC is the signal intensity for an ROI in the ipsilateral hemisphere and SICC is the signal
intensity in the homologous contralateral ROI. Ipsilateral ROIs, drawn for percent signal increase
calculations, and ROIs drawn around the brain were used to determine the spatial extent (area) of
MEMRI signal-enhancement in mm2 as shown by Eq. 4.2. Data are presented as mean ± standard
deviation (SD), with a separate term for the inter-slice signal variability (IS-SD).
100)(
)(%
2
2
×=−−mmAreaBrainTotal
mmAreatEnhancemenMEMRIlIpsilateraAreaEnhancedSignalMEMRI
Evans Blue (EB) Histological Image Analysis
EB stain images (RGB) were transformed into Hue, Saturation, and Intensity using ImageJ
software. Hue refers to the dominant wavelength in the color image; Saturation represents the degree
to which white is mixed with the dominant wavelength; and Intensity represents the intrinsic
reflectivity of the object viewed (27). EB-Saturation images were compared to MR images for
correlation of EB-stained regions with MEMRI signal-enhanced regions. Percent-saturation increase
in EB-stained images was calculated by comparing EB-stained regions in the ipsilateral hemisphere
with the homologous contralateral control regions on a slice-by-slice basis:
100(%) ×−
=CC
CCIC
SatInt
SatIntSatIntIncreaseSaturationEB
where SatIntIC is the saturation intensity for an ROI in the ipsilateral hemisphere and SatIntCC is the
saturation intensity in the homologous contralateral ROI. Ipsilateral ROIs, drawn for saturation
increase calculations, and ROIs drawn around the brain (using RGB EB stain images) were used to
determine the spatial extent of EB saturation in mm2 as shown by Eq. 4.4. Data are presented as
mean ± standard deviation (SD), with a separate term for the inter-slice saturation variability (IS-
SD).
4.1
4.3
4.2

Nonspecific MEMRI Signal-Enhancement Correlates with Evans Blue Staining 135
100)(
)(%
2
2
×=mmAreaBrainTotal
mmAreaSaturationEBlIpsilateraAreaSaturationEB
4.2.8 Statistical Analysis
Comparison between 2% iso/2-min, 3% iso/2-min, 2% iso/10-min, and MnCl2-only groups
was performed using analysis of variance (ANOVA) with the Tukey multiple comparison method.
For EB saturation-increase-specific data, Kruskal-Wallis one-way ANOVA was used. Correlation
between EB-staining data and MEMRI signal- enhancement data was performed using the Pearson
product moment correlation coefficient. A P value of less than 0.05 was considered significant for
all statistical tests. All statistical analyses were performed using SigmaStat (v3.5, Dundas Software,
Ltd. Germany).
4.3 Results
4.3.1 MEMRI Signal-Enhancement
Regional Coverage and Enhancement Level
Figure 4-3 shows multi-slice T1-weighted MRI for animals in the EB control group (2%
isoflurane), MnCl2-only group (2% isoflurane), 2% iso/2-min group, 3% iso/2-min group, and the
2% iso/10-min group. The MEMRI signal-enhancement is non-specific in each of the groups, since
no neuronal stimulus was applied to any subjects in the groups. The average percentage increase in
signal intensity in MEMRI signal-enhanced regions was 42% ± 29% in the MnCl2-only group, 81%
± 23% in the 2% iso/2-min group, 77% ± 22% in the 3% iso/2-min group, and 76% ± 33% in the 2%
iso/10-min group. In almost every animal from every group, MEMRI signal-enhancement was
visible across all six MR slices (exceptions were slice #4 & #5 in 1 animal in the 3% iso/2-min
group and slice #6 in 1 animal in the 2% iso/10-min group). Brain regions with MEMRI signal-
enhancement included cortex, hippocampus (CA1-CA3), geniculate nucleus, deep mesencenphalic
nucleus, thalamic nucleus, hippocampal commissure, and caudate putamen. Patterns of MEMRI
signal-enhancement within or across groups were not observed.
4.4

Nonspecific MEMRI Signal-Enhancement Correlates with Evans Blue Staining 136
Figure 4-3. T1-weighted MRI (i.e., MEMRI) following Evans Blue administration only (2% isoflurane), MnCl2 only (2%
isoflurane), and administration of a solution of MnCl2+EB at different anesthetic levels and at a different time relative to
osmotic BBB disruption. (A) T1-weighted imaging in rat with infusion of EB (2%, 2ml/kg) only 2 minutes following
osmotic BBB disruption. No contrast enhancement is present. (B) MEMRI signal-enhancement in a rat infused with
MnCl2 (10 mM, 2 ml/kg, 4.5 ml/hr) 10 minutes after osmotic BBB disruption (MnCl2-only group). (C) MEMRI signal-
enhancement in a rat infused with a solution of MnCl2+EB 2 minutes after BBB disruption while breathing 2%
isoflurane anesthetic (2% iso/2-min group). (D) MEMRI signal-enhancement in rat infused with a solution of MnCl2+EB
2 minutes after BBB disruption while breathing 3% isoflurane anesthetic (3% iso/2-min group). In this case, there is
more contrast enhancement compared to (C). (E) MEMRI signal-enhancement in rat infused with a solution of MnCl-
2+EB 10 minutes following osmotic BBB disruption while breathing 2% isoflurane (2% iso/10-min group).
Quantitative Summary of MEMRI Signal-Enhancement
Table 4-1 shows the average percentage signal intensity increase and average MEMRI
signal-enhancement area for different brain regions for the MnCl2-only group, 2% iso/2-min group,
3% iso/2-min group, and the 2% iso/10-min group. A significant difference in signal intensity was
detected only between the 2% iso/2-min and MnCl2-only groups (P<0.05, one-way ANOVA, Tukey

Nonspecific MEMRI Signal-Enhancement Correlates with Evans Blue Staining 137 multiple comparison method). Increasing isoflurane anesthetic level from 2% to 3% did not result in
a significant reduction of non-specific MEMRI signal-enhancement.
Table 4-1: Average MEMRI percentage (%) signal intensity increase (relative to the homologous contralateral region),
and average MEMRI signal-enhancement area [as a percentage (%) of the total slice volume], for the various treatment
groups.
Treatment Group
Average MEMRI Percentage (%) Signal Intensity
Increase in All Brain Regions
(using Eq. 4.1)
Average MEMRI Signal-Enhancement Area (as a
percentage (%) of the total slice volume) in All Brain
Regions (using Eq. 4.2)
MnCl2-only 2% iso/2-min 3% iso/2-min 2% iso/10-min
Mean ± SD
42 ± 29
81 ± 23
77 ± 22
76 ± 33
ISSDa
29
15
11
16
Mean ± SD
15 ± 13
24 ± 12
24 ± 14
32 ± 13
ISSDa
13 9
10
13
aTo account for intra-animal variability, the inter-slice standard deviation (ISSD) was calculated from values for the
average percentage (%) signal intensity increase (relative to the homologous contralateral region) across slices with
MEMRI signal-enhancement.
Stability of MEMRI Signal-Enhancement
MEMRI signal-enhancement in all animals was found to change over time. MEMRI signal-
enhancement had a tendency to spread to surrounding pixels over the 90-100 minutes of scanning. In
an animal from the 2% iso/2-min group, signal intensity in the caudate putamen was found to
increase 36% over the 100-minute imaging time (the homologous contralateral control region
showed a decrease in signal intensity of 9% in the same time period). The ROIs used to determine
the signal intensity increase over time are shown in Figure 4-6. The signal intensity dynamic curve
for these ROIs is shown in Figure 4-7.

Nonspecific MEMRI Signal-Enhancement Correlates with Evans Blue Staining 138
Figure 4-6: ROI definitions for determination of MEMRI signal-enhancement over time. Left: first T1-weighted image
(slice #5). Right: Last T1-weighted image acquired ~100 minutes following the first image. Notice the spread of the
MEMRI signal-enhancement over time as well as the increase in signal intensity within the ipsilateral ROI. Note also
the diffuse MEMRI signal intensity changes over time in some regions (black arrows).
2.50E+08
3.50E+08
4.50E+08
5.50E+08
6.50E+08
7.50E+08
8.50E+08
0 9 18 27 36 45 54 63 72 81 90 99
Minutes After First Scan
Signal Intensity (AU)
Ipsilateral ROI
Contralateral ROI
Figure 4-7: Dynamic MEMRI signal intensity changes from the respective ROIs shown in Figure 4-6. As the ipsilateral
ROI is ‘filled in’ with MEMRI signal-enhancement, the mean signal intensity in this region increases. The maximum
signal intensity value in the ipsilateral ROI increased from 9.1x10⁸ to 10.2x10⁸ (AU); however, the average values
plotted above are lower due to the inclusion of unenhanced pixels within the ROI.
4.3.2 Evans Blue (EB) Stain
Regional Coverage and Saturation Enhancement Level
Figure 4-8 shows multi-slice EB-stained images for animals in the EB control group, 2%
iso/2-min group, 3% iso/2-min group, and the 2% iso/10-min group. To quantify the degree of EB
staining, the EB-stained images were transformed into Hue, Saturation, and Intensity images. An
example of this transformation is provided in Figure 4-9 using one animal from the 2% iso/2-min
group. The EB-Saturation image provided the best contrast for quantifying the EB-staining level as
compared to the EB-Hue and EB-Brightness images. The average percentage increase in saturation
intensity in the EB-stained regions was 273% ± 80% in the 2% iso/2-min group, 332% ± 170% in
the 3% iso/2-min group, 157% ± 80% in the 2% iso/10-min group, and 28% ± 30% (0% in one out

Nonspecific MEMRI Signal-Enhancement Correlates with Evans Blue Staining 139 of two animals) in the EB control group. Brain regions with EB staining included cortex,
hippocampus (CA1-CA3), geniculate nucleus, deep mesencenphalic nucleus, thalamic
Figure 4-8: Evans Blue (EB) staining following EB administration only, and administration of a solution of MnCl2+EB
at different anesthetic levels and at different times relative to osmotic BBB disruption. (A) EB staining in rat with
infusion of EB (2%, 2ml/kg) following osmotic BBB disruption (EB control group). This rat was perfused with saline
prior to removal of the brain which may account for the lack of gross EB stain in these slices. (B) EB stain in rat infused
with a solution of MnCl2+EB 2-min after osmotic BBB disruption while breathing 2% isoflurane (2% iso/2-min group)
(C) EB staining in rat infused with a solution of MnCl2+EB 2-min after osmotic BBB disruption while breathing 3%
isoflurane anesthetic (3% iso/2-min group). (D) EB staining in rat infused with a solution of MnCl2+EB 10-min after
osmotic BBB disruption while breathing 2% isoflurane anesthetic (2% iso/10-min group).
nucleus, and caudate putamen. Patterns of EB staining within or across groups were not observed but
were always confined to the right hemisphere as expected.

Nonspecific MEMRI Signal-Enhancement Correlates with Evans Blue Staining 140
Figure 4-9: Evans Blue (EB)-stained image (A, RGB image) transformed into Hue (B), Saturation (C), and Brightness
(D) images (8-bit grayscale). The EB-Saturation image provides the best contrast for determining the degree of EB
staining and the spatial extent of EB-stained regions. The EB-Hue images in this case (and all other animals aside from
the EB control group) show gross saturation in EB-stained regions and thus are not useful for determining the level of
EB staining; however, the EB-Hue images may be useful for determining the spatial extent of EB staining.
Quantitative Summary of Evans Blue (EB)-Staining Intensity
Table 4-2 shows the average percentage increase in EB-Saturation intensity for different
brain regions for the EB control group, 2% iso/2-min group, 3% iso/2-min group, and the 2% iso/10-
min group. Significant differences in EB-Saturation intensity were detected between the EB control
group and all other groups (P < 0.05 for all comparisons) and between the 3% iso/2-min group and

Nonspecific MEMRI Signal-Enhancement Correlates with Evans Blue Staining 141 the 2% iso/10-min group (P < 0.05). For the EB control group, one animal (out of 2) showed no
increase in EB-Saturation intensity in the ipsilateral hemisphere compared to the homologouos
contralateral region. However, when the EB-Hue image was considered, a difference in EB-Hue
intensity was observed between ipsilateral and contralateral hemispheres. The EB-Hue image may
be a more sensitive way to detect EB staining when staining is not grossly visible to the naked eye.
EB-Hue intensity data for both animals in the EB control group are provided in Table 4-3.
Table 4-2: Average percentage (%) increase in EB-Saturation signal intensity (relative to the homologous contralateral
region), and average EB-Saturation signal-enhancement area [as a percentage (%) of the total slice volume], for the
various treatment groups. The EB control group was perfused with paraformaldehyde, which may account for the
significant difference in EB staining and EB-Saturation signal intensity shown here.
Treatment Group
Average Percentage (%) Increase in EB-Saturation
Signal Intensity in All Brain Regions
(using Eq. 4.3)
Average EB-Saturation Signal-Enhancement Area [as a
percentage (%) of the total slice volume] in All Brain Slices
(using Eq. 4.4)
EB control
2% iso/2-min
3% iso/2-min
2% iso/10-min
Mean ± SD
28% ± 30%***
273% ± 80%
332% ± 170%**
157% ± 80%**
ISSDa
6%
38%
71%
77%
Mean ± SD
17 ± 18
24 ± 10
21 ± 12
32 ± 10
ISSDa
4 5
11
10
aTo account for intra-animal variability, the inter-slice standard deviation (ISSD) was calculated from values for the
average EB-Saturation signal-intensity increase across slices with EB staining. ***Significant difference between this
and all other groups, P < 0.05. **Significant difference between these groups, P < 0.05.

Nonspecific MEMRI Signal-Enhancement Correlates with Evans Blue Staining 142 Table 4-3: Average percentage (%) increase in EB-Hue signal intensity (relative to the homologous contralateral region),
and average EB-Hue signal-enhancement area [as a percentage (%) of the total slice volume], for the EB control group
following Infusion of EB solution. The EB control group was perfused with formaldehyde prior to sacrifice.
Treatment Group
Average Percentage (%) Increase in EB-Hue Signal Intensity in All Brain Regions
(using Eq. 4.3)
Average EB-Hue Signal-Enhancement Area [as a
percentage (%) of the total slice volume] in All Brain
Slices (using Eq. 4.4)
EB control
Mean ± SD
72 ± 23
ISSD
14
Mean ± SD
34 ± 13
ISSD
7
4.3.3 Correlation Between Regions of MEMRI Signal-Enhancement and Evans Blue (EB)
Staining
Regional Coverage, Signal and Saturation Enhancement Level
Figure 4-10 shows multi-slice EB-stained histological sections and corresponding T1-
weighted MRI slices, for animals in the 2% iso/2-min, 3% iso/2-min, and 2% iso/10-min groups.
Although EB-stained sections and MR images are not exactly co-registered, it is apparent that there
is good spatial correspondence between regions of EB staining and MEMRI signal-enhancement.
When EB staining is not grossly visible on the histological section, the MEMRI signal-enhancement
in the corresponding regions is low or undetectable.
Figure 4-11 shows multi-slice EB-stained histological sections (RGB format), EB-Saturation
images, and the corresponding T1-weighted MEMR images for an animal in the 3% iso/2-min group
(left) and 2% iso/2-min group (right). In this case, EB-Saturation images provide another means to
quantitatively and/or qualitatively correlate EB-stained regions with those showing MEMRI signal-
enhancement in the brain. Quantitative correlation of MEMRI signal-enhancement level and EB-
saturation signal level – on a slice by slice basis – resulted in a correlation coefficient, r, of 0.57 (P <
0.05) in the 2% iso/2-min group, 0.58 (P < 0.05) in the 3% iso/2-min group, and 0.41 (P = 0.09) in
the 2% iso/10-min group. A stronger correlation was shown between the average percentage
MEMRI signal-enhancement area and the average percentage EB-saturation signal-enhancement
area – on a slice-by-slice basis – with r = 0.80 (P < 0.0001) in the 2% iso/2-min group, r = 0.80 (P <
0.0001) in the 3% iso/2-min group, and r = 0.82 (P < 0.0001) in the 2% iso/10-min group.

Nonspecific MEMRI Signal-Enhancement Correlates with Evans Blue Staining 143
Figure 4-10: MEMRI and corresponding EB-stained histological images (RGB format). MEMRI slices and EB-stained
sections for one animal each from the 2% iso/2-min group (A), 3% iso/2-min group (B), and 2% iso/10-min group (C).
Only one side of the EB-stained histological section shown and does not account for variations in EB staining through
the 2-mm thickness of the slice (in contrast to the MEMR image, which volume averages the MRI signal intensity
through the 2-mm thickness of the slice). Slight differences in spatial registration between the two methods arise from
inherent difficulties in reproducing the slice thickness and slice positions of the histological sections relative to those
acquired using MEMRI. However, in spite of this issue, the spatial correlation between regions of MEMRI signal-
enhancement and the corresponding EB-stained regions on the histological sections is readily apparent.

Nonspecific MEMRI Signal-Enhancement Correlates with Evans Blue Staining 144
Figure 4-11: Evans Blue (EB)-stained histological (left), MEMRI (middle), and EB-Hue images (right) in an animal
from (A) the 3% iso/2-min group and (B) the 2% iso/2-min group. The EB-Hue transformation provides useful contrast
for quantifying gross (i.e., by eye) correlations of regions of EB-staining and MEMRI signal-enhancement in brain.
Quantitative Summary of Correlation between MEMRI Signal-Enhancement and Evans Blue (EB)
Staining
Table 4-4 summarizes the correlation between MEMRI signal-enhancement level and Evans
Blue (EB)-Saturation signal-enhancement level and the correlation between MEMRI signal-
enhancement area and EB-Saturation signal-enhancement area. A weak trend was detected in the
average percentage change in MEMRI and EB-Saturation signal-enhancement levels in all of the
animal groups. A stronger trend was detected in the correlation between the areas of MEMRI and
EB-Saturation enhancement in the brain.

Nonspecific MEMRI Signal-Enhancement Correlates with Evans Blue Staining 145 Table 4-4: Summary of the correlation between MEMRI signal-enhancement level and Evans Blue (EB)-Saturation
signal-enhancement level; and the correlation between MEMRI signal-enhancement area and EB-Saturation signal-
enhancement area for all treatment groups.
Treatment Group
Average Percentage (%) MEMRI and EB-Saturation Signal
Intensity Increase in All Brain Slices
(using Eqs. 4.1 & 4.3)
Average MEMRI and EB-Saturation Signal-Enhancement Area [as a percentage (%) of the total slice volume) in All Brain
Regions (using Eqs. 4.2 & 4.4)
MnCl2-only
EB Control
2% iso/2-min
3% iso/2-min
2% iso/10-min
MEMRI
Signal-
Enhancement
Mean ± SD
42 ± 29
NA
81 ± 23
77 ± 22
76 ± 33
EB
Saturation
Mean ± SD
NA
28 ± 30
273 ± 80
332 ± 170
157 ± 80
Corr.
Coeff.
(r)a
NA
NA
0.57
(P<0.05)
.58
(P<0.05)
0.41
(P = .09)
MEMRI
Signal-
Enhancement
Mean ± SD
15 ± 13
NA
24 ± 12
24 ± 14
32 ± 13
EB
Saturation
Mean ±
SD
NA
17 ± 18
24 ± 10
21 ± 12
32 ± 10
Corr.
Coeff.
(r)a
NA
NA
0.80
(P<0.0001)
0.80
(P<0.0001)
0.82
(P<0.0001) aPearson product moment correlation coefficient.
4.4 Discussion
Mn2+ is a paramagnetic ion and has been used as a brain activation-specific contrast agent in
rats after osmotic disruption of the BBB (1). Mn2+ enters cells via ligand- or voltage-gated calcium
channels during nerve action potentials (6) and binds to magnesium and iron-binding sites and
accumulates within the mitochondria (19). Retention of paramagnetic Mn2+ by cells makes Mn2+ an
attractive means to ‘record’ brain function by MR imaging. Previous experiments have shown that
unintended (non-specific) brain activation in the presence of extracellular Mn2+ may be due to a low
anesthetic state in animals (1) or to the process of osmotic BBB disruption (11). Unintended brain
activation in MEMRI experiments can obscure subsequent changes in MEMRI signal-enhancement

Nonspecific MEMRI Signal-Enhancement Correlates with Evans Blue Staining 146 due to specific neuronal stimulus. No previous MEMRI study has shown histological evidence of
osmotic BBB disruption prior to or following brain activation. Knowledge of the extent of BBB
disruption prior to i.v. administration of Mn2+ can aid in the interpretation of MEMRI signal-
enhancement in the presence of specific or non-specific neuronal stimuli.
In this study we evaluated several groups of animals in an effort to eliminate nonspecific
MEMRI signal-enhancement and to test the efficacy of co-infused MnCl2+EB for elucidating the
extent of BBB disruption and Mn2+ distribution in the brain. Experiments were performed at
different anesthetic levels and using different MnCl2+EB infusion times relative to BBB disruption.
The two major findings of this study were: 1) using the infusion protocols described in this study,
nonspecific MEMRI signal-enhancement is a reproducible occurrence when animals are anesthetized
using either 2% and 3% isoflurane; and 2) the spatial extent of nonspecific MEMRI signal-
enhancement is strongly correlated with the spatial extent of osmotic BBB disruption as verified by
histological staining.
4.4.1 Isoflurane and Halothane Level and Nonspecific MEMRI Signal-Enhancement
The anesthetic condition of the animal is important in MEMRI experiments for prevention of
nonspecific MEMRI signal-enhancement. Lin and Koretsky suggested that nonspecific MEMRI
signal-enhancement was present when animals were anesthetized with 0.3% halothane and non-
existent when animals were anesthetized with 1.3% halothane (1). Aoki et al. failed to elicit specific
MEMRI signal-enhancement in animals that were heavily anesthetized (2.5% halothane), suggesting
an optimal anesthetic condition that suppresses baseline activity but does not inhibit activation of
intentionally stimulated areas (4). The results of this study are comparable to those of Lin and
Koretsky since similar levels of volatile anesthetics were used (1.3% halothane versus 2% and 3%
isoflurane, respectively). At 1.3% concentration, halothane has a similar minimum alveolar
concentration (MAC – level of anesthesia required to just prevent response to painful stimulus,
usually a tail clamp) as compared to 2% isoflurane (~1.7 MAC for halothane and isoflurane (28)) so
at these levels we would expect similar anesthetic conditions. Indeed, Hudetz (28) showed that the
differences in inter-hemispheric electroencephalogram (EEG) readings in rats anesthetized with
halothane or isoflurane disappear when both anesthetics reach a concentration of 1.5%. Below
1.5%, the potency of isoflurane to depress EEG signals (i.e., brain activity) was greater than that of
halothane at similar concentrations (29). In a study of electrophysiological recordings from CA1

Nonspecific MEMRI Signal-Enhancement Correlates with Evans Blue Staining 147 neurons in rat hippocampal brain slices, MacIver and coworkers showed that depression of
electrophysiological signals (glutamate-mediated excitatory synaptic transmissions) was
equivalently achieved with 1.0% isoflurane and 1.3% halothane (30). Experimental evidence based
on general (EEG) and localized (electrophysiological) brain activity using isoflurane and halothane
anesthetics suggest that isoflurane is at least as potent if not more so than halothane at similar
concentrations. Therefore, when comparing the results from this study to those of others for which a
similar concentration of anesthetic was used (and considering that no significant difference in
MEMRI signal-enhancement between the 2% isoflurane and 3% isoflurane groups was found in this
study), other aspects of our experimental protocol were considered for their potential contribution to
the nonspecific MEMRI signal-enhancement. Indeed, Lin and Koretsky used 1.4 molar mannitol to
disrupt the BBB but did not report the rate of mannitol infusion (1). In their case, the BBB-
disruption process may have been just severe enough to allow MnCl2 to permeate the barrier while
not damaging cerebral capillary endothelial cells, brain astrocytes, or glia.
4.4.2 Nonspecific T1-Enhancement after Osmotic BBB Disruption
For many MEMRI experiments investigating brain function, it is necessary to disrupt the
BBB using an i.v. infusion of a hyperosmolar agent prior to or shortly after i.v. infusion of MnCl2.
However, the osmotic BBB-disruption process itself should ideally not induce cellular influx of
Mn2+ since this could lead to nonspecific MEMRI signal-enhancement. Data from several studies
indicates that osmotic BBB disruption does result in varying degrees of nonspecific MEMRI signal-
enhancement. Aoki and colleagues used a dynamic imaging approach to show MEMRI signal-
enhancement during MnCl2 infusion and prior to, during, and after osmotic BBB disruption by
mannitol injection (11). This imaging approach showed a clear increase in nonspecific MEMRI
signal-enhancement immediately following mannitol injection. Results from the study of Aoki et al.
are shown in Figure 4-12. Morita and coworkers (11) also showed a nonspecific increase in MEMRI
signal-enhancement in a dynamic imaging experiment. Mannitol infusion in the studies of both Aoki
et al. and Morita et al. result in large increases in nonspecific MEMRI signal-enhancement in the
BBB-disrupted cortex of rat brain (~50% increase compared to baseline signal). Results from the
study of Morita et al. are shown in Figure 4-13 (8).

Nonspecific MEMRI Signal-Enhancement Correlates with Evans Blue Staining 148
Figure 4-12. Typical time-courses of relative signal intensities in the cortex and ventricle obtained from the glutamate
administration (filled symbols) and control (open squares) groups. The inset indicates typical ROIs. The rise in signal
intensity (MEMRI signal-enhancement) following mannitol injection (arrow at 10 minutes) is clear. Reproduced from
Ref. (11).
Figure 4-13. Time course of T1-weighted MRI signal intensity (MEMRI signal-enhancement) changes in the cortex
(filled squares), lateral habenular nucleus (filled triangles), and other brain regions. Notice the abrupt change in MEMRI
signal-enhancement immediately following mannitol infusion (to break the BBB) in the cortex and lateral habenular
nucleus.
Nonspecific MEMRI Signal-Enhancement Correlates with Evans Blue Staining 149
Although Aoki et al. and Morita et al. used different concentrations of MnCl2 (74.5 mM and
100mM respectively) and different routes of administration of MnCl2 (Aoki et al., right carotid
artery; Morita et al., left femoral vein), it is possible that the nonspecific MEMRI signal-
enhancement observed in this study is also related to the osmotic disruption of the BBB. When
MnCl2+EB is co-infused immediately after osmotic BBB disruption (2% iso/2-min and 3% iso/2-
min groups), the results suggest that cellular uptake of Mn2+ may be indicative of parenchymal cells
undergoing osmotic transitions. Introduction of a waiting period after osmotic BBB disruption, that
does not exceed the time window that the BBB remains open (~15 minutes after osmotic BBB
disruption), may circumvent the osmotic transitions of the parenchymal cells and allow passage of
MnCl2 only into the extracellular space of the brain. To test this hypothesis, an experiment was
designed to investigate the effect of delaying co-infusion of MnCl2+EB from two to ten minutes
following osmotic BBB disruption. The results suggest, however, that there is no significant
difference between infusion of MnCl2+EB at two minutes (2% iso/2-min and 3% iso/2-min groups)
or ten minutes (2% iso/10-min group) following osmotic BBB disruption with respect to levels of
nonspecific MEMRI signal-enhancement or the area of MEMRI signal-enhancement. Therefore,
other effects of osmotic BBB disruption that may contribute to nonspecific MEMRI signal-
enhancement – such as influx of Mn2+ into damaged neurons, influx of Mn2+ into disturbed
endothelial cells, or a combination of these – should be considered.
4.4.3 Cellular Uptake of MnCl2+Evans Blue (EB) Dye after Osmotic BBB Disruption
Several studies report damage to brain cells and uptake of Evans Blue (EB) dye into cells
following osmotic BBB disruption. Salahuddin and coworkers (30) used electron microscopy to
observe brain cells in the brain hemisphere that received an infusion of 1.4 molar mannitol 90
minutes after an i.v. infusion of EB solution. Their experiments revealed darkly EB-stained,
shrunken, and irreversibly injured neurons in the ipsilateral hemisphere. Kozler et al. (31) infused
EB dye two minutes following osmotic BBB disruption by 1.1 M mannitol and used fluorescence
microscopy to determine the ratio of intracellular to extracellular EB dye. The results of Kozler et al.
show that of the EB dye in the brain following osmotic BBB disruption, most is found intracellularly
(>60% of the dye was found intracellularly in cortex, and CA1, CA3 of hippocampus) (31).
The notion that EB dye can enter cells via i.v. infusion after osmotic BBB disruption has
ramifications for the results of the present study. The experimental protocol of Salahuddin et al. (30)
Nonspecific MEMRI Signal-Enhancement Correlates with Evans Blue Staining 150 (EB dye was injected 90 min before osmotic BBB disruption with 1.4 M mannitol @0.12 ml/sec)
differs significantly from that in this study (where EB dye was injected 2 min after BBB disruption
with 1.6 M arabinose @~0.03ml/sec), but the effect on the cells may be similar to those in this study.
The experimental protocol of Kozler et al. (31) was very similar to that used in this study (same EB
infusion protocol) with the only difference being the rate of infusion of the hyperosmolar agent (5
ml/kg @0.12 ml/sec for Kozler et al. vs. 5 ml/kg @55 seconds in this study). Therefore, by analogy,
the MnCl2+EB and arabinose infusion protocol used in this study may result in diffuse cellular
uptake of EB and MnCl2 into cells. Indeed, in another study by Salahuddin et al. (32), pinocytotic
and diffuse uptake of fibronectin and fibrinogen into brain cells was reported following osmotic
BBB disruption with 1.4 M mannitol (1.5 ml in 30 seconds via carotid artery). If Mn2+ enters
neurons by a diffuse process following damage by hyperosmolar agents, Mn2+ would be expected to
reduce the intracellular water proton T1 and T2 relaxation times in a manner similar to the situation
when Mn2+ enters the cell via voltage-gated Ca2+ channels after membrane depolarization.
4.4.4 Limitations
MR Image and Histological Image Correlation
Correlation of regions of MEMRI signal-enhancement with those observed on EB-stained
histological sections were performed without careful spatial co-registration of the respective images.
The signal intensity in MR images are inherently volume averaged (i.e., in these studies, the signal
intensity at each pixel location represents the integral of the entire signal through the 2-mm thick
brain slice). By comparison, the EB-stained region on the histological section only represents the
stained area on the surface of the slice and does not take into account variations in EB staining
through the thickness of the slice). Consequently, these differences can give rise to systematic errors
when comparing the relative areas determined by the two methods. Ideally, the histological slice is
dissected into very thin slices (on order of µm) and several of these thin slices can be used to
estimate the EB-stained area on the histological section. In a future study, in place of many
micrometer thick histological slides, 2-mm-thick histological sections could be imaged on both sides
and then averaged to give a more accurate representation of the EB staining through the slice
thickness. In addition, dissecting the brain ‘by hand’ produced errors by slightly varying the
thickness of the histological sections as well as slight misregistration between the histological slice
positions and those of the MRI slices (which were positioned relative to the rhinal fissure of the
Nonspecific MEMRI Signal-Enhancement Correlates with Evans Blue Staining 151 olfactory bulb). In light of these potential errors, the already strong correlation between the spatial
extent of the MEMRI signal-enhancement and the spatial extent of the EB-stained regions may in
fact be better than that reported in this study.
Evans Blue (EB) Staining After Perfusion
The data from the EB control group of our study is perplexing and suggests that the source of
EB staining, and indeed MEMRI signal-enhancement, may not be within brain but within brain
capillaries. This group showed very little or no EB staining (no MEMRI signal-enhancement
because no MnCl2 was infused) at the same time point of histological staining of all other animals.
Future studies should include perfusion of all animals prior to brain removal to eliminate any
staining artifact that may occur as a result of the decapitation and brain removal process.
4.4.5 Conclusions
In summary, we have shown that co-infusion of MnCl2+Evan Blue (EB) dye following osmotic BBB
disruption allows for the quantification of BBB permeability changes and an inference as to the
extent of Mn2+ distribution in the brain. In addition, we have shown that a particular infusion
protocol of MnCl2+EB and 1.6 M arabinose consistently results in nonspecific MEMRI signal-
enhancement, the extent of which strongly correlates with the extent of BBB disruption. Although
our protocol results in nonspecific MEMRI signal-enhancement that may obscure subsequent
changes in MEMRI signal-enhancement by a specific neuronal stimulus, this method may be a
useful alternative to imaging BBB disruption in rats.
Acknowledgements The authors thank Dr. Karl Helmer (Massachusetts General Hospital, Cambridge, MA) and James
Bouley (University of Massachusetts Medical School, Worcester, MA) for helpful advice with MR
imaging and surgical protocols.
Nonspecific MEMRI Signal-Enhancement Correlates with Evans Blue Staining 152 REFERENCES 1. Lin Y.J., Koretsky A.P. Manganese ion enhances T1-weighted MRI during brain activation:
an approach to direct imaging of brain function. Magn Reson Med 1997;38:378-388. 2. Pautler R.G., Mongear R., Jacobs R.E. In vivo trans-synaptic tract tracing from the murine
striatum and amygdala utilizing manganese-enhanced MRI (MEMRI). Magn Reson Med 2003;50:33-39.
3. Aoki I., Wu Y.J., Silva A.C., Lynch R.M., Koretsky A.P. In vivo detection of neuroarchitecture in the rodent brain using manganese-enhanced MRI. Neuroimage 2004;22:1046-1059.
4. Aoki I., Naruse S., Tanaka C. Manganese-enhanced magnetic resonance imaging (MEMRI) of brain activity and applications to early detection of brain ischemia. NMR Biomed 2004;17:569-580.
5. Aoki I., Ebisu T., Tanaka C., Katsuta K., Fujikawa A., Umeda M., Fukunaga M., Takegami T., Shapiro E.M., Naruse S. Detection of the anoxic depolarization of focal ischemia using manganese-enhanced MRI. Magn Reson Med 2003;50:7-12.
6. Drapeau P., Nachshen D.A. Manganese Fluxes and Manganese-Dependent Neurotransmitter Release in Presynaptic Nerve Endings Isolated From Rat Brain. J Physiol 1984;348:493-510.
7. Narita K., Kawasaki F., Kita H. Mn and Mg influxes through Ca channels of motor nerve terminals are prevented by verapamil in frogs. Brain Res 1990;510:289-295.
8. Morita H., Ogino T., Seo Y., Fujiki N., Tanaka K., Takamata A., Nakamura S., Murakami M. Detection of hypothalamic activation by manganese ion contrasted T(1)-weighted magnetic resonance imaging in rats. Neurosci Lett 2002;326:101-104.
9. Henning E.C. , Meng X. , Fisher M. , Sotak C. Visualization of Cortical Spreading Depression Using Manganese-Enhanced MRI. Magn Reson Med 2005;53:851-857.
10. Duong T.Q., Silva A.C., Lee S.P., Kim S.G. Functional MRI of calcium-dependent synaptic activity: cross-correlation with CBF and BOLD measurements. Magn Reson Med 2000;43:383-392.
11. Aoki I., Tanaka C., Takegami T., Ebisu T., Umeda M., Fukunaga M., Fukuda K., Silva A.C., Koretsky A.P., Naruse S. Dynamic activity-induced manganese-dependent contrast magnetic resonance imaging (DAIM MRI). Magn Reson Med 2002;48:927-933.
12. Cosolo W.C., Martinello P., Louis W.J., N. Christophidis. Blood-brain barrier disruption using mannitol: time course and electron microscopy studies. Am J Physiol 1989R443-R448.
13. Rapoport S.I., Fredericks W.R., Ohno K., Pettigrew K.D. Quantitative aspects of reversible osmotic opening of the blood-brain barrier. Am J Physiol 1980;238:R421-R431.
14. Freedman F.B., Johnson J.A. Equilibrium and kinetic properties of the Evans blue-albumin system. Am J Physio 1969;216:675-681.
15. Ohno K., Fredericks W.R., Rapoport S.I. Osmotic Opening of the Blood-Brain Barrier to Methotrexate in the Rat. Surg Neurol 1979;12:323-328.
16. Remsen L.G., Pagel M.A., McCormick C.I., Fiamengo S.A., Sexton G., Neuwelt E.A. The Influence of Anesthetic Choice, PaCO2, and Other Factors on Osmotic Blood-Brain Barrier Disruption in Rats with Brain Tumor Xenografts. Anesth Analg 1999;88:559-567.
17. Wolman M., Klatzo I., Chui E., Wilmes F., Nishimoto K., Fujiwara K., Spatz M. Evaluation of the Dye-Protein Tracers in Pathophysiology of the Blood-Brain Barrier. Acta Neuropathol (Berl) 1981;54:55-61.
18. Scheuhammer A.M., Cherian M.G. Binding of manganese in human and rat plasma. Biochim Biophys Acta 1985;840:163-169.

Nonspecific MEMRI Signal-Enhancement Correlates with Evans Blue Staining 153 19. Aschner M., Aschner J.L. Manganese Neurotoxicity: Cellular Effects and Blood-Brain
Barrier Transport. Neurosci and Biobehav Rev 1991;15:333-340. 20. Critchfield J.W., Keen C.L. Manganese+2 Exhibits Dynamic Binding to Multiple Ligands in
Human Plasma. Metabolism 1992;41:1087-1092. 21. Davidsson L., Lonnerdal B., Sandstrom B., Kunz C., Keen C. Identification of Transferrin as
the Major Plasma Carrier Protein for Manganese Introduced Orally or Intravenously or After In Vitro Addition in the Rat. J Nutrition 1989;119:1461-1464.
22. Aschner M., Aschner J. Manganese Transport Across the Blood-Brain Barrier: Relationship to Iron Homeostasis. Brain Res Bull 1990;24:857-860.
23. Martin B. The chemistry of aluminum as related to biology and medicine. Clin Chem 1986;32:1797-1806.
24. Ziylan Y.Z., Robinson P.J., Rapoport S.I. Blood-brain barrier permeability to sucrose and dextran after osmotic opening. Am J Physiol 1984R634-R638.
25. Cosolo W. C., Martinello P., Louis W. J., Christophidis N. Blood-brain barrier disruption using mannitol: time course and electron microscopy studies. Am J Physiol 1989;256:R443-447.
26. Paxinos G., Watson C. The Rat Brain in Stereotaxic Coordinates. Orlando: Academic Press; 1986.
27. Fermin C.D., Degraw S. Colour thresholding in video imaging. J Anat 1995;186:469-481 28. Mller K.W. General Anesthetics. In: Feldman S.A., Scurr C.F., Paton W., editors. Drugs in
Anaesthesia: mechanisms of action. London: Edward Arnold, Ltd; 1987. 29. Hudetz A.G. Effect of volatile anesthetics on interhemispheric EEG cross-approximate
entropy in the rat. Brain Research 2002;954:123-131. 30. MacIver M.B., Mikulec A.A., Amagasu S.M., Monroe F.A. Volatile Anesthetics Depress
Glutamate Transmission Via Presynaptic Actions. Anesthesiology 1996;85:823-834. 31. Kozler P., Pokorny J. Altered Blood-Brain Barrier Permeability and Its Effect on the
Distribution of Evans Blue and Sodium Fluorescein in the Rat Brain Applied by Intracarotid Injection. Physiol Res 2003;52:607-614.
CHAPTER 5
Brain Damage and Mismatch Between Manganese-Enhanced MRI (MEMRI) and
Diffusion-Weighted MRI in the Absence of Specific Neuronal Stimuli; Potential Pitfalls in
MEMRI After Osmotic Blood-Brain Barrier (BBB) Disruption
Introduction MEMRI Background
Side Effects of Osmotic BBB Disruption
Methods Animal Preparation
Osmotic BBB Disruption and MnCl2+Evans Blue (EB) Administration MRI Measurements
EB and 2,3,4 Triphenyltetrazolium Chloride (TTC) Histology Data Analysis
Statistical Analysis
Results Animal Physiology
Brain Edema MEMRI Signal-Enhancement
ADC Deficit TTC Lesion Area
MEMRI-DWI Mismatch Correlation of MEMRI-DWI Mismatch to TTC Lesion Area
Discussion
Nonspecific MEMRI Signal-Enhancement: Relation to Anesthesia and Blood Gases Brain Edema After Osmotic BBB Disruption
Is MEMRI Signal-Enhancement Indicative of Tissue Damage? Brain Damage Verified by TTC Lesion
MEMRI-DWI Mismatch

Pitfalls in MEMRI After Osmotic BBB Disruption 154
Brain Damage and Mismatch Between Manganese-
Enhanced MRI (MEMRI) and Diffusion-Weighted
MRI in the Absence of Specific Neuronal Stimuli;
Potential Pitfalls in MEMRI After Osmotic BBB
Disruption
David G. Bennett1, Nils Henninger3, Marc Fisher3,4, Christopher H. Sotak1,2,4
Departments of Biomedical Engineering1 and Chemistry & Biochemistry2
Worcester Polytechnic Institute
Worcester, Massachusetts 01609
Department of Neurology3
University of Massachusetts Memorial Healthcare – Memorial Campus
Worcester, Massachusetts 01605
Department of Radiology4
University of Massachusetts Medical School
Worcester, Massachusetts 01605
Part of this work was presented at the 15th annual meeting of the International Society of Magnetic
Resonance in Medicine, Berlin, Germany, May 2007.
Manuscript in Progress

Pitfalls in MEMRI After Osmotic BBB Disruption 155
Abstract
The goal of this study was to determine the effects of two osmotic blood-brain barrier (BBB)
disruption protocols on brain tissue, apparent diffusion coefficient (ADC), manganese-enhanced
magnetic resonance imaging signal changes (MEMRI signal-enhancement), and differences in area
of ADC deficit and nonspecific MEMRI signal-enhancement (MEMRI-DWI mismatch) in the rat
brain following infusion of manganese chloride (MnCl2) and Evans Blue (EB). Significant brain
edema, tissue damage, ADC deficit, and nonspecific MEMRI signal-enhancement was detected in
the rat following osmotic BBB disruption by arabinose (arabinose group) or mannitol (mannitol
group) and MnCl2+EB infusion in rat. Histology by 2,3,5 triphenyltetrazolium chloride (TTC) and
EB stain verified brain damage and BBB-permeability changes respectively. The mean value of
ipsilateral hemisphere brain area, TTC lesion area, ADC deficit and deficit area, and MEMRI signal-
enhancement and enhancement area were all increased (or decreased in the case of ADC deficit)
compared to homologous regions in the contralateral hemisphere by 12%, 7%, 23%, 28%, and 76%
in the arabinose group and 15%, 9%, 22%, 21%, and 69% in the mannitol group, respectively.
Nonspecific MEMRI signal-enhancement was seen in the hippocampus (CA1-CA3), cortex,
caudate putamen, hypothalamus and geniculate nucleus. The percentage of the ipsilateral
hemisphere with a MEMRI-DWI mismatch was 9% and 8% in the arabinose and mannitol groups,
respectively. The MEMRI-DWI mismatch in these experiments is noteworthy because the ADC
deficit was not elicited by stroke and MEMRI signal-enhancement was not specific to a predefined
neuronal stimulus. The results of this study suggest that ADC deficit and nonspecific MEMRI
signal-enhancement is related to cytotoxic brain edema following osmotic BBB disruption. In
addition, brain regions with MEMRI-DWI mismatch were found to correlate to regions of brain
tissue damage as verified by TTC stain in several animals. The results of these experiments stress the
need for careful assessment of baseline MEMRI-DWI mismatch prior to any subsequent neuronal
stimulus or ischemic intervention; in order to ensure that the osmotic disruption of the BBB itself
does not contribute significantly to any non-specific brain T1 or ADC changes.
Key words: manganese-enhanced MRI, blood-brain barrier, osmotic shock, rat brain

Pitfalls in MEMRI After Osmotic BBB Disruption 156 5.1 Introduction
5.1.1 MEMRI Background
Manganese-enhanced magnetic resonance imaging (MEMRI) is a useful imaging method for
functional brain imaging (1,2) and neuronal tract tracing (3). In response to cell membrane
depolarization, paramagnetic manganese ion (Mn2+) enters voltage-gated calcium (Ca2+) channels.
Once in the cell, Mn2+ alters cell water-proton relaxation times resulting in a localized increase in T1-
weighted (T1W) signal intensity (MEMRI signal-enhancement) (1). This characteristic of Mn2+ has
been used to advantage for imaging experimental neuropathologies such as cortical spreading
depression (CSD) (4) and stroke (5,6). These experiments rely on the delivery of Mn2+ in a
homogeneous fashion to the brain extracellular space prior to neuronal stimulus (i.e., experimental
CSD or anoxic depolarization in stroke) via osmotic disruption of the BBB.
5.1.2 Side Effects of Osmotic BBB Disruption
Unfortunately, osmotic BBB disruption can have severe side effects such as vasogenic edema
(7) and tissue damage (8). Therefore, the adverse effects of osmotic BBB disruption may interfere
with normal brain response to neuronal stimulus in certain MEMRI experiments.
MEMRI Experiments That Rely on Osmotic BBB Disruption
Henning et al. used osmotic BBB disruption to introduce Mn2+ into brain prior to initiating
experimental CSD via the cortical application of 4 M KCl (4). In their report, no evidence of the
extent of BBB disruption or the possible side effects of osmotic agent infusion is provided.
Nonspecific MEMRI signal-enhancement in their case, although possibly due to the intrinsic
neuronal connectivity between specifically-stimulated and non-stimulated brain regions as discussed,
may also be due to cellular response to osmotic BBB disruption. In addition, 3M KCl has been
shown to induce areas of tissue necrosis local to the site of application on the exposed cortex (9,10)
as shown in Figure 5-1. Without evidence of BBB disruption, and considering potential tissue injury
by high concentrations of KCl applied to exposed cortex, interpretation of MEMRI signal-
enhancement is speculative in MEMRI experiments designed to detect experimental CSD.

Pitfalls in MEMRI After Osmotic BBB Disruption 157
Figure 5-1. Time-dependent and region-specific pattern of labeling of tissue from KCl-exposed animals following in situ
hybridization with 35S-laelled cRNA probes complimentary to glial fibrillary acidic protein mRNA. At 24 hours post
application of 3M KCl (ten minute exposure) to the exposed parietal cortex, a focal area of tissue necrosis is evident
(arrows). Reproduced from Ref. (10).
Of additional interest is the study by Aoki et al., for which MEMRI was used to detect
anoxic depolarization following experimental focal ischemia in rats (5). In their study, Aoki et al.
used osmotic BBB disruption to introduce Mn2+ into the brain parenchyma prior to initiating
experimental focal ischemia by permanent occlusion of the middle cerebral artery. In their study,
Aoki et al. used diffusion-weighted (DW) and T1W MRI to monitor the degree of tissue damage
after stroke and qualitatively compared the spatial extent of apparent diffusion coefficient (ADC)
deficit (in calculated ADC maps) to the spatial extent of MEMRI signal-enhancement. In so doing,
the term ‘MEMRI-DWI mismatch’ was coined and was suggested to represent an area of
salvageable tissue not readily detectable by DWI alone. Missing from the study of Aoki et al. was
evidence of BBB disruption, distribution of Mn2+ in brain, and baseline MR images to indicate the
presence or absence of a MEMRI-DWI mismatch prior to experimental stroke (i.e., by osmotic BBB
disruption and infusion of MnCl2 into brain parenchyma). Also lacking was histological evidence
showing the effects, if any, of osmotic BBB disruption on brain tissue. Demonstration of healthy

Pitfalls in MEMRI After Osmotic BBB Disruption 158 brain tissue following osmotic BBB disruption is important because osmotic disruption of the BBB
has been shown to result in pronounced neuronal changes and astrocytic swelling (11). Therefore,
without knowledge of the degree and extent of BBB disruption, and the state of brain tissue
following osmotic BBB disruption, interpretation of MEMRI signal-enhancement and ADC changes
detected after stroke intervention is potentially ambiguous.
Osmotic BBB Disruption Leads to Changes in MRI Contrast and to Tissue Damage
In the present study, the goal was to investigate the effects of an infusion of manganese
chloride following osmotic BBB disruption on DW images and the corresponding ADC maps, T1W
images, and brain tissue based on the use of two different BBB disruption protocols; one using
arabinose and one using mannitol as the hyperosmotic agent. The mannitol protocol in our study is
based on a protocol reported by Aoki et al. (5). The results of our work show significant changes in
DW image contrast, nonspecific MEMRI signal-enhancement that correlates with Evans Blue-
stained regions, and brain tissue damage by 2,3,5 triphenyltetrazolium chloride (TTC) staining in
animals with osmotically-disrupted BBB; but without experimental stroke. These findings are
important considerations for future MEMRI experiments that may utilize similar experimental
protocols as described here and that rely on normal tissue response to specific neuronal stimuli
following osmotic BBB disruption.
5.2 Methods
5.2.1 Animal Preparation
This study was approved by the Institute Animal Care and Use Committee (IACUC) of the
University of Massachusetts Medical School (IACUC Protocol A-1756 and A-875). Male Sprague-
Dawley rats (250-385g; Charles River Laboratories, Worcester, MA) were divided into two groups:
1) infusion of 5 ml/kg of 1.6M arabinose over 55 seconds and 2 ml/kg of MnCl2+Evans Blue (EB)
solution while under 2-3% isoflurane anesthesia (arabinose group, N=10); and 2) infusion of 5 ml/kg
of 1.4M mannitol at 50 ml/hr (5) and 0.3 ml of MnCl2+EB mixture solution while under 0.5%
isoflurane and chloral hydrate (400 mg/kg i.p.) anesthesia (mannitol group, N=4). Arabinose was
chosen as an alternate osmotic agent based on the higher solubility of compound as compared to
mannitol. Rats in the arabinose group were initially anesthetized with 5% isoflurane and maintained
at 2-3% isoflurane during surgery. Rats in the mannitol group were initially anesthetized with 5%

Pitfalls in MEMRI After Osmotic BBB Disruption 159 isoflurane followed by an i.p. injection of 400 mg/kg chloral hydrate. Isoflurane was reduced to
0.5% while the rats were under chloral hydrate anesthesia. PE-50 and PE-10 polyethylene catheters
were placed in the left femoral vein (i.v.) for blood pressure and gas monitoring and right external
carotid artery (ECA) for drug administration, respectively.
For catheterization of the right ECA, a ventral midline incision was made in the neck. The
omohyoid muscle was separated longitudinally and retracted laterally to isolate and expose the right
common carotid artery (CCA), ECA, internal carotid artery (ICA) and pterygopalatine artery (PPA).
The PPA was permanently ligated. Following temporary clamping of the CCA, the ECA was ligated
and a small incision was made into the vessel for placement of the PE-10 catheter. The PE-10
catheter tip was inserted such that the tip would not disturb blood flow in the CCA towards the ICA.
After properly securing the PE-10 catheter, the CCA clamp was removed allowing normal blood
flow to the right ICA (the right CCA was clamped for approximately 10 minutes in each animal).
Cannulation of the right ECA limited drug delivery to the right side of the brain allowing the left
side to serve as control. Rectal temperature was continuously monitored with a rectal probe and
maintained at 37 °C using a thermostatically-controlled heat lamp (Model 73ATD, YSI Inc., Yellow
Spring, OH) during preparation.
Five minutes prior to osmotic BBB disruption, animals were switched from air/isoflurane to
100% O2/isoflurane in preparation for apnea during arabinose and mannitol infusion. Animals were
switched back to air/isoflurane thirty seconds following the end of the arabinose or mannitol
infusion. Arterial blood gases were recorded (i-STAT Portable Clinical Analyzer, Heska Corp.
Waukesha, WI) while breathing air/2-3% isoflurane (N=4 arabinose and mannitol groups) and while
breathing 100% O2/0.5% isoflurane (N=4, arabinose group) before osmotic BBB disruption. Blood
pressure (World Precision Instruments Pressure Monitor, Model BP-1) was sampled twice per
second using Labview-based data acquisition software (N=3, arabinose and mannitol group).
5.2.2 Osmotic BBB Disruption and MnCl2+EB Administration
To disrupt the BBB, 1.6M L-arabinose or 1.4M D-mannitol solution (5 ml/kg, Sigma, St.
Louis) was infused into the right ECA over a period of 55 seconds or 50 ml/hr, respectively, using a
syringe pump (Model PHD 2000; Harvard Apparatus, Holliston, MA). Two minutes prior to the
infusion of L-arabinose or D-mannitol, a slow (6 ml/hr) infusion of (the same) L-arabinose or D-
mannitol was started and continued for 1 minute in an effort to compensate for vasogenic edema

Pitfalls in MEMRI After Osmotic BBB Disruption 160 induced by the bolus L-arabinose or D-mannitol infusion (12). Physiologically-buffered saline (PBS)
containing 10 mM manganese chloride (MnCl2·4H2O; Sigma, St. Louis) and 2% EB (Sigma, St.
Louis) was infused into the right ECA at a rate of 4.5 ml/hr using a syringe pump (Model 11;
Harvard Apparatus, Holliston, MA) until a volume of 2 ml/kg or 0.3 ml was infused in the arabinose
and mannitol groups, respectively. The MnCl2+EB solution was infused 10 minutes following
osmotic BBB disruption in both groups. Infusion of the MnCl2+EB solution was initiated 10 minutes
after arabinose injection to approximate the time of MnCl2 infusion relative to osmotic BBB
disruption used by Aoki et al. (5). All solutions were warmed to 37 °C and filtered with 0.45 µm
syringe filters (Nalgene). Immediately after concluding the MnCl2+EB infusion, rats in the mannitol
group were switched from 0.5% isoflurane to 1.5% isoflurane in order to maintain anesthetic depth
without additional chloral hydrate injections. Timing of infusions is summarized in Figure 5-2.
Figure 5-2: Timing of MnCl2+EB infusion relative to arabinose or mannitol infusion.
5.2.3 MRI Measurements
MR experiments were performed using a Bruker Biospin 2.0T/45 cm imaging spectrometer
equipped with ± 20G/cm self-shielded gradients. T1W MRI was performed using the following
acquisition parameters: TR/TE = 500.0/10.8 ms, FOV = 3 cm x 3 cm, matrix size = 128x128, six
slices with 2-mm thickness, NEX = 8. DWI was performed using a DW spin-echo, echo-planar MRI
pulse sequence with TR/TE = 2000/51 ms, FOV = 3 cm x 3 cm, matrix size = 64x64 zero-filled to
0 1 2 3 …..
Time (minutes) WAIT
1.6 M Arabinose 5 ml/kg @55 sec
WAIT 10 min
MnCl2+EB 2 ml/kg @4.5 ml/hr (arabinose group)
Mannitol or Arabinose @ 6 ml/hr
Stop MnCl2+EB
250g Rat 360g Rat
13 14 15 16 17 18 19 20 21 22
1.4 M mannitol 5ml/kg
@ 50 ml/hr:
MnCl2+EB 0.3 ml @4.5 ml/hr (4 minute infusion, mannitol group)
…..

Pitfalls in MEMRI After Osmotic BBB Disruption 161 128x128 before Fourier transformation, six slices with 2-mm thickness, NEX = 8, six b-values (23,
92, 207, 828, 1126, and 1471 s/mm2), ∆ = 6.0 ms, and δ = 24.31 ms. The slice profiles of DW and
T1W images were matched. The imaging plane was referenced to the rhinal fissure at the boundary
of the olfactory bulb. Acquisition time for one set of images was 8.5 minutes for T1W and 4.8
minutes for DW imaging. During imaging, animals were placed prone within a home-built animal
holder. The head of the animal was fixed within an 8-leg, 4.3 cm diameter 1H volume coil. Animals
were anesthetized with 2-3% (arabinose group) or 1.5% (mannitol group) isoflurane delivered at 1.5
L/min in breathing-quality air. Body temperature was maintained at 37.0 ± 1°C by circulated warm
air using a T-type thermocouple and a double-point feedback control system. T1W and DW MRI
continued sequentially for 3 hours to check for consistency in MEMRI signal-enhancement and DW
image contrast over time.
5.2.4 EB and 2,3,5 TriphenylTetrazolium Chloride (TTC) Histology
Immediately following imaging, isoflurane anesthetic was increased to 5% and shortly
thereafter animals were decapitated. The brain was quickly removed, placed on a section of parafilm
and subsequently cooled for thirty minutes to facilitate handling. Brains were then dissected into six
2-mm slices that corresponded spatially to MR slices (first slice at 1mm ventral to the rhinal fissure
of olfactory bulb). After dissection, brain slices were placed in saline and scanned using a Hewlett-
Packard Scanner (Model #3970) at a resolution of 1200 dpi. After scanning, brain slices were placed
in a 2% solution of TTC (a water and ethanol soluble tetrazolium salt; C19H15ClN4; FW = 335 (13))
and warmed to 37 °C in a lab oven (Fisher Isotemp 500 Series). The time from osmotic BBB
disruption to brain slice placement in TTC solution was approximately 4 hours in each animal. After
ten minutes in the lab oven, all slices were placed in zinc formalin for fixation overnight. The next
day, brain slices were scanned using a Hewlett-Packard Scanner (Model #3970) at a resolution of
1200 dpi. TTC ‘stains’ the brain tissue differently as compared to Evans Blue dye. TTC is reduced
by enzymes in normal tissue to a red, fat soluble, light-sensitive compound (formazan) that turns
normal tissue red thereby delineating normal from damaged tissue (14). Specifically, after
histological staining of brain by TTC, regions that do not appear red are likely to have irreversible
mitochondrial damage, such as may be caused by stroke or severe hypoxia. Evans Blue, in contrast,
is a dye that stains brain tissue (and most other tissues) blue upon contact.

Pitfalls in MEMRI After Osmotic BBB Disruption 162 5.2.5 Data Analysis
Region of interest (ROI) definitions and calculations in T1W images and ADC maps were
made using ImageJ (NIH) software (Rasband, W.S., ImageJ, U. S. National Institutes of Health,
Bethesda, Maryland, USA, http://rsb.info.nih.gov/ij/, 1997-2006). ROIs were drawn freehand to
distinguish between MEMRI signal-enhanced regions, ADC-deficit regions, and normal brain tissue.
MEMRI signal-enhancement increase, MEMRI signal-enhancement area, ADC deficit, and ADC-
deficit area (DA) were all calculated using ROIs drawn freehand by 1) observer visualization; and 2)
intensity-thresholding on T1W images and calculated ADC maps, respectively. For intensity-
thresholding on T1W images, MEMRI signal-enhancement in the ipsilateral hemisphere was
determined by voxels whose signal intensity was 2 standard deviations above the mean of all voxels
in the contralateral hemisphere. This method of analyzing MEMRI signal-enhancement was chosen
to match the technique of Aoki et al. (5) thus allowing us to compare our MEMRI signal-
enhancement results to theirs.
For thresholding ADC maps, ADC deficit in the ipsilateral hemisphere was determined by
pixels whose values were 2 standard deviations below the mean of all pixels in the contralateral
hemisphere. Results from the two ROI definition techniques were compared to determine if ROI
thresholding significantly underestimates the degree and spatial extent of MEMRI signal-
enhancement and ADC deficit. Data are presented as mean ± standard error of the mean (SEM), with
a separate term for the inter-slice standard deviation (ISSD). Regions of MEMRI signal-
enhancement, ADC deficit, and MEMRI-DWI mismatch were determined by correlation to a
standard rat brain atlas (15) based on the slice location in terms of distance from bregma. T1W and
DW image reconstruction was performed using Paravision’s Image Processing and Display Software
(Xtip).
Percent Edema
Edema in the ipsilateral hemisphere was calculated by comparing the area of the ipsilateral
hemisphere to the area of the contralateral hemisphere in both T1W and histological images on a
slice-by-slice basis. Percent edema was calculated using Eq. 5.1.
100% ×−
=AreaHemContra
AreaHemContraAreaHemIpsiEdema
5.1

Pitfalls in MEMRI After Osmotic BBB Disruption 163 where ‘Ipsi Hem Area’ is the area of the ipsilateral hemisphere in mm2, and ‘Contra Hem Area’ is
the area of the contralateral hemisphere in mm2.
MEMRI Signal-Enhancement
MEMRI signal-enhancement in T1W images was calculated through comparison of T1W MR
signal intensity in MEMRI signal-enhanced regions in the ipsilateral hemisphere and T1W MR
signal intensity in the homologous contralateral control regions on a slice-by-slice basis:
100(%) ×−
=−CH
CHIH
SI
SIStEnhancemenSignalMEMRI
where SIIH is the mean signal intensity for an ROI in the ipsilateral hemisphere and SICH is the mean
signal intensity for the equivalent ROI in the contralateral control hemisphere. Percent area of
MEMRI signal-enhancement in T1W images was calculated on a slice-by-slice basis by comparison
of MEMRI signal-enhancement area to the area of the entire ipsilateral hemisphere.
100(%) ×−
=−AreaHemIpsiTotal
AreaEnhancedSignalMEMRIAreaEnhancedSignalMEMRI
Apparent Diffusion Coefficient (ADC) Parameter Mapping
ADC mapping was performed on DW images on a pixel-by-pixel basis using in-house
Interactive Data Language (v5.3 Research Systems, Boulder, CO) software based on the relationship
between the natural log of the signal intensity in DW images and b-value as shown by Eq. 5.4.
bDeMtM −= 0)(
where M(t)/M0 is the signal intensity at a particular b-value and D is the apparent diffusion
coefficient along a particular gradient direction (e.g., x, y, or z). Maps of the average ADC were
generated by taking the mean of the ADC values acquired along each of the x, y, and z-gradient
directions.
5.2
5.3
5.4

Pitfalls in MEMRI After Osmotic BBB Disruption 164 Percent ADC Deficit and Percent-Deficit Area (DA)
Percent ADC deficit in the average ADC maps was calculated through comparison of the
mean ADC deficit in the ROI of the ipsilateral hemisphere and the mean ADC in the entire
contralateral hemisphere on a slice-by-slice basis:
100)(
(%) ×−−
=CH
CHIH
ADC
ADCADCDeficitADC
where ADCIH is the mean ADC in the ADC deficit region in the ipsilateral hemisphere and ADCCH
is the mean ADC in the entire contralateral hemisphere. Percent-ADC-deficit area in the average
ADC maps was calculated on a slice-by-slice basis by comparison of ADC-deficit area to the area of
the entire ipsilateral hemisphere.
100(%) ×=AreaHemIpsiTotal
AreaDeficitADClIpsilateraAreaDeficitADC
MEMRI-DWI Mismatch
MEMRI-DWI mismatch area was calculated as the area of ADC deficit in the ipsilateral
hemisphere that exceeded the boundaries of the MEMRI signal-enhancing regions in the ipsilateral
hemisphere. In most instances, MEMRI signal-enhancement was confined to the region with ADC
deficit. For the few cases where MEMRI signal-enhancement extended beyond the boundaries of the
ADC deficit region, MEMRI-DWI mismatch remained consistently defined as the region of ADC
deficit outside the border of MEMRI signal-enhancement. Using ImageJ, ADC-deficit ROIs were
overlayed on the T1W images with regions of MEMRI signal-enhancement. Regions of ADC deficit
that exceeded the boundaries of the regions of MEMRI signal-enhancement were outlined and
defined as MEMRI-DWI mismatch. Regions of MEMRI signal-enhancement that exceeded the
boundaries of the ADC-deficit region were not considered in any calculation. DW and T1W images
were registered for each slice in every animal. Percent MEMRI-DWI mismatch in T1W images was
calculated on a slice-by-slice basis by comparison of MEMRI-DWI mismatch area to the area of the
entire ipsilateral hemisphere.
100% ×−
=−AreaHemIpsiTotal
AreaMismatchDWIMEMRIAreaMismatchDWIMEMRI
5.6
5.5
5.7
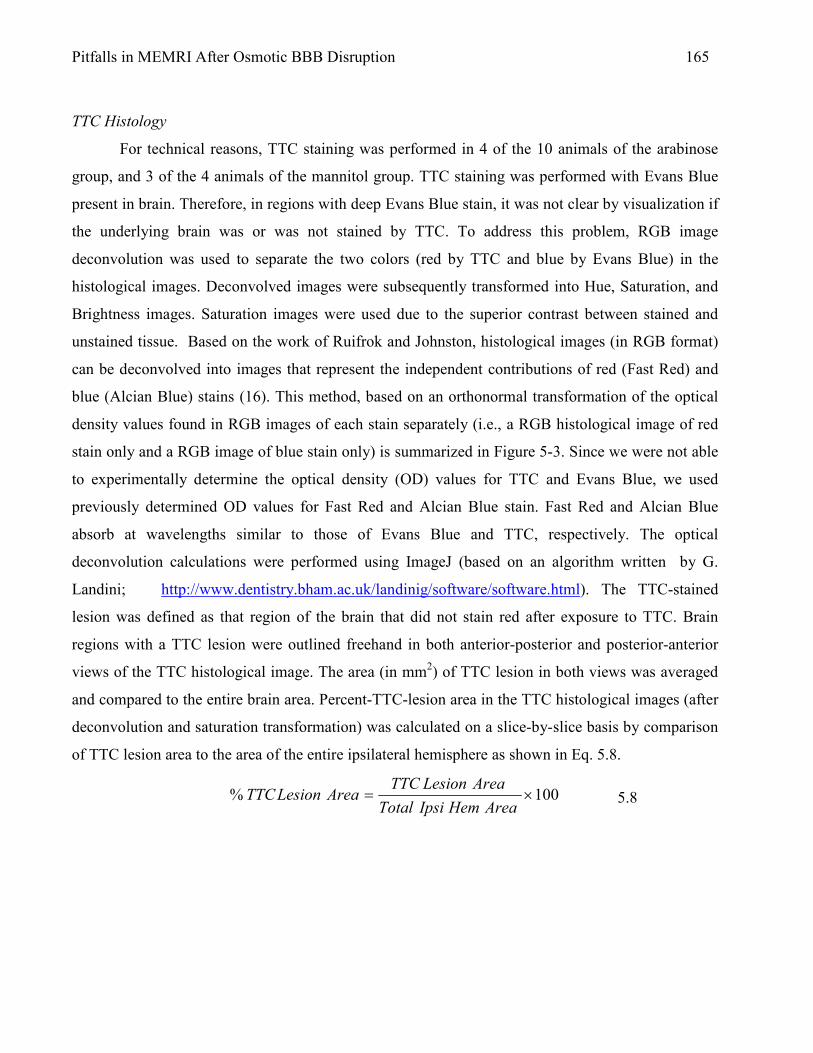
Pitfalls in MEMRI After Osmotic BBB Disruption 165
TTC Histology
For technical reasons, TTC staining was performed in 4 of the 10 animals of the arabinose
group, and 3 of the 4 animals of the mannitol group. TTC staining was performed with Evans Blue
present in brain. Therefore, in regions with deep Evans Blue stain, it was not clear by visualization if
the underlying brain was or was not stained by TTC. To address this problem, RGB image
deconvolution was used to separate the two colors (red by TTC and blue by Evans Blue) in the
histological images. Deconvolved images were subsequently transformed into Hue, Saturation, and
Brightness images. Saturation images were used due to the superior contrast between stained and
unstained tissue. Based on the work of Ruifrok and Johnston, histological images (in RGB format)
can be deconvolved into images that represent the independent contributions of red (Fast Red) and
blue (Alcian Blue) stains (16). This method, based on an orthonormal transformation of the optical
density values found in RGB images of each stain separately (i.e., a RGB histological image of red
stain only and a RGB image of blue stain only) is summarized in Figure 5-3. Since we were not able
to experimentally determine the optical density (OD) values for TTC and Evans Blue, we used
previously determined OD values for Fast Red and Alcian Blue stain. Fast Red and Alcian Blue
absorb at wavelengths similar to those of Evans Blue and TTC, respectively. The optical
deconvolution calculations were performed using ImageJ (based on an algorithm written by G.
Landini; http://www.dentistry.bham.ac.uk/landinig/software/software.html). The TTC-stained
lesion was defined as that region of the brain that did not stain red after exposure to TTC. Brain
regions with a TTC lesion were outlined freehand in both anterior-posterior and posterior-anterior
views of the TTC histological image. The area (in mm2) of TTC lesion in both views was averaged
and compared to the entire brain area. Percent-TTC-lesion area in the TTC histological images (after
deconvolution and saturation transformation) was calculated on a slice-by-slice basis by comparison
of TTC lesion area to the area of the entire ipsilateral hemisphere as shown in Eq. 5.8.
100% ×=AreaHemIpsiTotal
AreaLesionTTCAreaLesionTTC
5.8

Pitfalls in MEMRI After Osmotic BBB Disruption 166
Figure 5-3: Flow chart for the color deconvolution algorithm from Ref. (16). The optical density (OD) values are
experimentally determined for each stain alone. Since experimental determination of TTC and Evans Blue OD values
was not possible in this study, the OD values of Fast Red and Alcian Blue (previously determined by G. Landini and
provided within the ImageJ software) were used to approximate the OD values for TTC and Evans Blue, respectively.
The OD values of Fast Red and Alcian Blue are comparable to those of TTC and Evans Blue, respectively ((e.g., Fast
Red: 266 nm, TTC: 247 nm, Alcian Blue: 615 nm, Evans Blue: 611 nm; from Ref (13)). The orthonormal transformation
of the OD matrix (normalized OD matrix) results in a matrix that describes the independent contribution of each stain
color to the overall Red, Green, and Blue (RGB) values in a RGB image. If C is defined as a 3x1 vector of the stain
intensity at a particular pixel N, the OD level at pixel N is defined by y = CM, where M is the normalized OD matrix
and C is the orthogonal (independent) representation of the stains forming the RGB image. Finally, solving for C is done
by C = M-1y.

Pitfalls in MEMRI After Osmotic BBB Disruption 167 Edema Correction
All MEMRI signal-enhancement area, ADC-deficit area, and TTC-lesion area data were
corrected for edema. T1W images and calculated average ADC maps were edema-corrected based on
percent edema calculated from T1W images. TTC-lesion area was edema-corrected based on percent
edema calculated from TTC-stain images. Percent MEMRI signal-enhancement, percent ADC
deficit, and percent TTC-lesion area were all edema corrected according to Eq. 5.9.
−−×=
AreaHemContra
AreaHemContraAreaHemIpsiOriginalEC
(1
where ‘EC’ is the edema-corrected version of the original percent MEMRI signal-enhancement,
percent ADC deficit, or percent TTC-lesion area and ‘Ipsi Hem Area’ and ‘Contra Hem Area’ are
the areas of the ipsilateral hemisphere and contralateral hemisphere in the T1W or histological (TTC)
images.
5.2.6 Statistical Analysis
Data are reported as mean ± s.e.m.. Data from the arabinose and mannitol groups were
compared by paired and unpaired Student’s t-tests. Statistically significant differences were reported
when P<0.05.
5.3 Results
5.3.1 Animal Physiology
Blood Pressure
The mean arterial blood pressures before osmotic BBB disruption were 89.8 ± 0.4 mmHg in
the arabinose group and 72.0 ± 0.4 mmHg in the mannitol group. During infusion of arabinose and
mannitol, the blood pressure fluctuated by approximately 10 mmHg. As shown in Figure 5-4, blood
pressure reached a steady-state immediately following the end of arabinose and mannitol infusions,
but followed a downward trend from 90 mmHg to 80 mmHg two minutes later in the arabinose
group and an upward trend from 80 mmHg to 98 mmHg two minutes later in the mannitol group.
Immediately following the start of MnCl2+EB infusion in the arabinose group, blood pressure
dropped by approximately 5 mmHg and then fluctuated between ±10 mmHg until the end of the
infusion. Blood pressure in the arabinose group reached a steady state after the end of MnCl2+EB
infusion. Blood pressure in the mannitol group started to drop before the MnCl2+EB infusion and
5.9

Pitfalls in MEMRI After Osmotic BBB Disruption 168 continued to drop until a steady-state was reached. Blood pressure in the mannitol group dropped
again in response to an increase in isoflurane anesthetic concentration.
Figure 5-4: Blood pressure dynamic before, during, and after osmotic BBB disruption and MnCl2+EB infusions. The
curves represent a 10-point moving average of blood pressure readings from three animals in the arabinose group (A)
and two animals in the mannitol group (B) for which blood pressure data was acquired. The difference in infusion times
of MnCl2+EB in the arabinose group was due to the different weights of the animals (250g, 375g, and 385g). Blood
pressure decreased immediately after and during MnCl2+EB infusion in the arabinose and mannitol group, respectively.
A decrease in blood pressure during i.v. MnCl2 infusion is expected because Mn2+ competes for Ca2+ in the heart.
A)
B) Average (N=2) BP in mannitol group
Average (N=3) BP in arabinose group

Pitfalls in MEMRI After Osmotic BBB Disruption 169 Blood Gases
Blood gases were recorded in certain animals (N=4 arabinose group, N=3 mannitol group)
prior to osmotic BBB disruption and prior to switching from air/isoflurane to 100% O2/isoflurane.
Blood-gas data is summarized in Table 5-1.
Table 5-1: Blood Gases Measured from Animals in the Arabinose and Mannitol Groups.
Blood Gas Variable Arabinose Group (N=4)
Average ± SEM
Mannitol Group (N=3)
Average ± SEM
pH
PCO2
PO2
BEECF (mmol/L)
HCO3 (mmol/L)
TCO2 (mmol/L)
SO2 (%)
Na (mmol/L)
K (mmol/L)
iCa (mmol/L)
Glu (mg/dL)
Hct (%PCU)
Hb (g/dL)
7.4 ± 0.0
49.8 ± 2.0
57.8 ± 2.0
2.3 ± 0.7
27.8 ± 0.7
29.5 ± 0.8
87.5 ± 1.0
136.0 ± 0.7
4.5 ± 0.2
1.4 ± 0.0
261.5 ± 17.0
37.3 ± 0.4
12.7 ± 0.1
7.4 ± 0.0
48.0 ± 1.8
74.0 ± 0.6
0.7 ± 0.3
26.5 ± 0.5
28.0 ±0.6
93.7 ± 0.3
135.3 ± 0.9
5.5 ± 0.1
1.2 ± 0.0
245.7 ± 10.3
42.3 ± 1.5
14.4 ± 0.5
5.3.2 Brain Edema
Percent Edema in T1W and Histological Images
Figure 5-5 shows histological images from one animal in which edema of the right
hemisphere is apparent. Percent-edema in both animal groups was calculated separately using T1W
and histological images. Percent-edema in the arabinose group was 4% ± 1% and 12% ± 2% using
T1W and histological images for edema calculation, respectively. Percent-edema in the mannitol
group was 9% ± 1% and 15% ± 2% using T1W and histological images for edema calculation,
respectively. A significant difference between the use of T1W and histological images to calculate
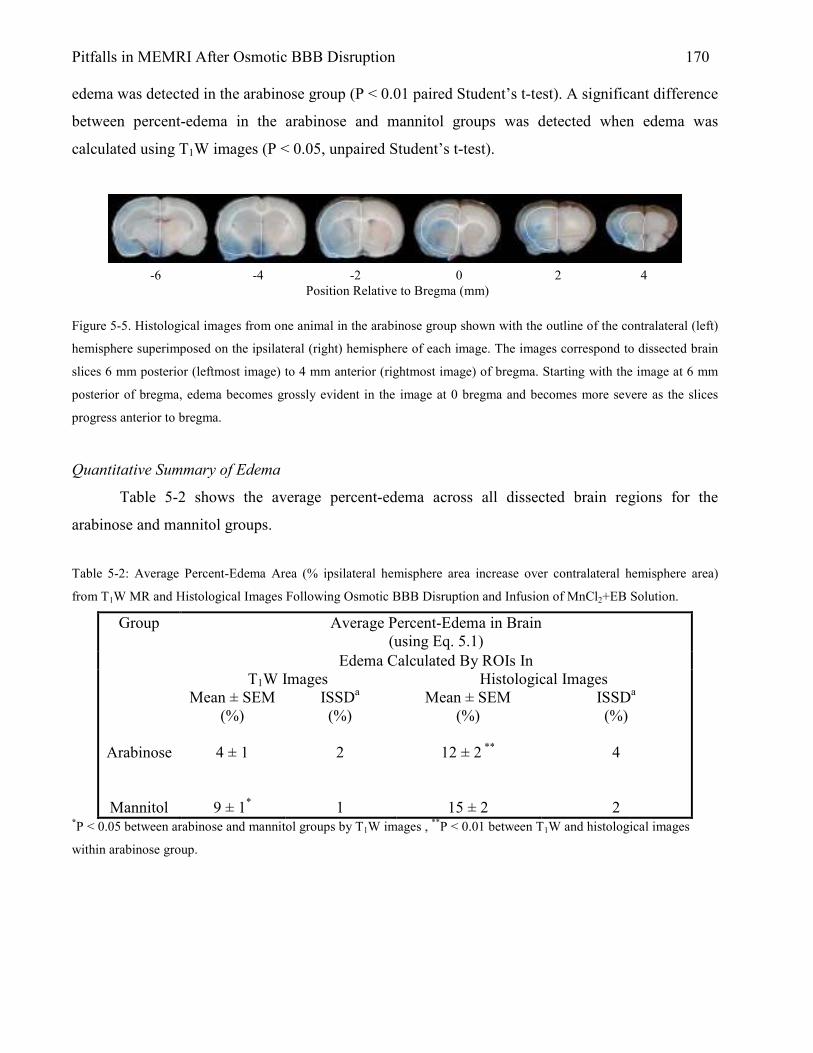
Pitfalls in MEMRI After Osmotic BBB Disruption 170 edema was detected in the arabinose group (P < 0.01 paired Student’s t-test). A significant difference
between percent-edema in the arabinose and mannitol groups was detected when edema was
calculated using T1W images (P < 0.05, unpaired Student’s t-test).
Figure 5-5. Histological images from one animal in the arabinose group shown with the outline of the contralateral (left)
hemisphere superimposed on the ipsilateral (right) hemisphere of each image. The images correspond to dissected brain
slices 6 mm posterior (leftmost image) to 4 mm anterior (rightmost image) of bregma. Starting with the image at 6 mm
posterior of bregma, edema becomes grossly evident in the image at 0 bregma and becomes more severe as the slices
progress anterior to bregma.
Quantitative Summary of Edema
Table 5-2 shows the average percent-edema across all dissected brain regions for the
arabinose and mannitol groups.
Table 5-2: Average Percent-Edema Area (% ipsilateral hemisphere area increase over contralateral hemisphere area)
from T1W MR and Histological Images Following Osmotic BBB Disruption and Infusion of MnCl2+EB Solution.
Average Percent-Edema in Brain (using Eq. 5.1)
Edema Calculated By ROIs In
Group
T1W Images Histological Images
Arabinose
Mannitol
Mean ± SEM (%)
4 ± 1
9 ± 1*
ISSDa
(%) 2 1
Mean ± SEM (%)
12 ± 2 **
15 ± 2
ISSDa
(%) 4 2
*P < 0.05 between arabinose and mannitol groups by T1W images , **P < 0.01 between T1W and histological images
within arabinose group.
-6 -4 -2 0 2 4 Position Relative to Bregma (mm)
Pitfalls in MEMRI After Osmotic BBB Disruption 171 5.3.3 MEMRI Signal-Enhancement
Enhancement Level, Enhancement Area, and Regional Coverage
Figure 5-6 shows representative multi-slice T1W MRI for animals in the arabinose and
mannitol groups. MEMRI signal-enhancement is nonspecific, i.e., no neuronal stimulus was applied
to any animal in either group. The average percentage increase in signal intensity in MEMRI signal-
enhanced regions was 88% ± 6% and 77% ± 6% in the arabinose group by T1W image visualization
and intensity-thresholding, respectively. For the mannitol group, the comparable values were 91% ±
8% and 69% ± 11% by T1W-image visualization and intensity-thresholding, respectively.
Calculation of MEMRI signal-enhancement by T1W-image visualization and intensity-thresholding
methods within the arabinose and mannitol groups did not produce significantly different results.
There was no significant difference in signal intensity in MEMRI signal-enhanced regions between
the arabinose and mannitol groups (by either T1W-image visualization or intensity-thresholding
methods).
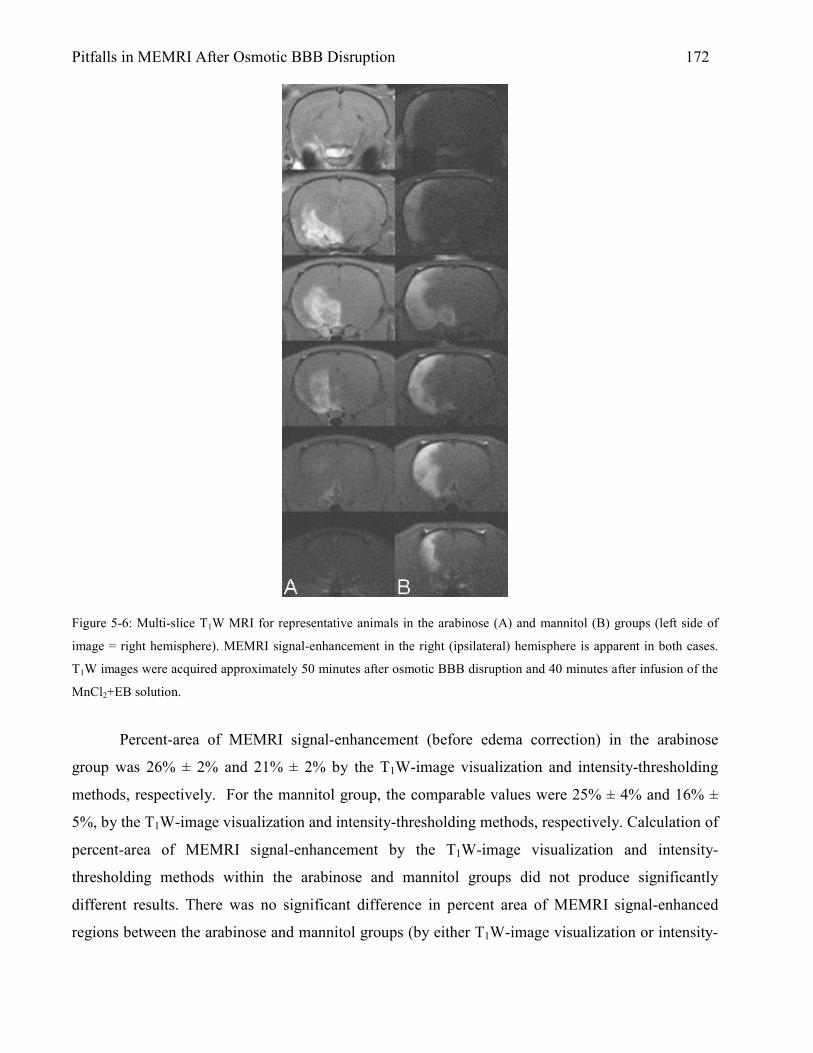
Pitfalls in MEMRI After Osmotic BBB Disruption 172
Figure 5-6: Multi-slice T1W MRI for representative animals in the arabinose (A) and mannitol (B) groups (left side of
image = right hemisphere). MEMRI signal-enhancement in the right (ipsilateral) hemisphere is apparent in both cases.
T1W images were acquired approximately 50 minutes after osmotic BBB disruption and 40 minutes after infusion of the
MnCl2+EB solution.
Percent-area of MEMRI signal-enhancement (before edema correction) in the arabinose
group was 26% ± 2% and 21% ± 2% by the T1W-image visualization and intensity-thresholding
methods, respectively. For the mannitol group, the comparable values were 25% ± 4% and 16% ±
5%, by the T1W-image visualization and intensity-thresholding methods, respectively. Calculation of
percent-area of MEMRI signal-enhancement by the T1W-image visualization and intensity-
thresholding methods within the arabinose and mannitol groups did not produce significantly
different results. There was no significant difference in percent area of MEMRI signal-enhanced
regions between the arabinose and mannitol groups (by either T1W-image visualization or intensity-

Pitfalls in MEMRI After Osmotic BBB Disruption 173 thresholding methods). Brain regions with MEMRI signal-enhancement included cortex,
hippocampus (CA1-CA3), geniculate nucleus, deep mesencenphalic nucleus, thalamic nucleus, deep
mesencenphalic nucleus, and caudate putamen. Patterns of MEMRI signal-enhancement within or
across groups were not observed. MEMRI signal-enhancement was, however, always confined to the
right (ipsilateral) hemisphere.
Quantitative Summary of MEMRI Signal-Enhancement
Tables 5-3 and 5-4 show the average percent MEMRI signal-enhancement and average
percent area of MEMRI signal-enhancement, respectively, for different brain regions for the
arabinose and mannitol groups.
Table 5-3: Average Percent MEMRI Signal-Enhancement (%, relative to a homologous region in the contralateral
hemisphere) from T1W MRI for all MEMRI Signal-Enhanced Brain Regions Following Infusion of the MnCl2+EB
solution.
Average Percent MEMRI Signal-Enhancement Across All Brain Slices (using Eq. 5.2)
MEMRI Signal-Enhanced Regions Determined By
Group
Visualization Intensity-Thresholding
Arabinose
Mannitol
Mean ± SEM (%)
76 ± 6
69 ± 11
ISSDa
(%)
12
19
Mean ± SEM (%)
88 ± 6
91 ± 8
ISSDa
(%)
16
13
aTo account for intra-animal variability, the inter-slice standard deviation (ISSD) was calculated from values for the
average signal increase (%) across slices with MEMRI signal-enhancement.

Pitfalls in MEMRI After Osmotic BBB Disruption 174
Table 5-4: Average Percent Area of MEMRI Signal-Enhancement (relative to the total brain area) from T1W MRI for all
MEMRI Signal-Enhanced Brain Regions Following Infusion of the MnCl2+EB solution.
Average Percent-Area of MEMRI signal-enhancement Across All
Brain Slices (using Eq. 5.6)
MEMRI Signal-Enhanced Regions Determined By Visualization Intensity-Thresholding
Group
Before Edema
Correction
After Edema
Correction
Before Edema
Correction
After Edema
Correction
Arabinose
Mannitol
Mean ±
SEM (%)
26 ± 2
25 ± 4
ISSDa
(%)
10 4
Mean ±
SEM (%)
24 ± 2
22 ± 4
ISSDa
(%)
9 4
Mean ±
SEM (%)
21 ± 2
16 ± 5
ISSDa (%) 7 4
Mean ±
SEM (%)
20 ± 2
15 ± 4
ISSDa
(%) 7 4
aTo account for intra-animal variability, the inter-slice standard deviation (ISSD) was calculated from values for the
average signal-intensity increase (%) across slices with MEMRI signal-enhancement.
5.3.4 ADC Deficit
ADC Deficit Level, ADC Deficit Area, and Regional Coverage
Figure 5-7 shows representative multi-slice, calculated average ADC maps for representative
animals in the arabinose and mannitol groups. The average percent decrease in ADC value in regions
with ADC deficit was 23% ± 1% and 29% ± 1% in the arabinose group by the ADC-map
visualization and intensity-thresholding methods, respectively. For the mannitol group, the
corresponding values were 22% ± 3% and 34% ± 5% by the ADC-map visualization and intensity-
thresholding methods, respectively. Calculation of percent-ADC deficit by ADC-map visualization
and intensity-thresholding methods within the arabinose and mannitol groups was significantly
different in both groups (P < 0.001 arabinose group; P < 0.05 mannitol group). There was no
significant difference in ADC deficit between the arabinose and mannitol groups (by either ADC-
map visualization or intensity-thresholding methods).

Pitfalls in MEMRI After Osmotic BBB Disruption 175
Figure 5-7: Multi-slice, calculated average ADC maps for animals in the arabinose (A) and mannitol (B) groups (left side
of image = right hemisphere). ADC deficit in the right (ipsilateral) hemisphere is apparent in most of the slices in both
cases. The DW images used to generate the ADC maps in (A) and (B) were acquired approximately 60 minutes after
osmotic BBB disruption.
Percent-area of ADC deficit (before edema correction) was 30% ± 2% and 19% ± 1% in the
arabinose group by the ADC-map visualization and intensity-thresholding methods, respectively.
For the mannitol group, the corresponding values were 24% ± 7% and 8% ± 4% by the ADC-map
visualization and intensity-thresholding methods, respectively. Calculation of percent-area of ADC
deficit by the ADC-map visualization and intensity-thresholding methods was significantly different
in the arabinose group only (P < 0.001 arabinose group; P = 0.06 mannitol group). Calculated
percent-area of ADC deficit was significantly different between the arabinose and mannitol groups
(by ADC-map intensity-thresholding method only, P < 0.05; by ADC-map visualization, P = 0.45).

Pitfalls in MEMRI After Osmotic BBB Disruption 176 Brain regions with ADC deficit included cortex, hippocampus (CA1-CA3), geniculate nucleus, deep
mesencenphalic nucleus, thalamic nucleus, and caudate putamen. ADC deficit was confined to the
right (ipsilateral) hemisphere and may reflect changes in brain volume due to osmotic BBB
disruption or moderate hypoxia. Patterns of ADC deficit within or across groups were not observed.
Quantitative Summary of ADC Deficit
Tables 5-5 and 5-6 show the average percent-ADC deficit and average percent-area of ADC
deficit, respectively, for different brain regions for the arabinose and mannitol groups.
Table 5-5: Average Percent-ADC Deficit (% relative to a homologous region in the contralateral hemisphere) from ADC
Maps for all Brain Regions with ADC Deficit Following Osmotic BBB Disruption and Infusion of the MnCl2+EB
Solution.
Average Percent-ADC Deficit Across All Brain Slices (using Eq. 5.5)
ADC Deficit Region Determined By
Group
Visualization Intensity-Thresholding
Arabinose
Mannitol
Mean ± SEM (%)
23 ± 1
22 ± 3
ISSDa
(%) 4 4
Mean ± SEM (%)
29 ± 1***
34 ± 5*
ISSDa
(%) 6
10
aTo account for intra-animal variability, the inter-slice standard deviation (ISSD) was calculated from values for the
average ADC deficit (%) across slices with MEMRI signal-enhancement. ***P<0.001 compared to ADC-map
visualization method, *P<0.05 compared to ADC-map visualization method.

Pitfalls in MEMRI After Osmotic BBB Disruption 177 Table 5-6: Average Percent-Area of ADC Deficit (% relative to a homologous region in the contralateral hemisphere)
from ADC Maps for all Brain Regions with ADC Deficit Following Osmotic BBB Disruption and Infusion of the
MnCl2+ EB Solution.
Average Percent-Area of ADC Deficit Across All Brain Regions (using Eq. 5.3)
ADC Deficit Region Determined By ADC Map: Visualization Intensity-Thresholding Group
Before Edema
Correction
After Edema
Correction
Before Edema
Correction
After Edema
Correction
Arabinose
Mannitol
Mean ±
SEM (%)
30 ± 2
24 ± 7
ISSDa
(%)
9
7
Mean ±
SEM (%)
28 ± 2
21 ± 6
ISSDa
(%)
8 7
Mean ±
SEM (%)
19 ± 1***
8 ± 4*
ISSDa
(%)
10 6
Mean ±
SEM (%)
18 ± 1***
8 ± 3*
ISSDa
(%)
10 6
aTo account for intra-animal variability, the inter-slice standard deviation (ISSD) was calculated from values for the
average area of ADC deficit across slices with ADC deficit. ***P<0.001 compared to the ADC map visualization method. *P<0.05 compared to the arabinose group.
5.3.5 TTC Lesion Area
TTC- Stain Deconvolution and Saturation Transform
Figure 5-10 shows representative multi-slice histological images after TTC staining for one
animal in the arabinose group and one animal in the mannitol group. Figure 5-10 also shows the
same TTC stain images after deconvolution (using the algorithm summarized in Figure 5-3) into
independent representative EB and TTC images and after transformation into Saturation images. As
shown in Figure 5-10, deconvolution is useful for separating multicolor histological images (in RGB
format) into images that represent the contribution of each stain color to the RGB image. The
Saturation transform is useful for enhancing the contrast between stained and unstained regions in
the deconvolved images.
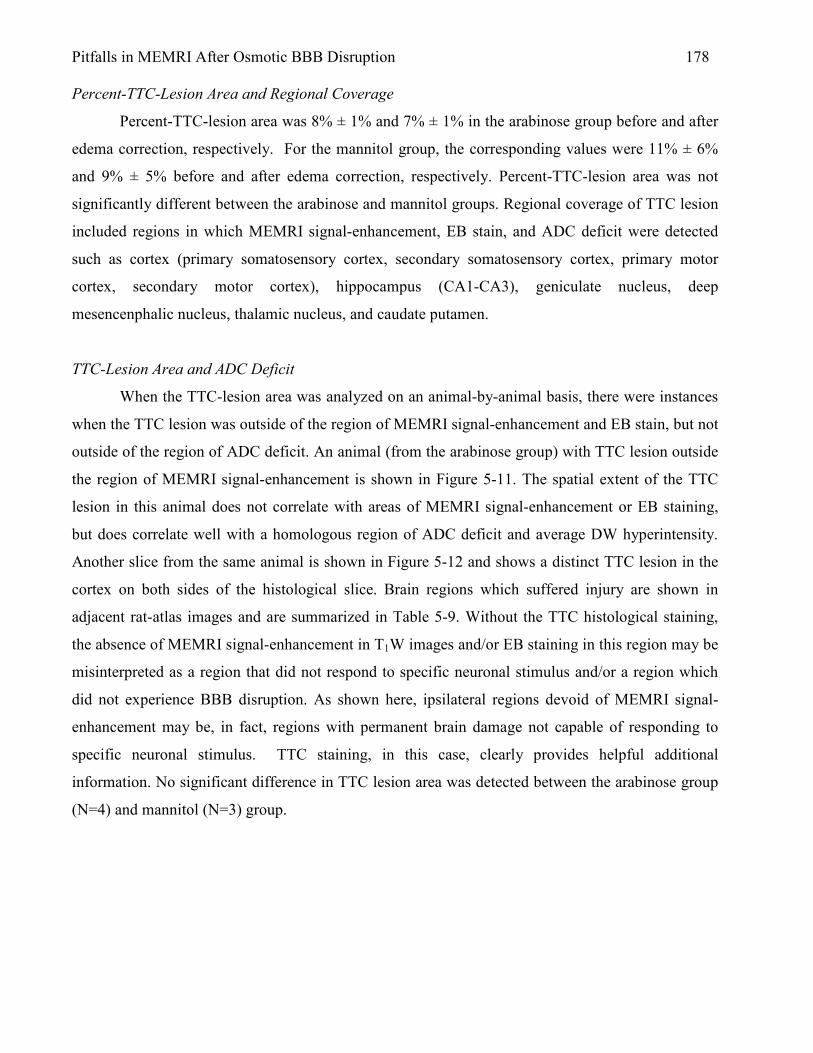
Pitfalls in MEMRI After Osmotic BBB Disruption 178 Percent-TTC-Lesion Area and Regional Coverage
Percent-TTC-lesion area was 8% ± 1% and 7% ± 1% in the arabinose group before and after
edema correction, respectively. For the mannitol group, the corresponding values were 11% ± 6%
and 9% ± 5% before and after edema correction, respectively. Percent-TTC-lesion area was not
significantly different between the arabinose and mannitol groups. Regional coverage of TTC lesion
included regions in which MEMRI signal-enhancement, EB stain, and ADC deficit were detected
such as cortex (primary somatosensory cortex, secondary somatosensory cortex, primary motor
cortex, secondary motor cortex), hippocampus (CA1-CA3), geniculate nucleus, deep
mesencenphalic nucleus, thalamic nucleus, and caudate putamen.
TTC-Lesion Area and ADC Deficit
When the TTC-lesion area was analyzed on an animal-by-animal basis, there were instances
when the TTC lesion was outside of the region of MEMRI signal-enhancement and EB stain, but not
outside of the region of ADC deficit. An animal (from the arabinose group) with TTC lesion outside
the region of MEMRI signal-enhancement is shown in Figure 5-11. The spatial extent of the TTC
lesion in this animal does not correlate with areas of MEMRI signal-enhancement or EB staining,
but does correlate well with a homologous region of ADC deficit and average DW hyperintensity.
Another slice from the same animal is shown in Figure 5-12 and shows a distinct TTC lesion in the
cortex on both sides of the histological slice. Brain regions which suffered injury are shown in
adjacent rat-atlas images and are summarized in Table 5-9. Without the TTC histological staining,
the absence of MEMRI signal-enhancement in T1W images and/or EB staining in this region may be
misinterpreted as a region that did not respond to specific neuronal stimulus and/or a region which
did not experience BBB disruption. As shown here, ipsilateral regions devoid of MEMRI signal-
enhancement may be, in fact, regions with permanent brain damage not capable of responding to
specific neuronal stimulus. TTC staining, in this case, clearly provides helpful additional
information. No significant difference in TTC lesion area was detected between the arabinose group
(N=4) and mannitol (N=3) group.
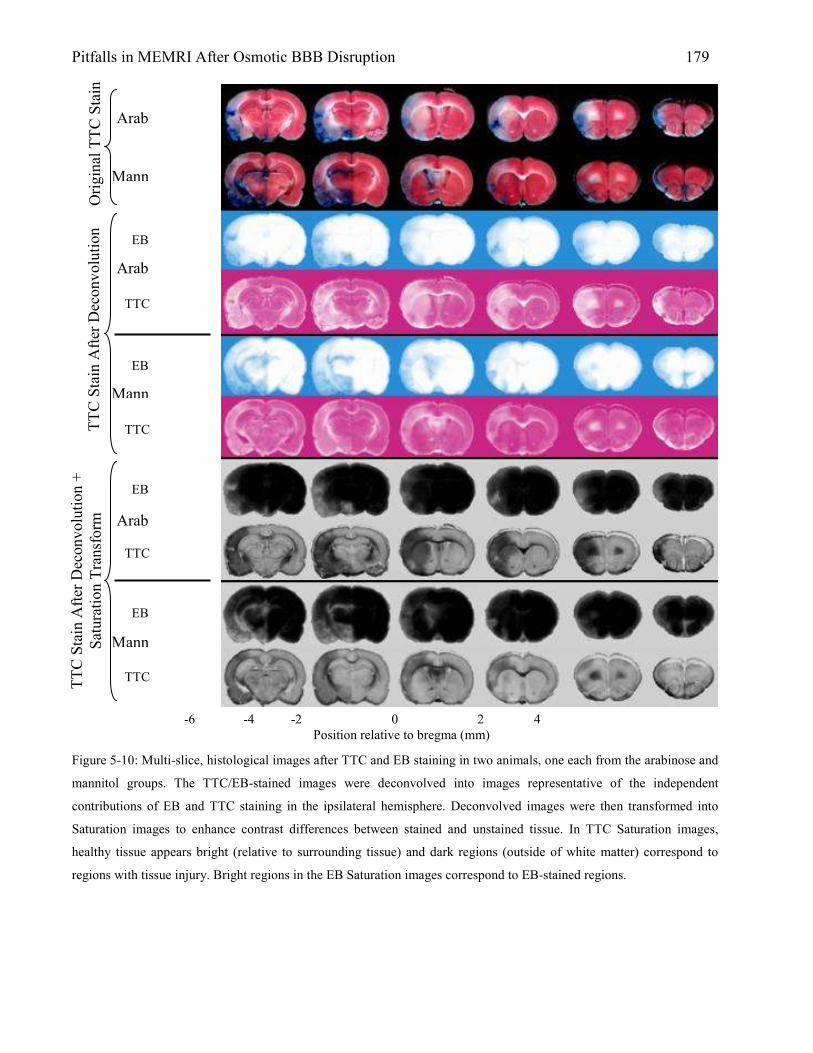
Pitfalls in MEMRI After Osmotic BBB Disruption 179
Figure 5-10: Multi-slice, histological images after TTC and EB staining in two animals, one each from the arabinose and
mannitol groups. The TTC/EB-stained images were deconvolved into images representative of the independent
contributions of EB and TTC staining in the ipsilateral hemisphere. Deconvolved images were then transformed into
Saturation images to enhance contrast differences between stained and unstained tissue. In TTC Saturation images,
healthy tissue appears bright (relative to surrounding tissue) and dark regions (outside of white matter) correspond to
regions with tissue injury. Bright regions in the EB Saturation images correspond to EB-stained regions.
Arab
Mann
Arab
Mann
Arab
Mann
Origi
nal T
TC S
tain
TTC S
tain
After D
econ
volu
tion
TTC S
tain
After D
econ
volu
tion +
Satu
ratio
n Trans
form
EB
TTC
EB
TTC
EB
TTC
EB
TTC
-6 -4 -2 0 2 4 Position relative to bregma (mm)
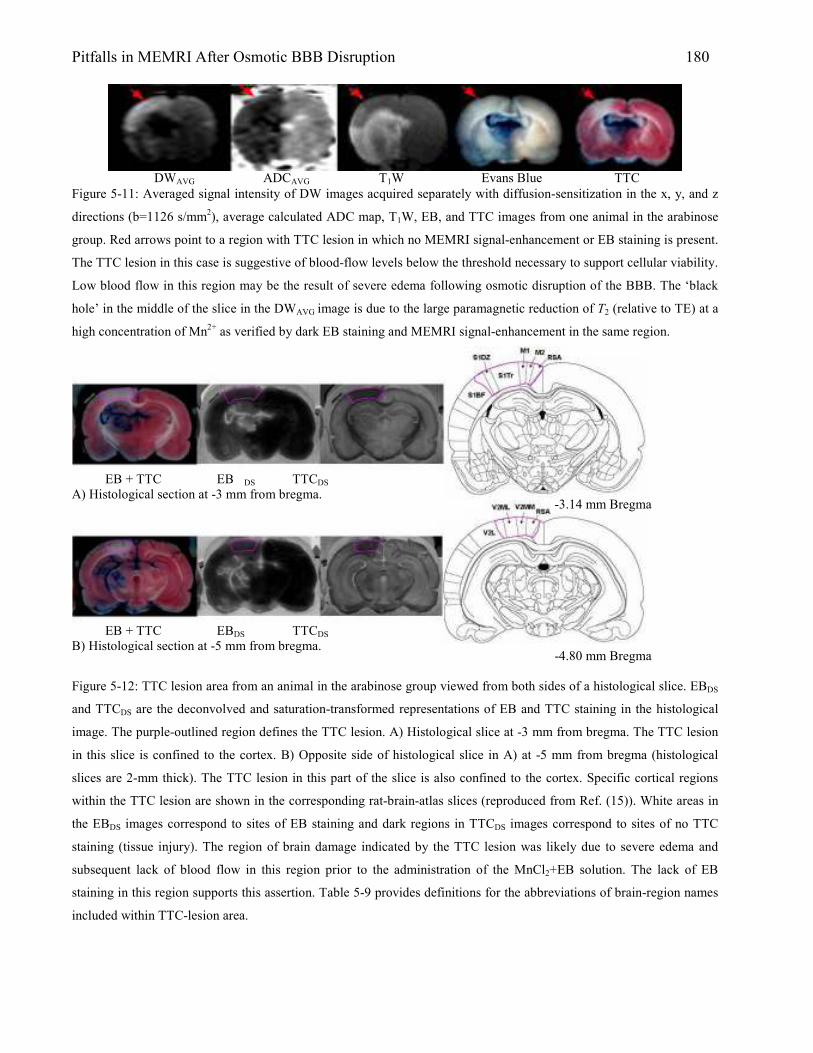
Pitfalls in MEMRI After Osmotic BBB Disruption 180
Figure 5-11: Averaged signal intensity of DW images acquired separately with diffusion-sensitization in the x, y, and z
directions (b=1126 s/mm2), average calculated ADC map, T1W, EB, and TTC images from one animal in the arabinose
group. Red arrows point to a region with TTC lesion in which no MEMRI signal-enhancement or EB staining is present.
The TTC lesion in this case is suggestive of blood-flow levels below the threshold necessary to support cellular viability.
Low blood flow in this region may be the result of severe edema following osmotic disruption of the BBB. The ‘black
hole’ in the middle of the slice in the DWAVG image is due to the large paramagnetic reduction of T2 (relative to TE) at a
high concentration of Mn2+ as verified by dark EB staining and MEMRI signal-enhancement in the same region.
Figure 5-12: TTC lesion area from an animal in the arabinose group viewed from both sides of a histological slice. EBDS
and TTCDS are the deconvolved and saturation-transformed representations of EB and TTC staining in the histological
image. The purple-outlined region defines the TTC lesion. A) Histological slice at -3 mm from bregma. The TTC lesion
in this slice is confined to the cortex. B) Opposite side of histological slice in A) at -5 mm from bregma (histological
slices are 2-mm thick). The TTC lesion in this part of the slice is also confined to the cortex. Specific cortical regions
within the TTC lesion are shown in the corresponding rat-brain-atlas slices (reproduced from Ref. (15)). White areas in
the EBDS images correspond to sites of EB staining and dark regions in TTCDS images correspond to sites of no TTC
staining (tissue injury). The region of brain damage indicated by the TTC lesion was likely due to severe edema and
subsequent lack of blood flow in this region prior to the administration of the MnCl2+EB solution. The lack of EB
staining in this region supports this assertion. Table 5-9 provides definitions for the abbreviations of brain-region names
included within TTC-lesion area.
DWAVG ADCAVG T1W Evans Blue TTC
-3.14 mm Bregma
-4.80 mm Bregma
EB + TTC EB DS TTCDS
A) Histological section at -3 mm from bregma.
EB + TTC EBDS TTCDS
B) Histological section at -5 mm from bregma.

Pitfalls in MEMRI After Osmotic BBB Disruption 181 Table 5-9: Brain-Region Abbreviations and Corresponding Names from Rat Brain Atlas in Figure 5-12.
-3.14 mm Bregma -4.80 mm Bregma
Abbreviation Name Abbreviation Name
RSA
M2
M1
S1Tr
S1DZ
S1BF
Retrosplenial agranular cortex
Secondary motor cortex
Primary motor cortex
Primary somatosensory cortex,
trunk region
Primary somatosensory cortex,
dysgranular region
Primary somatosensory cortex,
barrel field
RSA
V2MM
V2ML
V2L
Retrosplenial agranular cortex
Secondary visual cortex,
mediomedial area
Secondary visual cortex,
mediolateral area
Secondary visual cortex, lateral area
Quantitative Summary of TTC-Lesion Area
Table 5-10 summarizes the average percent-TTC-lesion area for different brain regions
before and after edema correction in the arabinose and mannitol groups.
Table 5-10: Average Percent Area of TTC Lesion Area (% relative to total brain area) from TTC Histological Images for
all Brain Regions with TTC Lesion Following Osmotic BBB Disruption and Infusion of the MnCl2+ EB Solution.
Average Percent-Area of TTC Lesion in All Brain Regions (using Eq. 5.3)
TTC Lesion Region Determined By Visualization Group Before Edema
Correction
After Edema
Correction
Arabinose
Mannitol
Mean ± SEM (%)
8 ± 1
11 ± 6
ISSDa
(%)
3
3
Mean ± SEM (%)
7 ± 1
9 ± 5
ISSDa
(%)
3 2
aTo account for intra-animal variability, the inter-slice standard deviation (ISSD) was calculated from values for the
average lesion area (%) across slices with TTC lesion.
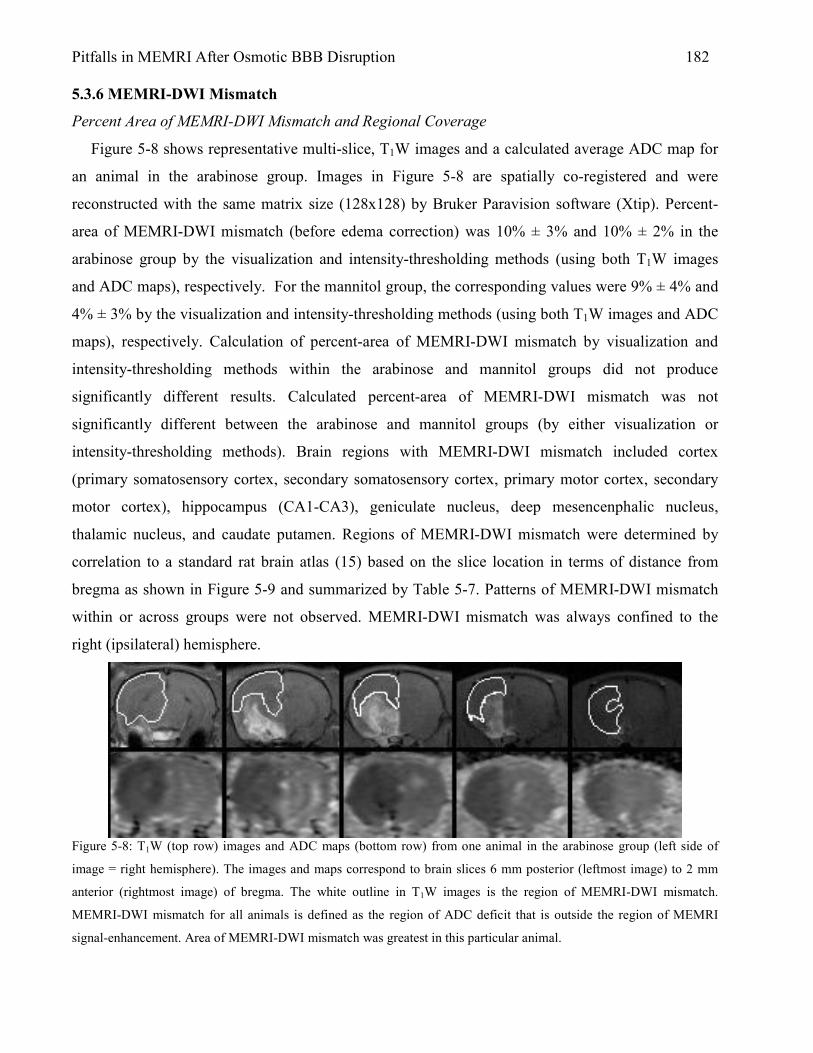
Pitfalls in MEMRI After Osmotic BBB Disruption 182 5.3.6 MEMRI-DWI Mismatch
Percent Area of MEMRI-DWI Mismatch and Regional Coverage
Figure 5-8 shows representative multi-slice, T1W images and a calculated average ADC map for
an animal in the arabinose group. Images in Figure 5-8 are spatially co-registered and were
reconstructed with the same matrix size (128x128) by Bruker Paravision software (Xtip). Percent-
area of MEMRI-DWI mismatch (before edema correction) was 10% ± 3% and 10% ± 2% in the
arabinose group by the visualization and intensity-thresholding methods (using both T1W images
and ADC maps), respectively. For the mannitol group, the corresponding values were 9% ± 4% and
4% ± 3% by the visualization and intensity-thresholding methods (using both T1W images and ADC
maps), respectively. Calculation of percent-area of MEMRI-DWI mismatch by visualization and
intensity-thresholding methods within the arabinose and mannitol groups did not produce
significantly different results. Calculated percent-area of MEMRI-DWI mismatch was not
significantly different between the arabinose and mannitol groups (by either visualization or
intensity-thresholding methods). Brain regions with MEMRI-DWI mismatch included cortex
(primary somatosensory cortex, secondary somatosensory cortex, primary motor cortex, secondary
motor cortex), hippocampus (CA1-CA3), geniculate nucleus, deep mesencenphalic nucleus,
thalamic nucleus, and caudate putamen. Regions of MEMRI-DWI mismatch were determined by
correlation to a standard rat brain atlas (15) based on the slice location in terms of distance from
bregma as shown in Figure 5-9 and summarized by Table 5-7. Patterns of MEMRI-DWI mismatch
within or across groups were not observed. MEMRI-DWI mismatch was always confined to the
right (ipsilateral) hemisphere.
Figure 5-8: T1W (top row) images and ADC maps (bottom row) from one animal in the arabinose group (left side of
image = right hemisphere). The images and maps correspond to brain slices 6 mm posterior (leftmost image) to 2 mm
anterior (rightmost image) of bregma. The white outline in T1W images is the region of MEMRI-DWI mismatch.
MEMRI-DWI mismatch for all animals is defined as the region of ADC deficit that is outside the region of MEMRI
signal-enhancement. Area of MEMRI-DWI mismatch was greatest in this particular animal.

Pitfalls in MEMRI After Osmotic BBB Disruption 183
-5.2 mm Bregma
-5.8 mm Bregma
-6.8 mm Bregma
T1W MRI with MEMRI-DWI mismatch region (white outline). This T1W MR slice (2mm thick) includes MR signal from brain regions located -5 mm to -7 mm bregma.

Pitfalls in MEMRI After Osmotic BBB Disruption 184 Figure 5-9. Correlation of MEMRI-DWI mismatch region to a standard rat atlas (15). Abbreviations shown here are
expanded in Table 5-7.
Table 5-7. Names for Brain-Region Abbreviations in Figure 5-9. From Ref. (15) V2ML: Secondary visual cortex, mediolateral area V2L: Secondary visual cortex, lateral area PtA: Parietal association cortex AuD: Secondary auditory cortex, dorsal area Au1: Primary auditory cortex AuV: Secondary auditory cortex, ventral area TeA: Temporal association cortex CA1: field CA1 of hippocampus CA2: field CA2 of hippocampus CA3: field CA3 of hippocampus OT: Nucleus of the optic tract PPT: Posterior pretectal nucleus OPT: Olivary pretectal nucleus LPMC: Lateral posterior thalamic nucleus, mediocaudal part DLG: Dorsal lateral geniculate nucleus MGD: Medial geniculate nucleus, dorsal part MGV: Medial geniculate nucleus, ventral part APTD: Anterior pretectal nucleus, dorsal part APTV: Anterior pretectal nucleus, ventral part DpMe: Deep mesencenphalic nucleus McPC: Magnocellular nucleus of the posterior commissure PCom: Nucleus of the posterior commissure RSA: Retrosplenial agranular cortex RSGb: Retrosplenial granular b cortex RSGa: Retrosplenial granular a cortex V2MM: Secondary visual cortex, mediomedial area V1M: Primary visual cortex, monocular area V1B: Primary visual cortex, binocular area S: Subiculum PrS: Presubiculum PaS: Parasubiculum RRF: Retrorubral field DpWh: Deep white layer of the superior colliculus DpG: Deep gray layer of the superior colliculus InWh: Intermediate white layer of the superior colliculus InG: Intermediate gray layer of the superior colliculus Op: Optic nerve layer of the superior colliculus SuG: Superficial gray layer of the superior colliculus Post: Postsubiculum

Pitfalls in MEMRI After Osmotic BBB Disruption 185 Quantitative Summary of MEMRI-DWI Mismatch
Table 5-8 summarizes the average percent-area of MEMRI-DWI mismatch for different
brain regions before and after edema correction for the arabinose and mannitol groups.
Table 5-8: Average Percent-Area of MEMRI-DWI Mismatch (% relative to total brain area) from T1W Images and ADC
Maps for all Brain Regions with ADC Deficit Regions Outside of MEMRI Signal-Enhanced Regions Following Osmotic
BBB Disruption and Infusion of the MnCl2+ EB Solution.
Average Percent-Area of MEMRI-DWI Mismatch in All Brain Regions (using Eq. 5.7)
MEMRI-DWI Mismatch Regions Determined By Visualization Intensity-Thresholding Group
Before Edema
Correction
After Edema
Correction
Before Edema
Correction
After Edema
Correction
Arabinose
Mannitol
Mean ±
SEM (%)
10 ± 3
9 ± 4
ISSDa
(%)
4
4
Mean ±
SEM (%)
9 ± 3
8 ± 4
ISSDa
(%)
4
4
Mean ±
SEM (%)
10 ± 2
4 ± 3
ISSDa
(%)
4 4
Mean ±
SEM (%)
10 ± 2
4 ± 3
ISSDa
(%) 4 3
5.3.7 Correlation of MEMRI-DWI Mismatch to TTC Lesion Area
For certain animals, the region of MEMRI-DWI mismatch appears to be spatially correlated
with the corresponding region of infarction; as defined on the TTC histological sections. This
correlation is intuitive at first because a region with reduced ADC deficit – but lacking MEMRI
signal-enhancement and EB staining – may indeed be a brain region with severely impaired blood
flow and tissue damage that occurs prior to the administration of the MnCl2+EB solution (which is
not expected to reach areas with impaired blood flow). Regions of cellular swelling (cytotoxic
edema) and reduced blood flow are likely to appear hyperintense on DW images and dark on the
corresponding calculated ADC maps.
Most animals for which TTC staining was performed showed an observable spatial
correlation between MEMRI-DWI mismatch area and TTC lesion area; two such animals are shown
in Figure 5-13. It is clear, however, that there are slices that do not show a MEMRI-DWI mismatch
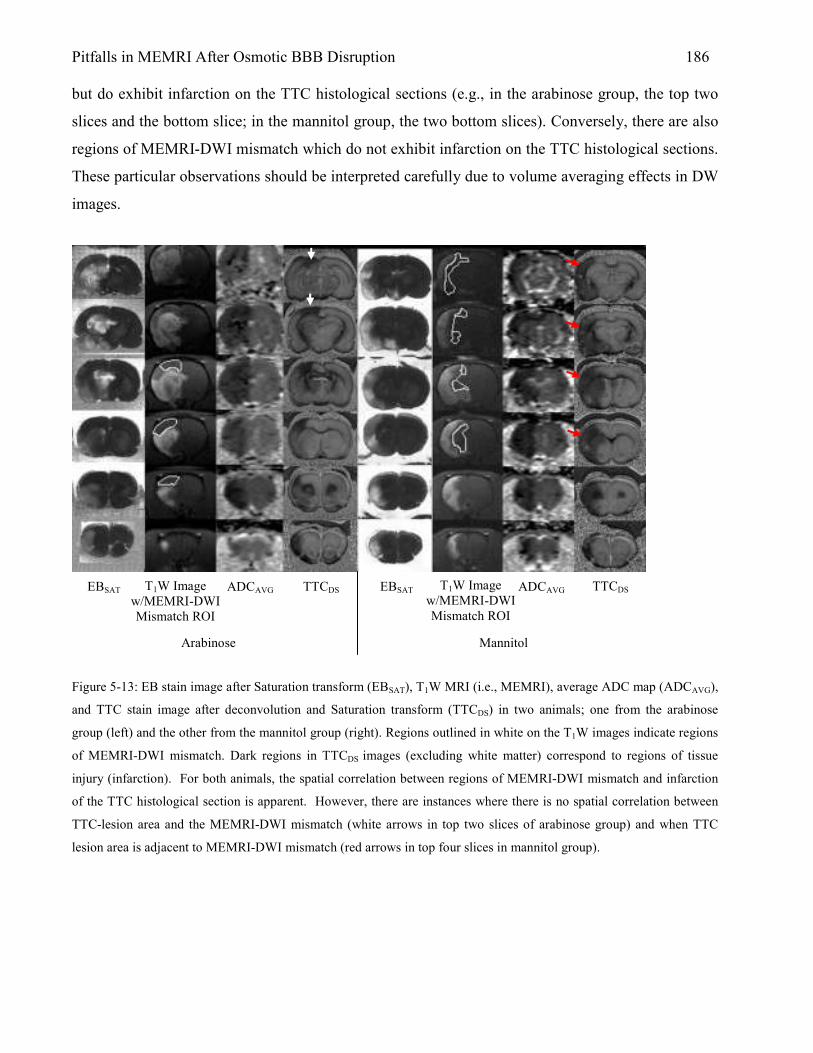
Pitfalls in MEMRI After Osmotic BBB Disruption 186 but do exhibit infarction on the TTC histological sections (e.g., in the arabinose group, the top two
slices and the bottom slice; in the mannitol group, the two bottom slices). Conversely, there are also
regions of MEMRI-DWI mismatch which do not exhibit infarction on the TTC histological sections.
These particular observations should be interpreted carefully due to volume averaging effects in DW
images.
Figure 5-13: EB stain image after Saturation transform (EBSAT), T1W MRI (i.e., MEMRI), average ADC map (ADCAVG),
and TTC stain image after deconvolution and Saturation transform (TTCDS) in two animals; one from the arabinose
group (left) and the other from the mannitol group (right). Regions outlined in white on the T1W images indicate regions
of MEMRI-DWI mismatch. Dark regions in TTCDS images (excluding white matter) correspond to regions of tissue
injury (infarction). For both animals, the spatial correlation between regions of MEMRI-DWI mismatch and infarction
of the TTC histological section is apparent. However, there are instances where there is no spatial correlation between
TTC-lesion area and the MEMRI-DWI mismatch (white arrows in top two slices of arabinose group) and when TTC
lesion area is adjacent to MEMRI-DWI mismatch (red arrows in top four slices in mannitol group).
T1W Image w/MEMRI-DWI Mismatch ROI
TTCDS TTCDS T1W Image w/MEMRI-DWI Mismatch ROI
Arabinose Mannitol
EBSAT EBSAT ADCAVG ADCAVG

Pitfalls in MEMRI After Osmotic BBB Disruption 187 5.4 Discussion The results of this study have shown that infusions of hyperosmolar mannitol or arabinose –
followed by i.v. MnCl2+EB in a spontaneously breathing rat anesthetized with isoflurane – lead to
brain edema, ADC deficit, nonspecific MEMRI signal-enhancement, and permanent brain damage in
the ipsilateral hemisphere. Previous MEMRI experiments in rats have indicated little or no MEMRI
signal-enhancement following osmotic BBB disruption and i.v. MnCl2 infusion (1,4,5). In these
studies, however, DWI was either not performed (1,4) or DWIs were acquired only after stroke (5).
In addition, there are no reports in the MEMRI literature that have examined brain-tissue status
following osmotic BBB disruption using histology. Therefore, although there is experimental
evidence showing that nonspecific MEMRI signal-enhancement is avoidable; it is not known if these
methods can prevent brain edema, tissue damage, and/or changes in brain ADC. In an attempt to
explain the results of this study, brain edema and its relationship to the water ADC, TTC staining,
and tissue damage is discussed. Furthermore, the implications of the MEMRI-DWI mismatch, in
absence of a specific neuronal stimulus or experimental stroke, is considered.
5.4.1 Nonspecific MEMRI Signal-Enhancement: Relation to Anesthesia and Blood Gases
One major difference between the experimental protocol used in this study and that of Aoki et al.
is the anesthetic regimen and the MnCl2+EB infusion protocol. Evans Blue is not biologically inert
(17) and has been shown to cause electrical and behavioral seizures in rats (18), but is not expected
to affect MEMRI signal-enhancement levels. In a previous study conducted by the authors (see
Chapter 4), a MEMRI experimental protocol identical to the protocol used in the present study
(arabinose group) was used with the exception that no EB was mixed with MnCl2. MEMRI signal-
enhancement was clearly present in the absence of EB, ruling out the dye as the primary factor in
nonspecific MEMRI signal-enhancement. The study of Aoki et al. used a range of anesthetics that
included diethyl ether, halothane and a 1:1 oxygen/nitrous oxide gas mixture, and pentobarbital; all
with the animal under artificial ventilation. The use of artificial ventilation allowed for blood
pressure, pH, PCO2, and PO2 to be held within the physiological range. By contrast, animals in the
present study were anesthetized with 2% isoflurane under spontaneously-breathing conditions. Even
without ventilation, blood pressure, PO2, and PCO2 was maintained within the optimal physiological
range. Table 5-13 summarizes pH, PO2, and PCO2 in animals from the Aoki et al. sham group and
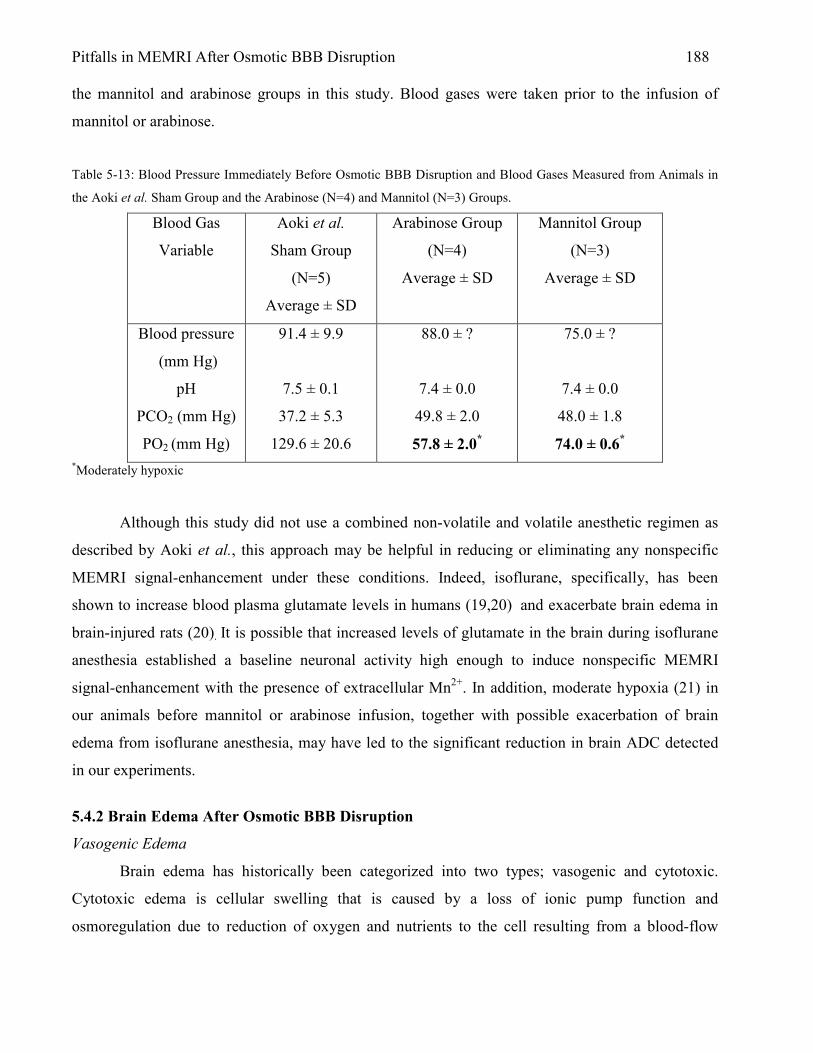
Pitfalls in MEMRI After Osmotic BBB Disruption 188 the mannitol and arabinose groups in this study. Blood gases were taken prior to the infusion of
mannitol or arabinose.
Table 5-13: Blood Pressure Immediately Before Osmotic BBB Disruption and Blood Gases Measured from Animals in
the Aoki et al. Sham Group and the Arabinose (N=4) and Mannitol (N=3) Groups.
Blood Gas
Variable
Aoki et al.
Sham Group
(N=5)
Average ± SD
Arabinose Group
(N=4)
Average ± SD
Mannitol Group
(N=3)
Average ± SD
Blood pressure
(mm Hg)
pH
PCO2 (mm Hg)
PO2 (mm Hg)
91.4 ± 9.9
7.5 ± 0.1
37.2 ± 5.3
129.6 ± 20.6
88.0 ± ?
7.4 ± 0.0
49.8 ± 2.0
57.8 ± 2.0*
75.0 ± ?
7.4 ± 0.0
48.0 ± 1.8
74.0 ± 0.6*
*Moderately hypoxic
Although this study did not use a combined non-volatile and volatile anesthetic regimen as
described by Aoki et al., this approach may be helpful in reducing or eliminating any nonspecific
MEMRI signal-enhancement under these conditions. Indeed, isoflurane, specifically, has been
shown to increase blood plasma glutamate levels in humans (19,20) and exacerbate brain edema in
brain-injured rats (20). It is possible that increased levels of glutamate in the brain during isoflurane
anesthesia established a baseline neuronal activity high enough to induce nonspecific MEMRI
signal-enhancement with the presence of extracellular Mn2+. In addition, moderate hypoxia (21) in
our animals before mannitol or arabinose infusion, together with possible exacerbation of brain
edema from isoflurane anesthesia, may have led to the significant reduction in brain ADC detected
in our experiments.
5.4.2 Brain Edema After Osmotic BBB Disruption
Vasogenic Edema
Brain edema has historically been categorized into two types; vasogenic and cytotoxic.
Cytotoxic edema is cellular swelling that is caused by a loss of ionic pump function and
osmoregulation due to reduction of oxygen and nutrients to the cell resulting from a blood-flow
Pitfalls in MEMRI After Osmotic BBB Disruption 189 deficit or cessation. Vasogenic edema is characterized by damage to the BBB resulting in bulk flow
of water from the vasculature to brain. Endothelial cell shrinkage by hyperosmolar agents – such as
mannitol and arabinose – increases the permeability of the BBB to molecules with higher molecular
weights, such as [14C]Sucrose (MW = 340 daltons) and [3H]Inulin (MW = 5500); implying bulk
flow of these molecules from blood to brain (22). Using an osmotic-BBB-disruption protocol similar
to that used in this study, Rapoport et al. found the arabinose-infused cerebral hemisphere to be
edematous within 10-minutes after BBB disruption (7). Other studies report consistent vasogenic
edema in the side of the brain that received the infusion of hyperosmolar mannitol (23,24).
Vasogenic edema, however, has been suggested to play only a minor role in brain tissue injury as
compared to cytotoxic edema (25).
Vasogenic Edema and DW Imaging
Vasogenic edema has been shown to increase the calculated ADC values on DW images. In a
study specifically designed to determine the effect of vasogenic edema on ADC values, Ito et al.
showed that vasogenic edema (by infusion of mock CSF into rat brain) results in an increase in ADC
value while cytotoxic edema (by middle cerebral artery occlusion in rat) results in a decrease in
ADC value in the affected regions (25). Although vasogenic edema may have been present within
animals prior to acquiring the initial DWIs in this study, the observed ADC deficits (up to 34%) and
the absence of ADC increases in any of the study animals suggests that vasogenic edema does not
have a significant effect on the acute ADC changes observed in either animal group. However, since
gross brain edema was clearly present following acute osmotic BBB disruption (Fig. 5-5), the BBB-
disruption process itself appears to initiate vasogenic brain edema similar to that observed following
the loss of BBB integrity that would result, for example, from ischemic damage to the
cerebrovascular endothelium (except on a much shorter time scale).
Cytotoxic Edema and Percent ADC Deficit
Using cortical tissue-impedance measurements, cytotoxic edema has been shown to
accompany early (one minute after middle cerebral artery occlusion in the brain) ischemia-induced
changes in the volume of the brain extracellular space (26). The water ADC values in regions with
cytotoxic edema were previously shown to be reduced by ~37% as compared to contralateral
hemisphere at 1 hour after the onset of focal cerebral ischemia (27). Interestingly, the percent-
reductions in water ADC values measured in this study (22% to 34%) are similar to those that
Pitfalls in MEMRI After Osmotic BBB Disruption 190 accompany acute cerebral ischemia; suggesting that a process similar to cytotoxic edema may be
responsible for the ADC reductions observed following osmotic BBB disruption in the brain.
5.4.3 Is MEMRI Signal-Enhancement Indicative of Tissue Damage?
Aoki et al. asserted that the irreversibly-damaged stroke core following MCAO could be
visualized as the region of MEMRI signal-enhancement contained within the region of ADC deficit.
However, the experimental protocol used in this study also demonstrates similar regions of MEMRI
signal-enhancement within the region of reduced ADC; even though neither animal group was
subjected to a cerebral ischemic insult. The water ADC changes observed in this study identify
brain regions where cell-volume changes or other injury result in alterations of the
intracellular/extracellular tissue-water content. Since the mannitol BBB-disruption protocol and
MnCl2 infusion protocol used in this study were similar to those of the sham group of Aoki et al., the
results of the two studies might be expected to be similar. Table 5-11 summarizes results of
comparisons between the mannitol group in this study and the corresponding sham group of Aoki et
al. As shown in Table 5-11, ADC deficit area in our mannitol group is comparable to that in Aoki’s
sham group. However, ADC deficit area in our arabinose group shows a large difference (that would
likely be statistically significant) from the ADC deficit area in the sham group of Aoki et al. These
differences may be the result of a different anesthetic regimen used in our study. Other conditions
such as severity of BBB disruption and cytotoxic edema in our experiments may also have been
responsible for the differences in ADC deficit and MEMRI signal-enhancement between our animal
groups and Aoki’s sham group.

Pitfalls in MEMRI After Osmotic BBB Disruption 191
Table 5-11: Comparison of Mannitol and Arabinose Group Data for Percent-Area of ADC Deficit and MEMRI Signal-
Enhancement in Rat Brain After Osmotic BBB Disruption with the Results of Aoki et al. (5).
Group
Percent-Area
Measurement
Aoki et al.
Sham*
(N=5)
Present Study:
Mannitol*
(intensity-
thresholding
before EC,
N=4)
Present Study:
Arabinose
(intensity-
thresholding
before EC, N=10)
ADC Deficit
MEMRI Signal-
Enhancement
TTC Lesion
Mean ± SD (%)
8 ± 4
5 ± 3 ?
Mean ± SD (%)
8 ± 7
16 ± 9
11 ± 11
Mean ± SD (%)
19 ± 4
21 ± 6
8 ± 2
* Aoki et al. (5) sham and mannitol groups listed in the table received the same concentration (1.4M) and dose (5 ml/kg)
of mannitol administered at the same rate (50 ml/hr) and via the same intravenous route (ICA). The region of ADC
deficit in the sham group of Aoki et al. was determined by thresholding the ADC map pixels at 5.0 x 10⁻⁴ mm2/s (i.e.,
ADC pixel values less than this threshold were included in the calculation of the ischemic lesion area). The region of
ADC deficit in the mannitol and arabinose groups was determined by thresholding the ADC map pixels at 2 SDs below
the mean of all ADC pixel-values in the contralateral hemisphere.
5.4.4 Brain Damage Verified by TTC Lesion
TTC Lesion Indicates Damage to Brain Tissue
The use of TTC staining for the detection of ischemic brain damage was first reported by
Bederson et al. in 1986 (14). Bederson et al. compared the use of TTC to that of the conventional
hematoxylin and eosin (H&E) staining technique for the evaluation of ischemic brain damage after
24 h in the rat. Although TTC staining clearly demarcates region of brain infarction at 24 h after
ischemia, Bederson et al. notes difficulty in correlating ischemic regions defined by TTC staining to

Pitfalls in MEMRI After Osmotic BBB Disruption 192 those delineated by H&E staining at times less than 6 h after the onset of ischemia. However,
because many animals from both groups displayed an absence of TTC staining that was spatially
correlated to regions of severe ADC deficit in certain brain regions we believe that our TTC stain
data (acquired 4 hours after osmotic BBB disruption) provides reliable evidence of brain damage.
5.4.5 MEMRI-DWI Mismatch
Comparison of ADC Deficit Calculation: Aoki et al. Study vs. Present Study
In a study to determine the efficacy of MEMRI for the evaluation of experimental stroke in
rats, Aoki et al. found that MEMRI signal-enhanced regions in the ischemic brain were smaller than
regions of ADC deficit. As a result of this observation, Aoki et al. coined the term ‘MEMRI-DWI
mismatch’ (5) and suggested that the region of MEMRI signal-enhancement was restricted to (and
indicative of) the irreversibly-damaged, ischemic core of the lesion.
As indicated in Table 5-11, the percent-area of ADC deficit in the sham group of Aoki et al.
is similar to that of the mannitol group in this study. However, this result must be interpreted with
some caution since the methods for calculating percent-area of ADC deficit were different in each
case. For the sham group in the study of Aoki et al., the ADC deficit was determined by using a
fixed threshold (5.0 x 10⁻⁴ mm2/s) to identify pixels in the calculated ADC map that should be
included as part of the ischemic lesion in the ipsilateral cortex. For the mannitol group in the present
study, the region of ADC deficit was determined as those pixels in the ipsilateral hemisphere of the
calculated ADC map that were 2 SDs below the mean of all ADC pixel-values in the contralateral
hemisphere.
MEMRI-DWI Mismatch: TTC-Lesion Area, ADC-Deficit Area, and Area of MEMRI Signal-
Enhancement
In this study, the MEMRI-DWI-mismatch region was defined as the region of ADC deficit
that resides outside the boundary of the region of MEMRI signal-enhancement. Brain regions with
reduced ADC, but that do not demonstrate MEMRI signal-enhancement or EB staining, are likely
regions that experienced cytotoxic edema as a result of a cerebral-blood-flow deficit following
mannitol (or arabinose) infusion. Regional patterns of EB staining, TTC staining, and MEMRI
signal-enhancement (Fig. 5-13, arabinose group) indicate that the MnCl2+EB solution did not
permeate the BBB within regions that progressed to infarction (as defined by TTC staining) in those
particular cases.

Pitfalls in MEMRI After Osmotic BBB Disruption 193
In contrast to the example in the previous paragraph, there were many instances in this study
where the region of MEMRI signal-enhancement and EB staining were contained within the
infracted region as defined by TTC staining and reduced ADC (e.g., Fig. 5-13, mannitol group). In
this case, reduced water ADC within the regions of BBB disruption suggests a condition that mimics
cytotoxic edema. For example, osmotic BBB disruption may induce cell-volume changes similar to
those observed during cytotoxic edema (i.e., cell swelling due to acute membrane depolarization),
but via a different mechanism. These osmotically-induced cell-volume changes may be related to the
uptake of Mn2+ into cells; assuming that the extracellular Mn2+ is present during that process. In this
case, extracellular Mn2+ could be transported into the cell along with water that is moving under the
influence of an osmotic gradient. Once inside the cell, Mn2+ would reduce the T1 relaxation time of
the intracellular water, in the same manner that Mn2+ would do so had it entered the cell via voltage-
gated calcium channels (VGCCs) following a specific neuronal stimulus. However, in this case,
Mn2+ enters the cell as a result of osmotic water shifts that accompany BBB disruption, rather than
via water shifts that accompany cell-membrane depolarization. The idea of Mn2+ entry into cells via
osmotically-induced cell-volume changes is supported by reports of cellular volume regulation
during exposure to hypertonic solutions (28,29). In one such report, McManus et al. used laser light
scattering to monitor Rat C6 glioma cells in culture during exposure to hypertonic mannitol (30). In
their study, McManus et al. show rapid cell shrinkage upon abrupt exposure to mannitol (+70 mOsm
and +40 mOsm in separate experiments). After a brief lag time, cell volume was observed to return
to baseline and proceeded to increase to a swollen state for the duration of a 30-minute observation
period. Data from McManus et al. is shown in Figure 5-14. Based on the data in Figure 5-14, cell
shrinkage and swelling are apparent for at least 5 minutes following exposure to hypertonic
mannitol. If these in vitro conditions are close indicators of potential in vivo cell response to
hyperosmolar mannitol (or arabinose) during osmotic BBB disruption, changes in ADC (ADC
decrease due to cell swelling and loss of extracellular space) and entry of Mn2+ into cells is expected.

Pitfalls in MEMRI After Osmotic BBB Disruption 194
Figure 5-15: A representative recording of the volume behavior of C6 cells exposed to +40 mOsm hypertonic mannitol.
Reproduced from Ref. (30)
It is not clear at this point how the BBB-disruption process might contribute to the
irreversible tissue damage demonstrated on TTC (and indirectly on ADC). In this case, the
mechanism of cell death may or may not be related to blood-flow deficits in brain.
Mechanisms of MEMRI Signal-Enhancement; Nonspecific or Due to Anoxic Depolarizations?
In the study of Aoki et al., MEMRI signal-enhancement was suggested to result from anoxic
depolarization of brain cells following experimental stroke in the presence of extracellular
manganese. This suggestion was supported by data from sham animals, in which no stroke was
induced and very little MEMRI signal-enhancement was observed as compared to animals in the
experimental group.
The present study revealed significant MEMRI signal-enhancement without experimental
stroke. As with the ADC deficit, the mannitol group in the present study was expected to exhibit a
similar level of MEMRI signal-enhancement as compared to the sham group of Aoki et al., due to
the similarity of the experimental protocols between the two studies. Table 5-12 compares the
MEMRI signal-enhancement in the sham group of Aoki et al. and the mannitol and arabinose groups
in this study. Although it is clear the differences in MEMRI signal-enhancement between the two
studies are statistically significant, the differences in the Bo-field strength (and other experimental
details) between the two studies make it difficult to interpret the significance of this result.

Pitfalls in MEMRI After Osmotic BBB Disruption 195
Since experimental stroke was not induced in the present study, questions remain as to the
underlying mechanism responsible for the MEMRI signal-enhancement observed in the mannitol
and arabinose groups. It is important to consider that TTC lesion area was not always correlated to
regions with MEMRI signal-enhancement. Therefore, MEMRI signal-enhancement, even when
correlated to regions of ADC deficit, may not indicate regions of tissue damage. MEMRI signal-
enhancement may indeed be due to low levels of anesthesia or to an undetermined mechanism
following osmotic BBB disruption that results in sequestration of Mn2+ by brain cells (glia or
astrocytes) and endothelial cells of the BBB (e.g., the scenario described in the previous section).
Table 5-12: Comparison of Aoki et al. Sham, and Mannitol and Arabinose Group Data for % MEMRI Signal-
Enhancement in Rat Brain After Osmotic BBB Disruption.
Group
Aoki
Sham*
(N=5)
Aoki
Experimental
(stroke group)
(N=5)
Present Study
Mannitol*
(intensity-
thresholding
before EC, N=4)
Present Study
Arabinose
(intensity-
thresholding
before EC, N=10)
Average
Percent:
MEMRI
Signal-
Enhancement
Mean ± SD (%)
8.4 ± 1.32
Mean ± SD (%)
71.0 ± 17.5
Mean ± SD (%)
91 ± 13
Mean ± SD (%)
88 ± 20
* Aoki et al. sham and the mannitol group in the present study depicted in the table received the same concentration
(1.4M) and dose (5 ml/kg) of mannitol at the same rate (50 ml/hr) and by the same intravenous route (ICA). The MEMRI
signal-enhanced region in the Aoki et al. sham group and the mannitol and arabinose groups was defined as those pixels
in the T1W images with signal intensities that exceeded the mean +2SDs in the contralateral hemisphere. Clearly, the
level of MEMRI signal-enhancement in our mannitol (and arabinose) group is significantly different from MEMRI
signal-enhancement in Aoki’s sham group (but not Aoki’s stroke group).
It has been widely reported that Mn2+ is a calcium analog and acts similarly to Ca2+ in
biological systems (1,31,32). Anoxic depolarizations open Ca2+ channels and is expected to enhance
Mn2+ accumulation in cells with the presence of extracellular Mn2+ (5). However, since Aoki et al.

Pitfalls in MEMRI After Osmotic BBB Disruption 196 did not provide histological confirmation of tissue damage following anoxic depolarizations, or DC
potential measurements during anoxic depolarizations, the notion that anoxic depolarization
accounts for all of the observed MEMRI signal-enhancement in their study is somewhat speculative.
Nonspecific MEMRI signal-enhancement has been reported due to a low level of anesthesia (1,33),
local to regions with brain edema (33), and following osmotic BBB disruption with the presence of
extracellular Mn2+ (34). Although the data of Aoki et al. is not supported by histology or DC
potential measurements, they do report a relatively low level of MEMRI signal-enhancement in their
sham animals (i.e., nonspecific MEMRI signal-enhancement). In this case, the low levels of
nonspecific MEMRI signal-enhancement may be a result of the anesthetic regimen used.
Conclusions
Tissue damage by focal edema (8), microvascular pathology (35), and pyknotic neurons (36)
is, among others, of major concern when using hyperosmolar agents to disrupt the BBB to allow
passage of Mn2+ (or other substances) from blood to brain. For MEMRI experiments that rely on
specific neuronal stimulus to stimulate brain cells and sequester extracellular Mn2+ via voltage-gated
calcium channels, tissue damage by osmotic BBB disruption must be minimized or prevented
altogether. An optimal osmotic BBB disruption protocol has yet to be determined for MEMRI
experiments that rely on a homogeneous distribution of Mn2+ to the brain parenchyma prior to
specific neuronal stimulus. The results of these studies suggest careful study of brain structure and
function following infusions of hyperosmolar agents for osmotic BBB disruption and delivery of
Mn2+ to the brain parenchyma.
Additionally, in future studies that use a combined MnCl2+EB solution, acquisition of the
electroencephalogram (EEG) signal would be helpful to determine if EB dye has any potential side
effects on brain function. Perhaps more importantly, the EEG could also provide a measure of the
anesthetic state of the animal, which could then be correlated to any existing nonspecific MEMRI
signal-enhancement, in an attempt to rule out anesthesia as a source of unwanted uptake of Mn2+ into
active brain cells.
Based on ADC deficit area calculations, arabinose may inflict a larger region of edema when
infused at 1.6M for 55 seconds as compared to an infusion of 1.4 M mannitol at 50 ml/hr. This point
again stresses the need to find an optimal osmotic BBB disruption protocol for MEMRI studies.
Because MnCl2+EB solution does not always reach regions that have ADC deficit, as indicated by a
correlation between regions without MEMRI signal-enhancement (or EB staining) and regions with

Pitfalls in MEMRI After Osmotic BBB Disruption 197 TTC lesion, the lack of MEMRI signal-enhancement in particular regions may be difficult to
interpret unambiguously when histological confirmation of BBB disruption is not available.
Acknowledgements
The authors thank James Bouley for helpful assistance with surgical procedures and TTC staining.
REFERENCES 1. Lin Y.J., Koretsky A.P. Manganese ion enhances T1-weighted MRI during brain activation:
an approach to direct imaging of brain function. Magn Reson Med 1997;38:378-388. 2. Duong T.Q., Silva A.C., Lee S.P., Kim S.G. Functional MRI of calcium-dependent synaptic
activity: cross-correlation with CBF and BOLD measurements. Magn Reson Med 2000;43:383-392.
3. Aoki I., Wu Y.J., Silva A.C., Lynch R.M., Koretsky A.P. In vivo detection of neuroarchitecture in the rodent brain using manganese-enhanced MRI. Neuroimage 2004;22:1046-1059.
4. Henning E.C. , Meng X. , Fisher M. , Sotak C. Visualization of Cortical Spreading Depression Using Manganese-Enhanced MRI. Magn Reson Med 2005;53:851-857.
5. Aoki I., Ebisu T., Tanaka C., Katsuta K., Fujikawa A., Umeda M., Fukunaga M., Takegami T., Shapiro E.M., Naruse S. Detection of the anoxic depolarization of focal ischemia using manganese-enhanced MRI. Magn Reson Med 2003;50:7-12.
6. Ke F., Yingxia L., Hua L., Weijing L., Hao L. Tracing neuronal tracts in the olfactory pathway of rat and detecting ischemic core in a rat model of focal ischemia using manganese-enhanced magnetic resonance imaging. Chinese Sci Bull 2004;49:1834-1840.
7. Rapoport S.I., Fredericks W.R., Ohno K., Pettigrew K.D. Quantitative aspects of reversible osmotic opening of the blood-brain barrier. Am J Physiol 1980;238:R421-R431.
8. Suzuki M., Iwasaki Y., Yamamoto T., Konno H., Kudo H. Sequelae of the osmotic blood-brain barrier opening in rats. J Neurosurg 1988;69:421-428.
9. Nedergard M., Hansen A.J. Spreading depression is not associated with neuronal injury in the normal brain. Brain Res 1988;449:395-398.
10. Bonthius D.J., Steward O. Induction of cortical spreading depression with potassium chloride upregulates levels of messenger RNA for glial fibrillary acidic protein in cortex and hippocampus: inhibition by MK-801. Brain Res 1993;618:83-94.
11. Salahuddin T. S., Johansson B. B., Kalimo H., Olsson Y. Structural changes in the rat brain after carotid infusions of hyperosmolar solutions. An electron microscopic study. Acta Neuropathol (Berl) 1988;77:5-13.
12. Aoki I., Naruse S., Tanaka C. Manganese-enhanced magnetic resonance imaging (MEMRI) of brain activity and applications to early detection of brain ischemia. NMR Biomed 2004;17:569-580.
13. Horobin R.W., Kiernan J.A. Conn's Biological Stains. Oxford: BIOS Scientific Publishers Ltd; 2002.
14. Bederson J.B., Pitts L.H., Germano S.M., Nishimura M.C., Davis R.L., Bartkowski H.M. Evaluation of 2,3,5-Triphenyltetrazolium Chloride as a Stain for Detection and Quantification of Experimental Cerebral Infarction in Rats. Stroke 1986;17:1304-1308.
Pitfalls in MEMRI After Osmotic BBB Disruption 198 15. Paxinos G., Watson C. The Rat Brain in Stereotaxic Coordinates. Orlando: Academic Press;
1986. 16. Ruifrok A.C., Johnston D.A. Quantification of Histological Staining by Color
Deconvolution. Analyt Quant Cytol Histol 2001;23:291-299. 17. LeBmann V., Gottmann K., Lux H.D. Evans blue reduces macroscopic desensitization of
non-NMDA receptor mediated currents and prolongs excitatory postsynaptic currents in cultured rat thalamic neurons. Neurosci Lett 1992;146:13-16.
18. Durmuller N., Graham J.L., Sowinski P., Meldrum B.S. The vital dye Evans blue mimics limbic seizures induced by kainate or pilocarpine. Brain Res 1997;753:283-290.
19. Stover J.F., Kempski O.S. Anesthesia increases circulating glutamate in neurosurgical patients. Acta Neurochir (Wien) 2005;147:847-853.
20. Stover J.F., Kroppenstedt S.N., Thomale U.W., Kempski O.S., Unterberg A.W. Isoflurane double plasma glutamate and increases posttraumatic brain edema. Acta Neurochir Suppl 2000;76:375-378.
21. Meyer B., Schultheiss R., Schramm J. Capillary oxygen saturation and tissue oxygen pressure in the rat cortex at different stages of hypoxic hypoxia. Neurol Res 2000;22:721-726.
22. Ziylan Y.Z., Robinson P.J., Rapoport S.I. Differential Blood-Brain Permeabilities to [14C]Sucrose and [3H]Inulin after Osmotic Opening in the Rat. Exp Neurol 1983;79:845-857.
23. Cosolo W.C., Martinello P., Louis W.J., N. Christophidis. Blood-brain barrier disruption using mannitol: time course and electron microscopy studies. Am J Physiol 1989R443-R448.
24. Brown R.C., Egleton R.D., Davis T.P. Mannitol opening of the blood-brain barrier: regional variation in the permeability of sucrose, but not 86Rb+ or albumin. Brain Res 2004;1014:221-227.
25. Ito J., Marmarou A., Barzo P., Fatouros P., Corwin F. Characterization of edema by diffusion-weighted imaging in experimental traumatic brain injury. J Neurosurg 1996;84:97-103.
26. Schuier F.J., Hossmann K.-A. Experimental Brain Infarcts in Cats II. Ischemic Brain Edema. Stroke 1980;11:593-601.
27. Perez-Trepichio A.D., Xue M., Ng T.C., Majors A.W., Furlan A.J., Awad I.A., Jones S.C. Sensitivity of Magnetic Resonance Diffusion-Weighted Imaging and Regional Relationship Between the Apparent Diffusion Coefficient and Cerebral Blood Flow in Rat Focal Cerebral Ischemia. Stroke 1995;26:667-675.
28. Kempski O., Chaussy L., Gross U., Zimmer M., Baethmann A. Volume regulation and metabolism of suspended C6 glioma cells: an in vitro model to study cytotoxic brain edema. Brain Res 1983;279:217-228.
29. McManus M. L., Strange K. Acute volume regulation of brain cells in response to hypertonic challenge. Anesthesiology 1993;78:1132-1137.
30. McManus M. L., Soriano S. G. Rebound swelling of astroglial cells exposed to hypertonic mannitol. Anesthesiology 1998;88:1586-1591.
31. Gavin CE Gunter KK, Gunter TE. Manganese and calcium efflux kinetics in brain mitochondria. Biochem J 1990;266:329-334.
32. Gavin CE Gunter KK, Gunter TE. Manganese and calcium transport in mitochondria: implications for manganese toxicity. Neurotoxicology 1999;20:445-454.
33. Aoki I., Naruse S., Tanaka C. Manganese-enhanced magnetic resonance imaging (MEMRI) of brain activity and applications to early detection of brain ischemia. NMR In Biomed 2004;17:569-580.

Pitfalls in MEMRI After Osmotic BBB Disruption 199 34. Morita H., Ogino T., Seo Y., Fujiki N., Tanaka K., Takamata A., Nakamura S., Murakami M.
Detection of hypothalamic activation by manganese ion contrasted T1-weighted magnetic resonance imaging in rats. Neurosci Lett 2002;326:101-104.
35. Lossinsky A.S., Vorbrodt A.W., Wisniewski H.M. Scanning and transmission electron microscopic studies of microvascular pathology in the osmotically impaired blood-brain barrier. J Neurocytol 1995;24:795-806.
36. Salahuddin T.S., Johansson B.B., Kalimo H., Olsson Y. Structural changes in the rat brain after carotid infusions of hyperosmolar solutions. Acta Neuropathol 1988;77:5-13.

CHAPTER 6
Blood-Brain Barrier Disruption in Embolic Stroke
Detected by Manganese-Enhanced Magnetic
Resonance Imaging (MEMRI)
Introduction Stroke Background Stroke and the BBB
The Embolic Stroke Model and Associated BBB Injury Intracellular Calcium Level Increase During Stroke – Implications for MEMRI
Methods Animal Preparation
Embolic Middle Cerebral Artery Occlusion (eMCAO) MR Imaging
MnCl2 + Evans Blue Infusion Protocol EB and 2,3,5 TriphenylTetrazolium Chloride (TTC) Histology
Data Analysis
Results MEMRI Enhancement
ADC Deficit MEMRI-DWI Mismatch & Match
MEMRI Signal-Enhancement and ADC Correlation With Evans Blue and TTC Histology
Discussion MEMRI Signal-Enhancement: Detection of Hemorrhagic Transformation During Acute Stages of Embolic
Stroke? MEMRI Signal-Enhancement in Stroke: Mechanisms Related to Cell Calcium Uptake

BBB Disruption in Embolic Stroke Detected by MEMRI 200
Blood-Brain Barrier Disruption in Embolic Stroke
Detected by Manganese-Enhanced Magnetic
Resonance Imaging (MEMRI)
David G. Bennett1, James Bouley3, Nils Henninger3, Marc Fisher3,4, Christopher H. Sotak1,2,4
Departments of Biomedical Engineering1 and Chemistry & Biochemistry2
Worcester Polytechnic Institute
Worcester, Massachusetts 01609
Department of Neurology3
University of Massachusetts Memorial Healthcare – Memorial Campus
Worcester, Massachusetts 01605
Department of Radiology4
University of Massachusetts Medical School
Worcester, Massachusetts 01605
Manuscript in Progress

BBB Disruption in Embolic Stroke Detected by MEMRI 201
Abstract
Manganese (Mn2+) has proven to be a useful MR contrast agent for functional imaging and
neuronal tract tracing. The paramagnetic properties of Mn2+ provide local contrast on T1-weighted
(T1W) MRI after cellular sequestration via voltage-gated calcium channels. Researchers have used
the MRI contrast agent Gd-DTPA to show T1-contrast in MR images near regions of blood-brain
barrier (BBB) disruption after stroke. Gd-DTPA is an extracellular MRI contrast agent and,
therefore, is not expected to provide information regarding the state of cells local to a stroke-related
BBB injury. The results of this study show BBB injury after ischemic insult allows simultaneous
passage of Mn2+ and Evans Blue (EB) dye into the brain parenchyma, resulting in localized T1W-
MRI-signal increase (MEMRI signal-enhancement). MEMRI signal-enhancement in these
experiments corresponds to the degree of BBB disruption and is apparent in areas of tissue damage
as verified by 2,3,5-triphenyltetrazolium hydrochloride (TTC) staining and diffusion-weighted MRI
(DWI). These findings suggest that Mn2+, used in conjunction with a rat embolic stroke model, can
produce MEMRI signal-enhancement in areas peripheral to and/or in the stroke core with a
compromised BBB. MEMRI signal-enhancement using an embolic stroke model with Mn2+ as the
MRI contrast agent can show regions of injured BBB and may provide insight into the state of brain
cells local to BBB injury. This method may prove useful for future studies using MEMRI to monitor
brain response to ischemia.
Key words: manganese-enhanced MRI, blood-brain barrier, stroke, rat brain

BBB Disruption in Embolic Stroke Detected by MEMRI 202
6.1 Introduction
In Chapter 4 it was suggested that neuronal damage in the brain following osmotic blood-
brain barrier (BBB) disruption was primarily responsible for uptake of manganese (Mn2+) in brain
cells, resulting in so-called nonspecific MEMRI signal- enhancement. In Chapter 5 it was suggested
that cell-volume regulatory mechanisms following osmotic BBB disruption may also play a role in
the uptake of Mn2+ into the cell leading to nonspecific MEMRI signal-enhancement. These ideas are
in conflict with the generally accepted theory which suggests that MEMRI signal-enhancement in
the brain is a result of cell-membrane-depolarization-dependent mechanisms only (1-3). This chapter
builds upon the work presented in the previous two chapters by testing the hypothesis that MEMRI
can be used to monitor BBB disruption and neuronal injury following embolic stroke. This study is
designed to determine if Mn2+ can cross a pathologically-injured BBB and subsequently enter
stroke-injured brain cells; thus generating localized contrast on T1W MRI that is specific to stroke-
related BBB disruption and underlying neuronal injury.
Cell Volume Changes Following Stroke Detected by Diffusion-Weighted (DW) MRI (DWI)
As described in Chapter 1, DWI is sensitive to changes in the mobility of water protons that
accompanies cell-volume changes in the brain. Following an ischemic insult to the brain, the
depletion of cellular energy reserves (e.g., adenosine triphosphate – ATP) results in cell-membrane
depolarization (i.e., anoxic depolarization) and subsequent cellular swelling (cytotoxic edema).
These cell-volume changes restrict the translational motion of tissue water molecules relative to that
of normal tissue. The water molecules with reduced mobility are detected as a signal-intensity
increase on DWI; reflecting a decrease of the apparent diffusion coefficient (ADC) of water in that
region of the brain. The temporal dynamics of cell-volume changes (cytotoxic edema) and water
ADC reductions following experimental stroke has been well documented. de Crespigny et al.
showed that global cerebral ischemia in the rat results in a rapid decline in brain-water ADC during
the first two hours following stroke onset (4). Using an embolic stroke model in the rat brain, Jiang
et al. (3) also found that tissue-water ADC decline was most

BBB Disruption in Embolic Stroke Detected by MEMRI 203
Fig. 6-1: A) Plot of water ADC (and ∆R2* and ∆R2) in the rat brain following cardiac arrest. Reproduced from de
Crespigny et al. (4). Note how the abrupt ADC decline following cardiac arrest (at time 0) levels off starting at 120
minutes. B) Plot of water ADC in brain regions with hemorrhagic transformation (“HT”) and ischemic (“Ischemia”)
injury. Note the slight increase in ADC from 2-3 h and only a modes change in ADC from 3-4 h following infusion of an
embolus to block blood flow to one brain hemisphere (infusion started at point “C”). Reproduced from Jiang et al. (5)
abrupt in the first two hours and then plateaued after three hours. Data from de Crespigny et al. and
Jiang et al. are shown in Figures 6-1a and 6-1b, respectively, for reference. The data presented in
A
B

BBB Disruption in Embolic Stroke Detected by MEMRI 204 Figure 6-1 indicate that the ADC changes in the brain related to stroke injury stabilize in the first 2-3
h after stroke onset. Therefore, if Mn2+ is infused i.v. during the time period that the BBB is
permeable due to stroke-related damage, and at a time point after which cell-volume changes have
stabilized (~4 h after stroke), then any ensuing MEMRI signal-enhancement would not likely be due
to dynamic cell-volume changes but rather increase permeability of the BBB.
6.1.1 Stroke Background
A stroke occurs when a blood vessel that delivers oxygen and nutrients (e.g., glucose) to the
brain bursts (1)or is obstructed by a blood clot or other types of emboli. Brain injury can occur
within minutes if blood flow is not restored to normal. There are two main forms of stroke: ischemic
and hemorrhagic. An ischemic stroke is caused by occlusion of blood vessels by a blood clot or other
emboli. A hemorrhagic stroke is caused by bleeding from a burst blood vessel, which diverts blood
flow away from the brain tissue that is served by the ruptured vessel. Ischemic stroke occurs more
often (~80%) than hemorrhagic stroke. With modest reductions in cerebral blood flow (CBF),
disturbances of brain tissue metabolism and function are mitigated by CBF autoregulation in brain
(6). As a result, the onset of cerebral ischemia does not occur until the CBF is reduced below a
certain threshold. Below that threshold, the CBF range is subdivided into regimes that constitute
mild, moderate, and severe ischemia as depicted in Figure 6-2.

BBB Disruption in Embolic Stroke Detected by MEMRI 205
Figure 6-2: Ischemic brain injury can be characterized as a contiguous series of thresholds which define ranges of CBF
values that are correlated to particular pathological events. CMRO2 = cerebral metabolic rate of oxygen, ECF K+ =
extracellular fluid potassium, ECF Ca++ = extracellular fluid calcium. The ischemic ‘penumbra’ is defined as tissue with
a clinical CBF deficit but that can be responsive to therapeutic intervention. Reproduced from Ref. (6).
6.1.2 Stroke and the BBB
Evaluation of BBB integrity following stroke has been accomplished by detection and
quantification of extravasated EB dye and protein tracers into the brain parenchyma. Sadoshima and
coworkers evaluated the permeability of the BBB to 131I-albumin and EB following global cerebral
ischemia by clamping both common carotid arteries in the rat (7). Sadoshima et al. reported
exudation of EB dye from blood into brain in 18 of 23 rats following 3 h of ischemia followed by
reperfusion. Albayrak et al. showed exudation of normally BBB-impermeable albumin into brain
after 2 h of stroke followed by 6 h of reperfusion. Based on findings of Albayrak et al., longer
transient ischemic events result in BBB disruption at earlier time points (as compared to shorter-
duration ischemic insults) and neuronal damage precedes BBB disruption under these conditions (8).
Data from a study by Petito et al. confirmed that neuronal necrosis alone was not sufficient to
increase BBB permeability (to horseradish peroxidase) (9). Therefore, the effects of stroke on blood
CBF

BBB Disruption in Embolic Stroke Detected by MEMRI 206 vessels must be considered to understand the mechanisms that lead to BBB damage following severe
CBF deficits.
Stroke and Brain Microvessel Damage
The reduction in CBF and oxygen delivery following stroke has several consequences for the
BBB that lead to a loss of barrier function and uncontrolled entry of blood (hemorrhagic
transformation), water, and ions into the brain parenchyma: 1) microvascular permeability barriers
are lost; 2) the basal lamina and extracellular matrix undergo progressive loss of antigens; and 3)
cell-matrix adhesion interactions within microvessels are altered (10). These steps are depicted in
Figure 6-3.
Figure 6-3: Schematic diagram of the effect of ischemia on microvascular permeability and integrity. (A) Normal
cerebral microvessel. Endothelial cells and astrocytes bound to basal lamina by integrin adhesion receptors. The BBB is
intact. (B) Breakdown of the BBB. (C) Leucocyte adhesion by receptors on endothelium and granulocytes; increased
permeability caused by granule release. (D) Breakdown of basal lamina with loss of astrocyte and endothelial cell
contacts. Reproduced from Ref. (10).
In the brain, astrocytic end-feet are adjacent to the extracellular matrix or the basal lamina in
capillaries and provide a connection between the microvascular endothelium and the neuropil

BBB Disruption in Embolic Stroke Detected by MEMRI 207 (11,12). During brain development, astrocytes, in conjunction with endothelial cells, contribute
laminin to the extracellular matrix and stimulate formation of the BBB (13). Integrins (heterodimeric
adhesion receptors) function as structural connections between endothelial cells and underlying basal
lamina. Laminins serve as a major component of the basal lamina and extracellular matrix and are
ligands for the integrin heterodimers α1β1, α2β1, α3β1, α6β1, α7β1 (14), and α6β4 (15). The basal lamina
is uniquely sensitive to focal cerebral ischemia (16) and it has been shown that the expression of
integrin β4 and the heterodimer α6β4 are rapidly and significantly reduced following stroke (MCAO
in nonhuman primate model) (12). Since astrocytes are anchored to the cerebral microvascular wall
by α6β4, and play a role in structural support of the BBB, the lack of α6β4 expression following
stroke may contribute to pathological disruption of the BBB.
6.1.3 The Embolic Stroke Model and Associated BBB Injury
There are several methods available to induce experimental stroke in animals. These include:
1) global ischemia by cardiac arrest; 2) permanent (or temporary) occlusion of the middle cerebral
artery using an intraluminal suture (suture occlusion model); and 3) occlusion of the middle cerebral
artery by infusion of emboli (embolic stroke model). Since thrombosis and embolism are
responsible for 80% of human stroke (17), an experimental model of stroke was designed to mimic
the large middle cerebral artery thromboembolic stroke in human. The rat model of embolic focal
cerebral ischemia developed by Zhang et al. results in selective occlusion of the middle cerebral
artery and a highly reproducible CBF reduction and infarct volume (18). Figure 6-5 shows a
schematic diagram of the catheter placement for infusion of an embolus in the embolic stroke model.

BBB Disruption in Embolic Stroke Detected by MEMRI 208
Figure 6-4: Schematic drawing of catheter placement into external carotid artery (ECA) and the internal carotid artery
(ICA) of the rat, with its tip 2 mm from the origin of the middle cerebral artery (MCA). The catheter contains a clot
(black), which can be injected to occlude the MCA. Reproduced from Ref. (18)
Time Frame of BBB Injury Following Embolic Stroke
Following experimental stroke by the intraluminal suture occlusion model, Belayev et al.
showed injury to the BBB as verified by Evans Blue (EB) staining. According to their data, the BBB
becomes permeable to molecules similar in size to the EB-albumin complex (MW = 68,500) within
3-5 hours after stroke (and also at 48-50 h, but not 24 h after stroke). Data from Belayev et al. is
shown in Figure 6-5:
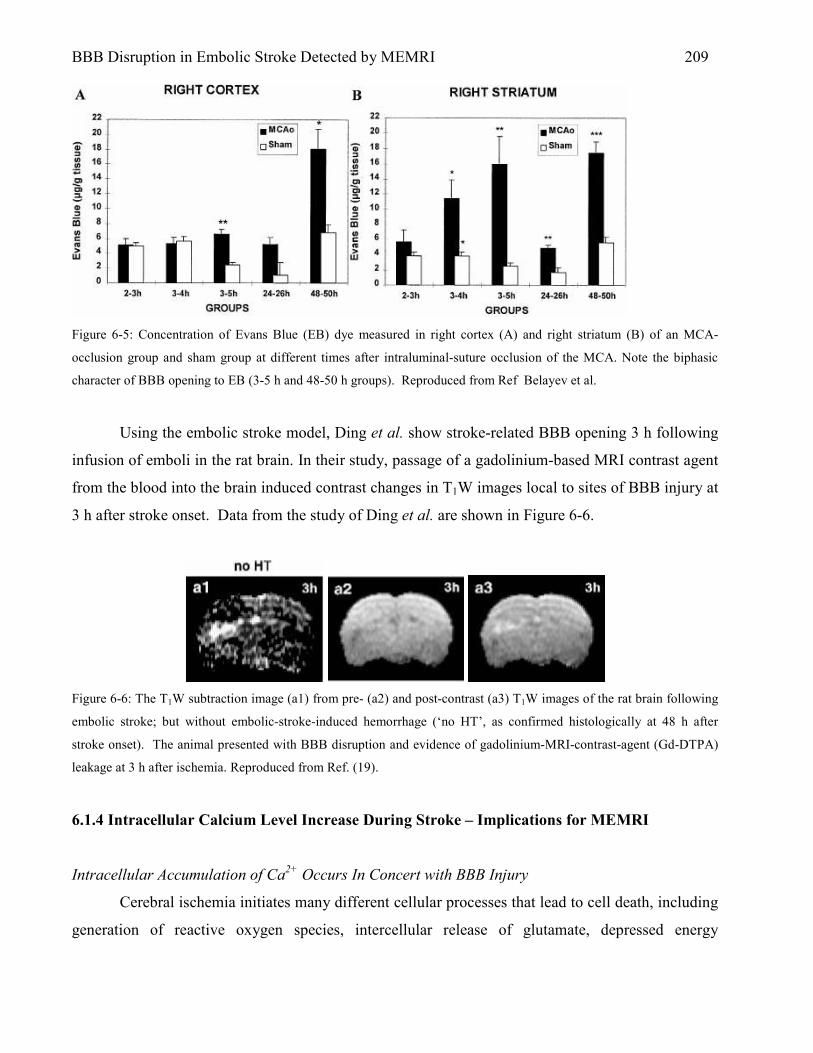
BBB Disruption in Embolic Stroke Detected by MEMRI 209
Figure 6-5: Concentration of Evans Blue (EB) dye measured in right cortex (A) and right striatum (B) of an MCA-
occlusion group and sham group at different times after intraluminal-suture occlusion of the MCA. Note the biphasic
character of BBB opening to EB (3-5 h and 48-50 h groups). Reproduced from Ref Belayev et al.
Using the embolic stroke model, Ding et al. show stroke-related BBB opening 3 h following
infusion of emboli in the rat brain. In their study, passage of a gadolinium-based MRI contrast agent
from the blood into the brain induced contrast changes in T1W images local to sites of BBB injury at
3 h after stroke onset. Data from the study of Ding et al. are shown in Figure 6-6.
Figure 6-6: The T1W subtraction image (a1) from pre- (a2) and post-contrast (a3) T1W images of the rat brain following
embolic stroke; but without embolic-stroke-induced hemorrhage (‘no HT’, as confirmed histologically at 48 h after
stroke onset). The animal presented with BBB disruption and evidence of gadolinium-MRI-contrast-agent (Gd-DTPA)
leakage at 3 h after ischemia. Reproduced from Ref. (19).
6.1.4 Intracellular Calcium Level Increase During Stroke – Implications for MEMRI
Intracellular Accumulation of Ca2+ Occurs In Concert with BBB Injury
Cerebral ischemia initiates many different cellular processes that lead to cell death, including
generation of reactive oxygen species, intercellular release of glutamate, depressed energy

BBB Disruption in Embolic Stroke Detected by MEMRI 210 metabolism, translocation of protein kinase C, increased production of polyamine and nitric oxide,
and increased intracellular calcium (Ca2+) (20). Ionic activity of extracellular calcium in the
ischemic brain decreases as verified using ion-selective microelectrodes (21,22). In a study by
Rappaport et al., a significant accumulation of Ca2+ in the ischemic MCA territory was measured
(via tissue calcium analysis) within 4 h after MCA occlusion. The time frame of calcium
accumulation coincided with the development of abnormal BBB permeability. In addition, the data
of Rappaport et al. showed that the concentration of the accumulated intracellular Ca2+ exceeded all
of the available extracellular Ca2+ in the adjacent brain tissue. Therefore, Rappaport et al. postulated
that Ca2+ lost from adjacent brain during ischemia was replenished by external sources such as blood
or CSF. The intracellular accumulation of Ca2+ has been shown by others to occur at the site of the
stroke core (20). In summary, stroke-related intracellular Ca2+ accumulation 1) occurs at the site of
ischemic injury; 2) occurs within the same time frame that the BBB is damaged by stroke (3-4 h
after stroke onset); and 3) is exacerbated by delivery of Ca2+ to the ischemic region by residual blood
flow or CSF.
Detection of Stroke Core by MEMRI
As described previously (Chapter 3), manganese (Mn2+) is handled similarly to calcium by
biological systems and does not cross a healthy intact BBB. Therefore, because high concentrations
of intracellular Ca2+ and local BBB injury are associated with the core of the stroke lesion, it is
hypothesized that Mn2+ delivered i.v. following stroke should result in a large accumulation of Mn2+
within damaged cells and localized MEMRI signal-enhancement on T1W MRI; indicative of the
stroke core.
6.2 Methods
6.2.1 Animal Preparation
This study was approved by the Institute Animal Care and Use Committee (IACUC) of the
University of Massachusetts Medical School (IACUC Protocol A-1756). Five male Sprague-Dawley
rats, weighing 280-350 g, were initially anesthetized with 5% isoflurane and maintained at 2%
isoflurane, mixed with breathing-quality air, during surgery. PE-50 polyethylene tubing was inserted
into the left femoral vein for drug administration and the left femoral artery for blood pressure and
blood gas monitoring. Rectal temperature was continuously monitored with a rectal probe and
BBB Disruption in Embolic Stroke Detected by MEMRI 211 maintained at 37.0 ± 0.5 °C using a thermostatically-controlled heat lamp (Model 73ATD, YSI Inc.,
Yellow Spring, OH) during preparation.
6.2.2 Embolic Middle Cerebral Artery Occlusion (eMCAO)
For eMCAO, a blood clot was infused via an i.v. catheter into the right external carotid artery
(ECA), allowing the left hemisphere to serve as a control. For catheterization of the right ECA, a
ventral midline incision was made in the neck. The omohyoid muscle was separated longitudinally
and retracted laterally to isolate and expose the right common carotid artery (CCA), ECA, internal
carotid artery (ICA) and pterygopalatine artery (PPA). The PPA was permanently ligated. Following
temporary clamping of the CCA, the ECA was ligated and a small incision was made in the vessel
for placement of the catheter (PE-10 tubing). PE-10 tubing was inserted into the ECA proximal to its
ligation, and one red blood clot was injected – with a volume of ~50 µL of saline – into the ICA over
approximately one second. The clot was delivered one millimeter distal from the bifurcation of the
PPA and ICA. eMCAO was verified by Laser Doppler Flowmetry (Perimed PF 5010 LDPM Unit,
Sweden) as a reduction of the blood flow signal by 70% (data not shown). Three hours after
eMCAO, animals were transferred to the MR magnet bore for imaging.
Embolus Preparation
The embolus-preparation protocol was originally described by Toomey et al. (23) and
modified based on a protocol originally described by Henninger et al. (24). The modification was
limited to reducing the size of the embolus from 36 mm to 18 mm. Briefly, whole blood (200 µL)
was withdrawn from the rat, 24 h before surgery, into an Eppendorf tube. The blood was promptly
mixed with 1.0 National Institutes of Health (NIH) unit (10 µL) of human thrombin and 4.5 µL of 1
mol/L (M) CaCl2 for a final concentration of 20 mM. Within 5 s, a small amount of this mixture was
drawn into a 30-cm-long polyethylene catheter (PE-50) and allowed to clot at 37 °C. After 2 h, the
clot was extruded from the catheter into a saline-filled Petri dish and stored at 4 °C for 22 h. Before
infusing the clot into the rat ECA, a 5- to 10-cm section of clot was placed into a separate Petri dish
containing deionized water, incubated for 5 min at room temperature, transferred into a solution of
isotonic saline, and then dissected into a single 18-mm section. This clot section was collected into a
PE-10 catheter in a volume of ~50 µL of saline. The interval between this final step and
embolization of the rat was less than 5 min.

BBB Disruption in Embolic Stroke Detected by MEMRI 212
T1 T1 T1 T1 T1
MnCl2+EB
Evans Blue
T1 DWIX,Y,Z TTC Stain
MCAO 4 3 5 6
Time (hours after eMCAO)
T1
6.2.3 MR Imaging
All MR images were acquired using a Bruker Biospin 2.0T/45 cm imaging spectrometer
operating at 85.56 MHz for 1H and equipped with ±20 G/cm self-shielded gradients. Diffusion-
weighted MRIs (DWIs) were acquired with six b-values (23, 92, 207, 828, 1126, and 1471 s/mm2), a
64 x 64 data matrix zero-filled to 128 x 128 before Fourier transformation, FOV = 3 cm x 3cm, six
2-mm-thick slices, TR/TE = 2000/51.0 ms, ∆= 6.0 ms, δ = 24.31 ms, and NEX = 8. T1W MRI was
performed with the following parameters: TR/TE = 500/10.8 ms, FOV = 3 cm x 3 cm, data matrix =
128 x 128, six 2-mm-thick slices, and NEX = 8. The slice positions of DW images and T1W images
were co-registered. The imaging plane was referenced to the rhinal fissure at the boundary of the
olfactory bulb. Acquisition time for one set of images was 8.5 minutes for T1W and 4.8 minutes for
DW imaging. During imaging, animals were placed prone within a home-built animal holder. The
head of the animal was fixed within a home-built 8-element, 4.3-cm-diameter 1H birdcage coil.
Animals were anesthetized with 2% isoflurane delivered at 1.0-1.5 L/min in breathing-quality air.
Body temperature was maintained at 37.0 ± 1°C by circulated warm air using a T-type thermocouple
and a double-point feedback control system. T1W and DW imaging continued sequentially for at
least one full scan after the end of MnCl2+EB infusion.
6.2.4 MnCl2+EB Infusion Protocol
Manganese chloride (MnCl2 · 4H2O, MW = 198; Sigma, St. Louis, MO), dissolved to 74.5
mM in isotonic saline, and Evans Blue (EB; Sigma, St. Louis, MO), dissolved to 2% in MnCl2
solution, was infused into the left femoral vein at 3.2 ml/h for 30 min using a syringe pump (Model
PHD 2000; Harvard Apparatus, Holliston, MA). Figure 6-1 shows the timing of image acquisition
relative to eMCAO.
Figure 6-7. Timing of MR imaging (DWI = DW MRI and T1 = T1W MRI), EB and TTC staining relative to eMCAO and
MnCl2+EB solution infusion. MnCl2+EB solution infusion was started 4 h after initiation of eMCAO. T1W MRI
continued for at least 25 min after cessation of the MnCl2+EB infusion.

BBB Disruption in Embolic Stroke Detected by MEMRI 213 6.2.5 EB and 2,3,5 TriphenylTetrazolium Chloride (TTC) Histology
Immediately following imaging, isoflurane anesthetic was increased to 5% and shortly
thereafter the animals were decapitated. The brain was quickly removed, placed on a square section
of parafilm and subsequently cooled for 30 min to facilitate handling. Brains were then dissected
into six 2-mm slices that corresponded spatially to the slice positions of the MRIs (first slice at 1 mm
ventral to the rhinal fissure of olfactory bulb). After dissection, brain slices were placed in saline and
scanned using a Hewlett-Packard Scanner (Model #3970) at a resolution of 1200 dpi for indications
of EB staining. After scanning, brain slices were placed in a 2% solution of TTC and warmed to 37
°C in a lab oven (Fisher Isotemp 500 Series). The time from eMCAO to TTC staining was
approximately 6 h in each animal. After 10 min in the lab oven, all slices were placed in zinc
formalin for fixation overnight. The next day, brain slices were scanned using a Hewlett-Packard
Scanner (Model #3970) at a resolution of 1200 dpi.
6.2.6 Data Analysis
Region of interest (ROI) definitions and calculations in T1W images were made using NIH
ImageJ software (Rasband, W.S., ImageJ, U. S. National Institutes of Health, Bethesda, Maryland,
USA, http://rsb.info.nih.gov/ij/, 1997-2006). ROIs were drawn freehand to distinguish between
MEMRI signal-enhanced regions, ADC-deficit regions, and normal brain tissue. MEMRI signal-
enhancement increase, MEMRI signal-enhancement area, ADC deficit, and ADC-deficit area (DA)
were all calculated using ROIs drawn freehand by observer visualization. Data are reported as mean
± SEM.
MEMRI Enhancement
MEMRI signal-enhancement on T1W images was calculated by comparing the MR signal
intensity in visually evident MEMRI signal-enhanced regions of the ipsilateral hemisphere with
homologous control regions in contralateral hemisphere, on a slice-by-slice basis:
100(%) ×−
=−CH
CHIH
SI
SIStEnhancemenSignalMEMRI
where SIIH is the mean signal intensity for an ROI in the ipsilateral hemisphere and SICH is the mean
signal intensity for the equivalent ROI in the homologous control region in contralateral hemisphere.
Percent-area of MEMRI signal-enhancement in the T1W images was calculated on a slice-by-slice
6.1

BBB Disruption in Embolic Stroke Detected by MEMRI 214 basis by comparing the area of MEMRI signal-enhancement to that of the entire ipsilateral
hemisphere, as shown in Eq. 6.2.
100(%) ×−
=−AreaHemIpsiTotal
AreaEnhancedSignalMEMRIAreaEnhancedSignalMEMRI
Apparent Diffusion Coefficient (ADC) Parameter Mapping
ADC mapping was performed on DW images on a pixel-by-pixel basis using in-house-
written Interactive Data Language (v5.3 Research Systems, Boulder, CO) software based on the
relationship between the natural log of the signal intensity in DW images and b-value as shown by
equation 5.4.
bDeMtM −= 0)(
where M(t)/M0 is the signal intensity at a particular b-value and D is the water apparent diffusion
coefficient (ADC) along a single gradient direction (x, y, or z). Maps of the average ADC were
calculated from separate DWIs acquired along the x-, y-, and z-gradient directions.
Percent ADC Deficit and Percent Deficit Area (DA)
Percent ADC deficit in ADC maps was calculated through comparison of the ADC mean in
regions with visually evident ADC deficit in ipsilateral hemisphere and ADC mean in homologous
control regions in the contralateral hemisphere on a slice-by-slice basis:
100)(
(%) ×−−
=CH
CHIH
ADC
ADCADCDeficitADC
where ADCIH is the mean ADC in the ADC deficit region in ipsilateral hemisphere and ADCCH is
the mean ADC in the homologous control region in the contralateral hemisphere. Percent ADC
deficit area in ADC maps was calculated on a slice-by-slice basis by comparison of ADC deficit area
in ipsilateral hemisphere to the area of the entire ipsilateral hemisphere.
100(%) ×=AreaHemIpsiTotal
AreaDeficitADClIpsilateraAreaDeficitADC
6.2
6.3
6.5
6.4

BBB Disruption in Embolic Stroke Detected by MEMRI 215
MEMRI-DWI Mismatch & Match
MEMRI-DWI mismatch area was calculated as the area of ADC deficit in the ipsilateral
hemisphere exclusive of MEMRI signal-enhancing regions in the ipsilateral hemisphere. ADC-
deficit ROIs were transferred to T1W images with MEMRI signal-enhancement. Regions of ADC
deficit that did not contain MEMRI signal-enhancement were outlined and defined as MEMRI-DWI
mismatch. DW and T1W images were registered in every animal. Percent MEMRI-DWI mismatch in
T1W images was calculated on a slice-by-slice basis by comparison of MEMRI-DWI mismatch area
to the area of the entire ipsilateral hemisphere.
100% ×−
=−AreaHemIpsiTotal
AreaMismatchDWIMEMRIAreaMismatchDWIMEMRI
Similarly, MEMRI-DWI match (overlap) area was calculated as the area of ADC deficit in
the ipsilateral hemisphere inclusive of MEMRI-signal-enhancing regions. ADC deficit ROIs were
transferred to T1W images with MEMRI signal-enhancement. Regions of ADC deficit that contained
MEMRI signal-enhancement were outlined and defined as MEMRI-DWI match. MEMRI-DWI
match area was calculated as a percentage of the ipsilateral hemisphere area.
100% ×−
=−AreaHemIpsiTotal
AreaMatchDWIMEMRIAreaMatchDWIMEMRI
The calculation of a MEMRI-DWI mismatch and match was considered necessary in order to
determine if MEMRI-enhanced regions had a significantly different ADC deficit as compared to
non-MEMRI-enhanced regions. A larger ADC deficit in the MEMRI-enhanced regions was
expected if these regions are truly indicative of the stroke core.
TTC Stain Deconvolution and Saturation Transform
For technical reasons, TTC staining was performed with EB dye present in the brain.
Therefore, in regions with deep EB staining, it was not visually clear if the underlying brain did or
did not stain by TTC. For best results, therefore, a method was employed to separate the two colors
(red by TTC and blue by EB) from the histological images, based on image deconvolution and
Saturation transformation (as previously discussed in Chapter 5). Based on the work of Ruifrok and
6.6
6.7
BBB Disruption in Embolic Stroke Detected by MEMRI 216 Johnston, histological images (in RGB format) were deconvolved into images that represented the
independent contributions of the TTC stain (red) and the EB stain (blue) (25). This method is based
on an orthonormal transformation of the optical density values found in RGB images of each stain
separately (i.e., a RGB histological image of red stain only and a RGB image of blue stain only).
Since we were not able to experimentally determine the optical density (OD) values for TTC and
EB, previously determined OD values for Fast Red and Alcian Blue stains were used instead. Fast
Red and Alcian Blue absorb light at wavelengths similar to those of EB and TTC, respectively
(wavelengths of light absorption are: Fast Red: 266 nm; TTC: 247 nm; Alcian Blue: 615 nm; EB:
611 nm; from Ref (26)). All histological-stain deconvolution calculations were performed by ImageJ
(algorithm written by G. Landini and downloaded from
http://www.dentistry.bham.ac.uk/landinig/software/software.html). Deconvolved TTC stain images
were transformed into Hue, Saturation, and Intensity format using ImageJ software. Hue refers to the
dominant wavelength in the color image, Saturation represents the degree to which white is mixed
with the dominant wavelength, and Intensity represents the intrinsic reflectivity of the object viewed
(27).
6.3 Results
6.3.1 MEMRI signal-enhancement
MEMRI signal-enhancement was determined from T1W MRIs acquired 5-10 min following
cessation of MnCl2+EB infusion. The average percent increase in signal intensity in MEMRI signal-
enhanced regions of the ipsilateral hemisphere was 22% ± 5% and the average percent area of the
ipsilateral hemisphere with MEMRI signal-enhanced regions was 17% ± 5%. One animal did not
show MEMRI signal-enhancement in any brain slice. Table 6-1 summarizes MEMRI signal-
enhancement data.

BBB Disruption in Embolic Stroke Detected by MEMRI 217 Table 6-1: Average Percent MEMRI signal-enhancement and Percent MEMRI Signal-Enhancement Area (as a
percentage of the ipsilateral-hemisphere area) from T1W MRI Following eMCAO and Infusion of the MnCl2+EB
solution.
MEMRI Signal-Enhancement (using Eq. 6.1)
% Area of Ipsilateral Cortex w/ MEMRI Signal-Enhancement
(using Eq. 6.2) Mean ± SEM
(%)
22 ± 5
ISSDa
(%) 5
Mean ± SEM (%)
17 ± 5
ISSDa
(%) 6
aTo account for intra-animal variability, the inter-slice standard deviation (ISSD) was calculated from values for average
MEMRI Signal-Enhancement and average MEMRI Signal-Enhancement area (%) across slices.
6.3.2 ADC Deficit
Because the majority of stroke-related decrease in ADC occurs within the first 2-3 h
following stroke (28) and, as shown in Chapter 5, the paramagnetic properties of intracellular Mn2+
can lead to large susceptibility artifacts in DW images, ADC deficit in the ipsilateral hemisphere was
determined from DW images acquired 30 min before MnCl2+EB-solution infusion and 3.5 h after
embolic-stroke onset (Fig. 6-1). The average percent ADC decrease in the ipsilateral-hemisphere
regions with ADC deficit was 18% ± 2% and the average percent area of the ipsilateral hemisphere
with ADC deficit was 48% ± 8%. Table 6-2 summarizes ADC deficit data.
Table 6-2: Average Percent ADC Deficit and Percent Deficit Area (as a percentage of ipsilateral hemisphere area) from
DW Imaging (and corresponding ADC Maps) 3.5 Hours Following eMCAO and 30 Minutes Before Infusion of
MnCl2+EB Mixture Solution.
Average % ADC Deficit (using Eq. 6.4)
% Area of Ipsilateral Hemisphere w/ ADC Deficit
(using Eq. 6.5) Mean ± SEM
(%)
18 ± 2
ISSDa
(%) 4
Mean ± SEM (%)
48 ± 8
ISSDa
(%)
17
aTo account for intra-animal variability, the inter-slice standard deviation (ISSD) was calculated from values for average
ADC Deficit and average ADC Deficit area (%) across slices.

BBB Disruption in Embolic Stroke Detected by MEMRI 218 6.3.3 MEMRI-DWI Mismatch & Match
MEMRI-DWI mismatch area was calculated as the area of ADC deficit in the ipsilateral
hemisphere that exceeded the boundaries of the MEMRI signal-enhancing regions in the ipsilateral
hemisphere. In most instances, MEMRI signal-enhancement was confined to the region with ADC
deficit. For the few cases where MEMRI signal-enhancement extended beyond the boundaries of the
ADC-deficit region, MEMRI-DWI mismatch remained consistently defined as the region of ADC
deficit outside the border of MEMRI signal-enhancement. Regions in the ipsilateral hemisphere with
ADC deficit that were within the boundaries of MEMRI signal-enhancement were defined as regions
with MEMRI-DWI match (overlap). Percent-area of the ipsilateral hemisphere with a MEMRI-DWI
mismatch and match was 35% ± 6% and 18% ± 7%, respectively. It is noteworthy that the MEMRI-
DWI match regions always coincided almost exactly with the regions of MEMRI signal-
enhancement (86% ± 12% of the area of MEMRI-DWI match regions was contained within
MEMRI-enhanced regions in all animals). In other words, regions with MEMRI signal-enhancement
were almost always within regions with ADC deficit, suggesting accumulation of Mn2+ in brain
regions with BBB and neuronal injury. Regions of brain MEMRI-DWI mismatch and match were
not confined to particular brain regions. Table 6-3 summarizes MEMRI-DWI mismatch and match
percent-area data.
Table 6-3: Average Area of MEMRI-DWI Mismatch and Match As a Percentage of the Ipsilateral Hemisphere Area.
Average % Area of MEMRI-DWI Mismatch (using Eq. 6.6)
Average % Area of MEMRI-DWI Match
(using Eq. 6.7) Mean ± SEM
(%)
35 ± 6
ISSDa
(%) 8
Mean ± SEM (%)
18 ± 7
ISSDa
(%) 6
aTo account for intra-animal variability, the inter-slice standard deviation (ISSD) was calculated from values for average
% area of MEMRI-DWI Mismatch and Match across slices.
Percent ADC Deficit in MEMRI-DWI Mismatch and Match Regions
To determine if brain injury was more severe in MEMRI-DWI mismatch vs. MEMRI-DWI
match regions, the ADC deficit was summarized and compared in these regions. ADC deficit in
MEMRI-DWI mismatch and match regions was 19% ± 2% and 20% ± 2%, respectively. The
difference in ADC deficit between MEMRI-DWI mismatch and match regions was not significant (P
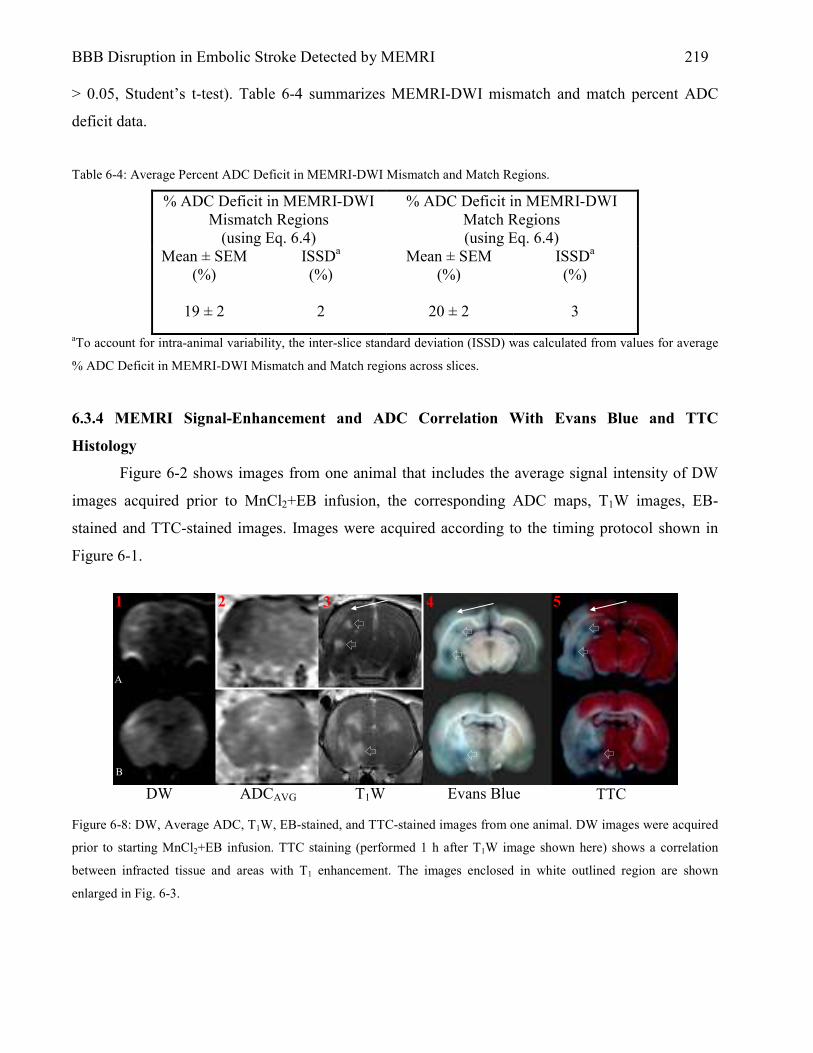
BBB Disruption in Embolic Stroke Detected by MEMRI 219 > 0.05, Student’s t-test). Table 6-4 summarizes MEMRI-DWI mismatch and match percent ADC
deficit data.
Table 6-4: Average Percent ADC Deficit in MEMRI-DWI Mismatch and Match Regions.
% ADC Deficit in MEMRI-DWI Mismatch Regions
(using Eq. 6.4)
% ADC Deficit in MEMRI-DWI Match Regions (using Eq. 6.4)
Mean ± SEM (%)
19 ± 2
ISSDa
(%) 2
Mean ± SEM (%)
20 ± 2
ISSDa
(%) 3
aTo account for intra-animal variability, the inter-slice standard deviation (ISSD) was calculated from values for average
% ADC Deficit in MEMRI-DWI Mismatch and Match regions across slices.
6.3.4 MEMRI Signal-Enhancement and ADC Correlation With Evans Blue and TTC
Histology
Figure 6-2 shows images from one animal that includes the average signal intensity of DW
images acquired prior to MnCl2+EB infusion, the corresponding ADC maps, T1W images, EB-
stained and TTC-stained images. Images were acquired according to the timing protocol shown in
Figure 6-1.
Figure 6-8: DW, Average ADC, T1W, EB-stained, and TTC-stained images from one animal. DW images were acquired
prior to starting MnCl2+EB infusion. TTC staining (performed 1 h after T1W image shown here) shows a correlation
between infracted tissue and areas with T1 enhancement. The images enclosed in white outlined region are shown
enlarged in Fig. 6-3.
A
B
DW ADCAVG T1W Evans Blue TTC
1 2 3 4 5

BBB Disruption in Embolic Stroke Detected by MEMRI 220
T1W images in Figure 6-2 (A3 and B3) were the last acquired among all of the T1W scans.
Figure 6-2 (A3 and B3) shows regions of bright MEMRI signal-enhancement corresponding to
regions with dark EB staining (small arrows) in the hippocampus (Fig. 6-2-A4) and caudoputamen
(Fig. 6-2-B4). Regions of relatively weak MEMRI signal-enhancement in cortex (large arrows, Fig.
6-2-A3) do not show correlated (gross) EB staining (A4) but do correspond to areas of tissue infarct
as verified by TTC staining (A5). Figure 6-3 shows an enlarged view of images from Figure 6-2
(outlined images) with regions of interest drawn corresponding to MEMRI signal-enhanced regions.
The table in Figure 6-3 shows an inverse correlation between percent-increase in signal intensity in
the T1W image and percent-decrease in ADC values compared to the contralateral hemisphere. The
heterogeneity of the ADC map in Figure 6-3 clearly shows the correlation between ADC deficit and
low percent MEMRI signal-enhancement. The correlation between high ADC deficit and low
percent MEMRI signal-enhancement may be a consequence of severe perfusion deficits in these
regions.
ROI % ADC Deficit % MEMRI
Enhancement
A 19 169
B 33 89
C 44 22
Figure 6-9: Enlarged view of calculated average ADC map and T1W image shown in Fig. 6-2 (boxed region outlined in
white; ADC map is windowed here to enhance contrast). ROIs are drawn for reference. The adjoining table provides data
suggesting that the ADC decrease is inversely correlates with percent MEMRI signal-enhancement. Values are mean of
ROI compared to mean of homologous contralateral control region.
TTC Stain Deconvolution
For clarity in identifying TTC- and EB-stained regions in an independent fashion, TTC-
stained images were deconvolved and transformed into the Saturation format. The deconvolved and
A
D
C
B

BBB Disruption in Embolic Stroke Detected by MEMRI 221 Saturation-transformed TTC-stained image from the animal in Figure 6-2 is shown in Figure 6-4.
EB- and TTC-stained (healthy) regions appear hyperintense in the deconvolved and Saturation
transformed images. From the deconvolved and Saturation transformed images it is clear that non-
TTC stained regions correlate with regions of gross EB staining. This confirms that the MnCl2+EB
solution passes across the stroke-damaged BBB.

BBB Disruption in Embolic Stroke Detected by MEMRI 222
Figure 6-10: T1W MRI (A), EB+TTC histology (B), deconvolved and Saturation transformed representations (C and D)
of the EB+TTC histological image shown in (B). (C) Independent representation of “EB-stain-only” image from (B).
Hyperintense regions in Column (C) correspond to regions with significant EB staining and, in turn, BBB disruption. (D)
Independent representation of “TTC- stain-only” image from (B). Hyperintense regions correspond to regions with
positive TTC staining. Therefore, dark regions correspond to regions without stain and are considered regions of
ischemic brain damage. The grayscale format of images in (C) and (D) is a result of Saturation transformation of the
deconvolved images from (B). Saturation transform images exhibit better contrast between stained (EB in (C)) and non-
stained (TTC in (D)) brain regions compared to the images generated by deconvolution alone.
MEMRI signal-enhancement During and After MnCl2+EB Infusion
T1W signal intensity over time relative to MnCl2+EB infusion is shown in Figure 6-5. The
signal intensity in strongly-enhancing brain regions (Fig. 6-3, ROIs A and B)
A B C D
1
2
3
4
5
6

BBB Disruption in Embolic Stroke Detected by MEMRI 223
Figure 6-11: Time course of T1W signal intensity relative to the initiation (Time 0) of MnCl2+EB infusion. The data are
from ROIs A, B, C, and D as shown in Figure 6-3. ROIs A and B show rapid signal increase compared to ROIs C and D.
A decline or leveling off in signal intensity was detected in all ROIs following cessation of the MnCl2+EB infusion.
increases more rapidly than the signal intensity in more weakly-enhancing brain regions (Fig. 6-3,
ROIs C and D) over the time course of the MnCl2+EB infusion. Differences in MEMRI signal-
enhancement kinetics among different brain regions may be due to differences in BBB disruption,
blood flow, and/or cellular activity local to these regions. MEMRI signal-enhancement in the
ventricle (Fig. 6-3, ROI D) is detected earlier than MEMRI signal-enhancement in the brain
parenchyma. This is likely due to differences in the transport pathways available for Mn2+ to access
the respective spaces (i.e., via the choroids plexus in the case of CSF as compared to the
compromised BBB in the case of the brain parenchyma).
6.4 Discussion
6.4.1 MEMRI Signal-Enhancement: Detection of Hemorrhagic Transformation During Acute
Stages of Embolic Stroke?
Time: Minutes relative to MnCl2+EB infusion at time 0
A
D
C
B
BBB Disruption in Embolic Stroke Detected by MEMRI 224
In this chapter we have shown that MEMRI can be used to detect regions of pathological
BBB disruption. More importantly, our data show MEMRI signal-enhanced regions local to regions
with spatially-correlated BBB injury and neuronal damage (Fig. 6-2 and 6-4). MEMRI signal-
enhancement detected in these experiments was similar to that seen in experiments summarized in
Chapters 4 and 5 in that MEMRI signal-enhancement here was correlated to regions with BBB
injury as verified by EB staining.
Brain regions with a MEMRI-DWI mismatch and a MEMRI-DWI match were analyzed to
determine if a significant difference was present between the ADC deficits in both regions. If the
ADC deficit was lower in the region with MEMRI-DWI match, then this observation would support
the concept that MEMRI signal-enhanced brain regions in these experiments are indicative of the
stroke core. However, the data in this study showed that the ADC deficit in MEMRI-DWI mismatch
regions was not significantly different from the ADC deficit in regions with MEMRI-DWI match
(Table 6-4). Therefore, it is difficult to confirm that MEMRI signal-enhanced regions are specific to
the stroke core.
On the other hand, images shown in Fig. 6-2 and 6-4 confirm that MEMRI signal-
enhancement is local to regions of stroke-related brain damage, as evidenced by EB staining. In
addition, our use of image deconvolution to independently separate EB stain color from TTC stain
color in TTC-stained digital images (Fig. 6-4) indicate that in certain instances tissue stained with
EB dye was local to regions of tissue injury (tissue not stained by TTC). In these cases, dark EB-
stained regions with underlying tissue damage may represent regions undergoing hemorrhagic
transformation or regions that are destined for hemorrhagic transformation (HT).
Indeed, Ding et al. using an embolic stroke model in rat and contrast-enhanced MRI (Gd-
DTPA contrast agent), detected ‘microscopic’ HT 3 hours after stroke (19). In their case, HT was
confirmed by hematoxylin and eosin (H&E) histology. An important observation by Ding et al. was
“enhancement in [T1W images], or increase in Ki and Vp maps, may not directly reflect HT because
the size of the Gd-DTPA molecule is smaller that that of the erythrocyte.” This observation is
relevant to this study because the MnCl2 molecule (MW=198) is smaller than the Gd-DTPA
molecule (MW=570, (29)); making MEMRI signal-enhancement in these experiments more
sensitive to tissue destined for HT, if HT is present.
It is informative to compare the data from Ding et al. to the MR and histological data from
the experiments in this study. As shown in Figure 6-6, one animal in our study showed similar

BBB Disruption in Embolic Stroke Detected by MEMRI 225 contrast (MEMRI signal-) enhancement and regions of tissue damage confirmed histologically as
compared to the findings of Ding et al. Ding et al. did not note the location within the brain where
Figure 6-12: Top row: Ki map (a), Vp map (c), subtraction T1W image (e), and histology (g) in a representative case of
microscopic HT from Ding et al. (18). Bottom row: ADCAVG map (b), EB-stained histological section (d), T1W image
(f), TTC-stained histological section (h), and the deconvolved and Saturation-transformed version of the TTC-stained
image (i), in a representative animal from the present study (same images as presented in bottom row of Fig. 6-2 with the
exception of the TTCDS image). Images in the bottom row are from the same slice in this animal (ADCAVG and T1W
images are registered exactly; EB, TTC, and TTCDS images are co-registered exactly; MR and histological images were
registered to the extent possible). Red arrow in (g) represents region of HT as determined by microscopic examination of
a histological slide in the study of Ding et al. Yellow arrow in (h) indicates the region of dark EB staining that correlates
to the region of HT in the case of Ding et al. (g). Yellow arrows in (f) and (i) show MEMRI signal-enhanced and tissue-
damaged regions in the T1W and TTCDS image, respectively, that correspond to the region of dark EB staining in the
TTC image (h).
the images shown in the top row of Fig. 6-6 were obtained. However, it appears that the brain region
shown by Ding et al. is closely co-registered to the brain region shown in this study (i.e., the bottom
row of Fig. 6-6) based on visual comparison of the histological information. The region of contrast
enhancement as indicated by Ding et al. (Fig. 6-6e) closely matches the region of MEMRI signal-
enhancement as shown in the T1W image from this study (Fig. 6-6f). Also, the region of HT shown
in the histological section of Ding et al. (Fig. 6-6g) closely matches the region of dark EB staining
shown in the TTC-stained image in this study (Fig. 6-6h). These regions, therefore, may represent
regions of HT detected by MEMRI signal-enhancement 3 hours after embolic stroke.
6.4.2 MEMRI Signal-Enhancement in Stroke: Mechanisms Related to Cell Calcium Uptake
ADCAVG T1W EB TTC TTCDS
Ding et al. (19)
Present study
b
a c
d
e
f
g
h i
BBB Disruption in Embolic Stroke Detected by MEMRI 226
Although HT may indeed be the primary factor governing the MEMRI signal-enhancement
observed in this study, it is important to consider the complicated nature of MEMRI signal-
enhancement in brain. Gd-DTPA is an extracellular contrast agent and does not accumulate within
cells. Mn2+, on the other hand, has been shown to produce contrast in T1W images only after cell-
membrane-depolarization events(1). Aoki et al. have also shown that MEMRI signal-enhancement
in brain may be sensitive to anoxic depolarization following experimental stroke in the rat brain, but
not sensitive to disruption of the BBB (30). Other investigators have shown that Mn2+ infused i.v.
following osmotic disruption of the BBB does not result in MEMRI signal-enhancement (31,32).
Therefore, in interpreting our findings it is important to discuss other mechanisms related to stroke
that may be responsible in part or completely for the MEMRI signal-enhancement detected in our
experiments.
MEMRI Signal-Enhancement After Stroke: Specific to Cell Calcium Uptake or Periinfarct
Depolarization?
Data presented here are in agreement with a study showing multifocal BBB leakage (by
albumin extravasation and EB staining) in the caudoputamen after experimental stroke (33) and
another study showing T1W image contrast enhancement in the caudoputamen by gadolinium-based
contrast-enhanced MRI after embolic stroke (19). As intended, the permanent occlusion model of
stroke results in severe perfusion deficits to certain brain regions (in particular the stroke core) and
may not allow for a significant dose of contrast agent (gadolinium or manganese) to permeate the
stroke-injured BBB. Therefore, the ability of contrast-enhanced MRI to detect areas of BBB injury
local to the stroke core is limited when using the embolic stroke model.
In fact, the data in this study shows a correlation between areas of dark EB staining and near-
normal ADC as shown in Figure 6-2A (compare images in Fig. 6-2A2, A3, and A4); suggestive of
higher cerebral blood flow (at the time of DW image acquisition) in these regions compared to
regions with a low ADC and no grossly-visible EB staining. In addition, 1 of 5 animals did not show
MEMRI signal-enhancement but did show a correlation between ADC deficit and lack of TTC
staining; typical of stroke-induced tissue injury (data not shown). However, for animals in which
MEMRI signal-enhancement was observed, stroke-induced BBB injury was severe enough, and
blood flow levels were high enough, to allow delivery of MnCl2+EB into the brain extracellular
space. Ensuing MEMRI signal-enhancement may reflect cellular uptake of Mn2+ via transient
periinfarct depolarizations and/or cells with permanently damaged calcium channels. This

BBB Disruption in Embolic Stroke Detected by MEMRI 227 hypothesis is supported by reports that show BBB injury in areas peripheral to and central to the
stroke core (34), periinfarct depolarizations persisting for 6 h beyond the initial ischemic insult (35),
and calcium accumulation in the rat hippocampus following cerebral ischemia (36). However, the
possibility that MEMRI signal-enhancement – in the cases presented here – is the result of Mn2+
accumulation within BBB endothelial cells or within swollen or damaged astrocytes cannot be ruled
out.
MEMRI Signal-Enhancement After Stroke: Specific to Cells with Damaged Membranes?
As suggested in Chapter 5 of this dissertation, osmotic BBB disruption has been shown to
result in damaged and/or swollen astrocytes and glia. Therefore, in the case of stroke, if infusions of
Mn2+ coincide temporally with stroke-related BBB injury and the time point at which astrocytes and
glia are damaged and swollen, Mn2+ may have unregulated (i.e., not only through voltage-gated
calcium channels) access to the intracellular space resulting in localized signal increase in T1W brain
images.
Using the embolic stroke model in rat, Jiang et al. used fibrinogen leakage into brain
parenchyma as a marker for BBB disruption. Fibrinogen is a large-molecular-weight molecule
(MW=300,000) that is known to be impermeable to a healthy intact BBB (37,38). In the study of
Jiang et al., fibrinogen leakage into the brain parenchyma was apparent at 2 h after stroke and levels
of fibrinogen in brain were increased at 5 h after stroke as compared to the 2-h time point. Other
models of stroke show similar results. For example, in a study by Albayrak et al., focal ischemia was
induced in rats by the intraluminal-suture-occlusion method to investigate the correlation between
stroke-related BBB-permeability changes and cell injury (39).
In the study by Albayrak et al., albumin, which does not cross the healthy intact BBB, was
found within cells local to the ischemic focus. In addition, the data of Albayrak et al. shows that the
BBB is permeable to molecules with sizes similar to albumin (MW=68,500) at a time when neuronal
damage is already manifest. The findings in this study show a spatial correlation of MEMRI signal-
enhancement to EB staining in brain (Figs. 6-2 and 6-4), consistent with the data of Albayrak et al.
Indeed, a correlation of MEMRI signal-enhancement with EB staining at a time point after stroke,
when the BBB and underlying brain cells are damaged, suggests uncontrolled entry of EB-albumin
and Mn2+ into the cell. In addition, EB dye has been shown to stain the brain after embolic stroke in
rat.

BBB Disruption in Embolic Stroke Detected by MEMRI 228
Belayev et al. used the EB-albumin complex to determine the dynamics of BBB permeability
changes following transient stroke (2 h of intraluminal-suture occlusion followed by various periods
of reperfusion) in rats (33). In their work, Belayev et al. infused EB i.v. at 2, 3, 24 or 48 h after
stroke onset (and, therefore, 0, 1, 22 or 46 hours after removal of the suture to re-establish
perfusion). Rats infused with EB 3 h after stroke onset showed gross EB staining, predominantly in
caudoputamen. The caudoputamen is frequently within the region of ischemic core in MCA-
occlusion models of experimental stroke (39). The findings in this study are consistent with those of
Belayev et al., based on the observed ADC deficit, tissue damage verified by TTC staining, and
MEMRI signal-enhancement in the caudoputamen-region in certain animals as shown in Figure 6-6 f
and h (and Fig. 6-4-A3 and -B3).
In conclusion, the data in this study provide evidence of MEMRI signal-enhancement in
areas of BBB disruption local to areas of stroke-induced tissue injury as verified by gross
comparison of T1W images and histology. This method may provide insight into the state of tissue
local to embolic stroke-induced BBB injury and an opportunity for longer retention of MEMRI
signal-enhancement in areas of BBB injury as compared to Gd-DTPA contrast-enhanced MRI. In
addition, the data in this study suggest that detection of MEMRI signal-enhanced regions shortly
after stroke (4 h) may be a more sensitive indicator of tissue destined for HT as compared to
traditional contrast-enhanced MRI during the acute stages of embolic stroke.
REFERENCES 1. Lin Y. J., Koretsky A. P. Manganese ion enhances T1-weighted MRI during brain activation:
an approach to direct imaging of brain function. Magn Reson Med 1997;38:378-388. 2. Duong T.Q., Silva A.C., Lee S.P., Kim S.G. Functional MRI of calcium-dependent synaptic
activity: cross correlation with CBF and BOLD measurements. Magn Reson Med 2002;43:383-392.
3. Silva A.C., Lee J.H., Aoki I., Koretsky A.P. Manganese-enhanced magnetic resonance imaging (MEMRI): methodological and practical considerations. NMR In Biomed 2004;17:532-543.
4. de Crespigny A.J., Rother J., Beaulieu C., Neumann-Haefelin T., Moseley M.E. Comparison of Diffusion, Blood Oxygenation, and Blood Volume Changes During Global Ischemia in Rats. Magn Reson Med 2001;45:10-16.
5. Jiang Q., Ewing J. R., Ding G. L., Zhang L., Zhang Z. G., Li L., Whitton P., Lu M., Hu J., Li Q. J., Knight R. A., Chopp M. Quantitative evaluation of BBB permeability after embolic stroke in rat using MRI. J Cereb Blood Flow Metab 2005;25:583-592.
6. Paczynski R., Hsu C.Y., Diringer M.N. Pathophysiology of Ischemic Injury. In: Fisher M., editor. Stroke Therapy. Boston: Butterworth-Heinemann; 1995.

BBB Disruption in Embolic Stroke Detected by MEMRI 229 7. Sadoshima S., Fujishima M., Ogata J., Ibayashi S., Shiokawa O., Omae T. Disruption of
Blood-Brain Barrier Following Bilateral Carotid Artery Occlusion in Spontaneously Hypertensive Rats. A Quantitative Study. Stroke 1983;14:876-882.
8. Albayrak S., Zhao Q., Siesjo B.K., Smith M.L. Effect of transient focal ischemia on blood-brain barrier permeability in the rat: correlation to cell injury. Acta Neuropathol 1997;94:158-163.
9. Petito C.K., Pulsinelli W.A., Jacobson G., Plum F. Edema and Vascular Permeability in Cerebral Ischemia: Comparison Between Ischemic Neuronal Damage and Infarction. J Neuropathol Exp Neurol 1982;41:423-436.
10. Del Zoppo G.J., Von Kummer R., Hamann G.F. Ischemic damage of brain microvessels: inherent risks for thrombolytic treatment in stroke. J Neurol Neurosurg Psychiatry 1998;65:1-9.
11. Nedergaard M. Direct signaling from astrocytes to neurons in cultures of mammalian brain cells. Science 1994;263:1768-1771.
12. Wagner S., Tagaya M., Koziol J.A., Quaranta V., del Zoppo G.J. Rapid Disruption of an Astrocyte Interaction With the Extracellular Matrix Mediated by Integrin alpha6 beta4 During Focal Cerebral Ischemia/Reperfusion. Stroke 1997;28:858-865.
13. Hurwitz A.A., Berman J.W., Rashbaum W.K., Lyman W.D. Human fetal astrocytes induce the expression of blood-brain barrier specific proteins by autologous endothelial cells. Brain Res 1993;625:238-243.
14. Albeda S.M., Buck C.A. Integrins and other cell adhesion molecules. FASEB J 1990;4:2868-2880.
15. Niessen C.M., Hogervorst F., Jaspars L.H., de Melker A.A., Delwel G.O., Hulsman E.H.M., Kuikman I., Sonnenberg A. The alpha6 beta4 integrin is a receptor for both laminin and kalinin. Exp Cell Res 1994;211:360-367.
16. Hamaan G.F., Okada Y., Fitridge R., del Zoppo G.J. Microvascular basal lamina antigens disappear during cerebral ischemia and reperfusion. Stroke 1995;26:2120-2126.
17. Sloan M.A. Thrombolysis and stroke: past and future. Arch Neurol 1987;44:748-768. 18. Zhang R.L., Chopp M., Zhang Z.G., Jiang Q., Ewing J.R. A rat model of focal embolic
cerebral ischemia. Brain Res 1997;766:83-92. 19. Ding G., Jiang Q., Li L., Zhang L., Gang Zhang Z., Ledbetter K. A., Ewing J. R., Li Q.,
Chopp M. Detection of BBB disruption and hemorrhage by Gd-DTPA enhanced MRI after embolic stroke in rat. Brain Res 2006;1114:195-203.
20. Kim H.Y., Vaughan D.K., Ghosh S. Pathways of cerebral calcium accumulation in a model of focal ischemia in rats. Neurol Res 1998;20:169-177.
21. Harris R.J., Symon L., Branston N.M., Bayhan M. Changes in extracellular calcium activity in cerebral ischaemia. J Cereb Blood Flow Metab 1981;1:203-209.
22. Siemkowicz E., Hansen A.J. Brain extracellular ion composition and EEG activity following 10 minutes ischemia in normo- and hyperglycemic rats. Stroke 1981;12:236-240.
23. Toomey J. R., Valocik R. E., Koster P. F., Gabriel M. A., McVey M., Hart T. K., Ohlstein E. H., Parsons A. A., Barone F. C. Inhibition of factor IX(a) is protective in a rat model of thromboembolic stroke. Stroke 2002;33:578-585.
24. Henninger N., Sicard K. M., Schmidt K. F., Bardutzky J., Fisher M. Comparison of ischemic lesion evolution in embolic versus mechanical middle cerebral artery occlusion in Sprague Dawley rats using diffusion and perfusion imaging. Stroke 2006;37:1283-1287.
25. Ruifrok A.C., Johnston D.A. Quantification of Histological Staining by Color Deconvolution. Analyt Quant Cytol Histol 2001;23:291-299.

BBB Disruption in Embolic Stroke Detected by MEMRI 230 26. Horobin R.W., Kiernan J.A. Conn's Biological Stains. Oxford: BIOS Scientific Publishers
Ltd; 2002. 27. Fermin C.D., Degraw S. Colour thresholding in video imaging. J Anat 1995;186:469-481 28. Sotak C. H. Nuclear magnetic resonance (NMR) measurement of the apparent diffusion
coefficient (ADC) of tissue water and its relationship to cell volume changes in pathological states. Neurochem Int 2004;45:569-582.
29. Vexler V. S., Clement O., Schmitt-Willich H., Brasch R. C. Effect of varying the molecular weight of the MR contrast agent Gd-DTPA-polylysine on blood pharmacokinetics and enhancement patterns. J Magn Reson Imaging 1994;4:381-388.
30. Aoki I., Ebisu T., Tanaka C., Katsuta K., Fujikawa A., Umeda M., Fukunaga M., Takegami T., Shapiro E.M., Naruse S. Detection of the anoxic depolarization of focal ischemia using manganese-enhanced MRI. Magn Reson Med 2003;50:7-12.
31. Duong T. Q., Silva A. C., Lee S. P., Kim S. G. Functional MRI of calcium-dependent synaptic activity: cross correlation with CBF and BOLD measurements. Magn Reson Med 2000;43:383-392.
32. Henning E. C., Meng X., Fisher M., Sotak C. H. Visualization of cortical spreading depression using manganese-enhanced magnetic resonance imaging. Magn Reson Med 2005;53:851-857.
33. Belayev L., Busto R., Zhao W., Ginsberg M. D. Quantitative evaluation of blood-brain barrier permeability following middle cerebral artery occlusion in rats. Brain Res 1996;739:88-96.
34. Menzies S. A., Betz A. L., Hoff J. T. Contributions of ions and albumin to the formation and resolution of ischemic brain edema. J Neurosurg 1993;78:257-266.
35. Back T., Kohno K., Hossmann K. A. Cortical negative DC deflections following middle cerebral artery occlusion and KCl-induced spreading depression: effect on blood flow, tissue oxygenation, and electroencephalogram. J Cereb Blood Flow Metab 1994;14:12-19.
36. Picone C. M., Grotta J. C., Earls R., Strong R., Dedman J. Immunohistochemical determination of calcium-calmodulin binding predicts neuronal damage after global ischemia. J Cereb Blood Flow Metab 1989;9:805-811.
37. Willis C. L., Leach L., Clarke G. J., Nolan C. C., Ray D. E. Reversible disruption of tight junction complexes in the rat blood-brain barrier, following transitory focal astrocyte loss. Glia 2004;48:1-13.
38. Haring H. P., Berg E. L., Tsurushita N., Tagaya M., del Zoppo G. J. E-selectin appears in nonischemic tissue during experimental focal cerebral ischemia. Stroke 1996;27:1386-1391; discussion 1391-1382.
39. Albayrak S., Zhao Q., Siesjo B. K., Smith M. L. Effect of transient focal ischemia on blood-brain barrier permeability in the rat: correlation to cell injury. Acta Neuropathol (Berl) 1997;94:158-163.

CHAPTER 7
Summary

Summary 231
The research presented in this dissertation focused on methods to advance the state of the art
in a relatively new area of research; manganese-enhanced MRI (MEMRI) in the brain. The divalent
manganese ion (Mn2+) is handled similarly to calcium (Ca2+) in biological systems. Therefore, Mn2+
in brain has been shown to act as a cell-membrane-dependent contrast agent useful for direct
mapping of brain function. Many MEMRI experiments rely on osmotic BBB disruption for delivery
of Mn2+ to brain parenchyma prior to a specific neuronal stimulus. To date, the MEMRI literature is
lacking histological (or other) evidence to show the extent of BBB disruption and/or the distribution
of Mn2+ in brain prior to specific neuronal activity. Therefore, to remedy this, we developed a simple
but novel method to histologically monitor the degree of BBB disruption and associated passage of
Mn2+ into brain parenchyma.
Because Evans Blue (EB) dye is a well-known marker for monitoring the permeability of the
BBB, we mixed EB with MnCl2 and infused the resulting solution i.v. following osmotic BBB
disruption. As Chapter 4 makes clear, a co-infusion of MnCl2 and EB allows for the quantification of
BBB permeability changes and an inference as to the extent of Mn2+ distribution in the brain. In
addition, we show that using a particular infusion protocol of MnCl2+EB and 1.6 M arabinose (to
osmotically disrupt the BBB) consistently results in nonspecific MEMRI signal-enhancement. This
portion of the dissertation shows that another mechanism of Mn2+ influx into cells (other than by
voltage-gated calcium channels) may be responsible for unwanted signal changes in MEMR images.
In Chapter 5, the mechanism responsible for unwanted signal changes in MEMR images and
the potential associated effects on brain structure and function was investigated further by testing the
effects of two osmotic BBB disruption protocols on brain tissue, apparent diffusion coefficient
(ADC), MEMRI signal-enhancement, and differences in area of ADC deficit and nonspecific
MEMRI signal-enhancement (MEMRI-DWI mismatch) in the rat brain following infusion of
MnCl2+EB solution. Significant nonspecific MEMRI signal-enhancement and brain damage were
detected using the experimental protocols described in Chapter 5. These findings are important for
the MEMRI research field in general because many MEMRI experiments rely on normal brain
function and structure following osmotic BBB disruption. This research makes clear the need for an
optimal BBB protocol for MEMRI studies.
Because brain regions with nonspecific MEMRI signal-enhancement were consistently
spatially correlated with EB-stained regions (and therefore regions with BBB disruption) an
experiment was designed to test the efficacy of Mn2+ to detect regions of pathological (vs.
experimental) BBB disruption. The research in Chapter 6 provides evidence of MEMRI signal-
Summary 232 enhancement in areas of BBB disruption local to areas of stroke-induced tissue injury as verified by
gross comparison of T1W images and histology (TTC staining). Results from experiments in Chapter
6 are useful because it was shown that Mn2+ can be used to track BBB injury following stroke and
shows strong potential for tracking stroke-related nerve damage in brain. Because Mn2+ acts as an
intracellular contrast agent, the methods described in Chapter 6 may provide insight into the state of
tissue local to embolic stroke-induced BBB injury.
A parallel can be drawn from data summarized in Chapters 4, 5, and 6: nonspecific MEMRI
signal-enhancement in brain is very likely a result of a mechanism related to BBB disruption and/or
cell volume regulation in response to osmotic challenge. This idea is important because it obviates
the need for future work that will determine; 1) the exact mechanism related to osmotic and
pathological BBB disruption that causes nonspecific MEMRI signal enhancement; 2) the optimal
experimental protocol (in terms of osmotic BBB disruption and anesthetic regimen) for MEMRI
experiments that rely on specific neuronal stimulus in a healthy brain; and 3) methods other than
osmotic BBB disruption that will reliably allow delivery of Mn2+ into brain such that time-efficient
MEMRI experiments are possible.
Future Considerations
MEMRI Experiments and Osmotic BBB Disruption
The use of osmotic agents to disrupt the blood-brain barrier (BBB) has several drawbacks,
such as brain damage and swelling and barrier opening that is inhomogeneous, as outlined in this
dissertation. MEMRI experiments that utilize osmotic BBB disruption should, therefore, provide
evidence of healthy brain tissue and the degree of BBB disruption following osmotic challenge. The
methods of TTC and Evans Blue staining presented in this dissertation provide qualitative evidence
of brain tissue health and the homogeneity of BBB disruption following infusions of hyperosmotic
arabinose or mannitol.
MEMRI Experiments and Baseline MR Imaging
Results of MEMRI experiments that include osmotic BBB disruption performed on the
benchtop are susceptible to misinterpretation because MRI scans acquired before neuronal stimulus
and after osmotic BBB disruption are not possible. To monitor possible changes in T1-weighted
(T1W) or diffusion-weighted (DW) contrast following osmotic BBB disruption and MnCl2 infusion,

Summary 233 a control group of animals can be used in which neuronal stimulus is not performed. Although use of
a control group may be sufficient to rule out unwanted changes in T1W or DW contrast following a
specific infusion protocol of arabinose (or mannitol) and MnCl2, this group increases the number of
animals needed to complete the study. In fact, the control group in many studies uses the same
number of animals as the treatment group, thus doubling the number of animals in the study if
treatment animals cannot also be used as controls. When MEMRI experiments are moved from the
benchtop to the bore of the MR scanner each animal can be scanned prior to neuronal stimulus
allowing 1) each animal to serve as its own control; and 2) more accurate determination of
nonspecific changes in T1W and DW contrast in the treatment group.
Future Experiments
Several MEMRI experiments have been carried out that do not rely on osmotic BBB
disruption (1-3). These experiments were not, however, designed to detect the presence or absence
of clinically-relevant disease in brain. The methods described in these works may be useful for
future experiments that can utilize the unique contrast agent properties of Mn2+ to provide new
information regarding a particular brain disease.
MEMRI and Multiple Sclerosis
Multiple sclerosis (MS) is an autoimmune disease of the central nervous system which
results in demyelination of axons (4). Current MRI techniques to monitor MS include image contrast
that is dependent upon the proportion of water protons that are bound to macromolecules (i.e.,
magnetization transfer contrast) (5). From magnetization transfer (MT) contrast the degree of tissue
structure (and, therefore, axonal loss) can be inferred but cannot be measured directly. Other MRI
techniques to measure the degree of axonal loss include MR spectroscopy and conventional T1W
imaging (5). MR spectroscopy suffers from low spatial resolution and conventional T1W imaging
does not provide a direct measure of axon structure or function. MEMRI offers an advantage to MR
spectroscopy and conventional T1W imaging for detection of axonal loss in experimental models of
MS. The unique mechanism by which normal cells sequester Mn2+ and generate localized contrast in
T1W images makes MEMRI an attractive alternative to other MRI techniques of neuronal loss
detection in experimental MS.

Summary 234 MEMRI and Parkinson’s Disease
Parkinson’s disease is a neurodegenerative disorder with symptoms that include body
tremors, alterations in personality, impaired color vision discrimination, and decreased autonomic
function (6). One of the distinct pathological features of Parkinson’s disease is progressive loss of
dopamine (DA) neurons in the pars compacta of the substantia nigra. Although the causes of DA
neuron loss are not well known, evidence points to oxidative stress, mitochondria dysfunction,
protein mishandling, and inflammation as possible pathological contributors (7). In addition, Li et al.
have offered evidence that calcium (Ca2+) homeostasis disturbance under conditions of proteasome
inhibition may be a novel pathological mechanism leading to DA neuronal injury (7). Because Mn2+
is treated similarly to Ca2+ in vivo, MEMRI may be a useful tool to follow up on Li’s work in in vivo
experiments. Current in vivo imaging strategies rely, in part, on correlating single photon emission
tomography (SPECT) and T2-weighted MR images of Parkinson’s disease patients (8). SPECT
imaging can be used for the noninvasive determination of dopamine concentration in vivo but cannot
be used to detect DA neuronal injury directly. MEMRI may therefore be a novel method for
detection of DA neuron injury in animal models of Parkinson’s disease. Because lower levels of
intracellular calcium are expected with DA neuronal injury under conditions of proteasome
inhibition (7), lower levels of intracellular Mn2+ are also expected during proteasome inhibition in
the presence of consistent extracellular [Mn2+]. Lower levels of intracellular Mn2+ will lead to lower
MEMRI signal-enhancement on high resolution (78 µm in rat) MR scans providing 1) accurate
localization of regions of brain with DA neuronal injury and 2) additional evidence that DA neuronal
injury is associated with disturbed calcium homeostasis.
MEMRI in the Clinic
As described in Chapter 3 of this dissertation, Mn2+ is toxic and is not currently applicable
for human brain imaging. In addition, although previous studies have suggested the usefulness of
osmotic blood-brain barrier (BBB) disruption to allow entry of Mn2+ into brain following
intravenous infusion, Chapters 4 and 5 of this dissertation outlined the serious side effects of osmotic
BBB disruption under certain experimental conditions. Therefore, to bring MEMRI to the clinic
there is a clear need to reduce or eliminate the toxic effects of Mn2+ and to eliminate the need for
osmotic disruption of the BBB in order to introduce Mn2+ to the extracellular space of the brain

Summary 235 without causing brain injury and confounding changes in diffusion-weighted (DW) and T1-weighted
(T1W) image contrast.
Chelation for Mn2+ For Reduced Toxicity and Efficient Transport Across the Intact BBB
The design of a chelate for the Mn2+ ion that allows for efficient (in time and space) transport
across the BBB and reduced (or eliminated) toxicity in brain while maintaining the unique Ca2+
channel dependent contrast agent characteristics of Mn2+ would be a major research effort. As a first
step towards this goal, different chelates for Mn2+ could be tested that allow for efficient transport of
Mn2+ across the BBB in such a way that sufficient quantities of free Mn2+ are available for cellular
sequestration (via voltage-gated calcium channels) once the chelated molecule has passed from the
vasculature into the brain parenchyma. As the next and necessary step for getting MEMRI into the
clinic, a chelate must be found for Mn2+ that reduces or eliminates toxicity in the brain. To reduce
the toxicity of Mn2+ in brain and to maintain the unique characteristics of MEMRI it would be
important to find a chelating molecule that would; 1) allow entry of Mn2+ to the intracellular space
via voltage-gated calcium channels; 2) prevent excessive (i.e., more than 4 hours) long-term
accumulation in the cell (and mitochondria); and 3) allow efficient excretion of Mn2+ via kidneys or
bile.
A chelate that combines the efficient transport of Mn2+ across the BBB (thus eliminating the need
for osmotic BBB disruption) and reduces or eliminates toxicity in brain is not likely to be found
soon. In the meantime, therefore, newer MRI techniques (i.e., pulse sequences) may be developed
and more research at higher magnetic fields may be undertaken that will make very low doses of
Mn2+ in brain apparent after systemic administration and entry of Mn2+ into brain via the blood-CSF
barrier. In addition, future MEMRI experiments of brain pathology (stroke, multiple sclerosis,
Parkinson’s disease) in animals with brain structure similar to humans should be performed in order
for better translation of MEMRI results in animals to clinical situations.
REFERENCES 1. Aoki I., Lin Wu Y.J., Silva A.C., Lynch R.M., Koretsky A.P. In vivo detection of
neuroarchitecture in the rodent brain using manganese-enhanced MRI. Neuroimage 2004;22:1046-1059.
2. London R.E., Toney G., Gabel S.A., Funk A. Magnetic Resonance Imaging Studies of the Brains of Anesthetized Rats Treated With Manganese Chloride. Brain Res Bull 1989;23:229-235.
Summary 236 3. Lee J.H., Silva A.C., Merkle H., Koretsky A.P. Manganese-Enhanced Magnetic Resonance
Imaging of Mouse Brain after Systemic Administration of MnCl2: Dose-Dependent and Temporal Evolution of T1 Contrast. Magn Reson Med 2004;53:640-648.
4. Kutzelnigg A., Faber-Rod J. C., Bauer J., Lucchinetti C. F., Sorensen P. S., Laursen H., Stadelmann C., Bruck W., Rauschka H., Schmidbauer M., Lassmann H. Widespread demyelination in the cerebellar cortex in multiple sclerosis. Brain Pathol 2007;17:38-44.
5. Dehmeshki J., Chard D. T., Leary S. M., Watt H. C., Silver N. C., Tofts P. S., Thompson A. J., Miller D. H. The normal appearing grey matter in primary progressive multiple sclerosis: a magnetisation transfer imaging study. J Neurol 2003;250:67-74.
6. Postuma R. B., Lang A. E., Massicotte-Marquez J., Montplaisir J. Potential early markers of Parkinson disease in idiopathic REM sleep behavior disorder. Neurology 2006;66:845-851.
7. Li X., Yang D., Li L., Peng C., Chen S., Le W. Proteasome inhibitor lactacystin disturbs the intracellular calcium homeostasis of dopamine neurons in ventral mesencephalic cultures. Neurochem Int 2007.
8. Lee J. D., Huang C. H., Weng Y. H., Lin K. J., Chen C. T. An automatic MRI/SPECT registration algorithm using image intensity and anatomical feature as matching characters: application on the evaluation of Parkinson's disease. Nucl Med Biol 2007;34:447-457.

APPENDIX

David G. Bennett
Worcester Polytechnic Institute 36 Eunice Avenue Department of Biomedical Engineering Worcester, MA 01606 100 Institute Road, SL121 Cell: 508-736-3164 Worcester, MA 01609 [email protected] Lab: 508-752-3110
OBJECTIVE Research & Development and/or supportive role in a laboratory setting with
the goal of improvement and enhancement of magnetic resonance imaging and/or spectroscopy technology and its application to clinical and/or animal disease detection.
EDUCATION
Worcester Polytechnic Institute, Worcester, MA Ph.D., Biomedical Engineering June, 2007 Dissertation Title: “Osmotic- and Stroke-Induced Blood-Brain Barrier Disruption Detected by Manganese-Enhanced Magnetic Resonance Imaging (MEMRI)”
University of Massachusetts Lowell, Lowell, MA M.S., Electrical Engineering May, 2003 Research Topic: “Time-Dependent 3D Object Classification Using Hidden Markov Models” B.S., Electrical Engineering June, 1997 Senior Projects: • Autonomous Maze-Solving Robot (1997 IEEE Micromouse competition) • “Chaotic Analysis of Electromyographic Signals”
PROFESSIONAL EXPERIENCE
NMR Laboratory Research Assistant, Worcester Polytechnic Institute, Worcester, MA Sept. 2002 – present
• Design and execution of experiments for original manganese-enhanced MRI research and dynamic contrast-enhanced mouse tumor MRI. • MR imaging using Bruker Avance Spectrometer (Paravision 2.1 software). • Design of RF surface and volume coils for MRI experiments. • Writing custom Interactive Data Language (IDL) software for MR image analysis. • Assisting in maintenance and upkeep of GE 2T research magnet. • Developed and tested benchtop NMR spectrometer hardware and software (Labview). • Operated GE Signa LX 1.5T clinical scanner during clinical functional magnetic resonance imaging (fMRI) trials. • Wrote C shell scripts on Linux 9.0 platform to control fMRI data analysis using AFNI.
Graduate Teaching Assistant, Worcester Polytechnic Institute, Worcester, MA Fall 2005
BE 582. Principles of In Vivo Nuclear Magnetic Resonance Imaging. • Assist students performing laboratories using the Bruker Avance Spectrometer. • Correct student homework assignments. • Demonstrate NMR theory using benchtop NMR spectrometer controlled by in-house Labview software.

Software Engineer, Goodrich Corp, Lexington, MA Aug., 2001 – Sept. 2002
• Developed and maintained control algorithms for aircraft-mounted digital camera. • Enhanced camera’s ability to monitor speed, altitude, latitude and longitude in acquiring images according to pre-determined areas of interest. • Wrote algorithms using MATLAB and subsequently translated them to the C programming language on a VxWorks platform.
Software Engineer (Secret Clearance Required), MITRE Corp. Bedford, MA Jan., 1999 – Aug., 2001
• Developed code for various systems using software packages and languages such as C, Perl, Assembly, Lex, and Expect. • Member of team responsible for code enhancements and reviews.
Assistant Staff, Electrical Engineer MIT Lincoln Laboratory, Lexington, MA June, 1997 – Jan., 1999
• Supported an engineering development and sensor technology group comprised of 30 technical personnel. • Assisted in the design and development of an embedded communication system using the 8751 microcontroller. • Wrote communication system-specific C code. • Tested, debugged and wrote a user’s manual for a wireless communication system controlled by Labview.
FELLOWSHIPS AND GRANTS GAANN Fellowship, 08/15/03-08/15/05. Worcester Polytechnic Institute, Worcester, MA Stedman Smith Fellowship, 08/15/05 – Present. Worcester Polytechnic Institute, Worcester, MA
HONORS AND AWARDS WPI Crimson and Gray Award, 04/13/04. Recognizes exceptional and sustained involvement in campus life and service to WPI. Educational Stipend Award for Students, Postdoctoral and Clinical Trainees: ISMRM 2005, 2006, and ISMRM/ESMRMB 2007.
PUBLICATIONS
Detection of Blood-Brain Barrier Disruption Using Manganese-Enhanced Magnetic Resonance Imaging. D.G. Bennett, N. Henninger, M.Fisher, C.H. Sotak, In Preparation.
A paramagnetic contrast agent for detecting tyrosinase activity. M. Querol, D.G. Bennett,
C.H. Sotak, A.A. Bogdanov, Jr. The Royal Society of Chemistry, submitted.

Tumor-targeted enzyme mediated MR signal amplification using paramagnetic substrates.
A.A. Bogdanov, H-W. Kang, D.G. Bennett, M.Querol, A.Y. Yudina, I. Verel, C.H. Sotak, In Preparation.
CONFERENCE PROCEEDINGS Manganese-Enhanced MRI (MEMRI) and Diffusion-Weighted MRI Mismatch in the Absence
of a Specific Neuronal Stimulus. D. Bennett, N. Henninger, M. Fisher, C.H. Sotak. Abstract, Poster Presented at the Joint Annual Meeting of ISMRM-ESMRMB in Berlin, Germany, May 2007.
EGF receptor expression imaging using antibody-conjugated enzymes and a paramagnetic
substrate. A.A. Bogdanov, M. Querol, H-W. Kang, D.G. Bennett, C. Sotak. Abstract, Oral Presentation at the Joint Annual Meeting of ISMRM-ESMRMB in Berlin, Germany, May 2007.
Detection of Blood-Brain Barrier Disruption Using Manganese-Enhanced Magnetic
Resonance Imaging (MEMRI). D. Bennett, N. Henninger, M. Fisher, C. Sotak. Abstract, Poster Presented at the 14th Scientific Meeting of the International Society of Magnetic Resonance in Medicine, Seattle, Washington, May 2006.
Tumor-targeted enzyme mediated MR signal amplification using paramagnetic substrates.
A.A. Bogdanov, H-W. Kang, D.G. Bennett, M.Querol, A.Y. Yudina, I. Verel, C.H. Sotak. Abstract, Oral Presentation at the 14th Scientific Meeting of the International Society of Magnetic Resonance in Medicine, Seattle, Washington, May 2006.
Characterizing Intra- and Extracellular Spaces of Skeletal Muscle In Vivo Using MEMRI.
J.G. Seland, K.G. Helmer, G. Nair, D.G. Bennett, C.H. Sotak. Abstract, Poster Presented at the 14th Scientific Meeting of the International Society of Magnetic Resonance in Medicine, Seattle, Washington, May 2006.
MEMBERSHIPS
2005 – Present International Society of Magnetic Resonance in Medicine (ISMRM) 2004-2005 Graduate Student Representative for WPI’s Provost Search Committee 2004-2005 Graduate Student Representative for WPI Community Council 2003-2005 WPI Social Awareness Committee 1997-2000 Institute of Electrical and Electronics Engineers (IEEE) 1997 Tau Beta Pi National Engineering Honor Society 1997 Eta Kappa Nu National Electrical Engineering Honor Society

Figure 1: T1-weighted MRIs (A) and corresponding EB-stained histological slices (B). 30 mM MnCl2/2% EB was administered 2 min after osmostically-induced BBB opening. Areas of MRI signal enhancement correlate well with regions of BBB opening on EB-stained slices. Top MRI slice in (A) shows the ROIs used for enhancement calculations.
Detection of Blood-Brain Barrier Disruption in Rat Brain After Osmotic Shock Using Manganese-Enhanced
Magnetic Resonance Imaging (MEMRI)
D. Bennett1, N. Henninger3,5, M. Fisher4,5, C. Sotak1,2,4
Departments of 1Biomedical Engineering and 2Chemistry & Biochemistry, Worcester Polytechnic Institute, Worcester, MA, USA, Departments of 3Neurology and 4Radiology, University of Massachusetts Medical School, Worcester, MA, USA, 5Department of Neurology, University of Massachusetts Memorial Healthcare, Worcester, MA, USA
Synopsis. Infusion of manganese two minutes after osmotic disruption of the blood-brain barrier (BBB) resulted in areas of signal enhancement closely correlated with areas of Evans Blue histological staining. For MEMRI experiments using applied neuronal stimulus to generate T1-contrast, this infusion protocol may obscure intended results. This infusion protocol may, however, be a useful alternative for imaging experimental BBB disruption. Introduction. MEMRI experiments1-3 employ the intracellular uptake of Mn2+ through voltage-gated calcium channels to shorten the T1 relaxation time of intracellular water resulting in localized increases in T1-weighted MRI signal intensity which correspond to regions of neuronal activation.1 These experiments rely on disruption of the blood brain barrier (BBB) by osmotic shock to deliver a significant concentration of Mn2+ into the extracellular space prior to the neuronal stimulus. In order to optimize the contrast, the distribution of extracellular Mn2+ should be homogeneous across the region of interest with little or no initial MR signal enhancement prior to the neuronal stimulus. Here we show that the timing of Mn2+ administration relative to BBB opening, as well as the method of Mn2+ delivery, are important factors in achieving this goal. Regions of T1-contrast enhancement were spatially correlated with areas of Evans Blue (EB) dye uptake after hyperosmotic BBB disruption. A significant increase in T1-weighted signal enhancement was observed following internal-carotid-artery infusion of Mn2+ two minutes after hyperosmotic BBB opening; indicating a significant role for MEMRI in visualizing BBB disruption under these circumstances. However, this enhancement would also obscure T1-weighted signal increases arising from subsequent neuronal stimuli; thus mitigating against using this particular administration protocol for such studies. Methods. Four male Sprague-Dawley rats weighing 280-350 g were anesthetized with 2.0 % isoflurane mixed with breathing-quality air. 25% D-mannitol solution (5 ml/kg; Sigma) was injected into the internal carotid artery over 50 seconds. Prior to each injection, the common carotid, external carotid and pterygopalatine artery were ligated. Two minutes after the mannitol injection was completed manganese chloride (MnCl2, MW = 198; Sigma), dissolved to 30 mM in isotonic saline, and EB (Sigma), dissolved to 2% in manganese chloride solution (2 ml/kg), was infused into the internal carotid artery at 4.5 ml/hr. MR images were acquired using a Bruker Biospin 2.0T/45 cm imaging spectrometer operating at 85.56 MHz for 1H and equipped with ±20G/cm self-shielded gradients. T1-weighted MRI was performed with the following acquisition parameters: TR/TE = 300/7 msec, FOV = 3 cm x 3 cm, matrix = 128x128, six 2-mm slices with NEX = 8. Results. Figure 1A shows signal enhancement from T1-weighted MEMRIs following administration of 30 mM MnCl2. Figure 1B shows EB staining in the corresponding histological brain slices. The average regional enhancement was ~250% of that in the homologous contralateral region (e.g., see ROIs in the top MRI slice of Fig. 1A). As seen in Fig. 1 EB histological staining correlates well with areas of increased T1-contrast in the corresponding MRI slices. For this particular animal, the effect of Mn2+ on T2 relaxation shows the importance of T1-weighted imaging with a short TE to minimize signal loss due to T2 and T2
* as Figure 2 demonstrates.4 Figure 2 shows images acquired with TE = 7 ms (Fig. 2A and Fig. 1A top row) and 20 ms (Fig. 2B). The negative contrast shown in Fig. 2B is likely due to higher concentrations of Mn2+ in the respective brain regions. Also, as seen in Fig. 1, EB histological staining is darker in the regions corresponding to higher [Mn2+] suggesting more extensive BBB opening. Figure 2C shows the MR signal decline as a function of TE in the cortical ROI shown in Fig. 1A.
Discussion. MEMRI experiments for visualizing the brain response to neuronal stimulation rely on disruption of the blood brain barrier (BBB) by osmotic shock to deliver a significant concentration of Mn2+ into the extracellular space prior to the neuronal stimulus. However, there should be little or no initial MR signal enhancement prior to the neuronal stimulus in order to achieve optimal T1-contrast enhancement. Although the administration protocol used in this study has been employed by others,3 the time period between BBB opening and Mn2+ administration was longer (approximately 15 minutes) than that used in this study (two minutes). Using the current administration protocol, significant initial T1-enhancement would obscure T1-contrast changes arising from any subsequent neuronal stimulus; thus precluding the use of this particular dosing regimen for such studies. However, this Mn2+ administration method is quite effective in visualizing the region of BBB opening under these circumstances. The strong T1-contrast enhancement observed in these experiments suggests a large accumulation of intracellular Mn2+ immediately following osmotically-induced BBB opening; assuming that the mechanism of contrast change is similar to that observed following neuronal stimulation or for white-matter-tract tracing. However, because of the dramatic changes in cell volume that occur under these circumstances, Mn2+ sequestered in the extracellular space may also be a contributing factor. In spite of this uncertainty, we observed (data not shown) that regions of T1 contrast did not change significantly over time (3 hours) with respect to 1) spatial position, 2) region size, or 3) level of enhancement. These observations are consistent with the intracellular uptake of Mn2+, where signal-enhancement levels have been shown to be maintained for several hours because of intracellular Mn2+ sequestration following neuronal stimulation.1 However, an extracellular contribution to the T1-contrast enhancement cannot be ruled out, since closure of the BBB following osmotic shock could also trap a significant concentration of Mn2+ in the extracellular space, preventing its subsequent washout over time. Finally, this administration protocol may be a useful alternative for imaging experimental BBB disruption.
Figure 2: T1-weighted MEMRI following administration of 30 mM MnCl2. Images acquired with TR = 300 and TE = 7 ms (A) and 20 ms (B). Signal loss due to T2 and T2
* effects on the image suggest high concentrations of intracellular manganese.4 (C) MR signal intensity in cortical ROIs as a function of TE (TR = 300 ms).
0
5 0 0 0
1 0 0 0 0
1 5 0 0 0
2 0 0 0 0
2 5 0 0 0
7 1 0 1 2 2 0 3 3TE ( m s )
Mean Signal Intensity
R ig h t C o r t ex R O I
Le f t C o r t ex R O I
References. [1] Lin et al. Mag. Reson. Med. 38: 378-88 (1997). [2] Henning et al.Mag. Reson. Med. 53: 851-857 (2005). [3] Aoki et al. Mag. Reson. Med. 50:7-12 (2003). [4] Silva et al. NMR in Biomed. 17: 532-543 (2004).
A B
C
A B

0%
10%
20%
30%
40%
50%
60%
% Area of Non-T1-Enhanced Regions w/ADC Deficit
% ADC Deficit in Non-T1-Enhanced Regions
% Infused Hemisphere w/MEMRI-DWI Mismatch
Manganese-Enhanced MRI (MEMRI) and Diffusion-Weighted MRI Mismatch in the Absence of a Specific Neuronal Stimulus
D. Bennett1, N. Henninger3,5, M. Fisher4,5, C. Sotak1,2,4
Introduction: Manganese (Mn2+) has proven to be a useful MR contrast agent for functional imaging1 and neuronal tract tracing2. The paramagnetic properties of Mn2+ provide localized contrast on a T1-weighted (T1W) MR image after cellular sequestration via voltage-gated calcium channels1. Many MEMRI experiments rely on the delivery of a significant volume of Mn2+ to the brain parenchyma via an osmotically-disrupted blood-brain barrier (BBB). Neuronal activity associated with stroke3 and cortical spreading depression4 can also result in localized T1-enhancement. For example, in an effort to detect ischemic brain regions using MEMRI Aoki et al.3 coined the term “MEMRI-DWI mismatch” to categorize the difference between T1-enhanced brain regions and regions with an ADC below 0.5x10⁻³ mm2/s after permanent occlusion of the middle cerebral artery in the rat. The T1-enhanced regions in Aoki’s study were suggested to represent stroke core. However, mechanisms other than stroke, such as brain edema and the paramagnetic effects of manganese, were not discussed with respect to ADC deficits in the hemisphere of interest. Here, using an experimental protocol similar to that of Aoki et al.3, we show significant ADC reductions in brain regions infused with hyperosmotic solution, manganese chloride, and Evans Blue as well as non-specific T1-enhancement and DWI contrast due to Mn2+ accumulation. Additionally, 2,3,5-triphenyltetrazolium hydrochloride (TTC) staining showed signs of tissue injury in areas with significant ADC deficit. These studies suggest that when MnCl2 is delivered via an osmotically-disrupted BBB, careful assessment of baseline MEMRI-DWI mismatch regions should be performed prior to any subsequent neuronal stimulus or ischemic intervention. Methods: Eight male Sprague-Dawley rats (280-350 g) were anesthetized with 2.0% isoflurane mixed with breathing-quality air during surgery. Five minutes prior to hyperosmotic BBB-opening, rats were switched to 2% isoflurane mixed with 100% O2. Prior to each injection, the external carotid (ECA) and pterygopalatine artery were ligated and the common carotid (CCA) was temporarily clamped (~10 minutes) during catheterization of the ECA with PE-10 tubing. 1.6M arabinose solution (5 ml/kg; Sigma) was infused into the internal carotid artery over 55 seconds using an infusion pump (Harvard Apparatus, Model PHD2000). The CCA was immediately unclamped after securing the ECA catheter. During the arabinose infusion, the CCA was clamped to ensure flow towards the brain. Immediately after arabinose infusion the CCA clamp was removed and the rat was switched back to 2% isoflurane mixed with breathing quality air. Two (N=3) and ten (N=4) minutes after arabinose infusion manganese chloride (MnCl2 · 4H2O, MW = 198; Sigma), dissolved to 10 mM in isotonic saline, and Evans Blue (EB, Sigma), dissolved to 2% in MnCl2 solution (MnCl2+EB = 2 ml/kg), was infused into the internal carotid artery at 4.5 ml/hr. MnCl2+EB and arabinose solutions were filtered with 0.45 µm syringe filters (Nalgene). MR images were acquired using a Bruker Biospin 2.0T/45 cm imaging spectrometer operating at 85.56 MHz for 1H and equipped with ±20G/cm self-shielded gradients. DW images were acquired with six b-values (23, 92, 207, 828, 1126, and 1471 s/mm2), 64x64 matrix zero-filled to 128x128 before Fourier transformation, FOV=3x3cm, six 2-mm slices, TR/TE = 2000/51.0ms, ∆= 6.0ms, δ = 24.31ms, and NEX=8. T1W MRI was performed as follows: TR/TE = 500/10.8ms, FOV = 3x3cm, matrix = 128x128, six 2-mm slices with 0.1mm gap and NEX = 8. Slice profiles of DW- and T1W images were commonly referenced to the rhinal fissure at the olfactory bulb boundary.
Figure 1: Timeline of infusions, imaging and histological staining.
DWx,y,z
EB & TTC Stain 2% Iso +100% O2
Arabinose
8 (N=3) or 16 (N=3)
MnCl2 +EB
open clamp
T1 T1 T1 … T1
45 55 60 70 80 240 6 5
open
2% Iso + Air
Discussion: Many MEMRI experiments rely on the delivery of Mn2+ to the brain parenchyma via an osmotically-disrupted BBB prior to specific neuronal stimulus1,3,4. For these studies, non-specific T1-enhancement and DWI contrast is undesirable and may obscure the expected T1-contrast and ADC changes. Although ischemic conditions were not intentionally induced in these experiments, our data suggests that hyperosmotic shock itself can give rise to non-specific brain T1 and ADC changes (permanent, Figure 2B) under these conditions. These observations are consistent with previous studies that provided evidence for brain cell and endothelial cell injury after hyperosmotic shock5,6,7 and for ADC changes as a result of brain edema8,9. Our data does not, however, permit us to rule out T1-enhancement, DWI contrast and edema formation by an anesthetic effect. Isoflurane, specifically, has been shown to increase blood plasma glutamate levels in humans10 and exacerbate brain edema in brain-injured rats11. Although we did not use a combined non-volatile and volatile anesthetic regimen as described by Aoki et al.3, this approach may be helpful in reducing or eliminating any non-specific T1-enhancement under these conditions. While insufficient anesthetic depth may contribute to non-specific T1-enhancement, the MEMRI-DWI mismatched regions shown here may also reflect a brain response (functional, volumetric, or both) to the hyperosmotic disruption of the BBB alone. The results of these experiments stress the need for careful assessment of baseline MEMRI-DWI mismatch prior to any subsequent neuronal stimulus or ischemic intervention; in order to ensure that the osmotic disruption of the BBB itself does not contribute significantly to any non-specific brain T1 or ADC changes.
References: [1] Lin et al. Mag. Reson. Med. 38:378-88 (1997). [2] Aoki et al. Neuroimage 22:1046-59 (2004). [3] Aoki et al. Mag. Reson. Med. 50:7-12 (2003). [4] Henning et al. Mag. Reson. Med. 53:851-857 (2005). [5] Suzuki et al. J Neurosurg 69:421-428 (1988). [6] Lossinsky et al. J Neurocytology 24:795-806 (1995). [7] Richmon et al. Brain Research 780:108-118 (1998). [8] Baird et al. JCBFM 18: 583-609 (1998). [9] Barzo et al. J Neurosurg 87:900-907 (1997). [10] Stover et al. Acta Neurochir (Wien) 147:847-853 (2005). [11] Stover et al. Acta Neurochir Suppl. 76:375-378 (2000).
Figure 2: Averaged signal intensity of DW images acquired in x,y, and z directions (b=1126 s/mm2) , average ADC map, T1W, EB, and TTC images from three animals. MR images are from animals infused with MnCl2+EB A) 2 minutes and B), C) 10 minutes after arabinose bolus. Red arrows in A) and B) point to regions of MEMRI-DWI mismatch and EB staining and tissue damage suggestive of low blood flow to these regions possibly due to severe edema. C) One animal infused with 5ml/kg 1.6M arabinose at 50 ml/hr shows an almost complete MEMRI-DWI mismatch in this slice. MR slice in C) is 4mm ventral to MR slices in A) and B). ADC deficit and apparent hemispheric volume changes (EB and TTC slices) in C) suggests severe edema which may explain lack of T1-enhancement and EB stain in this slice.
DWAVG ADCAVG T1 Evans Blue TTC
B
A
C
MEMRI-DWI mismatch size was defined as the area of ADC deficit within regions without T1-enhancement compared to the area of the entire hemisphere. Calculations and regions of interest were made using imageJ (NIH).
Results: Animals infused with MnCl2+EB 2 minutes after arabinose showed a T1W signal increase of 38.7±7.9% covering 43.1±7.2% of each infused hemisphere. Animals infused with MnCl2+EB 10 minutes after arabinose showed a T1W signal increase of 40±4% covering 50±19% of each infused hemisphere. Figure 2 shows images from three animals that include the average signal intensity of DW images, corresponding ADC maps, T1W images, EB and TTC stains. Images were acquired according to Figure 1. Figure 2A and 2B show regions of bright T1-enhancement corresponding to regions with dark EB staining (white arrows). Figure 2A and 2B also show regions of DW hypointensity due to Mn2+ accumulation (white arrow 2A, center of hemisphere in DW image 2B). Regions of MEMRI-DWI mismatch (red arrows in 2A,2B, whole hemisphere in 2C) do not show correlated (gross) EB staining but do correspond to areas of tissue injury as verified by TTC stains (2A,2B). Data shown in Figure 2C are from an animal infused with 1.6M arabinose at 50 ml/hr (MnCl2+EB 10 minutes after arabinose) to control for brain edema and non-specific T1-enhancement due to infusion rate of arabinose. For the slice shown, brain water changes are apparent and may reflect severe edema due to hyperosmotic shock. Brain edema may be responsible for reducing blood flow and delivery of MnCl2+EB to this region. Figure 3 shows percent area of non-T1-enhanced regions with ADC deficit, percentage ADC deficit in non-T1-enhanced regions and percent area of the MnCl2+EB-infused hemisphere with a MEMRI-DWI mismatch. T1-enhancement was defined as voxels in infused hemisphere whose signal intensity exceeded the mean +2 SDs in the non-infused hemisphere. ADC deficit was defined as voxels in the infused hemisphere with ADC values less than the mean plus 2 SDs in the non-infused hemisphere.
Time (min)

Separating Signals from Intra- and Extracellular Water Compartments in Rat Skeletal Muscle In Vivo Using MEMRI
J. G. Seland1, K. G. Helmer2, G. Nair2, D. G. Bennett2, C. H. Sotak2-4 1Department of Circulation and Medical Imaging, Norwegian University of Science and Technology, N-7489 Trondheim, Norway
Departments of 2Biomedical Engineering and 3Chemistry & Biochemistry, Worcester Polytechnic Institute, Worcester, Massachusetts 01609 4Department of Radiology, University of Massachusetts Medical School, Worcester, MA 01655
Introduction. Tissue inter-compartmental equilibrium water exchange can significantly affect the quantitative analysis of various in vivo MR parameters. One method for investigating equilibrium-water-exchange effects is NMR Relaxography,1 which can employ an MR contrast agent to selectively modify the T1 relaxation time of one tissue compartment relative to the other. In the absence of a contrast agent, the inter-compartmental water exchange rate is significantly faster than the difference in longitudinal relaxation rates (R1 = 1/T1) in each compartment. In this case, a mono-exponential T1 relaxation time would be measured. However, selective addition of an MR contrast agent (of sufficient concentration) to one compartment can increase the T1-relaxation-rate difference between the two compartments (relative to the inter-compartmental exchange rate; which remains constant); potentially moving the system into an intermediate- or slow-exchange regime. If the slow-exchange regime can be achieved, then the MR signal contributions from each compartment can be separated on the basis of their T1 relaxation time differences. In the simplest case, a bi-exponential T1 relaxation time would be measured. One impediment to achieving the slow-exchange regime in vivo has been the difficulty in attaining the necessary contrast-agent concentration in one of the tissue compartments. In previous in vivo attempts in rat skeletal muscle using Gd-DTPA, only the intermediate-exchange regime could be achieved.2 In this study, manganese-enhanced MRI (MEMRI) has been investigated as a method for separating and identifying the MR signals from intra- and extracellular water compartment in rat skeletal muscle in vivo. Materials and Methods. The experiments were performed on a GE CSI-II 2.0T/45-cm imaging spectrometer operating at a 1H frequency of 85.56 MHz. A 22 mm (ID), 4-turn solenoid RF coil was placed around the right thigh of male Sprague-Dawley rats. In order to prevent the RF field from extending outside the longitudinal edges of the coil, a doughnut-shaped piece of copper foil was placed at each end. This made it possible to perform localized spectroscopy using only the RF-field profile of the coil itself. MnCl2 was infused through a catheter inserted in the femoral vein. Five rats, with an average weight of 320 g, were studied at six different [Mn2+] (20, 30, 40, 50, 60 and 70 mM); each infused successively over periods of 32 min at a flow rate of 0.0266mL/min. The total accumulated dose was 0.715 mmol/kg Mn2+ after 192 min. During infusion, T1 was measured over 6-min intervals using a standard Inversion Recovery (IR) pulse sequence with an adiabatic inversion pulse. The data were analyzed by Inverse Laplace Transform (ILT); which, when performed on the IR data, yields the distribution of T1 relaxation times in the sample.1 Results. A typical series of T1 distributions, as a function of infused [Mn2+], over time is shown in the Figure (Exp. No 5). At low [Mn2+] only one peak (located around 1170 ms) is observed. This is indicative of the fast-exchange regime, where the difference in the T1 relaxation rates (∆R1) between the two compartments is small relative to the inter-compartmental equilibrium water exchange rate. However, as the administered [Mn2+] increases over time, the mean of the single distribution shifts to lower T1 values. At a certain [Mn2+] in this case, a second distribution appears. If there is no significant transport of Mn2+ into the skeletal-muscle intracellular (IC) space over the experimental time course, then the fast T1 component can be assumed to arise from water in contact with Mn2+ in the extracellular (EC) space (as well as in equilibrium with the vascular water). The appearance of two T1 distributions also heralds the onset of the slow-exchange regime. The means of the T1 distributions (and the fractional population, p1, of the short-T1 component; p2 = 1.0 – p1) at the highest (final) infused [Mn2+] are given in the Table and were similar for all experiments. The fraction of the shortest component (p1) corresponds well to values for the skeletal muscle EC fraction reported in the literature.3 Discussion and Conclusions. A similar study using Gd(DTPA) was not able to separate the water signals from the two compartments in rat skeletal muscle.2 A shoulder was observed at highest [Gd(DTPA)]; perhaps indicating the approach of the slow-exchange regime. In the Gd(DTPA) study, the shortest T1 value attained was ~600 ms at the highest dose. In our study, a value of ~350 ms was observed at the onset of peak separation, indicating a significantly higher [Mn2+] and/or relaxivity for Mn2+ the EC space. Mn2+ bound to macromolecules in the plasma and interstitial space can result in a 5-fold increase in relaxivity vs. Mn2+ in water.4 The enhanced relaxivity, in combination with [Mn2+], appears to be sufficient to achieve the slow-exchange regime; allowing separation of the EC and IC water signals. By contrast, the relaxivity of Gd(DTPA) is the same in water and plasma,3 which may explain why only the intermediate-exchange regime was attained in (2), even at plasma [Gd(DTPA)] as high as 10 mmol/L. The ability to differentiate between IC and EC water compartments in vivo using MEMRI would have important implications for studying inter-compartmental equilibrium water exchange in skeletal muscle under a variety of circumstances as well as other applications. References. 1. Labadie C, et al, J. Magn. Reson. Ser B, 1994;105: 99-112. 2. Landis CS, et al, Magn. Reson. Med., 1999; 42: 467-478. 3. Donahue, KM, et al, Magn. Reson. Med., 1995; 34: 423-432. 4. Wendland, MF, NMR Biomed., 2004; 71: 581-594.
Exp. no T1 initial T1-1 final T1-2 final p1 final
1 1197 134 539 0.25 2 1175 155 616 0.24 3 1230 138 530 0.27 4 1152 130 480 0.26 5 1170 95 473 0.24 Overall (SD) 1185 (30) 130 (22) 528 (57) 0.25 (0.01)