Oskarshamn site investigation – Hydraulic pumping- and ...
60
Svensk Kärnbränslehantering AB Swedish Nuclear Fuel and Waste Management Co Box 5864 SE-102 40 Stockholm Sweden Tel 08-459 84 00 +46 8 459 84 00 Fax 08-661 57 19 +46 8 661 57 19 P-07-173 Oskarshamn site investigation Hydraulic pumping- and interference tests in soil monitoring wells on Laxemar, spring of 2007 Kristoffer Gokall-Norman, Jan-Erik Ludvigson Geosigma AB September 2007
Transcript of Oskarshamn site investigation – Hydraulic pumping- and ...

Svensk Kärnbränslehantering ABSwedish Nuclear Fueland Waste Management CoBox 5864SE-102 40 Stockholm Sweden Tel 08-459 84 00 +46 8 459 84 00Fax 08-661 57 19 +46 8 661 57 19
P-07-173
Oskarshamn site investigation
Hydraulic pumping- and interference tests in soil monitoring wells on Laxemar, spring of 2007
Kristoffer Gokall-Norman, Jan-Erik Ludvigson
Geosigma AB
September 2007
CM
Gru
ppen
AB
, Bro
mm
a, 2
007
P-07-173

Tänd ett lager:
P, R eller TR.
Oskarshamn site investigation
Hydraulic pumping- and interference tests in soil monitoring wells on Laxemar, spring of 2007
Kristoffer Gokall-Norman, Jan-Erik Ludvigson
Geosigma AB
September 2007
Keywords: Kaka, Kakmonster, Mupparna, Kermit.
This report concerns a study which was conducted for SKB. The conclusions and viewpoints presented in the report are those of the author(s) and do not necessarily coincide with those of the client.
A pdf version of this document can be downloaded from www.skb.se.
ISSN 1651-4416
SKB P-07-173
Keywords: Oskarshamn, Hydrogeology, Hydrology, Hydraulic tests, Pumping tests, Single-hole tests, Interference tests, Hydraulic parameters, Transmissivity, Storativity, Hydraulic responses, AP PS 400-06-124.
This report concerns a study which was conducted for SKB. The conclusions and viewpoints presented in the report are those of the authors and do not necessarily coincide with those of the client.
Data in SKB’s database can be changed for different reasons. Minor changes in SKB’s database will not necessarily result in a revised report. Data revisions may also be presented as supplements, available at www.skb.se.
A pdf version of this document can be downloaded from www.skb.se.

3
Abstract
Six interference tests and two single-hole pumping tests were performed at Laxemar, using soil monitoring wells as pumping boreholes. Pumping was executed in SSM000224, SSM000220, SSM000228, SSM000261, SSM000263 and SSM000265 for the interference tests. The single-hole pumping tests were performed in SSM000217 and SSM000236. Originally pumping was supposed to be performed also in SSM000223. This was however not possible since the water level in that borehole was not sufficiently high. The interference tests were performed in order to attain transmissivity and storativity values from the observation boreholes by means of transient evaluation. The main aim for conducting the single-hole tests was to achieve estimates of transmissivity through transient evaluation.
The interference tests were performed by pumping in above mentioned soil wells and at the same time monitoring pressure responses sections in surrounding soil wells. For each pumping borehole there were one or two selected observation boreholes. All boreholes monitored for potential responses are part of the HMS, the Hydro Monitoring System. In total, 8 observation boreholes were included in the different interference tests.
The flow periods of the interference tests spanned between c. 10 hours and 2 days. The subse-quent recovery period was measured for at least 12 hours. The pumping flow rates during the interference and pumping tests varied between c. 0.2 L/min and approximately 130 L/min.
Out of the 8 observation boreholes included in the interference tests, only 4 responded clearly to pumping. For the rest of the observation boreholes, they either did not respond to pumping or the pressure loggers installed in the observation boreholes did for some reason not rightly register the responses. The weakest of the registered responses was detected in test 1 (observa-tion borehole SSM000225). The strongest response was registered in test 6 (observation borehole SSM000266) whereas the fastest response, with regard to distance, was recorded in test 4 (observation borehole SSM000030).
Quantitative transient evaluation was made for the responding observation boreholes and for all the pumping boreholes in the interference tests. All pumping boreholes have been evaluated transiently to estimate values of transmissivity. In the cases where a transient evaluation of the interference test was possible (responses were detected in the observation boreholes), assumed values of storativity were used from these evaluations. In the other cases the first assumption for a value of storativity would be 0.05 but sometimes this value would change slightly in the evaluation process to a more plausible value. All responding observation boreholes have been evaluated transiently to estimate values of transmissivity and storativity. Partial penetration was applied in the different calculation methods used for the transient evaluation.
The estimated T-values for the pumping boreholes from transient evaluation were in fairly good agreement with the results from previously conducted slug tests or estimations, where such are available. The same is true about the estimated transmissivity values from the observation boreholes during the interference tests. There are some differences though and it must be noted that the evaluated estimations from the interference tests are uncertain due to weak responses and sometimes unsteady flow rates which produced low quality test data.

4
Sammanfattning
Sex interferenstester och två enhåls pumptester har utförts i Laxemar där jordrör användes som pumphål och observationshål. Pumpningar utfördes i SSM000224, SSM000220, SSM000228, SSM000261, SSM000263 och SSM000265 i samband med interferenstester. Enhålspumpningarna genomfördes i SSM000217 och SSM000236. Ursprungligen var det planerat att utföra ett pumptest även i SSM000223. Detta kunde dock ej genomföras då hålet hade alldeles för låg vattennivå. Interferenstesterna genomfördes för att erhålla värden på transmissivitet och storativitet för observationshålen genom transienta utvärderingar. Det huvudsakliga syftet med pumptesterna var att få ut uppskattade värden för transmissivitet genom transient utvärdering.
Interferenstesterna genomfördes genom att man pumpade i de ovan nämnda jordrören och registrerade tryckresponser i omgivande jordrör. För varje pumphål hade en eller två observationshål valts ut. Alla observationshål som övervakades med avseende på möjliga tryckresponser ingår i HMS, SKB:s Hydro Monitoring System. Totalt 8 observationsborrhål ingick i de olika interferenstesterna.
Pumpfasens längd för interferenstesterna varierade mellan ca 10 timmar upp till 2 dygn. Den efterföljande återhämtningen registrerades under minst 12 timmar. Pumpflödet under pump- och interferenstesterna varierade mellan ca 0,2 l/min och ungefär 130 l/min.
Av de 8 observationssektioner som ingick i interferenstesterna så ar det bara 4 som tydligt visade respons på den genomförda pumpningen. Övriga observationssektioner reagerade antingen inte alls på pumpningen, eller så registrerade, av någon anledning, inte de installerade loggrarna responsen på ett riktigt sätt. Den svagast registrerade responsen noterades i test 1 (observationshål SSM000225). Den starkaste responsen observerades i test 6 (observationshål SSM000266) medan den snabbaste responsen, med hänsyn taget till avståndet, uppmättes i test 4 (observationshål SSM000030).
Kvantitativ transient utvärdering utfördes för de observationshål som reagerat på pumpning och för samtliga pumphål vid interferenstesterna. Alla pumphål har utvärderats transient för att erhålla uppskattade T-värden. I de fall där en transient utvärdering av interferenstestet hade varit möjlig (respons hade registrerats i observationshålet) så användes de storativitetsvärden som erhållits från dessa utvärderingar. I de övriga fallen antogs först en storativitet på 0,05 men i några fall ändrades detta ursprungsvärde något under utvärderingen mot ett mer trovärdigt värde. Alla observationssektioner som reagerade på pumpning har utvärderats transient för att erhålla transmissivitets- och storativitetsvärden. ”Partiell genomsläpplighet” (Partial penetra-tion), användes som beräkningsgrund vid den transienta utvärderingen.
De uppskattade T-värdena från den transienta utvärderingen av pumptesterna överensstämde relativt väl med resultat från tidigare utförda slugtester eller skattningar, där sådana fanns att tillgå. Detta är även sant för de uppskattade T-värdena från observationssektionerna som ingick i interferenstesterna. Det finns dock vissa skillnader och det måste noteras att de utvärderingar som utförts är osäkra. Detta beror på de relativt svaga responserna och de ibland skiftande flöden som fanns under testerna och bidrog till låg kvalitet på testdata.

5
Contents
1 Introduction 7
2 Objectives 9
3 Scope 113.1 Boreholes tested 113.2 Tests performed 123.3 Equipment check 12
4 Description of equipment 134.1 Overview 134.2 Measurement sensors 13
5 Execution 155.1 Preparations 155.2 Procedure 155.3 Data handling 155.4 Analyses and interpretation 155.5 Nonconformities 16
6 Results 176.1 Nomenclature and symbols 176.2 Interference test 1 in SSM000224 17
6.2.1 Pumping borehole SSM000224: 0–17 m 176.2.2 Observation borehole SSM000225: 0–10 m 196.2.3 Observation borehole SSM000031: 0–4 m 20
6.3 Interference test 2 in SSM000220 216.3.1 Pumping borehole SSM000220: 0–3 m 226.3.2 Observation borehole SSM000221: 0–3 m 24
6.4 Interference test 3 in SSM000228 256.4.1 Pumping borehole SSM000228: 0–13 m 256.4.2 Observation borehole SSM000229: 0–7 m 25
6.5 Interference test 4 in SSM000261 286.5.1 Pumping borehole SSM000261: 0–10 m 286.5.2 Observation borehole SSM000260: 0–10 m 306.5.3 Observation borehole SSM000030: 0–8 m 31
6.6 Interference test 5 in SSM000263 326.6.1 Observation borehole SSM000041: 0–5 m 34
6.7 Interference test 6 in SSM000265 356.7.1 Pumping borehole SSM000265: 0–6 m 366.7.2 Observation borehole SSM000266: 0–4 m 38
6.8 Single hole test in SSM000223 396.8.1 Pumping borehole SSM000223: 0–12 m 39
6.9 Single hole test in SSM000236 416.9.1 Pumping borehole SSM000236: 0–6 m 41
6.10 Response analysis 436.11 Transient evaluation 46
6.11.1 Pumping boreholes 466.11.2 Observation boreholes 46
6.12 Summary of the results of the interference tests 47
7 References 49
Appendix 1 List of test data files 51
Appendix 2 Test diagrams and meteorological data 53

7
1 Introduction
This report documents the results from 6 hydraulic interference tests and 2 single hole pumping tests performed within the site investigation at Oskarshamn. They were performed in order to acquire transmissivity and storativity values for the tested boreholes. The locations of the boreholes involved in the pumping- and interference tests are shown in Figure 1-1. The tests were carried out in May of 2007 by Geosigma AB.
6 interference tests using different soil monitoring wells for pumping boreholes were performed. In each of the interference tests one or two soil monitoring wells were used as observation boreholes for the interference tests. Three single-hole tests in soil monitoring wells were also supposed to be carried out. Due to the absence of water in one of the boreholes (SSM000217) only two single-hole tests were however performed.
The pumping- and interference tests were conducted in accordance with Activity Plan AP PS 400-06-124. In Table 1-1, controlling documents for the performance of this activity are listed. Both the Activity Plan and Method Descriptions are internal controlling documents of SKB.

8
Figure 1-1. Map showing the boreholes included in the pumping- and interference tests performed within the activity reported in this paper.
Table 1‑1. Controlling documents for the performance of the activity.
Activity Plan Number VersionPump- och interferenstester i jordrör på Laxemar, våren 2007
AP PS 400-06-124 1.0
Method documents Number VersionInstruktion för analys av injektions- och enhålspumptester
SKB MD 320.004 1.0
Metodbeskrivning för interferenstester SKB MD 330.003 1.0

9
2 Objectives
The main aim of hydraulic interference tests is to get support for interpretations of geologic structures in regard to their hydraulic and geometric properties deduced from single-hole tests. Furthermore, an interference test may provide information about the hydraulic connectivity and hydraulic boundary conditions within the tested area. Finally, interference tests make up the basis for calibration of numerical models of the area.
The interference tests, performed within the activity described in this report were mainly performed in order to characterize the soil with respect to their hydraulic conductivity and storativity. The main purpose of the performed single hole tests were to obtain a T-value for the respective boreholes.
The interference tests were performed by pumping in different soil monitoring wells and monitoring pressure responses in other adjacent soil monitoring wells.All boreholes monitored for responses are part of the Oskarshamn HMS, the Hydro Monitoring System.

11
3 Scope
3.1 Boreholes testedTechnical data of the boreholes tested are presented in Table 3-1. One of the boreholes that, in the Activity Plan, were intended to be included for single hole testing were not tested due to the absence of water in that borehole. In this report boreholes are presented in the same order as they were in the Activity report. The order in which they were later tested is not the same as they are presented in this report. The reference point in the boreholes is always top of casing (ToC). In Table 3-1 is also presented Transmissivity values from slug tests performed prior to the pumping- and interference tests reported here. The last column shows the distance from the pumping borehole two involved observation boreholes.
Table 3‑1. Pertinent technical data of the tested boreholes.
Test number Bh ID Type of borehole (observation or pumping)
Elevation of top of casing (ToC) (m.a.s.l.)
Drilled length of borehole (m)
Casing/ Bh‑diam. (m)
Transmissivity (m2/s) 2)
Distance to pumping borehole (m)
1 (Interference) SSM000225 Observation 6.94 10.10 0.050 3E–03 3) 2.5Site 1 4) SSM000224 Pumping 6.90 17.20 0.050 1E–03 3) 0
SSM000031 Observation 6.32 4.10 0.050 1.2E–04 112
2 (Interference) SSM000220 Pumping 13.13 3.10 0.050 1.3E–03 0Site 2 4) SSM000221 Observation 13.17 3.10 0.050 2.1E–04 53
3 (Interference) SSM000228 Pumping 13.09 13.00 0.050 1.40E–04 0Site 3 4) SSM000229 Observation 13.68 7.30 0.050 8.00E–05 28
4 (Interference) SSM000260 Observation 10.80 9.67 0.050 1.5E–04 82.9Site 4 4) SSM000261 Pumping 10.65 10.50 0.050 6.7E–05 0
SSM000030 Observation 11.19 8.20 0.050 – 83.5
5 (Interference) SSM000263 Pumping 4.63 9.10 0.050 4.8E–04 0Site 5 4) SSM000041 Observation 4.15 4.60 0.050 – 69.9
6 (Interference) SSM000265 Pumping 6.73 5.90 0.050 – 0Site 6 4) SSM000266 Observation 6.78 4.47 0.050 1.9E–06 15.7
7 1) (Single hole) SSM000217 Pumping 12.58 4.90 0.050 – –Site 7 4)
8 (Single hole) SSM000223 Pumping 13.69 12.30 0.050 – –Site 7 4)
9 (Single hole) SSM000236 Pumping 16.37 5.90 0.050 – –Site 7 4)
1) Test not performed due to lack of water in borehole.2) Transmissivity values from previously performed tests.3) Estimated transmissivity values.4) Site as given in Figure 1-1.

12
3.2 Tests performedThe borehole sections involved in the performed tests are listed in Table 3-2. The times referred to in Table 3-2 are the chosen start and stop times of downloaded data files used for evaluation. Alternatively, for the pumping boreholes, the times referred to are the relevant times included in the original file produced by the data logger. The amount of data extracted from HMS, the Hydro Monitoring System, from the observation boreholes was chosen so as to receive an appropriate amount of data that would correspond to available data from the pumping boreholes, as well as giving adequate information about the pressure conditions prior to as well as after the performed interference test. HMS is registering pressure continuously.
The test performance was according to the Geosigma quality plan (“Kvalitetsplan för SKB uppdrag – Pump- och interferenstester i jordrör på Laxemar, våren 2007, K587029, Kristoffer Gokall-Norman, 2007-03-08”, Geosigma and SKB internal controlling document) and according to the methodology description for interference tests, SKB MD 330.003. However, no response matrix was prepared.
As the point of application, the midpoints of the borehole sections were chosen. A more strict calculation would use the midpoint of the test sections (filter screens) for the calculations. However, since the boreholes are not very deep and all were drilled approximately vertically, this does not significantly influence the results.
3.3 Equipment checkAn equipment check was performed at the Geosigma engineering workshop in Uppsala as well as at the site as a simple and fast test to establish the operating status of sensors and other equipment.
Table 3‑2. Borehole sections involved in the interference tests, see also Figure 1‑1.
Site no. Bh ID Test section (m)
Test type1)
Test config. Test start date and time (YYYY‑MM‑DD tt:mm)
Test stop date and time (YYYY‑MM‑DD tt:mm)
Site 1 SSM000225 9–10 2 Open borehole 2007-05-03 16:22 2007-05-04 14:07SSM000224 16–17 1B Open borehole 2007-05-03 16:22 2007-05-04 14:07SSM000031 3–4 2 Open borehole 2007-05-03 16:22 2007-05-04 14:07
Site 2 SSM000220 2–3 1B Open borehole 2007-05-07 13:25:31 2007-05-10 10:24:11SSM000221 2–3 2 Open borehole 2007-05-07 13:25:31 2007-05-10 10:24:11
Site 3 SSM000228 6–7 1B Open borehole 2007-05-09 11:58:49 2007-05-14 09:07:51SSM000229 3–4 2 Open borehole 2007-05-09 11:58:49 2007-05-14 09:07:51
Site 4 SSM000260 7.4–9.4 2 Open borehole 2007-05-02 12:04:06 2007-05-07 09:41:53SSM000261 9.2–10.2 1B Open borehole 2007-05-02 12:04:06 2007-05-07 09:41:53SSM000030 4–5 2 Open borehole 2007-05-02 12:04:06 2007-05-07 09:41:53
Site 5 SSM000263 6.3–8.3 1B Open borehole 2007-05-02 15:45:01 2007-05-07 08:16:46SSM000041 2–4 2 Open borehole 2007-05-02 15:45:01 2007-05-07 08:16:46
Site 6 SSM000265 3.6–5.6 1B Open borehole 2007-05-07 07:46:09 2007-05-10 11:03:49SSM000266 3–4 2 Open borehole 2007-05-07 07:46:09 2007-05-10 11:03:49
Site 7 SSM000217 2) 2–4 – – – –
Site 7 SSM000223 6–8 1B Open borehole 2007-05-09 17:11:43 2007-05-11 07:54:13
Site 7 SSM000236 2–3 1B Open borehole 2007-05-10 10:42:06 2007-05-11 09:01:51
1) 1B: Pumping test-submersible pump, 2: Interference test.2) Borehole not tested.

13
4 Description of equipment
4.1 OverviewThe equipment in the pumping boreholes consisted primarily of the following parts:
• Amotordriven(petrol)suctionpump.
• Suctionhosethatwasloweredintothepumpingboreholes.
• Plastichosefortransportingthepumpedwaterawayfromthepumpingborehole.
• 1pressuretransducerintheborehole(miniTrollorLevelTroll).
• Flowmeteratthesurface.
• Flowratecontrolvalveatthesurface.
• PCtovisualizethedata.
All the observation boreholes included in the interference tests are part of the SKB hydro monitoring system (HMS), where pressure is recorded continuously.
For the single hole pumping tests miniTroll or LevelTroll pressure loggers were used to monitor water levels. On one occasion the logger had to be brought to the site (SSM000236). On the other occasion a logger was already in place as a part of the HMS-system.
The estimated lower and upper practical measurement limits for the actual equipment used for the interference test, expressed in terms of specific flow (Q/s), are Q/s–L = 4·10–7 m2/s and Q/s–U = 2·10–1 m2/s, respectively.
4.2 Measurement sensorsTechnical data of the sensors used together with estimated data specifications of the test system for pumping tests are given in Table 4-1.
The pressure loggers were provided by SKB and are part of the HMS system and their technical specifications are not given here.
Table 4-2 shows the type and position for each transducer used in the test. Positions are given in metre from reference point, i.e. top of casing (ToC). Positions are approximate.
Table 4‑1. Technical data of measurement sensors used as well as estimated data specifications of the test system for pumping tests (based on current laboratory and field experiences).
Technical specification
Parameter Unit Sensor Test system Comments
Flow rate (surface) Output signal
Meas. range
Resolution
Accuracy
mA
L/min
L/min
% o.r.**
4–20
1–300
0.1
± 0.5
1–c. 200
0.5
± 0.5
Passive
Pumping tests
* Includes hysteresis, linearity and repeatability.
** Maximum error in % of actual reading (% o.r.).

14
Table 4‑2. Type and position of pressure sensors (position from ToC) used in the pumping boreholes of the performed pumping‑ and interference tests.
Borehole information Sensors
ID Test interval (m)
Test configuration Test type1)
Type Position (m b ToC)
SSM000224 0–17 Open borehole 1B HMS 8SSM000220 0–3 Open borehole 1B HMS 3SSM000228 0–13 Open borehole 1B HMS 7SSM000261 0–10 Open borehole 1B HMS 10SSM000263 0–9 Open borehole 1B HMS 8SSM000265 0–6 Open borehole 1B HMS 5.7SSM000223 0–12 Open borehole 1B HMS 8SSM000236 0–6 Open borehole 1B Absolute pressure 3
1) 1B: Pumping test-submersible pump.

15
5 Execution
5.1 PreparationsManual measurements made in the field showed that the flow meters (two were used) were accurate. Before the tests, function checks and cleaning of equipment were performed according to the Activity Plan.
5.2 ProcedureThe performed interference tests were carried out as constant flow rate tests followed by a subsequent pressure recovery period. The pressure interference was recorded in totally one or two observation boreholes for each of the interference tests. All of the observation boreholes are part of the HMS (Hydro Monitoring System). The flow rate in the pumping borehole was estimated based on the results from earlier slug tests (if available, cf. Table 3-1). Since the assumptions were not always correct the time to reach an approximately constant flow rate was sometimes long. The flow rate was manually adjusted by a control valve and monitored by an electromagnetic flow meter. No logging of the flow was done. The flow period spanned between 8 hours and 2 days in the different boreholes. The subsequent recovery period lasted for approximately 8 to 12 hours.
The discharged water from the pumping borehole was led into a nearby stream, ditch or wetland appointed by personnel from SKB.
The sampling rate of the pressure loggers in the different pumping- and observation boreholes were set at every 5 seconds prior to the start of the test.
5.3 Data handlingBorehole water level data from all boreholes included in the test were downloaded from HMS and processed in a suitable fashion before used in the evaluation process. All data taken from the HMS is compensated for barometric changes.
5.4 Analyses and interpretation When performed, both qualitative and quantitative analyses have been carried out in accordance with the methodology descriptions for interference tests, SKB MD 330.003, and are reported in Chapter 6 below. Methods for constant-flow rate tests in an equivalent porous medium were used by the analyses and interpretation of the tests.
The main objective of the interference tests was to derive transmissivity and storativity values for the different boreholes. The borehole sections included in the interference tests were also qualitatively analysed, mainly by means of the response analysis reported in Section 6 below.
Data from all available observation boreholes were used in the primary qualitative analyses. The qualitative analysis of the responses from the interference tests in the different pumping boreholes were primarily based on time versus pressure diagrams together with response diagrams. Linear diagrams of pressure versus time for all tested boreholes are presented in Chapter 6.

16
Different values were applied on the filter coefficient (step length) by the calculation of the pressure derivative to investigate the effect of this coefficient on the derivative. It is desired to achieve maximum smoothing of the derivative without altering the original shape of the data.
For the quantitative evaluation a method applying partial penetration was used. Here only the section of the boreholes that is fitted with the filter screen is considered for water penetration.
Quantitative evaluation was undertaken for all responding sections included in the test. There were however only 4 observation boreholes that did respond to the corresponding pumping: From test 1, observation borehole SSM000225, from test 4, observation boreholes SSM000030 and SSM000260 and from test 6, observation borehole SSM000266. In the rest of the observation boreholes no response to pumping could be found, alternatively there seemed to be something faulty with the loggers. For more detailed information on each test, see Section 6.2 through 6.10. In addition, the responses in the pumping boreholes were evaluated as a single-hole pumping tests.
The quantitative transient analysis was performed by a special version of the test analysis software AQTESOLV that enables both visual and automatic type curve matching. The transient evaluation was carried out as an iterative process of type curve matching and automatic non-linear regression. The quantitative, transient interpretation of the hydraulic parameters (transmissivity and storativity) is normally based on the identified pseudo-radial flow regime during the tests in log-log and lin-log data diagrams.
For the single-hole pumping tests the storativity was either chosen from the results from the corresponding interference test or estimated individually. The first estimation of storativity was however always chosen at 0.05.
5.5 Nonconformities• Duetothefactthatnocapacitytestswereperformedinthepumpingboreholespriorto
pumping start, the adjustments to reach the intended constant flow rate took longer time than predicted in some cases.
• DuetoaverylowwaterlevelinSSM000217,thisholewasexcludedfromthetests.
• Ontwooccasionsthepumpstoppedforashortperiodoftime.Thisisnotbelievedto influence the test more than slightly.
17
6 Results
6.1 Nomenclature and symbols The nomenclature and symbols used for the results of the single-hole and interference test are according to the Instruction for analysis of single-hole injection- and pumping tests (SKB MD 320.004) and the methodology description for interference tests (SKB MD 330.003), respectively (both are SKB internal controlling documents). Additional symbols used are explained in the text.
6.2 Interference test 1 in SSM000224Pumping started on May, 3 and lasted for about 10 hours. The following recovery period continued for another 8 hours.
During the interference test the pressure was registered in two observation boreholes, soil moni-toring wells SSM000225 and SSM000031. The pressure responses in the monitored observation boreholes are presented in Figures 6-2 and 6-3. All observation boreholes included in the test are marked in Figure 1-1.
Visual inspection of the pressure responses in the observation boreholes, presented in Figures 6-2 and 6-3, show that a significant response was only registered in one of the observation boreholes. The measured drawdowns (sp) at the end of the flow period and the estimated response time lags (dtL) in all of the observation boreholes are shown in Tables 6-17 and 6-18, respectively. The response time is defined as the time lag after start of pumping until a drawdown response of 0.01 m was observed in the actual observation borehole.
The data retrieved from the HMS have been corrected for atmospheric pressure. It should be observed that no further corrections of the measured drawdown have been made, e.g. due to natural trends, precipitation, tidal effects etc, as discussed below. All times presented are Swedish summer times, i.e. adjustment for daylight saving time has been made for any reported times.
No precipitation was reported during the interference test, see also Figure A2-21. In the figure also the air pressure during the interference test period is included.
The pressure in one of the observation boreholes included in the interference test was displaying an oscillating behaviour. This is believed to be naturally caused by so called tidal fluctuations or earth tides, possibly in combination with changes of the sea water level. These phenomena have, to some extent, been investigated previously in /3/.
It should be noted that the evaluated estimations from the interference tests are uncertain due to weak responses and sometimes unsteady flow rates which produced low quality test data.
6.2.1 Pumping borehole SSM000224: 0–17 mGeneral test data for the pumping test in SSM000224 are presented in Table 6-1. A filter screen is installed between 16 and 17 m along the borehole.

18
Table 6‑1. General test data for the pumping test in SSM000224: 0–17 m.
General test data
Pumping borehole SSM000224Test type1) Constant Rate withdrawal and recovery testTest section (open borehole/packed-off section): open boreholeTest no 1Field crew (GEOSIGMA AB)Test equipment systemGeneral comment Interference test
Nomenclature Unit Value
Borehole length L m 17.20Casing length Lc m –Test section- secup Secup m 0.00Test section- seclow Seclow m 17.20Test section length Lw m 17.20Test section diameter2) 2·rw mm 50Test start (start of pressure registration) yymmdd hh:mm 070503 16:22Packer expanded yymmdd hh:mm:ss –Start of flow period yymmdd hh:mm:ss 070503 20:01:02Stop of flow period yymmdd hh:mm:ss 070504 05:54:07Test stop (stop of pressure registration) yymmdd hh:mm 070504 14:07Total flow time tp min 593Total recovery time tF min 493
Pressure data
Hydraulic head in tested borehole before start of flow period hi m.a.s.l. 5.33Hydraulic head in tested borehole before stop of flow period hp m.a.s.l. 4.05Hydraulic head in tested borehole at stop of recovery period hF m.a.s.l. 5.31Hydraulic head change during flow period (hi–hp) dhp m 1.28
Flow data
Flow rate from test section just before stop of flow period 3) Qp m3/s 0.00233Mean (arithmetic) flow rate during flow period Qm m3/s 0.00232Total volume discharged during flow period Vp m3 82.7
Manual groundwater level measurements in SSM000224 (0–17 m) GW levelDate YYYY‑MM‑DD
Time tt:mm
Time (min)
(m b ToC) (m.a.s.l.)
2007-05-03 19:02 160 1.56 5.342007-05-04 09:14 1,012 1.58 5.32
1) Constant Head injection and recovery or Constant Rate withdrawal and recovery.2) Nominal diameter.
Comments on the test
The test was performed as a constant-flow rate pumping test. The mean flow rate was c. 139 L/min and the duration of the flow period was c. 10 hours. A slowly decreasing trend is dominating the entire flow period. The adjustment to reach a suitable flow rate quickly was made complicated by the fact that no capacity test had been performed in the borehole prior to the interference test. The recovery was measured for about 8 hours. An overview of the pressure response in SSM000224 is presented in Figure 6-1. The pressure responses in log-log and lin-log diagrams during the flow period are presented in Figures A2-1 and A2-2 in Appendix 2.

19
6.2.2 Observation borehole SSM000225: 0–10 m In Figure 6-2 an overview of the pressure responses in observation borehole SSM000225 is shown. General test data from the observation borehole SSM000225, 0–10 m, are presented in Table 6-2. A filter screen is installed between 9 and 10 m along the borehole.
Comments on the test
A very quick response to pumping is indicated in this section. But the total drawdown during the flow period was still only c. 0.05 m. A drawdown of 0.01 m was reached approximately 49 seconds after start of pumping in SSM000224. There was a total recovery of c. 0.03 m during the recovery period lasting for approximately 8 hours.
Table 6‑2. General test data from the observation borehole SSM000225: 0–10 m during the interference test in SSM000224.
Pressure data Nomenclature Unit Value
Hydraulic head in tested borehole before start of flow period hi m.a.s.l. 5.34Hydraulic head in tested borehole before stop of flow period hp m.a.s.l. 5.29Hydraulic head in tested borehole at stop of recovery period hF m.a.s.l. 5.31Hydraulic head change during flow period (hi–hp) dhp m 0.05
2007-05-02 2007-05-03 2007-05-03 2007-05-04 2007-05-04 2007-05-04
3.6
4
4.4
4.8
5.2
5.6
Bor
ehol
e w
ater
leve
l (m
.a.s
.l.)
Mean flow rate: c. 139 L/min
Pumping start: 2007-05-03 20:01:02Pumping stop: 2007-05-04 05:54:07
SSM000224
Figure 6-1. Linear plot of pressure (borehole water level) versus time in the pumping borehole SSM000224 during interference test 1.

20
6.2.3 Observation borehole SSM000031: 0–4 m In Figure 6-3 an overview of the pressure responses in observation borehole SSM000031 is shown. General test data from the observation borehole SSM000031, 0–4 m, are presented in Table 6-3. A filter screen is installed between 3 and 4 m along the borehole.
Comments on the test
No response to the pumping in SSM000224 is detected in this section. At a first glance it would appear that there is a response since the pressure is falling at the time of start of pumping and then rising again at the start of recovery. But when analyzing the data at times before and after the test, it is apparent that the shape of the curve is just caused by natural fluctuations. No evalu-ation for hydrological parameters has been performed on this section.
Table 6‑3. General test data from the observation borehole SSM000031: 0–4 m during the interference test in SSM000224.
Pressure data Nomenclature Unit Value
Hydraulic head in tested borehole before start of flow period hi m.a.s.l. 5.21Hydraulic head in tested borehole before stop of flow period hp m.a.s.l. 5.20Hydraulic head in tested borehole at stop of recovery period hF m.a.s.l. 5.23Hydraulic head change during flow period (hi–hp) dhp m 0.01
2007-05-02 2007-05-03 2007-05-03 2007-05-04 2007-05-04 2007-05-04
5.28
5.32
5.36
5.4B
oreh
ole
wat
er le
vel (
m.a
.s.l.
)
Pumping start2007-05-03 20:01:02
Pumping stop2007-05-04 05:54:07
Test stop2007-05-04 14:33:47
SSM000225
Figure 6-2. Linear plot of pressure (borehole water level) versus time in the observation borehole SSM000225 during the interference test in SSM000224.

21
6.3 Interference test 2 in SSM000220Pumping started on May, 7 and lasted for about 46 hours. The following recovery period continued for another 20 hours.
During the interference test the pressure was registered in one observation borehole, soil monitoring well SSM000221. The pressure response in the monitored observation borehole is presented in Figure 6-5. All boreholes included in the test are marked in Figure 1-1.
Visual inspection of the pressure responses in the observation boreholes, presented in Figure 6-5 show that no significant response was detected in the observation borehole.
The data retrieved from the HMS have been corrected for atmospheric pressure. It should be observed that no further corrections of the measured drawdown have been made, e.g. due to natural trends, precipitation, tidal effects etc. All times presented are Swedish summer times, i.e. adjustment for daylight saving time has been made for any reported times.
During the interference test c. 6.5 mm of rain was measured. Most of it fell during the drawdown period but approximately 2 mm of precipitation was noted also during the beginning of the recovery period, see also Figure A2-21. In the figure also the air pressure during the interference test period is included.
2007-04-30 2007-05-02 2007-05-04 2007-05-06 2007-05-08
5.1
5.2
5.3
5.4
Pumping stop2007-05-04 05:54:07
Pumping start2007-05-03 20:01:02
Test stop2007-05-04 14:07:00
Bor
ehol
e w
ater
leve
l (m
.a.s
.l.)
SSM00031
Figure 6-3. Linear plot of pressure (borehole water level) versus time in the observation borehole SSM000031 during the interference test in SSM000224.
22
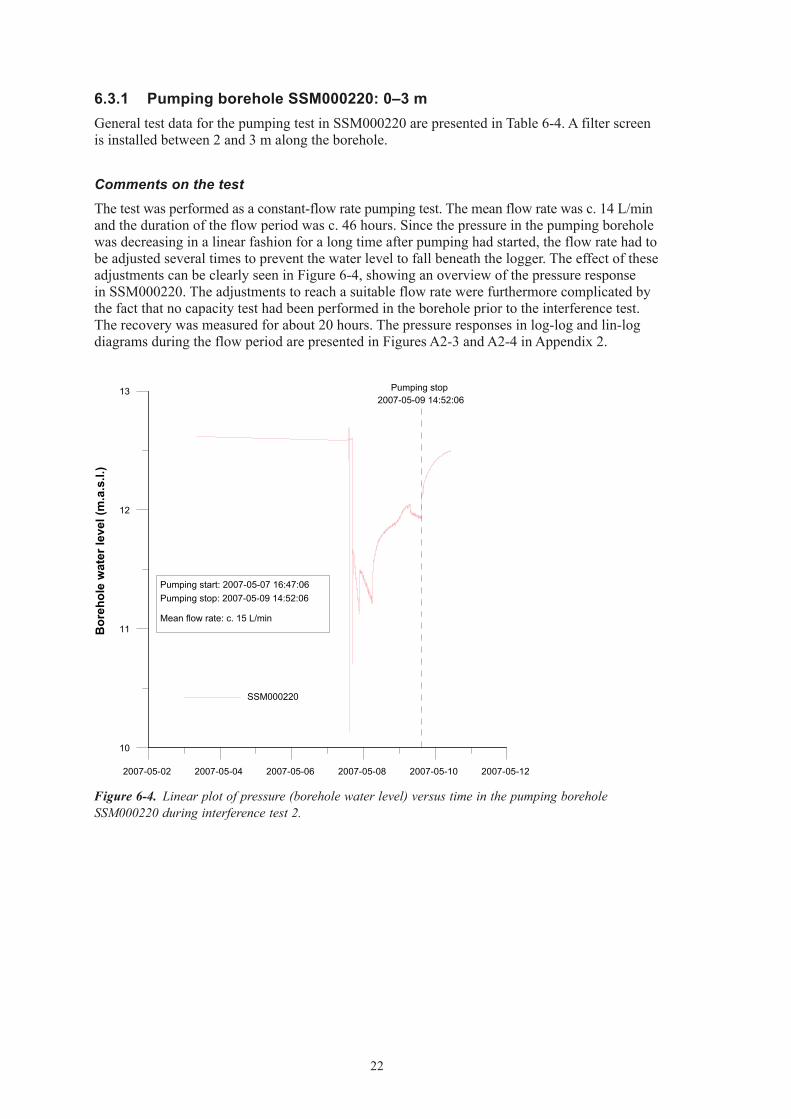
6.3.1 Pumping borehole SSM000220: 0–3 mGeneral test data for the pumping test in SSM000220 are presented in Table 6-4. A filter screen is installed between 2 and 3 m along the borehole.
Comments on the test
The test was performed as a constant-flow rate pumping test. The mean flow rate was c. 14 L/min and the duration of the flow period was c. 46 hours. Since the pressure in the pumping borehole was decreasing in a linear fashion for a long time after pumping had started, the flow rate had to be adjusted several times to prevent the water level to fall beneath the logger. The effect of these adjustments can be clearly seen in Figure 6-4, showing an overview of the pressure response in SSM000220. The adjustments to reach a suitable flow rate were furthermore complicated by the fact that no capacity test had been performed in the borehole prior to the interference test. The recovery was measured for about 20 hours. The pressure responses in log-log and lin-log diagrams during the flow period are presented in Figures A2-3 and A2-4 in Appendix 2.
2007-05-02 2007-05-04 2007-05-06 2007-05-08 2007-05-10 2007-05-12
10
11
12
13
Pumping start: 2007-05-07 16:47:06Pumping stop: 2007-05-09 14:52:06
Mean flow rate: c. 15 L/min
Pumping stop2007-05-09 14:52:06
Bor
ehol
e w
ater
leve
l (m
.a.s
.l.)
SSM000220
Figure 6-4. Linear plot of pressure (borehole water level) versus time in the pumping borehole SSM000220 during interference test 2.

23
Table 6‑4. General test data for the pumping test in SSM000220: 0–3 m.
General test data
Pumping borehole SSM000220Test type1) Constant Rate withdrawal and recovery testTest section (open borehole/packed-off section): open boreholeTest no 1Field crew (GEOSIGMA AB)Test equipment systemGeneral comment Pumping test
Nomenclature Unit Value
Borehole length L m 3.10Casing length Lc m –Test section- secup Secup m 0.00Test section- seclow Seclow m 3.10Test section length Lw m 3.10Test section diameter2) 2·rw mm 50Test start (start of pressure registration) yymmdd hh:mm 070507 13:25Packer expanded yymmdd hh:mm:ss –Start of flow period yymmdd hh:mm:ss 070507 16:47:06Stop of flow period yymmdd hh:mm:ss 070509 14:52:06Test stop (stop of pressure registration) yymmdd hh:mm 070510 10:24:11Total flow time tp min 2,765Total recovery time tF min 1,172
Pressure data
Hydraulic head in tested borehole before start of flow period hi m.a.s.l. 12.60Hydraulic head in tested borehole before stop of flow period hp m.a.s.l. 11.93Hydraulic head in tested borehole at stop of recovery period hF m.a.s.l. 12.50Hydraulic head change during flow period (hi–hp) dhp m 0.67
Flow data
Flow rate from test section just before stop of flow period 3) Qp m3/s 0.000167Mean (arithmetic) flow rate during flow period Qm m3/s 0.000238Total volume discharged during flow period Vp m3 41.5
Manual groundwater level measurements in SSM000220 (0–3 m) GW level
Date YYYY‑MM‑DD
Time tt:mm
Time (min)
(m b ToC) (m.a.s.l.)
2007-05-07 12:44 –42 0.54 12.59
1) Constant Head injection and recovery or Constant Rate withdrawal and recovery.2) Nominal diameter.

24
6.3.2 Observation borehole SSM000221: 0–3 m In Figure 6-5 an overview of the pressure responses in observation borehole SSM000221 is shown. General test data from the observation borehole SSM000221, 0–3 m, are presented in Table 6-5. A filter screen is installed between 2 and 3 m along the borehole.
Comments on the test
A slightly decreasing trend is present prior to the test start in this section. Just before the start of pumping the pressure suddenly rises and is then approximately constant for the duration of the pumping period, where after it appears to return to its decreasing trend. At first it would seem that the rise of the water level is associated with the start of pumping. When viewing the data closer, however, it is obvious that the sudden pressure change is introduced some time before the start of pumping, making association impossible. A theory would be that the pressure logger slid down a bit at the time the logging interval was reset to a higher frequency. The appearance of the curve after this time is not likely to be caused by the pumping in SSM000220. No response to pumping can thus be detected in this borehole and therefore no qualitative or quantitative evaluation of this section has been performed.
Table 6‑5. General test data from the observation borehole SSM000221: 0–3 m during the interference test in SSM000224.
Pressure data Nomenclature Unit Value
Hydraulic head in tested borehole before start of flow period hi m.a.s.l. 12.64Hydraulic head in tested borehole before stop of flow period hp m.a.s.l. 12.65Hydraulic head in tested borehole at stop of recovery period hF m.a.s.l. 12.63Hydraulic head change during flow period (hi–hp) dhp m –0.01
2007-04-28 2007-05-02 2007-05-06 2007-05-10 2007-05-14
12.6
12.64
12.68
12.72
Bor
ehol
e w
ater
leve
l (m
.a.s
.l.)
Pumping stop2007-05-09 14:52:06
Pumping start2007-05-07 16:47:06 Test stop
2007-05-10 10:24:11
SSM000221
Figure 6-5. Linear plot of pressure (borehole water level) versus time in the observation borehole SSM000221 during the interference test in SSM000220.

25
6.4 Interference test 3 in SSM000228Pumping started on May, 9 and lasted for about 46 hours. The following recovery period was measured for another 70 hours.
During the interference test the pressure was registered in one observation borehole, soil monitoring well SSM000221. The pressure response in the monitored observation borehole is presented in Figure 6-7. All boreholes included in the test are marked in Figure 1-1.
Visual inspection of the pressure responses in the observation boreholes, presented in Figure 6-7 show that no significant response was detected in the observation borehole.
The data retrieved from the HMS have been corrected for atmospheric pressure. It should be observed that no further corrections of the measured drawdown have been made, e.g. due to natural trends, precipitation, tidal effects etc. All times presented are Swedish summer times, i.e. adjustment for daylight saving time has been made for any reported times.
It was raining during the entire interference test. Approximately 10 mm of total precipitation was measured on a nearby meteorological station. See also Figure A2-21. In the figure also the air pressure during the interference test period is included.
6.4.1 Pumping borehole SSM000228: 0–13 mGeneral test data for the pumping test in SSM000228 are presented in Table 6-6. A filter screen is installed between 6 and 7 m along the borehole.
Comments on the test
The test was performed as a constant-flow rate pumping test. The mean flow rate was c. 15 L/min and the duration of the flow period was c. 46 hours. The flow rate had to be adjusted several times during the test to stay approximately constant. The effects of changes that appeared over night and the adjustments to rectify these changes can be observed in Figure 6-6 which shows an overview of the pressure response in SSM000228. The adjustments to reach a suitable flow rate were furthermore complicated by the fact that no capacity test had been performed in the borehole prior to the interference test. The recovery was measured for about 69 hours. The pressure responses in log-log and lin-log diagrams during the flow period are presented in Figures A2-5 and A2-6 in Appendix 2.
6.4.2 Observation borehole SSM000229: 0–7 m In Figure 6-7 an overview of the pressure responses in observation borehole SSM000229 is shown. General test data from the observation borehole SSM000229, 0–7 m, are presented in Table 6-7. A filter screen is installed between 3 and 4 m along the borehole.
Comments on the test
A stark decreasing trend is evident in this observation borehole. It starts well before the start of the test and goes on throughout the duration of the interference test. It seems very unlikely that the section is affected by the pumping in SSM000228 judging from the appearance of the diagram. It is however quite possible that the pressure logger that was installed in SSM000229 was out of order and simply could not detect the pressure changes that was introduced by the pumping. It is thus impossible to make a fair estimation of weather this observation borehole is influenced by the pumping or not. Thus neither a qualitative nor quantitative evaluation of this section has been performed.

26
Table 6‑6. General test data for the pumping test in SSM000228: 0–13 m.
General test data
Pumping borehole SSM000228Test type1) Constant Rate withdrawal and recovery testTest section (open borehole/packed-off section): open boreholeTest no 1Field crew (GEOSIGMA AB)Test equipment systemGeneral comment Interference test
Nomenclature Unit Value
Borehole length L m 13.00Casing length Lc m –Test section- secup Secup m 0.00Test section- seclow Seclow m 13.00Test section length Lw m 13.00Test section diameter2) 2·rw mm 50Test start (start of pressure registration) yymmdd hh:mm 070509 11:58Packer expanded yymmdd hh:mm:ss –Start of flow period yymmdd hh:mm:ss 070509 14:16:11Stop of flow period yymmdd hh:mm:ss 070511 12:06:16Test stop (stop of pressure registration) yymmdd hh:mm 070514 09:07Total flow time tp min 2,750Total recovery time tF min 4,142
Pressure data
Hydraulic head in tested borehole before start of flow period hi m.a.s.l. 10.24Hydraulic head in tested borehole before stop of flow period hp m.a.s.l. 7.24Hydraulic head in tested borehole at stop of recovery period hF m.a.s.l. 10.24Hydraulic head change during flow period (hi–hp) dhp m 3.00
Flow data
Flow rate from test section just before stop of flow period Qp m3 /s 0.000283Mean (arithmetic) flow rate during flow period Qm m3 /s 0.000249Total volume discharged during flow period Vp m3 41.2
Manual groundwater level measurements in SSM000228 (0–13 m) GW level
Date YYYY‑MM‑DD
Time tt:mm
Time (min)
(m b ToC) (m.a.s.l.)
2007-05-09 13:49 110 2.85 10.242007-05-11 12:38 2,919 2.92 10.17
1) Constant Head injection and recovery or Constant Rate withdrawal and recovery.2) Nominal diameter.

27
2007-05-06 2007-05-08 2007-05-10 2007-05-12 2007-05-14
6
8
10
12
14
Bor
ehol
e w
ater
leve
l (m
.a.s
.l.)
Pumping start: 2007-05-09 14:16:11Pumping stop: 2007-05-11 12:06:16
Mean flow rate: c. 15 L/min
Pumping stop2007-05-11 12:06:16
SSM000228
Figure 6-6. Linear plot of pressure (borehole water level) versus time in the pumping borehole SSM000228 during interference test 3.
2007-04-28 2007-05-02 2007-05-06 2007-05-10 2007-05-14 2007-05-18
11.1
11.2
11.3
11.4
11.5
Bor
ehol
e w
ater
leve
l (m
.a.s
.l.)
Pumping stop2007-05-11 12:06:16
Pumping start2007-05-09 14:16:11
Test stop2007-05-14 09:07:51
SSM000229
Figure 6-7. Linear plot of pressure (borehole water level) versus time in the observation borehole SSM000229 during the interference test in SSM000228.
28
6.5 Interference test 4 in SSM000261Pumping started on May, 2nd and lasted for about 45 hours. The following recovery period was measured for another 70 hours.
During the interference test the pressure was registered in two observation boreholes, soil moni-toring wells SSM000260 and SSM000030. The pressure responses in the monitored observation boreholes are presented in Figures 6-9 and 6-10. All boreholes included in the test are marked in Figure 1-1.
Visual inspection of the pressure responses in the observation boreholes, presented in Figures 6-9 and 6-10 show that there are significant responses recorded in both observation boreholes. The measured drawdowns (sp) at the end of the flow period and the estimated response time lags (dtL) in all of the observation boreholes are shown in Tables 6-17 and 6-18, respectively. The response time is defined as the time lag after start of pumping until a drawdown response of 0.01 m was observed in the actual observation borehole.
The data retrieved from the HMS have been corrected for atmospheric pressure. It should be observed that no further corrections of the measured drawdown have been made, e.g. due to natural trends, precipitation, tidal effects etc. All times presented are Swedish summer times, i.e. adjustment for daylight saving time has been made for any reported times.
No precipitation was reported during the interference test. See also Figure A2-21. In the figure also the air pressure during the interference test period is included.
It should be noted that the evaluated estimations from the interference tests are uncertain due to weak responses and sometimes unsteady flow rates which produced low quality test data.
6.5.1 Pumping borehole SSM000261: 0–10 mGeneral test data for the pumping test in SSM000261 are presented in Table 6-8. A filter screen is installed between 9 and 10 m along the borehole.
Comments on the test
The test was performed as a constant-flow rate pumping test. The mean flow rate was c. 8 L/min and the duration of the flow period was c. 45 hours. An overview of the pressure response in SSM000224 is presented in Figure 6-8. The adjustments to quickly reach a suitable flow rate were made more complicated by the fact that no capacity test had been performed in the borehole prior to the interference test. The recovery was measured for about 70 hours. The pressure responses in log-log and lin-log diagrams during the recovery period are presented in Figures A2-7 and A2-8 in Appendix 2.
Table 6‑7. General test data from the observation borehole SSM000229: 0–7 m during the interference test in SSM000228.
Pressure data Nomenclature Unit Value
Hydraulic head in tested borehole before start of flow period hi m.a.s.l. 11.25Hydraulic head in tested borehole before stop of flow period hp m.a.s.l. 11.22Hydraulic head in tested borehole at stop of recovery period hF m.a.s.l. 11.20Hydraulic head change during flow period (hi–hp) dhp m 0.03

29
Table 6‑8. General test data for the pumping test in SSM000261: 0–10 m.
General test data
Pumping borehole SSM000261Test type1) Constant Rate withdrawal and recovery testTest section (open borehole/packed-off section): open boreholeTest no 1Field crew (GEOSIGMA AB)Test equipment systemGeneral comment Interference test
Nomenclature Unit Value
Borehole length L m 10.50Casing length Lc m –Test section- secup Secup m 0.00Test section- seclow Seclow m 10.50Test section length Lw m 10.50Test section diameter2) 2·rw mm 50Test start (start of pressure registration) yymmdd hh:mm 070502 12:04Packer expanded yymmdd hh:mm:ss –Start of flow period yymmdd hh:mm:ss 070502 14:26:03Stop of flow period yymmdd hh:mm:ss 070504 11:37:03Test stop (stop of pressure registration) yymmdd hh:mm 070507 09:41:53Total flow time tp min 2,711Total recovery time tF min 4,205
Pressure data
Hydraulic head in tested borehole before start of flow period hi m.a.s.l. 9.67Hydraulic head in tested borehole before stop of flow period hp m.a.s.l. 5.74Hydraulic head in tested borehole at stop of recovery period hF m.a.s.l. 9.69Hydraulic head change during flow period (hi–hp) dhp m 3.93
Flow data
Flow rate from test section just before stop of flow period Qp m3/s 0.000135Mean (arithmetic) flow rate during flow period Qm m3/s 0.000138Total volume discharged during flow period Vp m3 22.4
Manual groundwater level measurements in SSM000261 (0–10 m) GW level
Date YYYY‑MM‑DD
Time tt:mm
Time (min)
(m b ToC) (m.a.s.l.)
2007-05-02 13:12 68 0.98 9.672007-05-04 12:10 2,886 1.05 9.60
1) Constant Head injection and recovery or Constant Rate withdrawal and recovery.2) Nominal diameter.

30
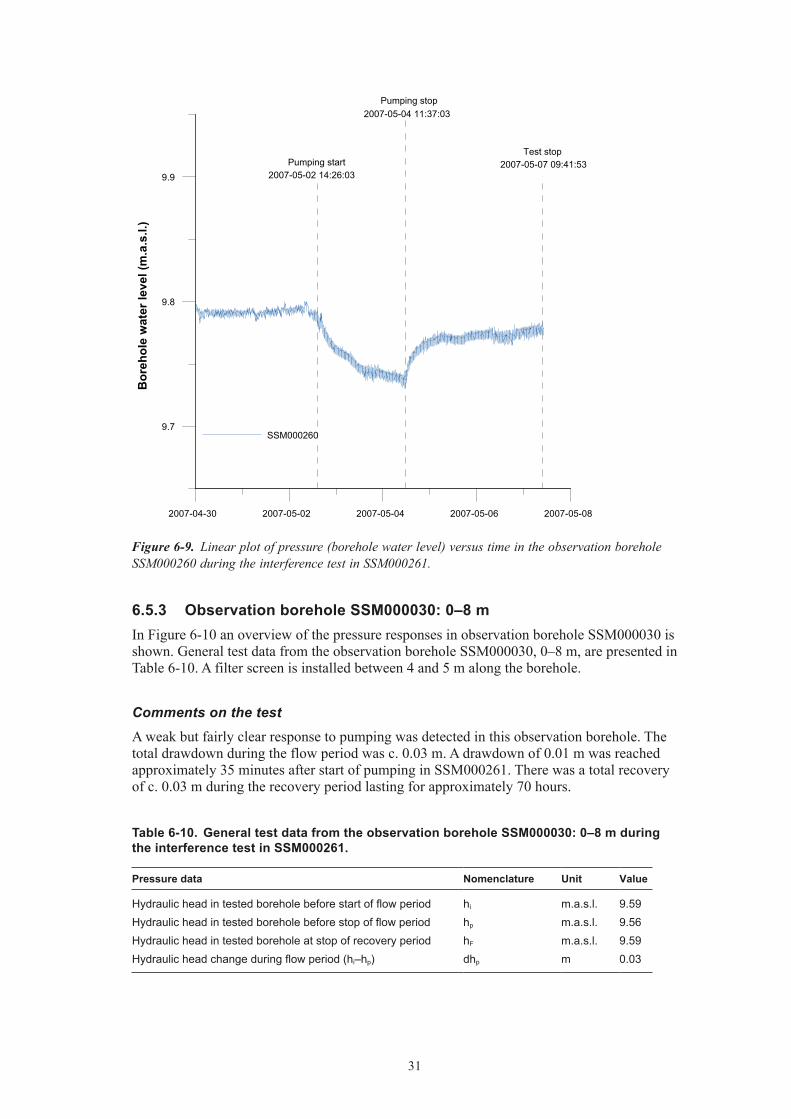
6.5.2 Observation borehole SSM000260: 0–10 m In Figure 6-9 an overview of the pressure responses in observation borehole SSM000260 is shown. General test data from the observation borehole SSM000260, 0–10 m, are presented in Table 6-9. A filter screen is installed between 7.4 and 9.4 m along the borehole.
Comments on the test
A weak but clear response to pumping was detected in this observation borehole. The total drawdown during the flow period was c. 0.06 m. A drawdown of 0.01 m was reached approxi-mately 2.5 hours after start of pumping in SSM000261. There was a total recovery of c. 0.04 m during the recovery period lasting for approximately 70 hours.
2007-05-02 2007-05-04 2007-05-06
4
6
8
10B
oreh
ole
wat
er le
vel (
m.a
.s.l.
)
Pumping start: 2007-05-02 14:26:03Pumping stop: 2007-05-04 11:37:03
Mean flow rate: c. 8.3 L/min
SSM000261
Figure 6-8. Linear plot of pressure (borehole water level) versus time in the pumping borehole SSM000261 during interference test 4.
Table 6‑9. General test data from the observation borehole SSM000260: 0–10 m during the interference test in SSM000261.
Pressure data Nomenclature Unit Value
Hydraulic head in tested borehole before start of flow period hi m.a.s.l. 9.79Hydraulic head in tested borehole before stop of flow period hp m.a.s.l. 9.74Hydraulic head in tested borehole at stop of recovery period hF m.a.s.l. 9.78Hydraulic head change during flow period (hi–hp) dhp m 0.06
31
2007-04-30 2007-05-02 2007-05-04 2007-05-06 2007-05-08
9.7
9.8
9.9
Bor
ehol
e w
ater
leve
l (m
.a.s
.l.)
SSM000260
Pumping start2007-05-02 14:26:03
Pumping stop2007-05-04 11:37:03
Test stop2007-05-07 09:41:53
Figure 6-9. Linear plot of pressure (borehole water level) versus time in the observation borehole SSM000260 during the interference test in SSM000261.
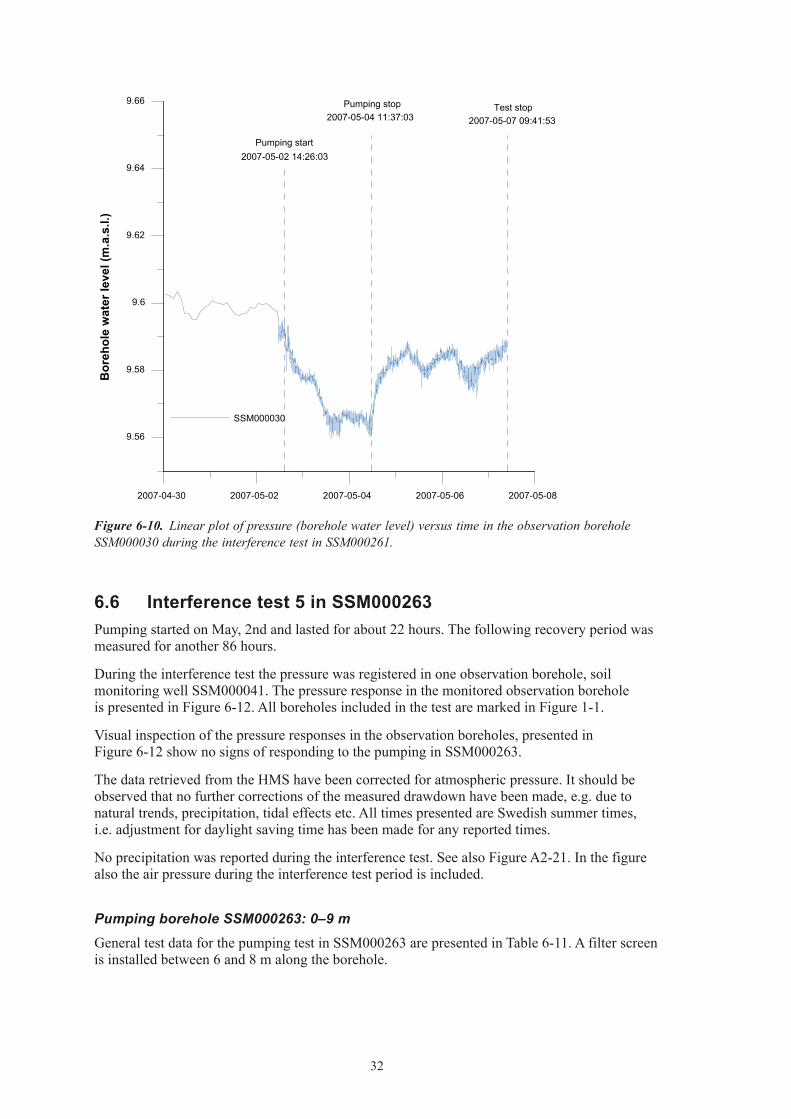
6.5.3 Observation borehole SSM000030: 0–8 m In Figure 6-10 an overview of the pressure responses in observation borehole SSM000030 is shown. General test data from the observation borehole SSM000030, 0–8 m, are presented in Table 6-10. A filter screen is installed between 4 and 5 m along the borehole.
Comments on the test
A weak but fairly clear response to pumping was detected in this observation borehole. The total drawdown during the flow period was c. 0.03 m. A drawdown of 0.01 m was reached approximately 35 minutes after start of pumping in SSM000261. There was a total recovery of c. 0.03 m during the recovery period lasting for approximately 70 hours.
Table 6‑10. General test data from the observation borehole SSM000030: 0–8 m during the interference test in SSM000261.
Pressure data Nomenclature Unit Value
Hydraulic head in tested borehole before start of flow period hi m.a.s.l. 9.59Hydraulic head in tested borehole before stop of flow period hp m.a.s.l. 9.56Hydraulic head in tested borehole at stop of recovery period hF m.a.s.l. 9.59Hydraulic head change during flow period (hi–hp) dhp m 0.03
32
6.6 Interference test 5 in SSM000263Pumping started on May, 2nd and lasted for about 22 hours. The following recovery period was measured for another 86 hours.
During the interference test the pressure was registered in one observation borehole, soil monitoring well SSM000041. The pressure response in the monitored observation borehole is presented in Figure 6-12. All boreholes included in the test are marked in Figure 1-1.
Visual inspection of the pressure responses in the observation boreholes, presented in Figure 6-12 show no signs of responding to the pumping in SSM000263.
The data retrieved from the HMS have been corrected for atmospheric pressure. It should be observed that no further corrections of the measured drawdown have been made, e.g. due to natural trends, precipitation, tidal effects etc. All times presented are Swedish summer times, i.e. adjustment for daylight saving time has been made for any reported times.
No precipitation was reported during the interference test. See also Figure A2-21. In the figure also the air pressure during the interference test period is included.
Pumping borehole SSM000263: 0–9 m
General test data for the pumping test in SSM000263 are presented in Table 6-11. A filter screen is installed between 6 and 8 m along the borehole.
2007-04-30 2007-05-02 2007-05-04 2007-05-06 2007-05-08
9.56
9.58
9.6
9.62
9.64
9.66B
oreh
ole
wat
er le
vel (
m.a
.s.l.
)
SSM000030
Pumping start2007-05-02 14:26:03
Pumping stop2007-05-04 11:37:03
Test stop2007-05-07 09:41:53
Figure 6-10. Linear plot of pressure (borehole water level) versus time in the observation borehole SSM000030 during the interference test in SSM000261.

33
Table 6‑11. General test data for the pumping test in SSM000263: 0–9 m.
General test data
Pumping borehole SSM000263Test type1) Constant Rate withdrawal and recovery testTest section (open borehole/packed-off section): open boreholeTest no 1Field crew (GEOSIGMA AB)Test equipment systemGeneral comment Interference test
Nomenclature Unit Value
Borehole length L m 9.10Casing length Lc m –Test section- secup Secup m 0.00Test section- seclow Seclow m 9.10Test section length Lw m 9.10Test section diameter2) 2·rw mm 50Test start (start of pressure registration) yymmdd hh:mm 070502 15:45Packer expanded yymmdd hh:mm:ss –Start of flow period yymmdd hh:mm:ss 070502 20:19:01Stop of flow period yymmdd hh:mm:ss 070503 18:06:01Test stop (stop of pressure registration) yymmdd hh:mm 2007-05-07 08:16Total flow time tp min 1,307Total recovery time tF min 5,171
Pressure data
Hydraulic head in tested borehole before start of flow period hi m.a.s.l. 2.34Hydraulic head in tested borehole before stop of flow period hp m.a.s.l. –1.17Hydraulic head in tested borehole at stop of recovery period hF m.a.s.l. 2.28Hydraulic head change during flow period (hi–hp) dhp m 3.51
Flow data
Flow rate from test section just before stop of flow period Qp m3/s 0.00108Mean (arithmetic) flow rate during flow period Qm m3/s 0.00111Total volume discharged during flow period Vp m3 86.3
Manual groundwater level measurements in SSM000263 (0–9 m) GW levelDate YYYY‑MM‑DD
Time tt:mm
Time (min)
(m b ToC) (m.a.s.l.)
2007-05-02 17:27 102 2.30 2.332007-05-03 18:34 1,609 2.95 1.68
1) Constant Head injection and recovery or Constant Rate withdrawal and recovery.2) Nominal diameter.
Comments on the test
The test was performed as a constant-flow rate pumping test. The mean flow rate was c. 67 L/min and the duration of the flow period was c. 22 hours. A slowly decreasing trend is dominating the entire flow period. The adjustment to reach a suitable flow rate quickly was made complicated by the fact that no capacity test had been performed in the borehole prior to the interference test. The recovery was measured for about 86 hours. An overview of the pressure response in SSM000263 is presented in Figure 6-11. The pressure responses in log-log and lin-log diagrams during the recovery period are presented in Figures A2-9 and A2-10 in Appendix 2.

34
6.6.1 Observation borehole SSM000041: 0–5 m In Figure 6-12 an overview of the pressure responses in observation borehole SSM000041 is shown. General test data from the observation borehole SSM000041, 0–5 m, are presented in Table 6-12. A filter screen is installed between 2 and 4 m along the borehole.
Comments on the test
It is unlikely that this observation borehole is influenced by the pumping in SSM000263. There is a possible slight change of slope in the ongoing natural decreasing trend that is showing clearly in Figure 6-12. This change of slope, occurring around the time of start of pumping, may indicate a very weak response to pumping. This is however disputed by the appearance of the pressure curve after the stop of pumping which does not indicate any recovery at all.
2007-05-02 2007-05-04 2007-05-06
–2
–1
0
1
2
3B
oreh
ole
wat
er le
vel (
m.a
.s.l.
)
SSM000263
Pumping start: 2007-05-02 20:19:01Pumping stop: 2007-05-03 18:06:01
Mean flow rate: c. 66 L/min
Figure 6-11. Linear plot of pressure (borehole water level) versus time in the pumping borehole SSM000263 during interference test 5.
Table 6‑12. General test data from the observation borehole SSM000041: 0–5 m during the interference test in SSM000263.
Pressure data Nomenclature Unit Value
Hydraulic head in tested borehole before start of flow period hi m.a.s.l. 2.22Hydraulic head in tested borehole before stop of flow period hp m.a.s.l. 2.21Hydraulic head in tested borehole at stop of recovery period hF m.a.s.l. 2.18Hydraulic head change during flow period (hi–hp) dhp m 0.01

35
6.7 Interference test 6 in SSM000265Pumping started on May, 7 and lasted for about 47 hours. The following recovery period was measured for another 27 hours.
During the interference test the pressure was registered in one observation borehole, soil monitoring well SSM000266. The pressure response in the monitored observation borehole is presented in Figure 6-14. All boreholes included in the test are marked in Figure 1-1.
Visual inspection of the pressure responses in the observation borehole, presented in Figure 6-14 show that there was a clear response to pumping in SSM000265. The measured drawdowns (sp)
at the end of the flow period and the estimated response time lags (dtL) in all of the observation boreholes are shown in Tables 6-17 and 6-18, respectively. The response time is defined as the time lag after start of pumping until a drawdown response of 0.01 m was observed in the actual observation borehole.
The data retrieved from the HMS have been corrected for atmospheric pressure. It should be observed that no further corrections of the measured drawdown have been made, e.g. due to natural trends, precipitation, tidal effects etc. All times presented are Swedish summer times, i.e. adjustment for daylight saving time has been made for any reported times.
There was some rain falling at the end of the drawdown period and for the duration of the recovery. Approximately 4 mm of rainfall was recorded during the last day of pumping and then one more mm during the recovery. See also Figure A2-21. In the figure also the air pressure during the interference test period is included.
2007-04-30 2007-05-02 2007-05-04 2007-05-06 2007-05-08
2.16
2.18
2.2
2.22
2.24 Pumping start2007-05-02 20:19:01
Pumping stop2007-05-03 18:06:01
Test stop2007-05-07 08:16:46
Bor
ehol
e w
ater
leve
l (m
.a.s
.l.)
SSM000041
Figure 6-12. Linear plot of pressure (borehole water level) versus time in the observation borehole SSM000041 during the interference test in SSM000263.

36
The pressure in the observation borehole was displaying an oscillating behaviour, especially clear before the start of pumping. This is believed to be naturally caused by so called tidal fluctuations or earth tides, possibly in combination with changes of the sea water level. These phenomena have, to some extent, been investigated previously in /3/.
It should be noted that the evaluated estimations from the interference tests are uncertain due to weak responses and sometimes unsteady flow rates which produced low quality test data.
6.7.1 Pumping borehole SSM000265: 0–6 mGeneral test data for the pumping test in SSM000265 are presented in Table 6-13. A filter screen is installed between 4 and 6 m along the borehole.
Comments on the test
The test was performed as a constant-flow rate pumping test. The mean flow rate was c. 16 L/min and the duration of the flow period was c. 47 hours. A slowly decreasing trend is dominating the entire flow period. The adjustment to reach a suitable flow rate quickly was made complicated by the fact that no capacity test had been performed in the borehole prior to the interference test. The recovery was measured for about 27 hours. An overview of the pressure response in SSM000265 is presented in Figure 6-13. The pressure responses in log-log and lin-log diagrams during the recovery period are presented in Figures A2-11 and A2-12 in Appendix 2.
2007-05-06 2007-05-08 2007-05-10
1
2
3
4
5
6
Bor
ehol
e w
ater
leve
l (m
.a.s
.l.)
Pumping start: 2007-05-07 09:21:29Pumping stop: 2007-05-09 08:03:19
Mean flow rate: c. 16.5 L/min
SSM000265
Figure 6-13. Linear plot of pressure (borehole water level) versus time in the pumping borehole SSM000265 during interference test 6.

37
Table 6‑13. General test data for the pumping test in SSM000265: 0–6 m.
General test data
Pumping borehole SSM000265Test type1) Constant Rate withdrawal and recovery testTest section (open borehole/packed-off section): open boreholeTest no 1Field crew (GEOSIGMA AB)Test equipment systemGeneral comment Interference test
Nomenclature Unit Value
Borehole length L m 5.90Casing length Lc m –Test section- secup Secup m 0.00Test section- seclow Seclow m 5.90Test section length Lw m 5.90Test section diameter2) 2·rw mm 50Test start (start of pressure registration) yymmdd hh:mm 070507 07:46Packer expanded yymmdd hh:mm:ss –Start of flow period yymmdd hh:mm:ss 070507 09:21:29Stop of flow period yymmdd hh:mm:ss 070509 08:03:19Test stop (stop of pressure registration) yymmdd hh:mm 070510 11:03Total flow time tp min 2,802Total recovery time tF min 1,621
Pressure data
Hydraulic head in tested borehole before start of flow period hi m.a.s.l. 5.59Hydraulic head in tested borehole before stop of flow period hp m.a.s.l. 2.02Hydraulic head in tested borehole at stop of recovery period hF m.a.s.l. 5.60Hydraulic head change during flow period (hi–hp) dhp m 3.57
Flow data
Flow rate from test section just before stop of flow period Qp m3/s 0.000317Mean (arithmetic) flow rate during flow period Qm m3/s 0.000275Total volume discharged during flow period Vp m3 46.2
Manual groundwater level measurements in SSM000265 (0–6 m) GW level
Date YYYY‑MM‑DD
Time tt:mm
Time (min)
(m b ToC) (m.a.s.l.)
2007-05-07 08:37 51 1.13 5.62007-05-09 09:20 2,974 1.31 5.42
1) Constant Head injection and recovery or Constant Rate withdrawal and recovery.2) Nominal diameter.

38
6.7.2 Observation borehole SSM000266: 0–4 m In Figure 6-14 an overview of the pressure responses in observation borehole SSM000266 is shown. General test data from the observation borehole SSM000266, 0–4 m, are presented in Table 6-14. A filter screen is installed between 3 and 4 m along the borehole.
Comments on the test
A very quick response to pumping is indicated in this section. The total drawdown during the flow period was c. 0.88 m. A drawdown of 0.01 m was reached approximately 3.5 minutes after start of pumping in SSM00065. There was a total recovery of c. 0.89 m during the recovery period lasting for approximately 27 hours.
Prior to the start of pumping a clear oscillating behaviour of the pressure is registered. This is believed to be naturally caused by so called tidal effects or earth tides.
Table 6‑14. General test data from the observation borehole SSM000266: 0–4 m during the interference test in SSM000265.
Pressure data Nomenclature Unit Value
Hydraulic head in tested borehole before start of flow period hi m.a.s.l. 5.65Hydraulic head in tested borehole before stop of flow period hp m.a.s.l. 4.77Hydraulic head in tested borehole at stop of recovery period hF m.a.s.l. 5.66Hydraulic head change during flow period (hi–hp) dhp m 0.88
2007-05-02 2007-05-04 2007-05-06 2007-05-08 2007-05-10 2007-05-12
4.8
5.2
5.6
6Pumping start
2007-05-07 09:21:29Test stop
2007-05-10 11:03:49
Pumping stop2007-05-09 08:03:19
SSM000266
Bor
ehol
e w
ater
leve
l (m
.a.s
.l.)
Figure 6-14. Linear plot of pressure (borehole water level) versus time in the observation borehole SSM000266 during the interference test in SSM000265.
39
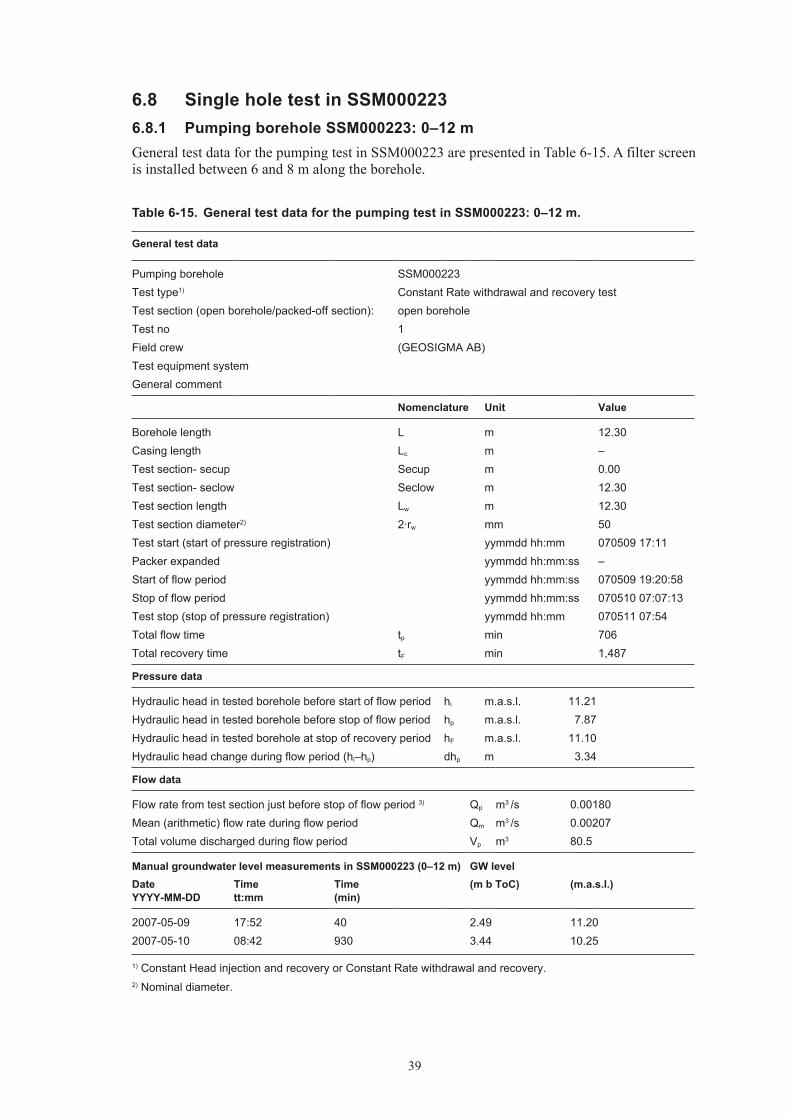
6.8 Single hole test in SSM0002236.8.1 Pumping borehole SSM000223: 0–12 mGeneral test data for the pumping test in SSM000223 are presented in Table 6-15. A filter screen is installed between 6 and 8 m along the borehole.
Table 6‑15. General test data for the pumping test in SSM000223: 0–12 m.
General test data
Pumping borehole SSM000223Test type1) Constant Rate withdrawal and recovery testTest section (open borehole/packed-off section): open boreholeTest no 1Field crew (GEOSIGMA AB)Test equipment systemGeneral comment
Nomenclature Unit Value
Borehole length L m 12.30Casing length Lc m –Test section- secup Secup m 0.00Test section- seclow Seclow m 12.30Test section length Lw m 12.30Test section diameter2) 2·rw mm 50Test start (start of pressure registration) yymmdd hh:mm 070509 17:11Packer expanded yymmdd hh:mm:ss –Start of flow period yymmdd hh:mm:ss 070509 19:20:58Stop of flow period yymmdd hh:mm:ss 070510 07:07:13Test stop (stop of pressure registration) yymmdd hh:mm 070511 07:54Total flow time tp min 706Total recovery time tF min 1,487
Pressure data
Hydraulic head in tested borehole before start of flow period hi m.a.s.l. 11.21Hydraulic head in tested borehole before stop of flow period hp m.a.s.l. 7.87Hydraulic head in tested borehole at stop of recovery period hF m.a.s.l. 11.10Hydraulic head change during flow period (hi–hp) dhp m 3.34
Flow data
Flow rate from test section just before stop of flow period 3) Qp m3 /s 0.00180Mean (arithmetic) flow rate during flow period Qm m3 /s 0.00207Total volume discharged during flow period Vp m3 80.5
Manual groundwater level measurements in SSM000223 (0–12 m) GW levelDate YYYY‑MM‑DD
Time tt:mm
Time (min)
(m b ToC) (m.a.s.l.)
2007-05-09 17:52 40 2.49 11.202007-05-10 08:42 930 3.44 10.25
1) Constant Head injection and recovery or Constant Rate withdrawal and recovery.2) Nominal diameter.
40
Comments on the test
The test was performed as a constant-flow rate pumping test. The mean flow rate was c. 124 L/min and the duration of the flow period was c. 12 hours. The adjustment to reach a suitable flow rate quickly was made more complicated by the fact that no capacity test had been performed in the borehole prior to the interference test. Furthermore, no estimated transmissivities from previous investigations were available prior to the test start. The recovery was measured for about 25 hours. An overview of the pressure response in SSM000223 is presented in Figure 6-15. The pressure responses in log-log and lin-log diagrams during the flow period are presented in Figures A2-13 and A2-14 in Appendix 2.
2007-05-09 2007-05-09 2007-05-10 2007-05-10 2007-05-11 2007-05-11
7
8
9
10
11
12
Bor
ehol
e w
ater
leve
l (m
.a.s
.l.)
Pumping start: 2007-05-09 19:20:58Pumping stop: 2007-05-10 07:07:13
Mean flow rate: c. 114 L/min
SSM000223
Figure 6-15. Linear plot of pressure (borehole water level) versus time in the tested borehole SSM000223.

41
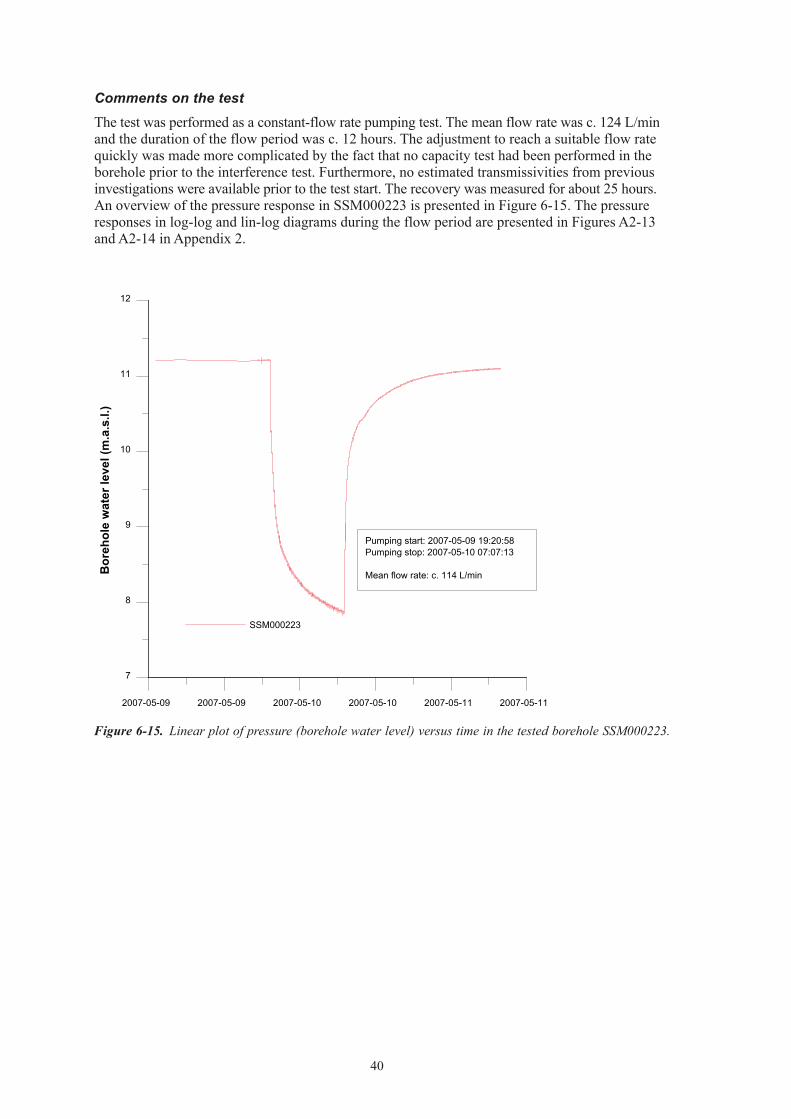
6.9 Single hole test in SSM0002366.9.1 Pumping borehole SSM000236: 0–6 mGeneral test data for the pumping test in SSM000236 are presented in Table 6-16. A filter screen is installed between 2 and 3 m along the borehole.
Table 6‑16. General test data for the pumping test in SSM000236: 0–6 m.
General test data
Pumping borehole SSM000236Test type1) Constant Rate withdrawal and recovery testTest section (open borehole/packed-off section): open boreholeTest no 1Field crew (GEOSIGMA AB)Test equipment systemGeneral comment
Nomenclature Unit Value
Borehole length L m 5.90Casing length Lc m –Test section- secup Secup m 0.00Test section- seclow Seclow m 5.90Test section length Lw m 5.90Test section diameter2) 2·rw mm 50Test start (start of pressure registration) yymmdd hh:mm 070510 10:42Packer expanded yymmdd hh:mm:ss –Start of flow period yymmdd hh:mm:ss 070510 12:09:06Stop of flow period yymmdd hh:mm:ss 070510 22:11:01Test stop (stop of pressure registration) yymmdd hh:mm 070511 09:01:51Total flow time tp min 602Total recovery time tF min 651
Pressure data
Pressure in test section before start of flow period pi kPa 118.1Pressure in test section before stop of flow period pp kPa 112.0Pressure in test section at stop of recovery period pF kPa 117.6Pressure change during flow period (pi–pp) dpp kPa 6.0
Flow data
Flow rate from test section just before stop of flow period 3) Qp m3 /s 0.0000050Mean (arithmetic) flow rate during flow period Qm m3 /s 0.0000060Total volume discharged during flow period Vp m3 0.2
Manual groundwater level measurements in SSM000236 (0–6 m) GW level
Date YYYY‑MM‑DD
Time tt:mm
Time (min)
(m b ToC) (m.a.s.l.)
2007-05-10 10:53 11 1.11 15.262007-05-11 09:52 1,390 1.08 15.29
1) Constant Head injection and recovery or Constant Rate withdrawal and recovery.2) Nominal diameter.
42
Comments on the test
The test was performed as a constant-flow rate pumping test. The mean flow rate was c. 0.4 L/min and the duration of the flow period was c. 10 hours. The adjustment to reach a suitable flow rate quickly was made more complicated by the fact that no capacity test had been performed in the borehole prior to the interference test. Furthermore, no estimated transmissivities from previous investigations were available prior to the test start. The recovery was measured for almost 11 hours. An overview of the pressure response in SSM000236 is presented in Figure 6-16. The pressure responses in log-log and lin-log diagrams during the recovery period are presented in Figures A2-15 and A2-16 in Appendix 2.
2007-05-10 2007-05-10 2007-05-10 2007-05-11 2007-05-11 2007-05-11
104
108
112
116
120
Pumping start: 2007-05-10 12:09:06Pumping stop: 2007-05-10 22:11:01
Mean flow rate: c. 0.36 L/min
SSM000236
Wat
er p
ress
ure
in b
oreh
ole
(kPa
)
Figure 6-16. Linear plot of pressure (borehole water level) versus time in the tested borehole SSM000236.

43
6.10 Response analysisEven though the observation boreholes are part of different interference tests, a response analysis has been performed and response diagrams produced. These diagrams can not be expected to provide the same kind of information as if the observation boreholes would all be part of the same interference test. But the diagrams are still presented as they are assumed to provide some simple means of comparing the strength of connectivity between the different pumping boreholes and the observation boreholes. Since the conditions, naturally, were not at all the same in the different tests the comparison must, however, be regarded as very approximate.
A simplified response analysis according to the methodology description for interference tests was made. However no response matrix was prepared. The response time lags (dtL) in the obser-vation boreholes during pumping in the different pumping boreholes are shown in Table 6-17. The lag times were derived from the uncorrected drawdown curves in the observation borehole sections at an actual drawdown of 0.01 m. Ordinarily, the time to reach a 0.1 m drawdown is used but since only one section ever displayed a drawdown that large the time to reach a 0.01 m drawdown was used instead. No corrections of the drawdown for natural trends during the interference tests or other corrections of drawdown have been made. Because of the oscillating behaviour of the measured pressure in some of the observation boreholes it was more difficult to determine the exact time to reach a 0.01 m drawdown. It was possible, however, to make an approximate estimate.
Only observation boreholes in which an assumed, relatively clear, pressure response was recorded are included in the response analysis. In Tables 6-17 and 6-18 only sections comprised in the response analysis are presented, that is only sections showing a reasonably clear response to pumping.
The normalized response time with respect to the distance to the pumping borehole was calculated. This time is inversely related to the hydraulic diffusivity (T/S) of the formation. Also the inverse of above mentioned parameter was calculated since it is more closely related to the hydraulic diffusivity. In addition, the normalized drawdown with respect to the flow rate was calculated and is presented in Table 6-18.
In Figure 6-17 a response diagram, showing the presumptive responding observation boreholes, is presented. In this figure the observation boreholes are represented by different symbols. In the response diagram, observation boreholes represented by data points lying to the left generally indicate a better connectivity, a higher hydraulic diffusivity, in regard to the pumping borehole section than sections represented by data points further to the right in the diagram.
The following parameters are used in Tables 6-17 and 6-18 as well as in Figures 6-17 to 6-19:
dtL[s=0.01 m] / rs2 = normalized response time with respect to the distance rs (s/m2),
dtL[s=0.01 m] = time after start of pumping (s) at a drawdown s = 0.01 m in the observation section,
rs = 3D-distance between the hydraulic point of application (hydr. p.a.) in the pumping borehole and observation borehole (m),
sp/Qp = normalized drawdown with respect to the pumping flow rate (s/m2),
sp = drawdown at stop of pumping in the actual observation borehole/section (m),
Qp = pumping flow rate by the end of the flow period (m3/s).
The (normalized) response time lag for some of the observation boreholes included in the interference tests, where a response was detected, must be considered as rough estimates. The main reason for this is that the relatively weak responses detected, small drawdowns, make it hard to distinguish natural fluctuations or noise from the actual drawdown induced by the pump-ing in the pumping boreholes.

44
0.1 1 10
10
100
1,000
10,000
s p/Qp (
s/m
2 )
dtL[dp=0.01 m] / rs2 (s/m2)
Response diagram
Test 1: SSM000224
Test 6: SSM000265
Pumping boreholes usedduring the interference testsand color scheme used indiagram:
Test 4: SSM000261
Observation boreholes
SSM000225
SSM000260
SSM000030
SSM000266
Figure 6-17. Response diagram showing the responses in the presumed responding observation boreholes during the interference tests.
Table 6‑17. Calculated response lag times and normalized response time lags for the responding observation boreholes included in the interference tests.
Pumping borehole
Observation borehole
Section (m)
dtL[s = 0.01 m] (s)
rs
(m)dtL[s = 0.01 m]/rs
2 (s/m2)
rs2/dtL[s = 0.01 m]
(m2/s)
SSM000224 SSM000225 0–10 34 7.8 5.62E–01 1.78E+00SSM000261 SSM000260 0–10 9,228 82.9 1.34E+00 7.45E–01SSM000261 SSM000030 0–8 2,108 83.5 3.02E–01 3.31E+00SSM000265 SSM000266 1) 0–4 216 15.7 8.76E–01 1.14E+00
1) dtL[s = 0.1 m] = 1,181 s. SSM000266 was the only section responding with a drawdown exceeding 0.1 m.
Table 6‑18. Drawdown and normalized drawdown for the responding observation boreholes included in the interference test.
Pumping borehole
Flow rate Qp (m3/s)
Observation borehole
Section (m)
sp (m)
sp/Qp
(s/m2)
SSM000224 0.002325 SSM000225 0–10 0.054 23.2SSM000261 0.000138 SSM000260 0–10 0.055 401.0SSM000261 0.000138 SSM000030 0–8 0.030 221.2SSM000265 0.000275 SSM000266 0–4 0.878 3,191.8

45
Figure 6-18. Diagram showing normalized drawdown, normalized response time and the ratio between the two parameters for the responding sections in the interference tests. The observation boreholes are sorted by the magnitude of the ratio.
0
0.4
0.8
1.2
1.6
0
1,000
2,000
3,000
4,000
10
100
1,000
10,000
s p/Qp /
dt L[d
p=0.
01 m
]/rs2 (
–)
sp/Qp (s/m2)
dtL[dp=0.01 m]/rs2 (s/m2)sp/Qp / dtL[dp=0.01 m]/rs
2 (–)
SS
M00
0225
: 0–1
0
SS
M00
0260
: 0–1
0
SS
M00
0030
: 0–8
SS
M00
0266
: 0–4
dtL[d
p=0.
01 m
]/rs2 (
s/m
2 )
s p/Qp (
s/m
2 )
Figure 6-19. Diagram showing drawdown, the inverse of the normalized response time and the same ratio that was previously presented in Figure 6-18, for the responding sections in the interference tests. The observation boreholes are sorted by the magnitude of the ratio.
0.1
1
10
0
0.2
0.4
0.6
0.8
1
10
100
1,000
10,000
SSM
0002
25: 0
–10
SSM
0002
60: 0
–10
SSM
0000
30: 0
–8
SSM
0002
66: 0
–4
r s2 /dt L[d
p=0.
01 m
] (s
/m2 )
sp (m)
rs2/dtL[dp=0.01 m] (s/m2)
sp/Qp / dtL[dp=0.01 m]/rs2 (–)
s p/Qp /
dt L[d
p=0.
01 m
]/rs2
(–)
s p (m
)

46
The response diagram in Figure 6-17 together with diagrams 6-18 and 6-19 can be used to group observation boreholes by the strength of their responses and so the observation boreholes with the most distinct responses can be identified. Figure 6-17 indicates that the largest drawdown was found in observation borehole SSM000266 and the weakest response in SSM000225. The most delayed response occurred in section SSM000260: 0–10 m, when considering the response normalized with regards to the distance to the pumping borehole. As mentioned above, all conclusions must be considered with some scepticism since data are provided from different interference tests.
Figure 6-18 displays the same parameters as in the response diagram, but in a different type of diagram. In this diagram a third index is also displayed, i.e. the ratio between the two indices in the response diagram. Clearly, sections with higher ratios correspond to sections which are hydraulically well connected to the pumping boreholes. In the diagram, all observation bore-holes that responded clearly to pumping are included. All sections are ranked so that sections showing the weakest responses are located to the left in the diagram and observation boreholes with stronger responses are located to the right.
Another version of Figure 6-18 is displayed in Figure 6-19. The units on the axes are somewhat different even though this figure is indicating the same phenomenon as is shown in Figure 6-18.
6.11 Transient evaluationQuantitative transient evaluation was made for the responding observation boreholes in the interference tests and for all the pumping boreholes. Depending on which gave the best estimates, either the drawdown or the recovery period is presented in this report.
6.11.1 Pumping boreholesAll pumping boreholes have been evaluated transiently to estimate values of transmissivity. In the cases where a transient evaluation of the interference test was possible (responses were detected in the observation boreholes), assumed values of storativity were used from these evaluations. In the other cases the first assumption for a value of storativity would be 0.05 but sometimes this value would change slightly in the evaluation process to a more plausible value.
Partial penetration was applied in the different calculation methods used for the transient evaluation.
The transient, quantitative interpretation of the period chosen as the most representative (flow period or recovery period) is shown in log-log and lin-log diagrams in Figures A2-1 through A2-16, all in Appendix 2. The results from the transient evaluation of the single-hole pumping tests are summarized in Table 6-22.
6.11.2 Observation boreholesAll responding observation boreholes have been evaluated transiently to estimate values of transmissivity and storativity. The evaluated storativity values were later used in the transient evaluation of the single hole pumping tests.
Partial penetration was applied in the different calculation methods used for the transient evaluation.
The transient, quantitative interpretation of the period chosen as the most representative (flow period or recovery period) is shown in log-log diagrams in Figures A2-17 through A2-20, all in Appendix 2. The results from the transient evaluation of the interference tests are summarized in Table 6-23.

47
6.12 Summary of the results of the interference tests A compilation of measured test data from the interference tests are shown in Tables 6-20 and 6-21. In Tables 6-22 and 6-23 calculated hydraulic parameters for the pumping boreholes and responding observation boreholes are presented.
In three of the interference tests there were at least one responding observation borehole. In test 1, there was 1 responding observation borehole, during test 4 both observation boreholes displayed responses to pumping and in test 6 the selected observation borehole also showed a response to pumping. The rest of the observation boreholes did either not respond to pumping or the installed loggers did not register the responses for some reason. In some cases it would appear that the observation borehole loggers were out of order or installed incorrectly.
The weakest of the registered responses, according to the response analysis, was detected in test 1 (observation borehole SSM000225). The strongest response was registered in test 6 (observa-tion borehole SSM000266) whereas the fastest response, with regard to distance, was recorded in test 4 (observation borehole SSM000030).
The estimated T-values for the pumping boreholes from transient evaluation are in fairly good agreement with the results from previously conducted slug tests or estimations, where such are available. The same is true about the estimated transmissivity values from the observation boreholes during the interference tests. There are some differences and it must be noted that the evaluated estimations from the interference tests are uncertain due to weak responses and sometimes unsteady flow rates which produce low quality test data for evaluation.
Table 6‑20. Summary of test data from the pumping boreholes during the interference‑ and single‑hole tests performed in the Laxemar area.
Pumping borehole ID
Section (m)
Test type1)
hi (m.a.s.l.)
hp (m.a.s.l.)
hF (m.a.s.l.)
Qp (m3/s)
Qm (m3/s)
Vp (m3)
SSM000224 0–17 1B 5.33 4.05 5.31 0.00233 0.00232 82.7SSM000220 0–3 1B 12.60 11.93 12.50 0.000167 0.000238 41.5SSM000228 0–13 1B 10.24 7.24 10.24 0.000283 0.000249 41.2SSM000261 0–10 1B 9.67 5.74 9.69 0.000135 0.000138 22.4SSM000263 0–9 1B 2.34 –1.17 2.28 0.00108 0.00111 86.3SSM000265 0–6 1B 5.59 2.02 5.60 0.000317 0.000275 46.2SSM000223 0–12 1B 11.21 7.87 11.10 0.00180 0.00207 80.5
Pumping borehole ID
Section (m)
Test type1)
hi (kPa)
hp (kPa)
hF (kPa)
Qp (m3/s)
Qm (m3/s)
Vp (m3)
SSM000236 0–6 1B 118.1 112.0 117.6 0.0000050 0.0000060 0.2
1) 1B: Pumping test-submersible pump, 2: Interference test (observation borehole during pumping in another borehole).

48
Table 6‑21. Summary of test data from the observation boreholes involved in the interference tests performed in the Laxemar area (also including non‑responding sections).
Pumping borehole ID
Borehole ID Section (m)
Test type1)
hi (m.a.s.l.)
hp (m.a.s.l.)
hF (m.a.s.l.)
SSM000224 SSM000225 0–10 2 5.34 5.29 5.31SSM000224 SSM000031 0–4 2 5.21 5.20 5.23SSM000220 SSM000221 0–3 2 12.64 12.65 12.63SSM000228 SSM000229 0–7 2 11.25 11.22 11.20SSM000261 SSM000260 0–10 2 9.79 9.74 9.78SSM000261 SSM000030 0–8 2 9.59 9.56 9.59SSM000263 SSM000041 0–5 2 2.22 2.21 2.18SSM000265 SSM000266 0–4 2 5.65 4.77 5.66
1) 1B: Pumping test-submersible pump, 2: Interference test (observation borehole during pumping in another borehole).2) Section did not respond to pumping.
Table 6‑22. Summary of calculated hydraulic parameters from the single‑hole tests.
Pumping borehole ID
Hole depth (m)
Filter position (m)
Test type
Q/s (m2/s)
TM (m2/s)
TT
(m2/s)ξ (–)
S* (–)
SSM000224 17 16–17 1B 1.8·10–3 2.0·10–3 1.0·10–2 – 3.8·10–2
SSM000220 3 2–3 1B 3.7·10–4 3.0·10–4 2.1·10–4 – 5.0·10–2
SSM000228 13 6–7 1B 8.3·10–5 8.7·10–5 4.7·10–5 – 5.0·10–2
SSM000261 10 9.2–10.2 1B 3.5·10–5 3.5·10–5 2.5·10–4 – 1.1·10–3
SSM000263 9 6.3–8.3 1B 3.1·10–4 3.1·10–4 3.5·10–4 –4.0 1.0·10–3
SSM000265 6 3.6–5.6 1B 7.7·10–5 7.1·10–5 8.6·10–5 – 2.4·10–4
SSM000223 12 6–8 1B 5.7·10–4 5.9·10–4 3.4·10–4 –4.7 5.0·10–2
SSM000236 6 2–3 1B 1.0·10–5 9.0·10–6 1.1·10–5 0.7 1.0·10–3
Table 6‑23. Summary of calculated hydraulic parameters from the interference tests performed in soil wells in the Laxemar area.
Pumping borehole ID
Observation borehole ID
Hole depth (m)
Filter position (m)
Test type
To (m2/s) So (–)
SSM000224 SSM000225 10 9–10 2 6.4·10–2 3.6·10–2
SSM000261 SSM000260 10 7.4–9.4 2 6.3·10–4 1.4·10–3
SSM000261 SSM000030 8 4–5 2 7.0·10–4 8.4·10–4
SSM000265 SSM000266 4 3–4 2 6.0·10–5 2.4·10–4
Q/s = specific flow for the pumping/injection borehole.
TM = steady state transmissivity from Moye’s equation.
TT = transmissivity from transient evaluation of single-hole test.
To = transmissivity from transient evaluation of interference test.
So = storativity from transient evaluation of interference test.
S* = assumed storativity by the estimation of the skin factor in single hole tests.
ξ=skinfactor.

49
7 References
/1/ Almén K-E, Andersson J-E, Carlsson L, Hansson K, Larsson N-Å, 1986. Hydraulic testing in crystalline rock. A comparative study of single-hole test methods. Technical Report 86-27, Svensk Kärnbränslehantering AB.
/2/ Rhen I (ed), Gustafson G, Stanfors R, Wikberg P, 1997. Äspö HRL – Geoscientific evaluation 1997/5. Models based on site characterization 1986–1995. SKB TR 97-06, Svensk Kärnbränslehantering AB.
/3/ Ludvigson J-E, Jönsson S, Levén J, 2004. Forsmark site investigation. Hydraulic evaluation of pumping activities prior to hydro-geochemical sampling in borehole KFM03A – Comparison with results from difference flow logging. SKB P-04-96, Svensk Kärnbränslehantering AB.
/4/ Dougherty D E, Babu D K, 1984. Flow to a partially penetrating well in a double-porosity reservoir. Water Resour. Res., 20 (8), 1116–1122.
/5/ Hantush M S, 1955. Nonsteady radial flow in an infinite leaky aquifer. Am. Geophys. Union Trans., v. 36, no 1, pp 95–100.

51
Appendix 1
List of test data files List of data files Files are named: Pumptest_”BhID”_”YYYYMMDD”_”hhmm”. Pumptest is just an internal marker. “BhID” is the name of the borehole, after that the datafile start time is given.
Bh ID Test section (m)
Test type1
Test no
Test start Date, time YYYY‑MM‑DD tt:mm:ss
Test stop Date, time YYYY‑MM‑DD tt:mm:ss
Datafile, start Date, time YYYY‑MM‑DD tt:mm:ss
Datafile, stop Date, time YYYY‑MM‑DD tt:mm:ss
Data files of raw and primary data Content (parameters)2
Comments
SSM000236 0–6 1B 20070510 11:42:06
20070511 10:01:51
20070510 11:42:06
20070511 10:01:51
Pumptest_SSM236_20070510_1042.txt P Times in data file are Swedish normal times.
1) 1B: Pumping test-submersible pump, 2: Interference test (observation borehole during pumping in another borehole).2) P = Pressure, Q = Flow, Te = Temperature, EC = El. conductivity, SPR = Single Point Resistance, C = Calibration file, R = Reference file, Sp = Spinner rotations.

53
Appendix 2
Test diagrams and meteorological dataTest diagrams Nomenclature for AQTESOLV:T = transmissivity (m2/s).
S = storativity (–).
KZ/Kr = ratio of hydraulic conductivities in the vertical and radial direction (set to 1).
Sw = skin factor.
r(w) = borehole radius (m).
r(c) = effective casing radius (m).
r/B = leakage coefficient (s–1).
b = thickness of formation (m).

54
Interference test in SSM000224
1 10 100 1,000 1.0E+4 1.0E+50.001
0.01
0.1
1
10
100
Time (sec)
Dra
wdo
wn
(m)
Obs. WellsSSM000224
Aquifer ModelConfined
SolutionDougherty-Babu
ParametersT = S = 0.0381Kz/Kr = 1Sw = –1.617r(w) = r(c) =
0.0103 m2/sec
0.025 m0.1647 m
Interference test in SSM000224
1 10 100 1,000 1.0E+4 1.0E+5–0.5
0
0.5
1
1.5
2
Time (sec)
Dra
wdo
wn
(m)
Obs. WellsSSM000224
Aquifer ModelConfined
SolutionDougherty-Babu
Parameters
T = S = 0.0381Kz/Kr = 1Sw = –1.617r(w) = r(c) =
0.0103 m2/sec
0.1647 m0.025 m
Figure A2-1. Log-log plot of drawdown (▫) and drawdown derivative, ds/d(ln t) (+), versus time in SSM000224 during the interference test in SSM000224.
Figure A2-2. Lin-log plot of drawdown (▫) and drawdown derivative, ds/d(ln t) (+), versus time in SSM000224 during the interference test in SSM000224.
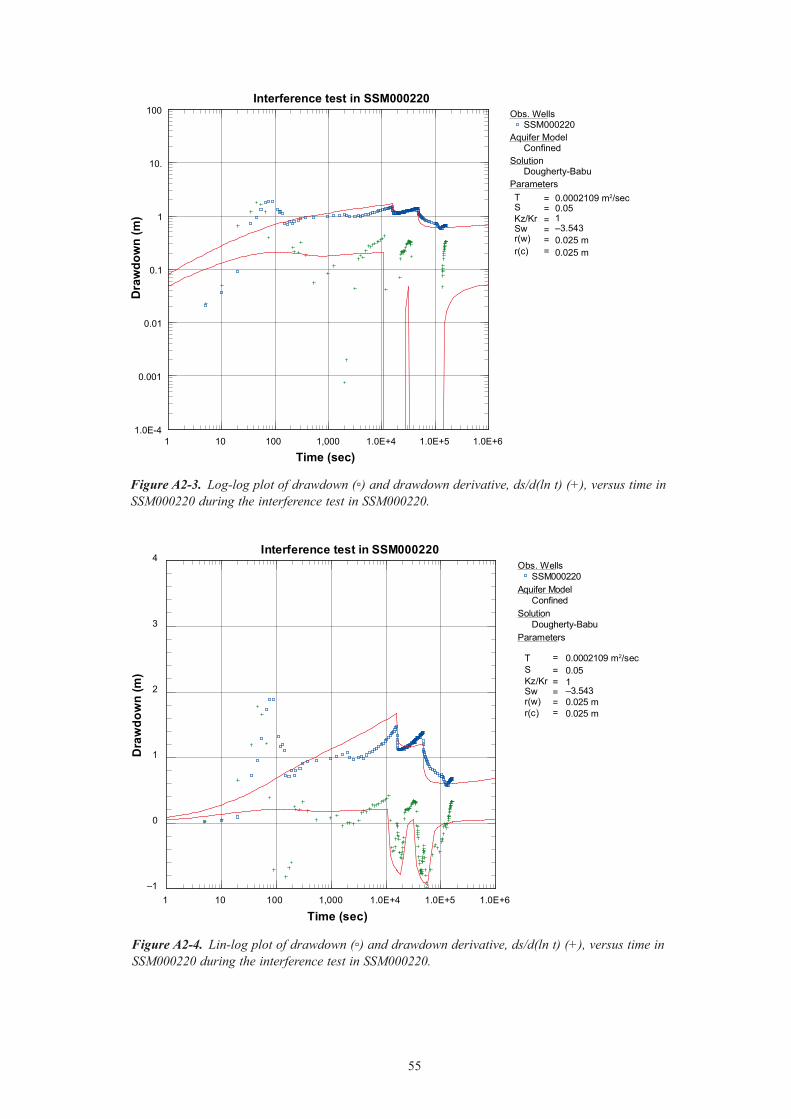
55
Interference test in SSM000220
1 10 100 1,000 1.0E+4 1.0E+5 1.0E+61.0E-4
0.001
0.01
0.1
1
10.
100
Time (sec)
Dra
wdo
wn
(m)
Obs. WellsSSM000220
Aquifer ModelConfined
SolutionDougherty-Babu
ParametersT = S = 0.05Kz/Kr = 1Sw = –3.543r(w) = r(c) =
0.0002109 m2/sec
0.025 m0.025 m
Interference test in SSM000220
1 10 100 1,000 1.0E+4 1.0E+5 1.0E+6–1
0
1
2
3
4
Time (sec)
Dra
wdo
wn
(m)
Obs. WellsSSM000220
Aquifer ModelConfined
SolutionDougherty-Babu
Parameters
T = S = 0.05Kz/Kr = 1Sw = –3.543r(w) = r(c) =
0.0002109 m2/sec
0.025 m0.025 m
Figure A2-3. Log-log plot of drawdown (▫) and drawdown derivative, ds/d(ln t) (+), versus time in SSM000220 during the interference test in SSM000220.
Figure A2-4. Lin-log plot of drawdown (▫) and drawdown derivative, ds/d(ln t) (+), versus time in SSM000220 during the interference test in SSM000220.

56
Interference test in SSM000228
1 10 100 1,000 1.0E+4 1.0E+5 1.0E+60.001
0.01
0.1
1
10
100
1,000
Time (sec)
Dra
wdo
wn
(m)
Obs. WellsSSM000228
Aquifer ModelLeaky
SolutionMoench (Case 1)
Parameters
T = S = 0.05r/B' = 0.05844ß' = 0.2814r/B" = 0ß" = 0Sw = –0.767r(w) = r(c) =
4.688E-5 m2/sec
0.03675 m0.025 m
Interference test in SSM000228
1 10 100 1,000 1.0E+4 1.0E+5 1.0E+6–5
0
5
10
15
Time (sec)
Dra
wdo
wn
(m)
Obs. WellsSSM000228
Aquifer ModelLeaky
SolutionMoench (Case 1)
Parameters
T = S = 0.05r/B' = 0.05844ß' = 0.2814r/B" = 0ß" = 0Sw = –0.767r(w) = r(c) =
4.688E-5 m2/sec
0.03675 m0.025 m
Figure A2-5. Log-log plot of drawdown (▫) and drawdown derivative, ds/d(ln t) (+), versus time in SSM000228 during the interference test in SSM000228.
Figure A2-6. Lin-log plot of drawdown (▫) and drawdown derivative, ds/d(ln t) (+), versus time in SSM000228 during the interference test in SSM000228.

57
Interference test in SSM000261
1 10 100 1,000 1.0E+4 1.0E+50.001
0.01
0.1
1
10
100
Agarwal Equivalent Time (sec)
Rec
over
y (m
)Obs. Wells
SSM000261
Aquifer ModelConfined
SolutionDougherty-Babu
Parameters
T = S = 0.001136Kz/Kr = 1Sw = 0.4185r(w) = r(c) =
0.000252 m2/sec
0.01541 m0.025 m
Interference test in SSM000261
1 10 100 1,000 1.0E+4 1.0E+5–1
0
1
2
3
4
5
Agarwal Equivalent Time (sec)
Rec
over
y (m
)
Obs. WellsSSM000261
Aquifer ModelConfined
SolutionDougherty-Babu
Parameters
T = S = 0.001136Kz/Kr = 1Sw = 0.4185r(w) = r(c) =
0.000252 m2/sec
0.01541 m0.025 m
Figure A2-7. Log-log plot of pressure recovery (▫) and derivative, dsp/d(ln dte) (+), versus equivalent time in SSM000261 during the interference test in SSM000261.
Figure A2-8. Lin-log plot of pressure recovery (▫) and derivative, dsp/d(ln dte) (+), versus equivalent time in SSM000261 during the interference test in SSM000261.

58
Interference test in SSM000263
1 10 100 1,000 1.0E+4 1.0E+50.01
0.1
1
10
100
Agarwal Equivalent Time (sec)
Rec
over
y (m
)Obs. Wells
SSM000263Aquifer Model
ConfinedSolution
Dougherty-BabuParameters
T = S = 0.001Kz/Kr = 1Sw = –3.972r(w) = r(c) =
0.0003493 m2/sec
0.03326 m0.025 m
Interference test in SSM000263
1 10 100 1,000 1.0E+4 1.0E+5–1
0
1
2
3
4
Agarwal Equivalent Time (sec)
Rec
over
y (m
)
Obs. WellsSSM000263
Aquifer ModelConfined
SolutionDougherty-Babu
Parameters
T = S = 0.001Kz/Kr = 1Sw = –3.972r(w) = r(c) =
0.0003493 m2/sec
0.03326 m0.025 m
Figure A2-9. Log-log plot of pressure recovery (▫) and derivative, dsp/d(ln dte) (+), versus equivalent time in SSM000263 during the interference test in SSM000263.
Figure A2-10. Lin-log plot of pressure recovery (▫) and derivative, dsp/d(ln dte) (+), versus equivalent time in SSM000263 during the interference test in SSM000263.

59
Interference test in SSM000265
1 10 100 1,000 1.0E+4 1.0E+50.001
0.01
0.1
1
10
100
Agarwal Equivalent Time (sec)
Rec
over
y (m
)
Obs. WellsSSM000265
Aquifer ModelLeaky
SolutionMoench (Case 1)
Parameters
T = S = 0.000238r/B' = 0.0009932ß' = 0.0001818r/B" = 0ß" = 0Sw = –0.8898r(w) = r(c) =
8.617E-5 m2/sec
0.025 m0.025 m
Interference test in SSM000265
1 10 100 1,000 1.0E+4 1.0E+5
–1
0
1
2
3
4
5
Agarwal Equivalent Time (sec)
Rec
over
y (m
)
Obs. WellsSSM000265
Aquifer ModelLeaky
SolutionMoench (Case 1)
Parameters
T = S = 0.000238r/B' = 0.0009932ß' = 0.0001818r/B" = 0ß" = 0Sw = –0.8898r(w) = r(c) =
8.617E-5 m2/sec
0.025 m0.025 m
Figure A2-11. Log-log plot of pressure recovery (▫) and derivative, dsp/d(ln dte) (+), versus equivalent time in SSM000265 during the interference test in SSM000265.
Figure A2-12. Lin-log plot of pressure recovery (▫) and derivative, dsp/d(ln dte) (+), versus equivalent time in SSM000265 during the interference test in SSM000265.
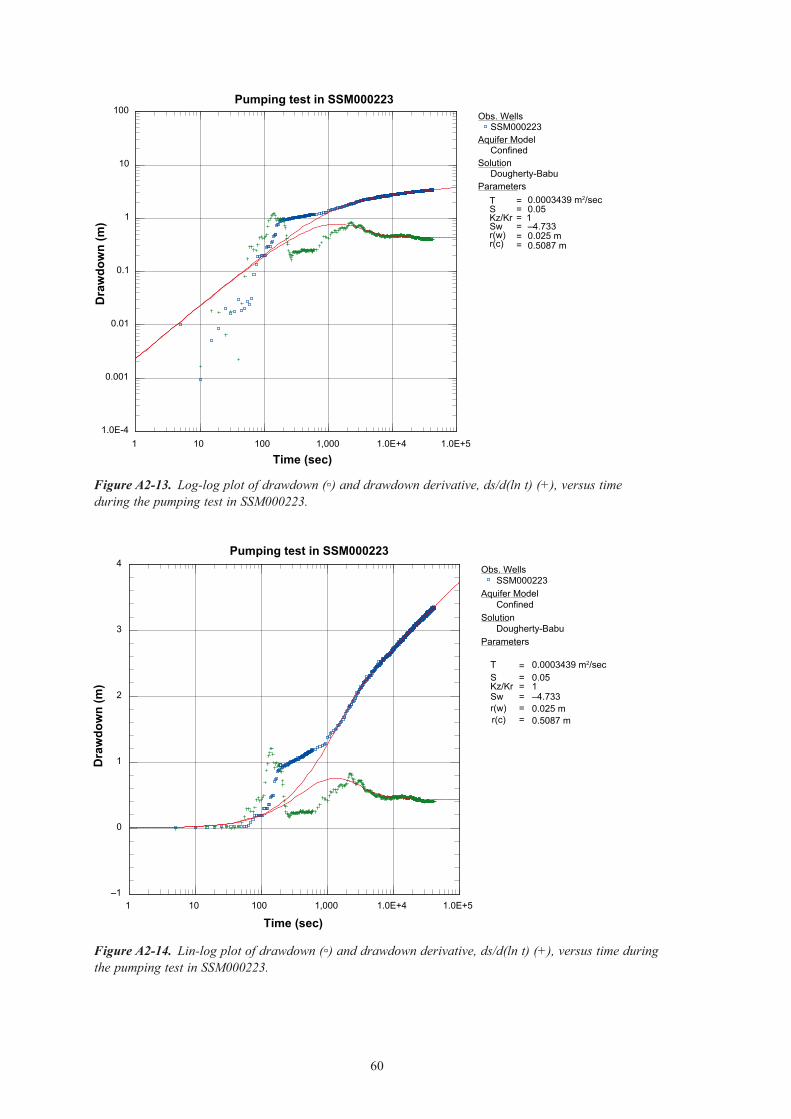
60
Pumping test in SSM000223
1 10 100 1,000 1.0E+4 1.0E+51.0E-4
0.001
0.01
0.1
1
10
100
Time (sec)
Dra
wdo
wn
(m)
Obs. WellsSSM000223
Aquifer ModelConfined
SolutionDougherty-Babu
ParametersT = S = 0.05Kz/Kr = 1Sw = –4.733r(w) = r(c) =
0.0003439 m2/sec
0.5087 m0.025 m
Pumping test in SSM000223
1 10 100 1,000 1.0E+4 1.0E+5–1
0
1
2
3
4
Time (sec)
Dra
wdo
wn
(m)
Obs. WellsSSM000223
Aquifer ModelConfined
SolutionDougherty-Babu
Parameters
T = S = 0.05Kz/Kr = 1Sw = –4.733r(w) = r(c) =
0.0003439 m2/sec
0.5087 m0.025 m
Figure A2-13. Log-log plot of drawdown (▫) and drawdown derivative, ds/d(ln t) (+), versus time during the pumping test in SSM000223.
Figure A2-14. Lin-log plot of drawdown (▫) and drawdown derivative, ds/d(ln t) (+), versus time during the pumping test in SSM000223.

61
Pumping test in SSM000236
1 10 100 1,000 1.0E+4 1.0E+50.001
0.01
0.1
1
10
Agarwal Equivalent Time (sec)
Rec
over
y (m
)
Obs. WellsSSM000236
Aquifer ModelLeaky
SolutionMoench (Case 1)
Parameters
T = S = 0.001r/B' = 1.28E-13ß' = 0.001258r/B" = 0ß" = 0Sw = 0.7523r(w) = r(c) =
1.048E-5 m2/sec
0.01727 m0.025 m
Pumping test in SSM000236
1 10 100 1,000 1.0E+4 1.0E+5–0.2
0
0.2
0.4
0.6
0.8
Agarwal Equivalent Time (sec)
Rec
over
y (m
)
Obs. WellsSSM000236
Aquifer ModelLeaky
SolutionMoench (Case 1)
ParametersT = S = 0.001r/B' = 1.28E-13ß' = 0.001258r/B" = 0ß" = 0Sw = 0.7523r(w) = r(c) =
1.048E-5 m2/sec
0.01727 m0.025 m
Figure A2-15. Log-log plot of pressure recovery (▫) and derivative, dsp/d(ln dte) (+), versus equivalent time during the pumping test in SSM000236.
Figure A2-16. Lin-log plot of pressure recovery (▫) and derivative, dsp/d(ln dte) (+), versus equivalent time during the pumping test in SSM000236.

62
Interference test, SSM000224 - SSM000225
10 100 1,000 1.0E+4 1.0E+51.0E-4
0.001
0.01
0.1
1
Agarwal Equivalent Time (sec)
Rec
over
y (m
)Obs. Wells
SSM000225Aquifer Model
ConfinedSolution
TheisParameters
T = S = 0.003589Kz/Kr = 1b =
0.06361 m2/sec
17 m
Interference test, SSM000261 - SSM000260
10 100 1,000 1.0E+4 1.0E+5 1.0E+61.0E-4
0.001
0.01
0.1
1
Time (sec)
Dra
wdo
wn
(m)
Obs. WellsSSM000260
Aquifer ModelLeaky
SolutionHantush-Jacob
Parameters
T = S = 0.001433r/B = 0.07033Kz/Kr = 1b =
0.0006309 m2/sec
10 m
Figure A2-17. Log-log plot of pressure recovery (▫) and derivative, dsp/d(ln dte) (+), versus equivalent time in observation borehole SSM000225 during the interference test in SSM000224.
Figure A2-18. Log-log plot of drawdown (▫) and drawdown derivative, ds/d(ln t) (+), versus time in observation borehole SSM000260 during the interference test in SSM000261.

63
Interference test, SSM000261- SSM000030
100 1,000 1.0E+4 1.0E+5 1.0E+61.0E-4
0.001
0.01
0.1
1
Agarwal Equivalent Time (sec)
Rec
over
y (m
)
Obs. WellsSSM000030
Aquifer ModelLeaky
SolutionHantush-Jacob
Parameters
T = S = 0.0008411r/B = 0.7138Kz/Kr = 1b =
0.0006991 m2/sec
10 m
Interference test, SSM000265- SSM000266
10 100 1,000 1.0E+4 1.0E+51.0E-4
0.001
0.01
0.1
1
10
Agarwal Equivalent Time (sec)
Rec
over
y (m
)
Obs. WellsSSM000266
Aquifer ModelLeaky
SolutionHantush-Jacob
Parameters
T = S = 0.0002382r/B = 0.3569Kz/Kr = 1b =
6.011E-5 m2/sec
6 m
Figure A2-19. Log-log plot of pressure recovery (▫) and derivative, dsp/d(ln dte) (+), versus equivalent time in observation borehole SSM000030 during the interference test in SSM000261.
Figure A2-20. Log-log plot of pressure recovery (▫) and derivative, dsp/d(ln dte) (+), versus equivalent time in observation borehole SSM000266 during the interference test in SSM000265.
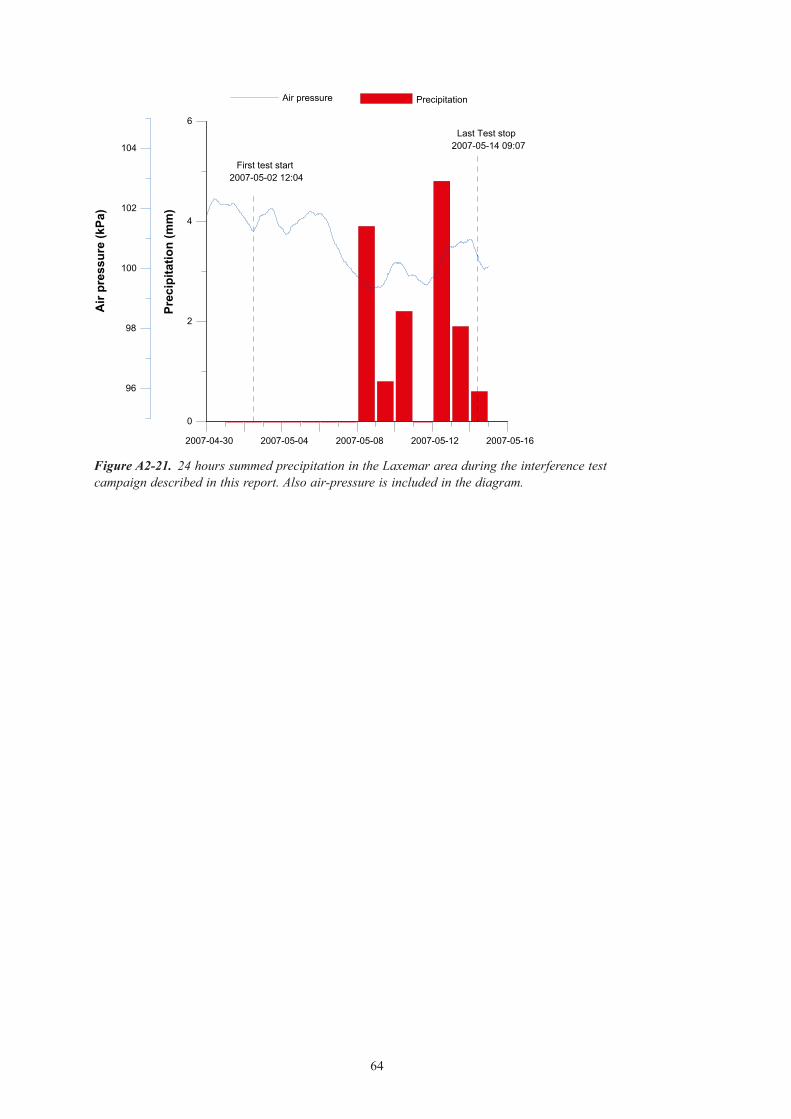
64
2007-04-30 2007-05-04 2007-05-08 2007-05-12 2007-05-16
0
2
4
6
96
98
100
102
104
Air
pres
sure
(kPa
)
Prec
ipita
tion
(mm
)First test start
2007-05-02 12:04
Last Test stop2007-05-14 09:07
PrecipitationAir pressure
Figure A2-21. 24 hours summed precipitation in the Laxemar area during the interference test campaign described in this report. Also air-pressure is included in the diagram.