OS TB 04/10/2002 - Table R69. Number and percent ... · TABLE R69. Number and percent distribution...
50
TABLE R69. Number and percent distribution of nonfatal occupational injuries and illnesses involving days away from work 1 by source of injury or illness and number of days away from work, 2000 Source Source code 2 Private industry 3 Percent of days-away-from-work cases involving — 1 day 2 days 3 - 5 days Number Percent Number Percent Number Percent Total ............................................. 1,664,018 267,383 16.1 214,566 12.9 331,806 19.9 Chemicals and chemical products ..... 0 25,411 8,145 32.1 4,680 18.4 5,257 20.7 Chemicals and chemical products, unspecified ....................................... 00 3,853 1,414 36.7 531 13.8 913 23.7 Acids .................................................. 01 1,609 460 28.6 394 24.5 248 15.4 Acids, unspecified .......................... 010 264 43 16.3 96 36.4 53 20.1 Acid gases— halogen .................... 011 80 66 82.5 5 6.2 1 1.2 Hydrogen fluoride ....................... 0113 47 38 80.9 – – 1 2.1 Inorganic acids— halogens ............ 012 320 47 14.7 37 11.6 98 30.6 Hydrochloric acid ........................ 0123 156 16 10.3 34 21.8 79 50.6 Hydrofluoric acid ........................ 0124 153 26 17.0 – – 20 13.1 Inorganic acids— other .................. 013 746 220 29.5 249 33.4 92 12.3 Nitric acid ................................... 0132 92 34 37.0 18 19.6 10 10.9 Sulfuric acid ................................ 0134 564 147 26.1 227 40.2 75 13.3 Inorganic acids, n.e.c. ............... 0139 69 32 46.4 1 1.4 1 1.4 Organic acids ................................. 014 143 63 44.1 2 1.4 2 1.4 Acetic acid, vinegar .................... 0141 79 7 8.9 – – 1 1.3 Carbolic acids ............................. 0143 55 53 96.4 – – 1 1.8 Multiple acids ................................. 018 17 16 94.1 1 5.9 – – Acids, n.e.c. ................................... 019 39 3 7.7 3 7.7 1 2.6 Alkalies ............................................... 02 1,185 322 27.2 204 17.2 219 18.5 Alkalies, unspecified ....................... 020 192 116 60.4 10 5.2 37 19.3 Calcium hydroxides, calcium oxides ........................................... 021 710 164 23.1 129 18.2 104 14.6 Cement, mortar mix— dry .......... 0211 94 15 16.0 19 20.2 13 13.8 Cement, mortar— wet ................ 0212 409 109 26.7 99 24.2 86 21.0 Lime ........................................... 0213 198 40 20.2 7 3.5 5 2.5 Limestone, calcium carbonate ... 0221 18 – – – – 9 50.0 Sodium and potassium hydroxide, potassium carbonate .................... 024 250 40 16.0 60 24.0 63 25.2 Aromatics and hydrocarbon derivatives, except halogenated ....... 03 905 177 19.6 186 20.6 173 19.1 Alcohols .......................................... 031 603 133 22.1 104 17.2 153 25.4 Alcohols, unspecified ................. 0310 44 2 4.5 30 68.2 1 2.3 Antifreeze ................................... 0311 413 86 20.8 54 13.1 149 36.1 Fusel oil ...................................... 0314 46 – – 3 6.5 – – Aldehydes ...................................... 032 54 7 13.0 12 22.2 2 3.7 Formaldehyde ............................ 0323 37 2 5.4 7 18.9 2 5.4 Aromatics ....................................... 034 174 26 14.9 35 20.1 4 2.3 Benzene ..................................... 0342 20 19 95.0 – – 1 5.0 Toluene ...................................... 0343 140 6 4.3 30 21.4 3 2.1 Acetone ...................................... 0361 18 10 55.6 2 11.1 5 27.8 Halogens and halogen compounds .... 04 897 379 42.3 166 18.5 208 23.2 Chlorine and chlorine compounds .. 042 665 255 38.3 127 19.1 173 26.0 Chlorine compounds, unspecified ............................... 0420 106 32 30.2 16 15.1 22 20.8 Chlorine, chlorine bleach ............ 0422 461 183 39.7 74 16.1 148 32.1 Chlorine compounds, n.e.c. ...... 0429 70 36 51.4 18 25.7 3 4.3 Fluorine and fluorine compounds ... 043 134 69 51.5 33 24.6 8 6.0 Fluorine ...................................... 0431 56 28 50.0 28 50.0 – – Fluorotrichloromethane .............. 0432 74 36 48.6 5 6.8 8 10.8 Iodine and iodine compounds ........ 044 62 53 85.5 5 8.1 – – Metallic particulates, trace elements, dusts, powders, fumes ..................... 05 1,063 469 44.1 105 9.9 258 24.3 Metallic particulates, trace elements, dusts, powders, fumes, unspecified ................................... 050 460 119 25.9 60 13.0 167 36.3 Lead and lead compounds ............. 054 20 3 15.0 – – 3 15.0 Other metallics and compounds ..... 056 70 16 22.9 3 4.3 21 30.0 Zinc and zinc compounds .......... 0568 19 2 10.5 – – 4 21.1 See footnotes at end of table. Page 1
Transcript of OS TB 04/10/2002 - Table R69. Number and percent ... · TABLE R69. Number and percent distribution...

TABLE R69. Number and percent distribution of nonfatal occupational injuries and illnesses involving days away from work1 bysource of injury or illness and number of days away from work, 2000
Source Sourcecode2
Privateindustry3
Percent of days-away-from-work cases involving —
1 day 2 days 3 - 5 days
Number Percent Number Percent Number Percent
Total ............................................. 1,664,018 267,383 16.1 214,566 12.9 331,806 19.9
Chemicals and chemical products ..... 0 25,411 8,145 32.1 4,680 18.4 5,257 20.7Chemicals and chemical products,unspecified ....................................... 00 3,853 1,414 36.7 531 13.8 913 23.7
Acids .................................................. 01 1,609 460 28.6 394 24.5 248 15.4Acids, unspecified .......................... 010 264 43 16.3 96 36.4 53 20.1Acid gases— halogen .................... 011 80 66 82.5 5 6.2 1 1.2
Hydrogen fluoride ....................... 0113 47 38 80.9 – – 1 2.1Inorganic acids— halogens ............ 012 320 47 14.7 37 11.6 98 30.6
Hydrochloric acid ........................ 0123 156 16 10.3 34 21.8 79 50.6Hydrofluoric acid ........................ 0124 153 26 17.0 – – 20 13.1
Inorganic acids— other .................. 013 746 220 29.5 249 33.4 92 12.3Nitric acid ................................... 0132 92 34 37.0 18 19.6 10 10.9Sulfuric acid ................................ 0134 564 147 26.1 227 40.2 75 13.3Inorganic acids, n.e.c. ............... 0139 69 32 46.4 1 1.4 1 1.4
Organic acids ................................. 014 143 63 44.1 2 1.4 2 1.4Acetic acid, vinegar .................... 0141 79 7 8.9 – – 1 1.3Carbolic acids ............................. 0143 55 53 96.4 – – 1 1.8
Multiple acids ................................. 018 17 16 94.1 1 5.9 – –Acids, n.e.c. ................................... 019 39 3 7.7 3 7.7 1 2.6
Alkalies ............................................... 02 1,185 322 27.2 204 17.2 219 18.5Alkalies, unspecified ....................... 020 192 116 60.4 10 5.2 37 19.3Calcium hydroxides, calciumoxides ........................................... 021 710 164 23.1 129 18.2 104 14.6
Cement, mortar mix— dry .......... 0211 94 15 16.0 19 20.2 13 13.8Cement, mortar— wet ................ 0212 409 109 26.7 99 24.2 86 21.0Lime ........................................... 0213 198 40 20.2 7 3.5 5 2.5Limestone, calcium carbonate ... 0221 18 – – – – 9 50.0
Sodium and potassium hydroxide,potassium carbonate .................... 024 250 40 16.0 60 24.0 63 25.2
Aromatics and hydrocarbonderivatives, except halogenated ....... 03 905 177 19.6 186 20.6 173 19.1
Alcohols .......................................... 031 603 133 22.1 104 17.2 153 25.4Alcohols, unspecified ................. 0310 44 2 4.5 30 68.2 1 2.3Antifreeze ................................... 0311 413 86 20.8 54 13.1 149 36.1Fusel oil ...................................... 0314 46 – – 3 6.5 – –
Aldehydes ...................................... 032 54 7 13.0 12 22.2 2 3.7Formaldehyde ............................ 0323 37 2 5.4 7 18.9 2 5.4
Aromatics ....................................... 034 174 26 14.9 35 20.1 4 2.3Benzene ..................................... 0342 20 19 95.0 – – 1 5.0Toluene ...................................... 0343 140 6 4.3 30 21.4 3 2.1Acetone ...................................... 0361 18 10 55.6 2 11.1 5 27.8
Halogens and halogen compounds .... 04 897 379 42.3 166 18.5 208 23.2Chlorine and chlorine compounds .. 042 665 255 38.3 127 19.1 173 26.0
Chlorine compounds,unspecified ............................... 0420 106 32 30.2 16 15.1 22 20.8
Chlorine, chlorine bleach ............ 0422 461 183 39.7 74 16.1 148 32.1Chlorine compounds, n.e.c. ...... 0429 70 36 51.4 18 25.7 3 4.3
Fluorine and fluorine compounds ... 043 134 69 51.5 33 24.6 8 6.0Fluorine ...................................... 0431 56 28 50.0 28 50.0 – –Fluorotrichloromethane .............. 0432 74 36 48.6 5 6.8 8 10.8
Iodine and iodine compounds ........ 044 62 53 85.5 5 8.1 – –Metallic particulates, trace elements,dusts, powders, fumes ..................... 05 1,063 469 44.1 105 9.9 258 24.3
Metallic particulates, traceelements, dusts, powders, fumes,unspecified ................................... 050 460 119 25.9 60 13.0 167 36.3
Lead and lead compounds ............. 054 20 3 15.0 – – 3 15.0Other metallics and compounds ..... 056 70 16 22.9 3 4.3 21 30.0
Zinc and zinc compounds .......... 0568 19 2 10.5 – – 4 21.1
See footnotes at end of table.
Page 1

TABLE R69. Number and percent distribution of nonfatal occupational injuries and illnesses involving days away from work1 bysource of injury or illness and number of days away from work, 2000 — Continued
Source
Percent of days-away-from-work cases involving — Mediandaysaway
from work
6 - 10 days 11 - 20 days 21 - 30 days 31 days or more
Number Percent Number Percent Number Percent Number Percent
Total ............................................. 210,890 12.7 185,564 11.2 103,643 6.2 350,166 21.0 6
Chemicals and chemical products ..... 2,571 10.1 1,978 7.8 886 3.5 1,893 7.4 2Chemicals and chemical products,unspecified ....................................... 318 8.3 194 5.0 181 4.7 301 7.8 2
Acids .................................................. 253 15.7 88 5.5 29 1.8 137 8.5 2Acids, unspecified .......................... 45 17.0 7 2.7 16 6.1 3 1.1 2Acid gases— halogen .................... 1 1.2 5 6.2 – – 2 2.5 1
Hydrogen fluoride ....................... 1 2.1 5 10.6 – – 2 4.3 1Inorganic acids— halogens ............ 133 41.6 – – 2 .6 2 .6 3
Hydrochloric acid ........................ 27 17.3 – – – – – – 3Hydrofluoric acid ........................ 106 69.3 – – – – 1 .7 6
Inorganic acids— other .................. 58 7.8 65 8.7 6 .8 56 7.5 2Nitric acid ................................... 1 1.1 11 12.0 1 1.1 18 19.6 2Sulfuric acid ................................ 34 6.0 53 9.4 5 .9 23 4.1 2Inorganic acids, n.e.c. ............... 19 27.5 1 1.4 – – 16 23.2 9
Organic acids ................................. – – 2 1.4 – – 72 50.3 34Acetic acid, vinegar .................... – – – – – – 71 89.9 34Carbolic acids ............................. – – – – – – 2 3.6 1
Multiple acids ................................. – – – – – – – – 1Acids, n.e.c. ................................... 17 43.6 10 25.6 5 12.8 – – 8
Alkalies ............................................... 263 22.2 89 7.5 65 5.5 24 2.0 4Alkalies, unspecified ....................... 13 6.8 10 5.2 3 1.6 3 1.6 1Calcium hydroxides, calciumoxides ........................................... 230 32.4 40 5.6 31 4.4 12 1.7 5Cement, mortar mix— dry .......... 28 29.8 4 4.3 8 8.5 7 7.4 3Cement, mortar— wet ................ 81 19.8 29 7.1 2 .5 2 .5 2Lime ........................................... 118 59.6 7 3.5 20 10.1 1 .5 6Limestone, calcium carbonate ... 3 16.7 2 11.1 3 16.7 – – 10
Sodium and potassium hydroxide,potassium carbonate .................... 16 6.4 36 14.4 27 10.8 8 3.2 3
Aromatics and hydrocarbonderivatives, except halogenated ....... 182 20.1 86 9.5 26 2.9 76 8.4 3
Alcohols .......................................... 55 9.1 83 13.8 21 3.5 54 9.0 3Alcohols, unspecified ................. 9 20.5 1 2.3 – – 1 2.3 2Antifreeze ................................... 32 7.7 49 11.9 21 5.1 23 5.6 3Fusel oil ...................................... 1 2.2 12 26.1 – – 31 67.4 109
Aldehydes ...................................... 25 46.3 – – – – 7 13.0 6Formaldehyde ............................ 25 67.6 – – – – – – 6
Aromatics ....................................... 96 55.2 1 .6 3 1.7 8 4.6 7Benzene ..................................... – – – – – – – – 1Toluene ...................................... 96 68.6 1 .7 3 2.1 – – 7Acetone ...................................... – – 1 5.6 – – – – 1
Halogens and halogen compounds .... 52 5.8 46 5.1 20 2.2 25 2.8 2Chlorine and chlorine compounds .. 31 4.7 41 6.2 15 2.3 22 3.3 2
Chlorine compounds,unspecified ............................... 13 12.3 1 .9 9 8.5 12 11.3 3
Chlorine, chlorine bleach ............ 10 2.2 40 8.7 – – 6 1.3 2Chlorine compounds, n.e.c. ...... 9 12.9 – – 1 1.4 3 4.3 1
Fluorine and fluorine compounds ... 21 15.7 – – – – 3 2.2 1Fluorine ...................................... – – – – – – – – 1Fluorotrichloromethane .............. 21 28.4 – – – – 3 4.1 2
Iodine and iodine compounds ........ – – – – 5 8.1 – – 1Metallic particulates, trace elements,dusts, powders, fumes ..................... 108 10.2 41 3.9 7 .7 76 7.1 2
Metallic particulates, traceelements, dusts, powders, fumes,unspecified ................................... 83 18.0 8 1.7 5 1.1 18 3.9 3
Lead and lead compounds ............. 1 5.0 11 55.0 1 5.0 – – 18Other metallics and compounds ..... 1 1.4 5 7.1 1 1.4 22 31.4 3
Zinc and zinc compounds .......... – – – – 1 5.3 12 63.2 91
See footnotes at end of table.
Page 2

TABLE R69. Number and percent distribution of nonfatal occupational injuries and illnesses involving days away from work1 bysource of injury or illness and number of days away from work, 2000 — Continued
Source Sourcecode2
Privateindustry3
Percent of days-away-from-work cases involving —
1 day 2 days 3 - 5 days
Number Percent Number Percent Number Percent
Welding or soldering fumes,unspecified or n.e.c. .................... 057 144 62 43.1 23 16.0 26 18.1
Metallic particulates, traceelements, dusts, powders, fumes,n.e.c. ........................................... 059 368 267 72.6 19 5.2 40 10.9
Agricultural chemicals and other pesticides ......................................... 06 844 271 32.1 184 21.8 148 17.5
Agricultural chemicals and other pesticides, unspecified ................. 060 220 149 67.7 18 8.2 31 14.1
Fertilizers, plant food, n.e.c. .......... 061 17 5 29.4 3 17.6 2 11.8Fumigants, n.e.c. ........................... 062 176 14 8.0 95 54.0 49 27.8Insecticides .................................... 065 382 94 24.6 67 17.5 49 12.8
Insecticides, unspecified ............ 0650 299 93 31.1 51 17.1 49 16.4Multiple insecticides ................... 0658 63 – – – – – –Insecticides, n.e.c. ..................... 0659 19 – – 15 78.9 – –
Chemical products— general ............. 07 9,079 2,971 32.7 1,833 20.2 1,878 20.7Chemical products, unspecified ..... 070 952 342 35.9 153 16.1 230 24.2Adhesives, glues, n.e.c. ................ 071 511 139 27.2 93 18.2 166 32.5Beauty preparations, cosmetics,n.e.c. ........................................... 072 210 39 18.6 82 39.0 14 6.7
Other beauty preparations,cosmetics ................................. 0729 172 22 12.8 72 41.9 14 8.1
Cleaning and polishing agents,disinfectants, n.e.c. ..................... 073 4,685 1,612 34.4 1,132 24.2 998 21.3
Cleaning and polishing agents,unspecified ............................... 0730 2,024 744 36.8 451 22.3 441 21.8
Bleach— nonchlorine,nonperoxide ............................. 0731 208 76 36.5 51 24.5 37 17.8
Disinfectants ............................... 0732 289 132 45.7 7 2.4 69 23.9Drain and oven cleaners ............ 0733 215 67 31.2 27 12.6 75 34.9Scouring powders ...................... 0735 20 16 80.0 1 5.0 – –Soap products ............................ 0736 373 109 29.2 115 30.8 63 16.9Synthetic detergents andshampoos ................................. 0737 313 29 9.3 89 28.4 68 21.7
Multiple cleaning and polishing agents ...................................... 0738 121 7 5.8 48 39.7 53 43.8
Other cleaning and polishingagents ...................................... 0739 1,111 424 38.2 338 30.4 193 17.4
Drugs, alcohol, medicines .............. 074 170 23 13.5 46 27.1 53 31.2Medicines ................................... 0743 151 13 8.6 41 27.2 51 33.8
Explosives, blasting agents, n.e.c. 075 423 4 .9 – – 6 1.4Flammable gas, unspecified ...... 0752 420 2 .5 – – 6 1.4
Paint, lacquer, shellac, varnish,n.e.c. ........................................... 076 916 380 41.5 95 10.4 172 18.8
Paint, lacquer, shellac, varnish,unspecified ............................... 0760 182 75 41.2 15 8.2 51 28.0
Lacquer, shellac, varnish ........... 0761 86 58 67.4 7 8.1 21 24.4Paint ........................................... 0762 469 165 35.2 69 14.7 99 21.1Multiple paint, lacquer, shellac,or varnish ................................. 0768 62 52 83.9 – – – –
Other paint, lacquer, shellac,varnish ...................................... 0769 117 30 25.6 4 3.4 1 .9
Solvents, degreasers, n.e.c. .......... 077 672 322 47.9 75 11.2 180 26.8Solvents, degreasers,unspecified ............................... 0770 277 78 28.2 49 17.7 81 29.2
Naphtha solvents ....................... 0771 90 18 20.0 8 8.9 60 66.7Paint removers, thinners ............ 0772 139 86 61.9 10 7.2 29 20.9Multiple solvents, degreasers ..... 0778 51 39 76.5 7 13.7 5 9.8Other solvents, degreasers ........ 0779 100 88 88.0 2 2.0 6 6.0
Other chemical products ................ 079 540 109 20.2 158 29.3 60 11.1Other chemical products,unspecified ............................... 0790 20 12 60.0 1 5.0 3 15.0
See footnotes at end of table.
Page 3

TABLE R69. Number and percent distribution of nonfatal occupational injuries and illnesses involving days away from work1 bysource of injury or illness and number of days away from work, 2000 — Continued
Source
Percent of days-away-from-work cases involving — Mediandaysaway
from work
6 - 10 days 11 - 20 days 21 - 30 days 31 days or more
Number Percent Number Percent Number Percent Number Percent
Welding or soldering fumes,unspecified or n.e.c. .................... 14 9.7 4 2.8 – – 14 9.7 2
Metallic particulates, traceelements, dusts, powders, fumes,n.e.c. ........................................... 8 2.2 13 3.5 – – 21 5.7 1
Agricultural chemicals and other pesticides ......................................... 127 15.0 69 8.2 – – 45 5.3 2
Agricultural chemicals and other pesticides, unspecified ................. 3 1.4 17 7.7 – – 1 .5 1
Fertilizers, plant food, n.e.c. .......... 5 29.4 2 11.8 – – – – 3Fumigants, n.e.c. ........................... 1 .6 4 2.3 – – 14 8.0 2Insecticides .................................... 118 30.9 46 12.0 – – 9 2.4 5
Insecticides, unspecified ............ 53 17.7 44 14.7 – – 9 3.0 5Multiple insecticides ................... 63 100.0 – – – – – – 9Insecticides, n.e.c. ..................... 2 10.5 2 10.5 – – – – 2
Chemical products— general ............. 800 8.8 923 10.2 315 3.5 358 3.9 2Chemical products, unspecified ..... 75 7.9 69 7.2 31 3.3 52 5.5 2Adhesives, glues, n.e.c. ................ 69 13.5 37 7.2 2 .4 4 .8 3Beauty preparations, cosmetics,n.e.c. ........................................... 64 30.5 2 1.0 – – 9 4.3 2Other beauty preparations,
cosmetics ................................. 64 37.2 – – – – – – 2Cleaning and polishing agents,disinfectants, n.e.c. ..................... 314 6.7 242 5.2 208 4.4 179 3.8 2Cleaning and polishing agents,
unspecified ............................... 95 4.7 115 5.7 108 5.3 70 3.5 2Bleach— nonchlorine,
nonperoxide ............................. 10 4.8 5 2.4 4 1.9 25 12.0 2Disinfectants ............................... 16 5.5 27 9.3 – – 39 13.5 3Drain and oven cleaners ............ 20 9.3 8 3.7 – – 17 7.9 3Scouring powders ...................... – – 3 15.0 – – – – 1Soap products ............................ 20 5.4 53 14.2 7 1.9 6 1.6 2Synthetic detergents and
shampoos ................................. 34 10.9 10 3.2 79 25.2 5 1.6 3Multiple cleaning and polishing
agents ...................................... 6 5.0 5 4.1 1 .8 – – 3Other cleaning and polishing
agents ...................................... 113 10.2 17 1.5 9 .8 18 1.6 2Drugs, alcohol, medicines .............. 38 22.4 2 1.2 1 .6 8 4.7 3
Medicines ................................... 36 23.8 2 1.3 – – 8 5.3 3Explosives, blasting agents, n.e.c. – – 393 92.9 1 .2 17 4.0 11
Flammable gas, unspecified ...... – – 393 93.6 – – 17 4.0 11Paint, lacquer, shellac, varnish,n.e.c. ........................................... 84 9.2 113 12.3 51 5.6 20 2.2 2Paint, lacquer, shellac, varnish,
unspecified ............................... 17 9.3 6 3.3 14 7.7 5 2.7 3Lacquer, shellac, varnish ........... – – – – – – – – 1Paint ........................................... 58 12.4 27 5.8 37 7.9 14 3.0 3Multiple paint, lacquer, shellac,
or varnish ................................. 8 12.9 1 1.6 – – – – 1Other paint, lacquer, shellac,
varnish ...................................... – – 80 68.4 – – 1 .9 16Solvents, degreasers, n.e.c. .......... 47 7.0 20 3.0 13 1.9 15 2.2 2
Solvents, degreasers,unspecified ............................... 34 12.3 7 2.5 13 4.7 15 5.4 3
Naphtha solvents ....................... 3 3.3 1 1.1 – – – – 3Paint removers, thinners ............ 6 4.3 8 5.8 – – – – 1Multiple solvents, degreasers ..... – – – – – – – – 1Other solvents, degreasers ........ 4 4.0 – – – – – – 1
Other chemical products ................ 109 20.2 45 8.3 8 1.5 52 9.6 3Other chemical products,
unspecified ............................... – – 1 5.0 – – 3 15.0 1
See footnotes at end of table.
Page 4

TABLE R69. Number and percent distribution of nonfatal occupational injuries and illnesses involving days away from work1 bysource of injury or illness and number of days away from work, 2000 — Continued
Source Sourcecode2
Privateindustry3
Percent of days-away-from-work cases involving —
1 day 2 days 3 - 5 days
Number Percent Number Percent Number Percent
Dyes, inks ................................... 0791 47 17 36.2 14 29.8 – –Tear gas, mace .......................... 0792 46 17 37.0 – – – –Photographic and copyingsolutions ................................... 0793 122 13 10.7 63 51.6 18 14.8
Chemical products, n.e.c. .......... 0799 305 50 16.4 79 25.9 39 12.8Coal, natural gas, petroleum fuelsand products, n.e.c. ......................... 08 2,483 579 23.3 499 20.1 378 15.2
Coal, natural gas, petroleum fuelsand products, unspecified ............ 080 44 28 63.6 3 6.8 3 6.8
Coal and coal products .................. 081 722 46 6.4 42 5.8 76 10.5Coal ............................................ 0811 720 46 6.4 42 5.8 75 10.4
Natural gas ..................................... 082 90 10 11.1 38 42.2 35 38.9Petroleum, crude oil ....................... 083 36 – – 1 2.8 30 83.3Petroleum fuels, distillates, andproducts, n.e.c. ............................ 084 1,573 479 30.5 413 26.3 234 14.9
Petroleum fuels, distillates, andproducts, unspecified ............... 0840 53 5 9.4 5 9.4 41 77.4
Gasoline, diesel fuel, jet fuel ...... 0842 307 73 23.8 52 16.9 57 18.6Lubricating greases, cuttingoils ............................................ 0844 545 202 37.1 164 30.1 90 16.5
Propane ...................................... 0845 298 96 32.2 139 46.6 36 12.1Other petroleum fuels, distillates,and products ............................ 0849 333 90 27.0 40 12.0 1 .3
Other coal, natural gas, petroleumfuels and products ........................ 089 18 15 83.3 – – – –
Other chemicals ................................. 09 3,494 1,104 31.6 577 16.5 835 23.9Ammonia and ammonium compounds ................................... 091 352 116 33.0 47 13.4 20 5.7
Ammonia and ammoniumcompounds, unspecified .......... 0910 206 64 31.1 36 17.5 14 6.8
Ammonium sulfate ..................... 0914 40 – – – – – –Ammonia and ammoniumcompounds, n.e.c. ................... 0919 64 39 60.9 – – 2 3.1
Oxygen and oxygen compounds,n.e.c. ........................................... 094 909 364 40.0 155 17.1 316 34.8
Oxygen and oxygen compounds,unspecified ............................... 0940 63 27 42.9 – – – –
Carbon monoxide ....................... 0941 753 270 35.9 148 19.7 299 39.7Carbon dioxide, dry ice .............. 0942 56 30 53.6 7 12.5 17 30.4
Plastics, resins ............................... 095 552 147 26.6 82 14.9 66 12.0Plastics, unspecified ................... 0950 170 39 22.9 5 2.9 18 10.6Resins ........................................ 0952 158 46 29.1 41 25.9 18 11.4Plastics, n.e.c. ........................... 0959 188 61 32.4 36 19.1 9 4.8
Sewer gas, mine gas, methane ...... 096 48 6 12.5 8 16.7 13 27.1Sulfur and sulfur compounds ......... 097 108 69 63.9 32 29.6 – –
Sulfur and sulfur compounds,n.e.c. ....................................... 0979 39 37 94.9 – – – –
Multiple chemicals or chemicalmixtures, n.e.c. ............................ 098 228 31 13.6 51 22.4 68 29.8
Chlorine and cleaning agent,n.e.c. ....................................... 0983 56 10 17.9 7 12.5 33 58.9
Other multiple chemicals orchemical mixtures .................... 0989 111 18 16.2 41 36.9 35 31.5
Chemicals and chemical products, n.e.c. ........................................... 099 1,270 369 29.1 194 15.3 336 26.5
Containers ............................................ 1 240,068 35,294 14.7 30,569 12.7 50,973 21.2Containers, unspecified ...................... 10 6,681 835 12.5 672 10.1 1,413 21.1Containers— nonpressurized ............. 11 171,412 25,339 14.8 22,363 13.0 35,903 20.9
Containers— nonpressurized,unspecified ................................... 110 4,244 550 13.0 503 11.9 1,006 23.7
Bags, sacks, totes .......................... 111 20,100 3,063 15.2 2,389 11.9 4,873 24.2
See footnotes at end of table.
Page 5

TABLE R69. Number and percent distribution of nonfatal occupational injuries and illnesses involving days away from work1 bysource of injury or illness and number of days away from work, 2000 — Continued
Source
Percent of days-away-from-work cases involving — Mediandaysaway
from work
6 - 10 days 11 - 20 days 21 - 30 days 31 days or more
Number Percent Number Percent Number Percent Number Percent
Dyes, inks ................................... 5 10.6 10 21.3 – – 1 2.1 2Tear gas, mace .......................... – – 26 56.5 – – 2 4.3 19Photographic and copying
solutions ................................... 14 11.5 – – 1 0.8 12 9.8 2Chemical products, n.e.c. .......... 89 29.2 8 2.6 7 2.3 33 10.8 3
Coal, natural gas, petroleum fuelsand products, n.e.c. ......................... 190 7.7 154 6.2 117 4.7 566 22.8 3
Coal, natural gas, petroleum fuelsand products, unspecified ............ 4 9.1 – – 1 2.3 4 9.1 1
Coal and coal products .................. 80 11.1 76 10.5 49 6.8 353 48.9 28Coal ............................................ 80 11.1 76 10.6 49 6.8 353 49.0 28
Natural gas ..................................... – – 1 1.1 6 6.7 – – 2Petroleum, crude oil ....................... – – – – 1 2.8 3 8.3 3Petroleum fuels, distillates, andproducts, n.e.c. ............................ 106 6.7 75 4.8 60 3.8 206 13.1 2Petroleum fuels, distillates, and
products, unspecified ............... 3 5.7 – – – – – – 5Gasoline, diesel fuel, jet fuel ...... 23 7.5 55 17.9 22 7.2 24 7.8 4Lubricating greases, cutting
oils ............................................ 31 5.7 18 3.3 17 3.1 23 4.2 2Propane ...................................... 13 4.4 – – 7 2.3 7 2.3 2Other petroleum fuels, distillates,
and products ............................ 37 11.1 1 .3 13 3.9 152 45.6 7Other coal, natural gas, petroleumfuels and products ........................ – – 3 16.7 – – – – 1
Other chemicals ................................. 278 8.0 288 8.2 127 3.6 286 8.2 3Ammonia and ammonium compounds ................................... 64 18.2 98 27.8 – – 8 2.3 4Ammonia and ammonium
compounds, unspecified .......... 16 7.8 72 35.0 – – 5 2.4 3Ammonium sulfate ..................... 40 100.0 – – – – – – 7Ammonia and ammonium
compounds, n.e.c. ................... – – 23 35.9 – – – – 1Oxygen and oxygen compounds,n.e.c. ........................................... 14 1.5 12 1.3 5 .6 43 4.7 2Oxygen and oxygen compounds,
unspecified ............................... – – – – – – 36 57.1 123Carbon monoxide ....................... 12 1.6 12 1.6 5 .7 6 .8 2Carbon dioxide, dry ice .............. 2 3.6 – – – – – – 1
Plastics, resins ............................... 64 11.6 81 14.7 23 4.2 91 16.5 5Plastics, unspecified ................... 11 6.5 63 37.1 18 10.6 16 9.4 13Resins ........................................ 32 20.3 8 5.1 5 3.2 9 5.7 2Plastics, n.e.c. ........................... 16 8.5 3 1.6 – – 63 33.5 2
Sewer gas, mine gas, methane ...... 11 22.9 9 18.8 – – 2 4.2 3Sulfur and sulfur compounds ......... – – 2 1.9 3 2.8 2 1.9 1
Sulfur and sulfur compounds,n.e.c. ....................................... – – 1 2.6 – – 1 2.6 1
Multiple chemicals or chemicalmixtures, n.e.c. ............................ 16 7.0 – – 38 16.7 23 10.1 5Chlorine and cleaning agent,
n.e.c. ....................................... 2 3.6 – – 3 5.4 – – 5Other multiple chemicals or
chemical mixtures .................... – – – – 1 .9 16 14.4 2Chemicals and chemical products, n.e.c. ........................................... 108 8.5 87 6.9 58 4.6 117 9.2 3
Containers ............................................ 32,634 13.6 27,656 11.5 15,319 6.4 47,622 19.8 6Containers, unspecified ...................... 946 14.2 722 10.8 436 6.5 1,658 24.8 7Containers— nonpressurized ............. 23,051 13.4 19,277 11.2 10,606 6.2 34,873 20.3 6
Containers— nonpressurized,unspecified ................................... 453 10.7 644 15.2 205 4.8 881 20.8 6
Bags, sacks, totes .......................... 2,448 12.2 2,019 10.0 1,290 6.4 4,019 20.0 5
See footnotes at end of table.
Page 6
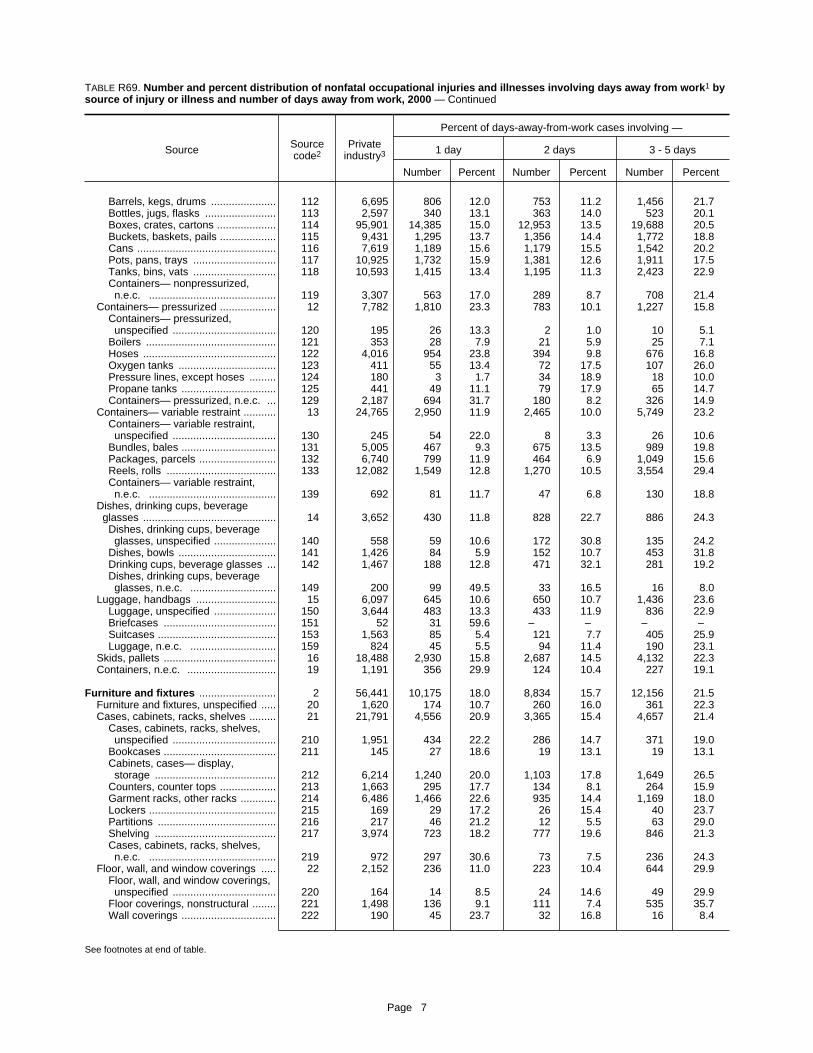
TABLE R69. Number and percent distribution of nonfatal occupational injuries and illnesses involving days away from work1 bysource of injury or illness and number of days away from work, 2000 — Continued
Source Sourcecode2
Privateindustry3
Percent of days-away-from-work cases involving —
1 day 2 days 3 - 5 days
Number Percent Number Percent Number Percent
Barrels, kegs, drums ...................... 112 6,695 806 12.0 753 11.2 1,456 21.7Bottles, jugs, flasks ........................ 113 2,597 340 13.1 363 14.0 523 20.1Boxes, crates, cartons .................... 114 95,901 14,385 15.0 12,953 13.5 19,688 20.5Buckets, baskets, pails ................... 115 9,431 1,295 13.7 1,356 14.4 1,772 18.8Cans ............................................... 116 7,619 1,189 15.6 1,179 15.5 1,542 20.2Pots, pans, trays ............................ 117 10,925 1,732 15.9 1,381 12.6 1,911 17.5Tanks, bins, vats ............................ 118 10,593 1,415 13.4 1,195 11.3 2,423 22.9Containers— nonpressurized,n.e.c. ........................................... 119 3,307 563 17.0 289 8.7 708 21.4
Containers— pressurized ................... 12 7,782 1,810 23.3 783 10.1 1,227 15.8Containers— pressurized,unspecified ................................... 120 195 26 13.3 2 1.0 10 5.1
Boilers ............................................ 121 353 28 7.9 21 5.9 25 7.1Hoses ............................................. 122 4,016 954 23.8 394 9.8 676 16.8Oxygen tanks ................................. 123 411 55 13.4 72 17.5 107 26.0Pressure lines, except hoses ......... 124 180 3 1.7 34 18.9 18 10.0Propane tanks ................................ 125 441 49 11.1 79 17.9 65 14.7Containers— pressurized, n.e.c. ... 129 2,187 694 31.7 180 8.2 326 14.9
Containers— variable restraint ........... 13 24,765 2,950 11.9 2,465 10.0 5,749 23.2Containers— variable restraint,unspecified ................................... 130 245 54 22.0 8 3.3 26 10.6
Bundles, bales ................................ 131 5,005 467 9.3 675 13.5 989 19.8Packages, parcels .......................... 132 6,740 799 11.9 464 6.9 1,049 15.6Reels, rolls ..................................... 133 12,082 1,549 12.8 1,270 10.5 3,554 29.4Containers— variable restraint,n.e.c. ........................................... 139 692 81 11.7 47 6.8 130 18.8
Dishes, drinking cups, beverage glasses ............................................. 14 3,652 430 11.8 828 22.7 886 24.3
Dishes, drinking cups, beverageglasses, unspecified ..................... 140 558 59 10.6 172 30.8 135 24.2
Dishes, bowls ................................. 141 1,426 84 5.9 152 10.7 453 31.8Drinking cups, beverage glasses ... 142 1,467 188 12.8 471 32.1 281 19.2Dishes, drinking cups, beverageglasses, n.e.c. ............................. 149 200 99 49.5 33 16.5 16 8.0
Luggage, handbags ........................... 15 6,097 645 10.6 650 10.7 1,436 23.6Luggage, unspecified ..................... 150 3,644 483 13.3 433 11.9 836 22.9Briefcases ...................................... 151 52 31 59.6 – – – –Suitcases ........................................ 153 1,563 85 5.4 121 7.7 405 25.9Luggage, n.e.c. ............................. 159 824 45 5.5 94 11.4 190 23.1
Skids, pallets ...................................... 16 18,488 2,930 15.8 2,687 14.5 4,132 22.3Containers, n.e.c. .............................. 19 1,191 356 29.9 124 10.4 227 19.1
Furniture and fixtures .......................... 2 56,441 10,175 18.0 8,834 15.7 12,156 21.5Furniture and fixtures, unspecified ..... 20 1,620 174 10.7 260 16.0 361 22.3Cases, cabinets, racks, shelves ......... 21 21,791 4,556 20.9 3,365 15.4 4,657 21.4
Cases, cabinets, racks, shelves, unspecified ................................... 210 1,951 434 22.2 286 14.7 371 19.0
Bookcases ...................................... 211 145 27 18.6 19 13.1 19 13.1Cabinets, cases— display,storage ......................................... 212 6,214 1,240 20.0 1,103 17.8 1,649 26.5
Counters, counter tops ................... 213 1,663 295 17.7 134 8.1 264 15.9Garment racks, other racks ............ 214 6,486 1,466 22.6 935 14.4 1,169 18.0Lockers ........................................... 215 169 29 17.2 26 15.4 40 23.7Partitions ........................................ 216 217 46 21.2 12 5.5 63 29.0Shelving ......................................... 217 3,974 723 18.2 777 19.6 846 21.3Cases, cabinets, racks, shelves,n.e.c. ........................................... 219 972 297 30.6 73 7.5 236 24.3
Floor, wall, and window coverings ..... 22 2,152 236 11.0 223 10.4 644 29.9Floor, wall, and window coverings, unspecified ................................... 220 164 14 8.5 24 14.6 49 29.9
Floor coverings, nonstructural ........ 221 1,498 136 9.1 111 7.4 535 35.7Wall coverings ................................ 222 190 45 23.7 32 16.8 16 8.4
See footnotes at end of table.
Page 7
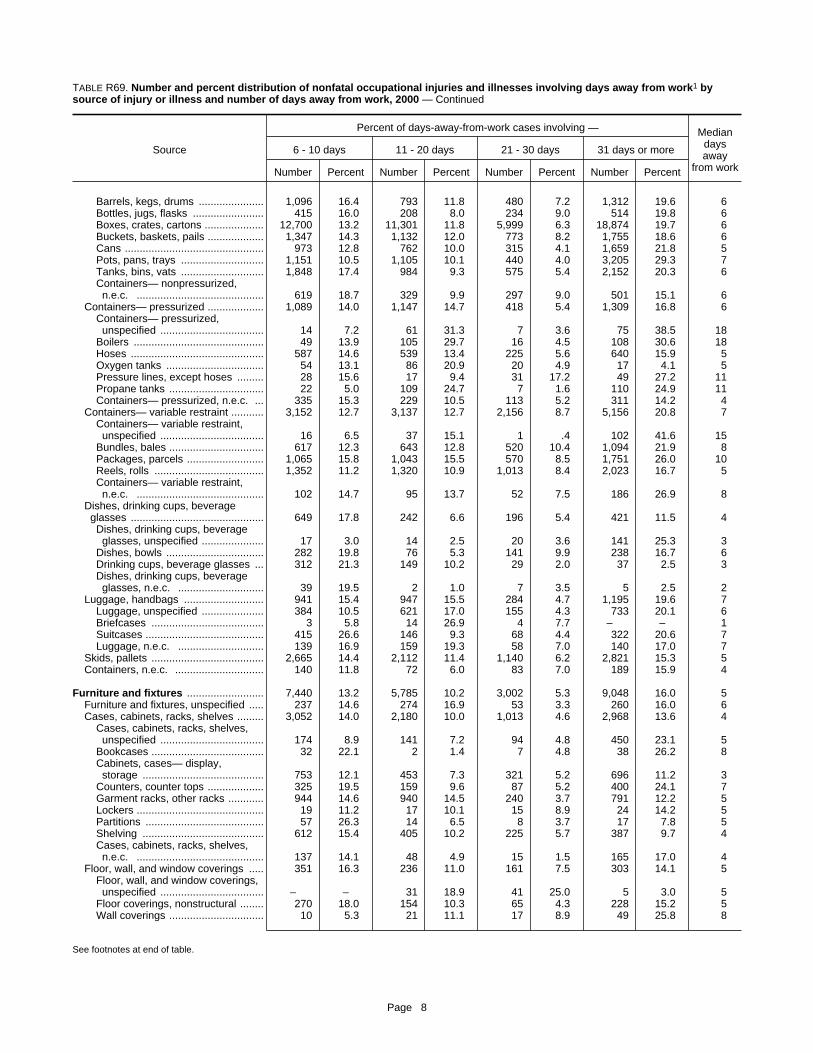
TABLE R69. Number and percent distribution of nonfatal occupational injuries and illnesses involving days away from work1 bysource of injury or illness and number of days away from work, 2000 — Continued
Source
Percent of days-away-from-work cases involving — Mediandaysaway
from work
6 - 10 days 11 - 20 days 21 - 30 days 31 days or more
Number Percent Number Percent Number Percent Number Percent
Barrels, kegs, drums ...................... 1,096 16.4 793 11.8 480 7.2 1,312 19.6 6Bottles, jugs, flasks ........................ 415 16.0 208 8.0 234 9.0 514 19.8 6Boxes, crates, cartons .................... 12,700 13.2 11,301 11.8 5,999 6.3 18,874 19.7 6Buckets, baskets, pails ................... 1,347 14.3 1,132 12.0 773 8.2 1,755 18.6 6Cans ............................................... 973 12.8 762 10.0 315 4.1 1,659 21.8 5Pots, pans, trays ............................ 1,151 10.5 1,105 10.1 440 4.0 3,205 29.3 7Tanks, bins, vats ............................ 1,848 17.4 984 9.3 575 5.4 2,152 20.3 6Containers— nonpressurized,n.e.c. ........................................... 619 18.7 329 9.9 297 9.0 501 15.1 6
Containers— pressurized ................... 1,089 14.0 1,147 14.7 418 5.4 1,309 16.8 6Containers— pressurized,unspecified ................................... 14 7.2 61 31.3 7 3.6 75 38.5 18
Boilers ............................................ 49 13.9 105 29.7 16 4.5 108 30.6 18Hoses ............................................. 587 14.6 539 13.4 225 5.6 640 15.9 5Oxygen tanks ................................. 54 13.1 86 20.9 20 4.9 17 4.1 5Pressure lines, except hoses ......... 28 15.6 17 9.4 31 17.2 49 27.2 11Propane tanks ................................ 22 5.0 109 24.7 7 1.6 110 24.9 11Containers— pressurized, n.e.c. ... 335 15.3 229 10.5 113 5.2 311 14.2 4
Containers— variable restraint ........... 3,152 12.7 3,137 12.7 2,156 8.7 5,156 20.8 7Containers— variable restraint,unspecified ................................... 16 6.5 37 15.1 1 .4 102 41.6 15
Bundles, bales ................................ 617 12.3 643 12.8 520 10.4 1,094 21.9 8Packages, parcels .......................... 1,065 15.8 1,043 15.5 570 8.5 1,751 26.0 10Reels, rolls ..................................... 1,352 11.2 1,320 10.9 1,013 8.4 2,023 16.7 5Containers— variable restraint,n.e.c. ........................................... 102 14.7 95 13.7 52 7.5 186 26.9 8
Dishes, drinking cups, beverage glasses ............................................. 649 17.8 242 6.6 196 5.4 421 11.5 4
Dishes, drinking cups, beverageglasses, unspecified ..................... 17 3.0 14 2.5 20 3.6 141 25.3 3
Dishes, bowls ................................. 282 19.8 76 5.3 141 9.9 238 16.7 6Drinking cups, beverage glasses ... 312 21.3 149 10.2 29 2.0 37 2.5 3Dishes, drinking cups, beverageglasses, n.e.c. ............................. 39 19.5 2 1.0 7 3.5 5 2.5 2
Luggage, handbags ........................... 941 15.4 947 15.5 284 4.7 1,195 19.6 7Luggage, unspecified ..................... 384 10.5 621 17.0 155 4.3 733 20.1 6Briefcases ...................................... 3 5.8 14 26.9 4 7.7 – – 1Suitcases ........................................ 415 26.6 146 9.3 68 4.4 322 20.6 7Luggage, n.e.c. ............................. 139 16.9 159 19.3 58 7.0 140 17.0 7
Skids, pallets ...................................... 2,665 14.4 2,112 11.4 1,140 6.2 2,821 15.3 5Containers, n.e.c. .............................. 140 11.8 72 6.0 83 7.0 189 15.9 4
Furniture and fixtures .......................... 7,440 13.2 5,785 10.2 3,002 5.3 9,048 16.0 5Furniture and fixtures, unspecified ..... 237 14.6 274 16.9 53 3.3 260 16.0 6Cases, cabinets, racks, shelves ......... 3,052 14.0 2,180 10.0 1,013 4.6 2,968 13.6 4
Cases, cabinets, racks, shelves, unspecified ................................... 174 8.9 141 7.2 94 4.8 450 23.1 5
Bookcases ...................................... 32 22.1 2 1.4 7 4.8 38 26.2 8Cabinets, cases— display,storage ......................................... 753 12.1 453 7.3 321 5.2 696 11.2 3
Counters, counter tops ................... 325 19.5 159 9.6 87 5.2 400 24.1 7Garment racks, other racks ............ 944 14.6 940 14.5 240 3.7 791 12.2 5Lockers ........................................... 19 11.2 17 10.1 15 8.9 24 14.2 5Partitions ........................................ 57 26.3 14 6.5 8 3.7 17 7.8 5Shelving ......................................... 612 15.4 405 10.2 225 5.7 387 9.7 4Cases, cabinets, racks, shelves,n.e.c. ........................................... 137 14.1 48 4.9 15 1.5 165 17.0 4
Floor, wall, and window coverings ..... 351 16.3 236 11.0 161 7.5 303 14.1 5Floor, wall, and window coverings, unspecified ................................... – – 31 18.9 41 25.0 5 3.0 5
Floor coverings, nonstructural ........ 270 18.0 154 10.3 65 4.3 228 15.2 5Wall coverings ................................ 10 5.3 21 11.1 17 8.9 49 25.8 8
See footnotes at end of table.
Page 8
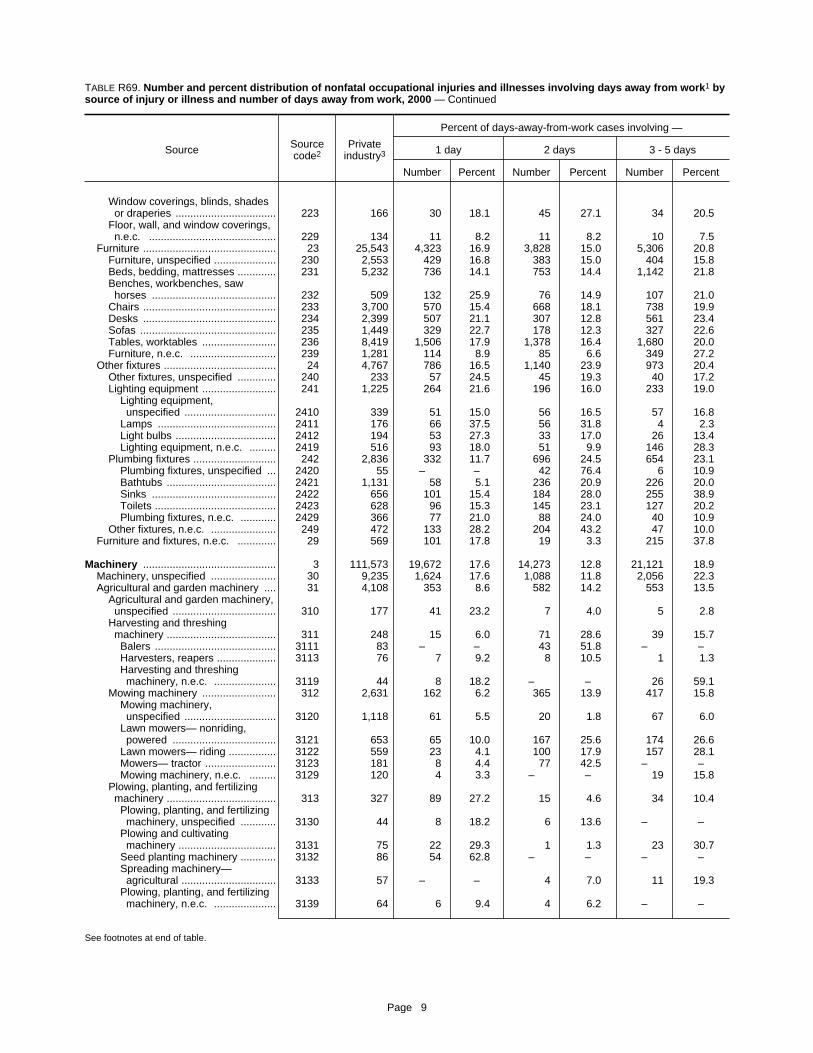
TABLE R69. Number and percent distribution of nonfatal occupational injuries and illnesses involving days away from work1 bysource of injury or illness and number of days away from work, 2000 — Continued
Source Sourcecode2
Privateindustry3
Percent of days-away-from-work cases involving —
1 day 2 days 3 - 5 days
Number Percent Number Percent Number Percent
Window coverings, blinds, shadesor draperies .................................. 223 166 30 18.1 45 27.1 34 20.5
Floor, wall, and window coverings,n.e.c. ........................................... 229 134 11 8.2 11 8.2 10 7.5
Furniture ............................................. 23 25,543 4,323 16.9 3,828 15.0 5,306 20.8Furniture, unspecified ..................... 230 2,553 429 16.8 383 15.0 404 15.8Beds, bedding, mattresses ............. 231 5,232 736 14.1 753 14.4 1,142 21.8Benches, workbenches, sawhorses .......................................... 232 509 132 25.9 76 14.9 107 21.0
Chairs ............................................. 233 3,700 570 15.4 668 18.1 738 19.9Desks ............................................. 234 2,399 507 21.1 307 12.8 561 23.4Sofas .............................................. 235 1,449 329 22.7 178 12.3 327 22.6Tables, worktables ......................... 236 8,419 1,506 17.9 1,378 16.4 1,680 20.0Furniture, n.e.c. ............................. 239 1,281 114 8.9 85 6.6 349 27.2
Other fixtures ...................................... 24 4,767 786 16.5 1,140 23.9 973 20.4Other fixtures, unspecified ............. 240 233 57 24.5 45 19.3 40 17.2Lighting equipment ......................... 241 1,225 264 21.6 196 16.0 233 19.0
Lighting equipment,unspecified ............................... 2410 339 51 15.0 56 16.5 57 16.8
Lamps ........................................ 2411 176 66 37.5 56 31.8 4 2.3Light bulbs .................................. 2412 194 53 27.3 33 17.0 26 13.4Lighting equipment, n.e.c. ......... 2419 516 93 18.0 51 9.9 146 28.3
Plumbing fixtures ............................ 242 2,836 332 11.7 696 24.5 654 23.1Plumbing fixtures, unspecified ... 2420 55 – – 42 76.4 6 10.9Bathtubs ..................................... 2421 1,131 58 5.1 236 20.9 226 20.0Sinks .......................................... 2422 656 101 15.4 184 28.0 255 38.9Toilets ......................................... 2423 628 96 15.3 145 23.1 127 20.2Plumbing fixtures, n.e.c. ............ 2429 366 77 21.0 88 24.0 40 10.9
Other fixtures, n.e.c. ...................... 249 472 133 28.2 204 43.2 47 10.0Furniture and fixtures, n.e.c. ............. 29 569 101 17.8 19 3.3 215 37.8
Machinery ............................................. 3 111,573 19,672 17.6 14,273 12.8 21,121 18.9Machinery, unspecified ...................... 30 9,235 1,624 17.6 1,088 11.8 2,056 22.3Agricultural and garden machinery .... 31 4,108 353 8.6 582 14.2 553 13.5
Agricultural and garden machinery,unspecified ................................... 310 177 41 23.2 7 4.0 5 2.8
Harvesting and threshingmachinery ..................................... 311 248 15 6.0 71 28.6 39 15.7
Balers ......................................... 3111 83 – – 43 51.8 – –Harvesters, reapers .................... 3113 76 7 9.2 8 10.5 1 1.3Harvesting and threshingmachinery, n.e.c. ..................... 3119 44 8 18.2 – – 26 59.1
Mowing machinery ......................... 312 2,631 162 6.2 365 13.9 417 15.8Mowing machinery,unspecified ............................... 3120 1,118 61 5.5 20 1.8 67 6.0
Lawn mowers— nonriding,powered ................................... 3121 653 65 10.0 167 25.6 174 26.6
Lawn mowers— riding ................ 3122 559 23 4.1 100 17.9 157 28.1Mowers— tractor ........................ 3123 181 8 4.4 77 42.5 – –Mowing machinery, n.e.c. ......... 3129 120 4 3.3 – – 19 15.8
Plowing, planting, and fertilizingmachinery ..................................... 313 327 89 27.2 15 4.6 34 10.4
Plowing, planting, and fertilizingmachinery, unspecified ............ 3130 44 8 18.2 6 13.6 – –
Plowing and cultivatingmachinery ................................. 3131 75 22 29.3 1 1.3 23 30.7
Seed planting machinery ............ 3132 86 54 62.8 – – – –Spreading machinery—agricultural ................................ 3133 57 – – 4 7.0 11 19.3
Plowing, planting, and fertilizingmachinery, n.e.c. ..................... 3139 64 6 9.4 4 6.2 – –
See footnotes at end of table.
Page 9

TABLE R69. Number and percent distribution of nonfatal occupational injuries and illnesses involving days away from work1 bysource of injury or illness and number of days away from work, 2000 — Continued
Source
Percent of days-away-from-work cases involving — Mediandaysaway
from work
6 - 10 days 11 - 20 days 21 - 30 days 31 days or more
Number Percent Number Percent Number Percent Number Percent
Window coverings, blinds, shadesor draperies .................................. 19 11.4 8 4.8 23 13.9 8 4.8 4
Floor, wall, and window coverings,n.e.c. ........................................... 52 38.8 22 16.4 13 9.7 14 10.4 7
Furniture ............................................. 3,354 13.1 2,729 10.7 1,621 6.3 4,383 17.2 5Furniture, unspecified ..................... 315 12.3 157 6.1 140 5.5 726 28.4 6Beds, bedding, mattresses ............. 598 11.4 535 10.2 278 5.3 1,191 22.8 5Benches, workbenches, sawhorses .......................................... 63 12.4 50 9.8 9 1.8 71 13.9 3
Chairs ............................................. 449 12.1 515 13.9 264 7.1 496 13.4 5Desks ............................................. 444 18.5 191 8.0 145 6.0 245 10.2 4Sofas .............................................. 144 9.9 65 4.5 183 12.6 223 15.4 5Tables, worktables ......................... 938 11.1 1,162 13.8 553 6.6 1,203 14.3 5Furniture, n.e.c. ............................. 404 31.5 53 4.1 48 3.7 228 17.8 8
Other fixtures ...................................... 406 8.5 341 7.2 152 3.2 968 20.3 3Other fixtures, unspecified ............. 19 8.2 33 14.2 13 5.6 26 11.2 3Lighting equipment ......................... 156 12.7 86 7.0 46 3.8 246 20.1 4
Lighting equipment,unspecified ............................... 32 9.4 34 10.0 36 10.6 73 21.5 6
Lamps ........................................ 32 18.2 2 1.1 – – 16 9.1 2Light bulbs .................................. 37 19.1 26 13.4 10 5.2 9 4.6 3Lighting equipment, n.e.c. ......... 54 10.5 24 4.7 – – 148 28.7 5
Plumbing fixtures ............................ 195 6.9 195 6.9 85 3.0 679 23.9 4Plumbing fixtures, unspecified ... – – 2 3.6 1 1.8 5 9.1 2Bathtubs ..................................... 87 7.7 68 6.0 27 2.4 429 37.9 7Sinks .......................................... 43 6.6 14 2.1 41 6.2 17 2.6 3Toilets ......................................... 23 3.7 83 13.2 13 2.1 140 22.3 3Plumbing fixtures, n.e.c. ............ 42 11.5 29 7.9 2 .5 88 24.0 3
Other fixtures, n.e.c. ...................... 36 7.6 26 5.5 8 1.7 18 3.8 2Furniture and fixtures, n.e.c. ............. 40 7.0 26 4.6 1 .2 166 29.2 5
Machinery ............................................. 14,715 13.2 12,228 11.0 7,401 6.6 22,164 19.9 6Machinery, unspecified ...................... 948 10.3 740 8.0 513 5.6 2,267 24.5 5Agricultural and garden machinery .... 482 11.7 610 14.8 675 16.4 853 20.8 12
Agricultural and garden machinery,unspecified ................................... 9 5.1 59 33.3 – – 56 31.6 18
Harvesting and threshingmachinery ..................................... 10 4.0 76 30.6 9 3.6 27 10.9 5Balers ......................................... – – 33 39.8 7 8.4 – – 2Harvesters, reapers .................... 9 11.8 42 55.3 2 2.6 7 9.2 20Harvesting and threshing
machinery, n.e.c. ..................... 1 2.3 1 2.3 – – 7 15.9 4Mowing machinery ......................... 355 13.5 269 10.2 623 23.7 439 16.7 11
Mowing machinery,unspecified ............................... 44 3.9 124 11.1 550 49.2 251 22.5 28
Lawn mowers— nonriding,powered ................................... 149 22.8 18 2.8 10 1.5 70 10.7 4
Lawn mowers— riding ................ 123 22.0 61 10.9 39 7.0 55 9.8 5Mowers— tractor ........................ 33 18.2 35 19.3 – – 29 16.0 7Mowing machinery, n.e.c. ......... 6 5.0 31 25.8 25 20.8 34 28.3 17
Plowing, planting, and fertilizingmachinery ..................................... 41 12.5 44 13.5 38 11.6 65 19.9 7Plowing, planting, and fertilizing
machinery, unspecified ............ – – – – 29 65.9 1 2.3 23Plowing and cultivating
machinery ................................. – – 9 12.0 5 6.7 15 20.0 5Seed planting machinery ............ 5 5.8 21 24.4 – – 6 7.0 1Spreading machinery—
agricultural ................................ 27 47.4 5 8.8 4 7.0 7 12.3 6Plowing, planting, and fertilizing
machinery, n.e.c. ..................... 9 14.1 9 14.1 – – 36 56.2 46
See footnotes at end of table.
Page 10

TABLE R69. Number and percent distribution of nonfatal occupational injuries and illnesses involving days away from work1 bysource of injury or illness and number of days away from work, 2000 — Continued
Source Sourcecode2
Privateindustry3
Percent of days-away-from-work cases involving —
1 day 2 days 3 - 5 days
Number Percent Number Percent Number Percent
Other agricultural and gardenmachinery ..................................... 319 725 46 6.3 124 17.1 58 8.0
Other agricultural and gardenmachinery, unspecified ............ 3190 50 3 6.0 13 26.0 15 30.0
Feed grinders, crushers,mixers— agricultural ................ 3192 44 6 13.6 18 40.9 – –
Spraying and dustingmachinery— agricultural .......... 3193 178 – – 3 1.7 13 7.3
Agricultural and gardenmachinery, n.e.c. ..................... 3199 443 34 7.7 91 20.5 30 6.8
Construction, logging, and miningmachinery ......................................... 32 6,896 599 8.7 913 13.2 914 13.3
Construction, logging, and miningmachinery, unspecified ................ 320 185 38 20.5 9 4.9 5 2.7
Excavating machinery .................... 321 1,634 88 5.4 221 13.5 220 13.5Excavating machinery,unspecified ............................... 3210 156 2 1.3 99 63.5 39 25.0
Backhoes ................................... 3211 672 43 6.4 101 15.0 135 20.1Bulldozers .................................. 3212 216 3 1.4 14 6.5 16 7.4Steam and power shovels .......... 3213 40 – – – – – –Trenchers ................................... 3214 416 10 2.4 6 1.4 16 3.8Excavating machinery, n.e.c. .... 3219 135 29 21.5 – – 13 9.6
Loaders .......................................... 322 1,306 117 9.0 80 6.1 206 15.8Loaders, unspecified .................. 3220 553 55 9.9 17 3.1 37 6.7Bucket loaders ........................... 3221 165 23 13.9 19 11.5 59 35.8End loaders ................................ 3222 58 – – – – – –Front end loaders ....................... 3223 272 4 1.5 39 14.3 97 35.7Loaders, n.e.c. .......................... 3229 258 35 13.6 5 1.9 13 5.0
Logging and wood processingmachinery— specialized .............. 323 533 51 9.6 14 2.6 93 17.4
Chippers ..................................... 3231 87 2 2.3 5 5.7 7 8.0Debarkers ................................... 3232 66 3 4.5 – – – –Log loaders, including heelboom ........................................ 3234 204 41 20.1 – – 21 10.3
Forwarder/yarder, skidder .......... 3235 19 – – – – 7 36.8Skidder— cable and grapple ...... 3238 44 3 6.8 3 6.8 – –Logging and wood processingmachinery— specialized,n.e.c. ....................................... 3239 78 – – 3 3.8 47 60.3
Mining and drilling machinery ......... 324 1,038 65 6.3 148 14.3 111 10.7Mining and drilling machinery,unspecified ............................... 3240 535 43 8.0 28 5.2 66 12.3
Drilling machines, drillingaugers ...................................... 3241 392 20 5.1 102 26.0 39 9.9
Mining and drilling machinery,n.e.c. ....................................... 3249 55 – – 3 5.5 5 9.1
Road grading and surfacingmachinery ..................................... 325 721 83 11.5 52 7.2 77 10.7
Graders, levellers, planers,scrapers ................................... 3252 234 38 16.2 14 6.0 31 13.2
Steam rollers, road pavers ......... 3254 357 31 8.7 25 7.0 38 10.6Road grading and surfacingmachinery, n.e.c. ..................... 3259 78 – – 11 14.1 3 3.8
Other construction, logging, andmining machinery ......................... 329 1,479 158 10.7 389 26.3 202 13.7
Other construction, logging, andmining machinery, unspecified 3290 19 19 100.0 – – – –
Agitators, mixers— earth,mineral ..................................... 3291 717 60 8.4 225 31.4 82 11.4
Compactors, crushers,pulverizers— earth, mineral ..... 3292 223 54 24.2 28 12.6 25 11.2
See footnotes at end of table.
Page 11

TABLE R69. Number and percent distribution of nonfatal occupational injuries and illnesses involving days away from work1 bysource of injury or illness and number of days away from work, 2000 — Continued
Source
Percent of days-away-from-work cases involving — Mediandaysaway
from work
6 - 10 days 11 - 20 days 21 - 30 days 31 days or more
Number Percent Number Percent Number Percent Number Percent
Other agricultural and gardenmachinery ..................................... 66 9.1 161 22.2 4 0.6 266 36.7 14Other agricultural and garden
machinery, unspecified ............ 8 16.0 4 8.0 1 2.0 7 14.0 3Feed grinders, crushers,
mixers— agricultural ................ 8 18.2 – – – – 12 27.3 2Spraying and dusting
machinery— agricultural .......... – – – – – – 161 90.4 38Agricultural and garden
machinery, n.e.c. ..................... 44 9.9 157 35.4 3 .7 84 19.0 11Construction, logging, and miningmachinery ......................................... 972 14.1 872 12.6 381 5.5 2,245 32.6 12
Construction, logging, and miningmachinery, unspecified ................ 20 10.8 85 45.9 – – 29 15.7 20
Excavating machinery .................... 447 27.4 144 8.8 54 3.3 461 28.2 9Excavating machinery,
unspecified ............................... – – 1 .6 – – 15 9.6 2Backhoes ................................... 133 19.8 87 12.9 28 4.2 144 21.4 10Bulldozers .................................. 93 43.1 40 18.5 8 3.7 42 19.4 9Steam and power shovels .......... – – – – – – 40 100.0 152Trenchers ................................... 203 48.8 2 .5 – – 179 43.0 7Excavating machinery, n.e.c. .... 18 13.3 15 11.1 18 13.3 41 30.4 14
Loaders .......................................... 80 6.1 295 22.6 50 3.8 479 36.7 15Loaders, unspecified .................. 68 12.3 204 36.9 23 4.2 149 26.9 13Bucket loaders ........................... – – 19 11.5 15 9.1 31 18.8 5End loaders ................................ 2 3.4 – – – – 56 96.6 98Front end loaders ....................... 1 .4 59 21.7 8 2.9 63 23.2 5Loaders, n.e.c. .......................... 9 3.5 13 5.0 5 1.9 179 69.4 99
Logging and wood processingmachinery— specialized .............. 73 13.7 47 8.8 61 11.4 194 36.4 18Chippers ..................................... 2 2.3 12 13.8 27 31.0 32 36.8 25Debarkers ................................... – – 12 18.2 – – 51 77.3 60Log loaders, including heel
boom ........................................ 51 25.0 2 1.0 24 11.8 66 32.4 10Forwarder/yarder, skidder .......... – – 11 57.9 2 10.5 – – 12Skidder— cable and grapple ...... 14 31.8 – – 2 4.5 21 47.7 22Logging and wood processing
machinery— specialized,n.e.c. ....................................... 5 6.4 3 3.8 7 9.0 13 16.7 3
Mining and drilling machinery ......... 93 9.0 82 7.9 58 5.6 482 46.4 24Mining and drilling machinery,
unspecified ............................... 57 10.7 34 6.4 33 6.2 275 51.4 33Drilling machines, drilling
augers ...................................... 34 8.7 44 11.2 14 3.6 140 35.7 12Mining and drilling machinery,
n.e.c. ....................................... – – – – 5 9.1 41 74.5 55Road grading and surfacingmachinery ..................................... 79 11.0 104 14.4 27 3.7 298 41.3 15Graders, levellers, planers,
scrapers ................................... 17 7.3 33 14.1 14 6.0 86 36.8 15Steam rollers, road pavers ......... 37 10.4 60 16.8 8 2.2 159 44.5 20Road grading and surfacing
machinery, n.e.c. ..................... 23 29.5 10 12.8 3 3.8 28 35.9 12Other construction, logging, andmining machinery ......................... 181 12.2 116 7.8 131 8.9 302 20.4 5Other construction, logging, and
mining machinery, unspecified – – – – – – – – 1Agitators, mixers— earth,
mineral ..................................... 115 16.0 39 5.4 12 1.7 186 25.9 5Compactors, crushers,
pulverizers— earth, mineral ..... 30 13.5 11 4.9 33 14.8 42 18.8 6
See footnotes at end of table.
Page 12

TABLE R69. Number and percent distribution of nonfatal occupational injuries and illnesses involving days away from work1 bysource of injury or illness and number of days away from work, 2000 — Continued
Source Sourcecode2
Privateindustry3
Percent of days-away-from-work cases involving —
1 day 2 days 3 - 5 days
Number Percent Number Percent Number Percent
Pile drivers, tampingmachinery ................................. 3293 238 3 1.3 47 19.7 72 30.3
Construction, logging, andmining machinery, n.e.c. ......... 3299 266 22 8.3 90 33.8 18 6.8
Heating, cooling, and cleaningmachinery and appliances ............... 33 13,065 2,062 15.8 1,434 11.0 2,706 20.7
Heating, cooling, and cleaningmachinery and appliances,unspecified ................................... 330 146 15 10.3 7 4.8 54 37.0
Cooling and humidifying machineryand appliances ............................. 331 5,387 792 14.7 564 10.5 984 18.3
Cooling and humidifyingmachinery and appliances,unspecified ............................... 3310 71 7 9.9 37 52.1 20 28.2
Air conditioning units .................. 3311 1,733 303 17.5 145 8.4 266 15.3Fans, blowers— wall, floor,ceiling, ventilation ..................... 3312 986 112 11.4 122 12.4 178 18.1
Refrigerators, freezers, icemakers ..................................... 3314 2,495 367 14.7 252 10.1 502 20.1
Cooling and humidifyingmachinery and appliances,n.e.c. ....................................... 3319 86 3 3.5 9 10.5 16 18.6
Heating and cooking machineryand appliances ............................. 332 4,810 746 15.5 616 12.8 1,080 22.5
Heating and cooking machineryand appliances, unspecified ..... 3320 72 – – – – 13 18.1
Beverage heating andpercolating equipment andappliances ................................ 3321 137 18 13.1 34 24.8 28 20.4
Broiling and frying equipmentand appliances ......................... 3322 262 3 1.1 128 48.9 42 16.0
Fabric pressers and ironingappliances ................................ 3323 297 31 10.4 23 7.7 77 25.9
Furnaces, heaters ...................... 3324 1,720 345 20.1 152 8.8 459 26.7Kilns ........................................... 3325 154 – – 1 .6 6 3.9Ranges, cooking ovens, grills,toasters, food warmers ............. 3326 1,849 257 13.9 185 10.0 383 20.7
Steaming equipment andappliances ................................ 3327 220 70 31.8 85 38.6 57 25.9
Heating and cooking machineryand appliances, n.e.c. ............. 3329 99 22 22.2 9 9.1 15 15.2
Washers, dryers, and cleaningmachinery and appliances ........... 333 2,680 500 18.7 244 9.1 585 21.8
Washers, dryers, and cleaningmachinery and appliances,unspecified ............................... 3330 274 40 14.6 7 2.6 71 25.9
Clothes dryers ............................ 3332 237 113 47.7 10 4.2 59 24.9Clothes washers ......................... 3333 388 111 28.6 45 11.6 66 17.0Dish washers .............................. 3334 243 32 13.2 56 23.0 79 32.5Vacuum cleaners ....................... 3336 1,077 168 15.6 99 9.2 220 20.4Washers, dryers, and cleaningmachinery and appliances,n.e.c. ....................................... 3339 433 36 8.3 20 4.6 84 19.4
Heating, cooling, and cleaningmachinery and appliances,n.e.c. ........................................... 339 42 9 21.4 2 4.8 3 7.1
Material handling machinery .............. 34 18,354 3,046 16.6 2,375 12.9 3,143 17.1Material handling machinery,unspecified ................................... 340 874 101 11.6 117 13.4 108 12.4
Conveyors— gravity ....................... 341 1,531 323 21.1 265 17.3 186 12.1Conveyors— gravity,unspecified ............................... 3410 334 22 6.6 72 21.6 34 10.2
See footnotes at end of table.
Page 13

TABLE R69. Number and percent distribution of nonfatal occupational injuries and illnesses involving days away from work1 bysource of injury or illness and number of days away from work, 2000 — Continued
Source
Percent of days-away-from-work cases involving — Mediandaysaway
from work
6 - 10 days 11 - 20 days 21 - 30 days 31 days or more
Number Percent Number Percent Number Percent Number Percent
Pile drivers, tampingmachinery ................................. 12 5.0 13 5.5 63 26.5 28 11.8 5
Construction, logging, andmining machinery, n.e.c. ......... 25 9.4 52 19.5 23 8.6 36 13.5 6
Heating, cooling, and cleaningmachinery and appliances ............... 2,091 16.0 1,413 10.8 719 5.5 2,641 20.2 6
Heating, cooling, and cleaningmachinery and appliances,unspecified ................................... 19 13.0 29 19.9 1 .7 20 13.7 5
Cooling and humidifying machineryand appliances ............................. 1,071 19.9 596 11.1 209 3.9 1,171 21.7 7Cooling and humidifying
machinery and appliances,unspecified ............................... – – 6 8.5 – – 1 1.4 2
Air conditioning units .................. 290 16.7 233 13.4 82 4.7 414 23.9 9Fans, blowers— wall, floor,
ceiling, ventilation ..................... 144 14.6 108 11.0 23 2.3 299 30.3 9Refrigerators, freezers, ice
makers ..................................... 619 24.8 235 9.4 84 3.4 438 17.6 7Cooling and humidifying
machinery and appliances,n.e.c. ....................................... 18 20.9 12 14.0 18 20.9 10 11.6 7
Heating and cooking machineryand appliances ............................. 569 11.8 515 10.7 370 7.7 914 19.0 5Heating and cooking machinery
and appliances, unspecified ..... 3 4.2 54 75.0 – – 2 2.8 19Beverage heating and
percolating equipment andappliances ................................ 29 21.2 – – – – 28 20.4 3
Broiling and frying equipmentand appliances ......................... 70 26.7 4 1.5 1 .4 14 5.3 3
Fabric pressers and ironingappliances ................................ 25 8.4 30 10.1 33 11.1 78 26.3 9
Furnaces, heaters ...................... 213 12.4 215 12.5 39 2.3 298 17.3 5Kilns ........................................... – – 4 2.6 142 92.2 – – 25Ranges, cooking ovens, grills,
toasters, food warmers ............. 220 11.9 199 10.8 121 6.5 485 26.2 7Steaming equipment and
appliances ................................ 4 1.8 1 .5 1 .5 3 1.4 2Heating and cooking machinery
and appliances, n.e.c. ............. 5 5.1 9 9.1 33 33.3 6 6.1 10Washers, dryers, and cleaningmachinery and appliances ........... 422 15.7 267 10.0 133 5.0 528 19.7 6Washers, dryers, and cleaning
machinery and appliances,unspecified ............................... 25 9.1 34 12.4 20 7.3 78 28.5 9
Clothes dryers ............................ 11 4.6 11 4.6 – – 32 13.5 2Clothes washers ......................... 34 8.8 49 12.6 11 2.8 72 18.6 4Dish washers .............................. 11 4.5 24 9.9 9 3.7 32 13.2 3Vacuum cleaners ....................... 234 21.7 76 7.1 68 6.3 212 19.7 6Washers, dryers, and cleaning
machinery and appliances,n.e.c. ....................................... 108 24.9 74 17.1 11 2.5 100 23.1 8
Heating, cooling, and cleaningmachinery and appliances,n.e.c. ........................................... 9 21.4 6 14.3 5 11.9 7 16.7 8
Material handling machinery .............. 2,195 12.0 2,034 11.1 1,271 6.9 4,289 23.4 6Material handling machinery,unspecified ................................... 65 7.4 66 7.6 112 12.8 305 34.9 16
Conveyors— gravity ....................... 200 13.1 166 10.8 71 4.6 320 20.9 5Conveyors— gravity,
unspecified ............................... 64 19.2 40 12.0 13 3.9 89 26.6 9
See footnotes at end of table.
Page 14

TABLE R69. Number and percent distribution of nonfatal occupational injuries and illnesses involving days away from work1 bysource of injury or illness and number of days away from work, 2000 — Continued
Source Sourcecode2
Privateindustry3
Percent of days-away-from-work cases involving —
1 day 2 days 3 - 5 days
Number Percent Number Percent Number Percent
Chutes ........................................ 3411 715 240 33.6 142 19.9 49 6.9Conveyors— roller ..................... 3412 468 57 12.2 51 10.9 101 21.6
Conveyors— powered .................... 342 4,737 759 16.0 469 9.9 735 15.5Conveyors— powered,unspecified ............................... 3420 1,690 243 14.4 250 14.8 287 17.0
Conveyors— belt ........................ 3421 2,262 455 20.1 151 6.7 349 15.4Conveyors— chain ..................... 3423 145 30 20.7 – – 29 20.0Conveyors— live roller ............... 3424 372 16 4.3 41 11.0 56 15.1Conveyors— screw, auger ......... 3427 100 6 6.0 20 20.0 6 6.0Conveyors— powered, n.e.c. .... 3429 141 4 2.8 6 4.3 2 1.4
Cranes ............................................ 343 1,126 215 19.1 124 11.0 212 18.8Cranes, unspecified ................... 3430 722 146 20.2 69 9.6 133 18.4Cranes— mobile, truck, railmounted ................................... 3434 68 2 2.9 11 16.2 5 7.4
Cranes— overhead .................... 3436 148 53 35.8 23 15.5 10 6.8Cranes— portal, tower, pillar ...... 3437 76 – – 15 19.7 15 19.7Cranes, n.e.c. ............................ 3439 76 11 14.5 4 5.3 35 46.1
Overhead hoists ............................. 344 892 147 16.5 98 11.0 140 15.7Overhead hoists, unspecified ..... 3440 516 90 17.4 56 10.9 70 13.6Overhead hoists— electricpowered ................................... 3441 72 12 16.7 10 13.9 21 29.2
Overhead hoists— manual ......... 3442 152 25 16.4 3 2.0 30 19.7Overhead hoists— pneumaticpowered ................................... 3443 44 1 2.3 7 15.9 – –
Overhead hoists, n.e.c. ............. 3449 108 18 16.7 21 19.4 20 18.5Elevators ........................................ 346 3,047 313 10.3 615 20.2 436 14.3
Elevators, unspecified ................ 3460 1,214 94 7.7 407 33.5 146 12.0Bucket or basket hoist— truckmounted ................................... 3461 127 8 6.3 9 7.1 22 17.3
Elevators— electric .................... 3463 527 46 8.7 18 3.4 42 8.0Elevators— hydraulic ................. 3464 85 10 11.8 27 31.8 20 23.5Elevators— hand operated ........ 3465 38 8 21.1 7 18.4 4 10.5Manlifts ....................................... 3466 781 98 12.5 106 13.6 109 14.0Elevators, n.e.c. ........................ 3469 240 20 8.3 40 16.7 93 38.8
Jacks .............................................. 347 5,264 1,004 19.1 627 11.9 1,135 21.6Jacks, unspecified ...................... 3470 2,941 509 17.3 334 11.4 657 22.3Jacks— hydraulic ....................... 3471 722 223 30.9 77 10.7 179 24.8Jacks— mechanical ................... 3472 439 21 4.8 48 10.9 164 37.4Jacks— pneumatic ..................... 3473 144 25 17.4 25 17.4 1 .7Jacks, n.e.c. .............................. 3479 1,019 227 22.3 144 14.1 134 13.2
Other material handlingmachinery ..................................... 349 855 177 20.7 61 7.1 193 22.6
Winders, unwinders .................... 3491 275 64 23.3 31 11.3 54 19.6Material handling machinery,n.e.c. ....................................... 3499 580 113 19.5 30 5.2 139 24.0
Metal, woodworking, and specialmaterial machinery ........................... 35 24,012 3,760 15.7 2,988 12.4 4,528 18.9
Metal, woodworking, and specialmaterial machinery, unspecified ... 350 1,637 213 13.0 140 8.6 391 23.9
Bending, rolling, shapingmachinery ..................................... 351 1,579 179 11.3 177 11.2 321 20.3
Bending, rolling, shapingmachinery, unspecified ............ 3510 352 28 8.0 39 11.1 37 10.5
Bending, crimping machines ...... 3511 382 18 4.7 19 5.0 163 42.7Shearing machines .................... 3512 397 85 21.4 22 5.5 61 15.4Rolling mills, rolling, calenderingmachinery ................................. 3513 244 30 12.3 89 36.5 17 7.0
Bending, rolling, shapingmachinery, n.e.c. ..................... 3519 204 18 8.8 7 3.4 43 21.1
Boring, drilling, planing, millingmachinery ..................................... 352 2,209 304 13.8 231 10.5 340 15.4
See footnotes at end of table.
Page 15
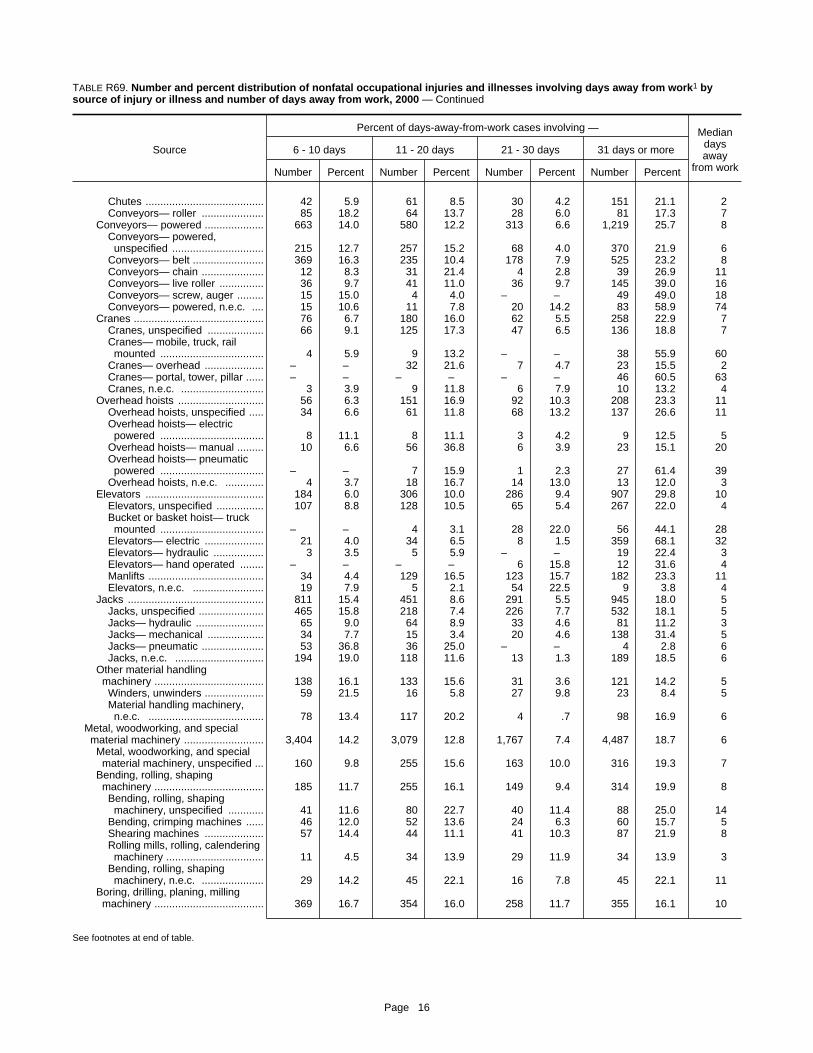
TABLE R69. Number and percent distribution of nonfatal occupational injuries and illnesses involving days away from work1 bysource of injury or illness and number of days away from work, 2000 — Continued
Source
Percent of days-away-from-work cases involving — Mediandaysaway
from work
6 - 10 days 11 - 20 days 21 - 30 days 31 days or more
Number Percent Number Percent Number Percent Number Percent
Chutes ........................................ 42 5.9 61 8.5 30 4.2 151 21.1 2Conveyors— roller ..................... 85 18.2 64 13.7 28 6.0 81 17.3 7
Conveyors— powered .................... 663 14.0 580 12.2 313 6.6 1,219 25.7 8Conveyors— powered,
unspecified ............................... 215 12.7 257 15.2 68 4.0 370 21.9 6Conveyors— belt ........................ 369 16.3 235 10.4 178 7.9 525 23.2 8Conveyors— chain ..................... 12 8.3 31 21.4 4 2.8 39 26.9 11Conveyors— live roller ............... 36 9.7 41 11.0 36 9.7 145 39.0 16Conveyors— screw, auger ......... 15 15.0 4 4.0 – – 49 49.0 18Conveyors— powered, n.e.c. .... 15 10.6 11 7.8 20 14.2 83 58.9 74
Cranes ............................................ 76 6.7 180 16.0 62 5.5 258 22.9 7Cranes, unspecified ................... 66 9.1 125 17.3 47 6.5 136 18.8 7Cranes— mobile, truck, rail
mounted ................................... 4 5.9 9 13.2 – – 38 55.9 60Cranes— overhead .................... – – 32 21.6 7 4.7 23 15.5 2Cranes— portal, tower, pillar ...... – – – – – – 46 60.5 63Cranes, n.e.c. ............................ 3 3.9 9 11.8 6 7.9 10 13.2 4
Overhead hoists ............................. 56 6.3 151 16.9 92 10.3 208 23.3 11Overhead hoists, unspecified ..... 34 6.6 61 11.8 68 13.2 137 26.6 11Overhead hoists— electric
powered ................................... 8 11.1 8 11.1 3 4.2 9 12.5 5Overhead hoists— manual ......... 10 6.6 56 36.8 6 3.9 23 15.1 20Overhead hoists— pneumatic
powered ................................... – – 7 15.9 1 2.3 27 61.4 39Overhead hoists, n.e.c. ............. 4 3.7 18 16.7 14 13.0 13 12.0 3
Elevators ........................................ 184 6.0 306 10.0 286 9.4 907 29.8 10Elevators, unspecified ................ 107 8.8 128 10.5 65 5.4 267 22.0 4Bucket or basket hoist— truck
mounted ................................... – – 4 3.1 28 22.0 56 44.1 28Elevators— electric .................... 21 4.0 34 6.5 8 1.5 359 68.1 32Elevators— hydraulic ................. 3 3.5 5 5.9 – – 19 22.4 3Elevators— hand operated ........ – – – – 6 15.8 12 31.6 4Manlifts ....................................... 34 4.4 129 16.5 123 15.7 182 23.3 11Elevators, n.e.c. ........................ 19 7.9 5 2.1 54 22.5 9 3.8 4
Jacks .............................................. 811 15.4 451 8.6 291 5.5 945 18.0 5Jacks, unspecified ...................... 465 15.8 218 7.4 226 7.7 532 18.1 5Jacks— hydraulic ....................... 65 9.0 64 8.9 33 4.6 81 11.2 3Jacks— mechanical ................... 34 7.7 15 3.4 20 4.6 138 31.4 5Jacks— pneumatic ..................... 53 36.8 36 25.0 – – 4 2.8 6Jacks, n.e.c. .............................. 194 19.0 118 11.6 13 1.3 189 18.5 6
Other material handlingmachinery ..................................... 138 16.1 133 15.6 31 3.6 121 14.2 5Winders, unwinders .................... 59 21.5 16 5.8 27 9.8 23 8.4 5Material handling machinery,
n.e.c. ....................................... 78 13.4 117 20.2 4 .7 98 16.9 6Metal, woodworking, and specialmaterial machinery ........................... 3,404 14.2 3,079 12.8 1,767 7.4 4,487 18.7 6
Metal, woodworking, and specialmaterial machinery, unspecified ... 160 9.8 255 15.6 163 10.0 316 19.3 7
Bending, rolling, shapingmachinery ..................................... 185 11.7 255 16.1 149 9.4 314 19.9 8Bending, rolling, shaping
machinery, unspecified ............ 41 11.6 80 22.7 40 11.4 88 25.0 14Bending, crimping machines ...... 46 12.0 52 13.6 24 6.3 60 15.7 5Shearing machines .................... 57 14.4 44 11.1 41 10.3 87 21.9 8Rolling mills, rolling, calendering
machinery ................................. 11 4.5 34 13.9 29 11.9 34 13.9 3Bending, rolling, shaping
machinery, n.e.c. ..................... 29 14.2 45 22.1 16 7.8 45 22.1 11Boring, drilling, planing, millingmachinery ..................................... 369 16.7 354 16.0 258 11.7 355 16.1 10
See footnotes at end of table.
Page 16
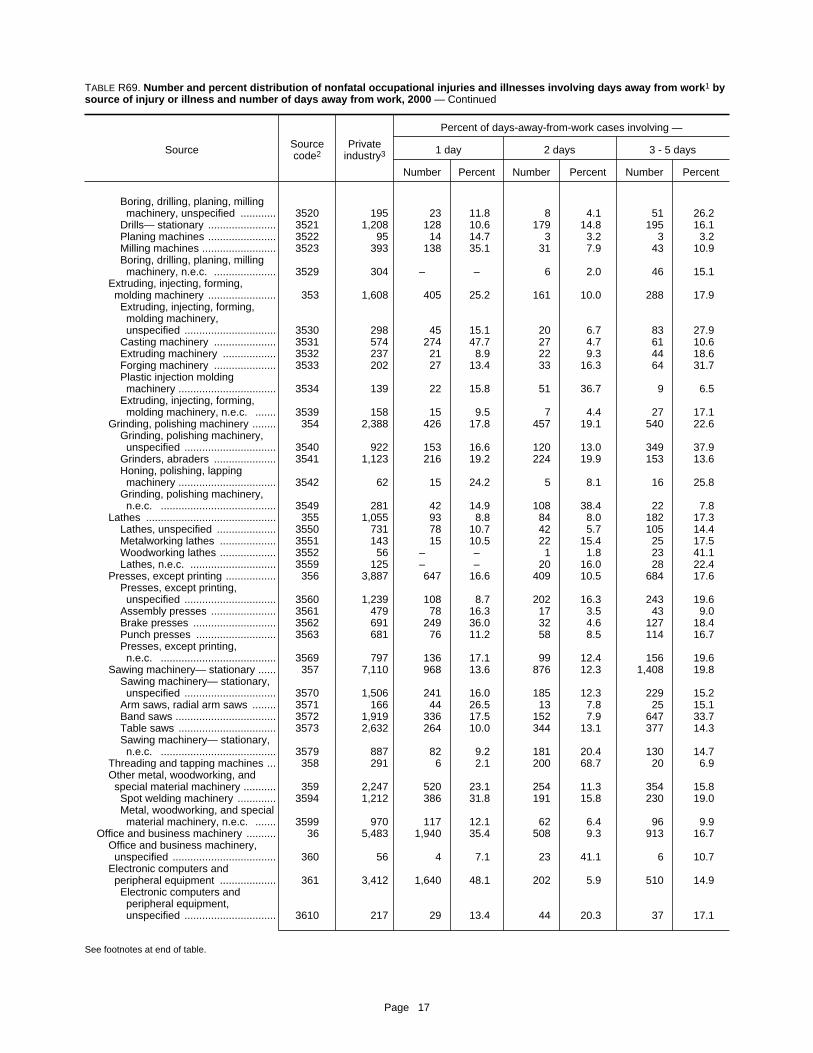
TABLE R69. Number and percent distribution of nonfatal occupational injuries and illnesses involving days away from work1 bysource of injury or illness and number of days away from work, 2000 — Continued
Source Sourcecode2
Privateindustry3
Percent of days-away-from-work cases involving —
1 day 2 days 3 - 5 days
Number Percent Number Percent Number Percent
Boring, drilling, planing, millingmachinery, unspecified ............ 3520 195 23 11.8 8 4.1 51 26.2
Drills— stationary ....................... 3521 1,208 128 10.6 179 14.8 195 16.1Planing machines ....................... 3522 95 14 14.7 3 3.2 3 3.2Milling machines ......................... 3523 393 138 35.1 31 7.9 43 10.9Boring, drilling, planing, millingmachinery, n.e.c. ..................... 3529 304 – – 6 2.0 46 15.1
Extruding, injecting, forming,molding machinery ....................... 353 1,608 405 25.2 161 10.0 288 17.9
Extruding, injecting, forming,molding machinery,unspecified ............................... 3530 298 45 15.1 20 6.7 83 27.9
Casting machinery ..................... 3531 574 274 47.7 27 4.7 61 10.6Extruding machinery .................. 3532 237 21 8.9 22 9.3 44 18.6Forging machinery ..................... 3533 202 27 13.4 33 16.3 64 31.7Plastic injection moldingmachinery ................................. 3534 139 22 15.8 51 36.7 9 6.5
Extruding, injecting, forming,molding machinery, n.e.c. ....... 3539 158 15 9.5 7 4.4 27 17.1
Grinding, polishing machinery ........ 354 2,388 426 17.8 457 19.1 540 22.6Grinding, polishing machinery,unspecified ............................... 3540 922 153 16.6 120 13.0 349 37.9
Grinders, abraders ..................... 3541 1,123 216 19.2 224 19.9 153 13.6Honing, polishing, lappingmachinery ................................. 3542 62 15 24.2 5 8.1 16 25.8
Grinding, polishing machinery,n.e.c. ....................................... 3549 281 42 14.9 108 38.4 22 7.8
Lathes ............................................ 355 1,055 93 8.8 84 8.0 182 17.3Lathes, unspecified .................... 3550 731 78 10.7 42 5.7 105 14.4Metalworking lathes ................... 3551 143 15 10.5 22 15.4 25 17.5Woodworking lathes ................... 3552 56 – – 1 1.8 23 41.1Lathes, n.e.c. ............................. 3559 125 – – 20 16.0 28 22.4
Presses, except printing ................. 356 3,887 647 16.6 409 10.5 684 17.6Presses, except printing,unspecified ............................... 3560 1,239 108 8.7 202 16.3 243 19.6
Assembly presses ...................... 3561 479 78 16.3 17 3.5 43 9.0Brake presses ............................ 3562 691 249 36.0 32 4.6 127 18.4Punch presses ........................... 3563 681 76 11.2 58 8.5 114 16.7Presses, except printing,n.e.c. ....................................... 3569 797 136 17.1 99 12.4 156 19.6
Sawing machinery— stationary ...... 357 7,110 968 13.6 876 12.3 1,408 19.8Sawing machinery— stationary,unspecified ............................... 3570 1,506 241 16.0 185 12.3 229 15.2
Arm saws, radial arm saws ........ 3571 166 44 26.5 13 7.8 25 15.1Band saws .................................. 3572 1,919 336 17.5 152 7.9 647 33.7Table saws ................................. 3573 2,632 264 10.0 344 13.1 377 14.3Sawing machinery— stationary, n.e.c. ....................................... 3579 887 82 9.2 181 20.4 130 14.7
Threading and tapping machines ... 358 291 6 2.1 200 68.7 20 6.9Other metal, woodworking, andspecial material machinery ........... 359 2,247 520 23.1 254 11.3 354 15.8
Spot welding machinery ............. 3594 1,212 386 31.8 191 15.8 230 19.0Metal, woodworking, and specialmaterial machinery, n.e.c. ....... 3599 970 117 12.1 62 6.4 96 9.9
Office and business machinery .......... 36 5,483 1,940 35.4 508 9.3 913 16.7Office and business machinery,unspecified ................................... 360 56 4 7.1 23 41.1 6 10.7
Electronic computers andperipheral equipment ................... 361 3,412 1,640 48.1 202 5.9 510 14.9
Electronic computers andperipheral equipment,unspecified ............................... 3610 217 29 13.4 44 20.3 37 17.1
See footnotes at end of table.
Page 17

TABLE R69. Number and percent distribution of nonfatal occupational injuries and illnesses involving days away from work1 bysource of injury or illness and number of days away from work, 2000 — Continued
Source
Percent of days-away-from-work cases involving — Mediandaysaway
from work
6 - 10 days 11 - 20 days 21 - 30 days 31 days or more
Number Percent Number Percent Number Percent Number Percent
Boring, drilling, planing, millingmachinery, unspecified ............ 41 21.0 27 13.8 10 5.1 35 17.9 9
Drills— stationary ....................... 176 14.6 106 8.8 189 15.6 233 19.3 8Planing machines ....................... 2 2.1 43 45.3 4 4.2 25 26.3 20Milling machines ......................... 48 12.2 88 22.4 17 4.3 27 6.9 4Boring, drilling, planing, milling
machinery, n.e.c. ..................... 101 33.2 88 28.9 38 12.5 25 8.2 10Extruding, injecting, forming,molding machinery ....................... 207 12.9 255 15.9 97 6.0 196 12.2 5Extruding, injecting, forming,
molding machinery,unspecified ............................... 39 13.1 34 11.4 14 4.7 62 20.8 6
Casting machinery ..................... 56 9.8 79 13.8 26 4.5 51 8.9 2Extruding machinery .................. 51 21.5 42 17.7 33 13.9 22 9.3 10Forging machinery ..................... 24 11.9 30 14.9 4 2.0 18 8.9 4Plastic injection molding
machinery ................................. 7 5.0 9 6.5 8 5.8 33 23.7 2Extruding, injecting, forming,
molding machinery, n.e.c. ....... 29 18.4 60 38.0 11 7.0 9 5.7 11Grinding, polishing machinery ........ 276 11.6 204 8.5 223 9.3 261 10.9 3
Grinding, polishing machinery,unspecified ............................... 62 6.7 112 12.1 54 5.9 72 7.8 3
Grinders, abraders ..................... 169 15.0 80 7.1 158 14.1 123 11.0 5Honing, polishing, lapping
machinery ................................. 12 19.4 3 4.8 5 8.1 7 11.3 3Grinding, polishing machinery,
n.e.c. ....................................... 34 12.1 9 3.2 6 2.1 59 21.0 2Lathes ............................................ 410 38.9 65 6.2 35 3.3 186 17.6 10
Lathes, unspecified .................... 376 51.4 25 3.4 27 3.7 78 10.7 10Metalworking lathes ................... 16 11.2 23 16.1 5 3.5 38 26.6 10Woodworking lathes ................... 14 25.0 14 25.0 3 5.4 1 1.8 8Lathes, n.e.c. ............................. 5 4.0 3 2.4 – – 69 55.2 38
Presses, except printing ................. 407 10.5 474 12.2 319 8.2 947 24.4 8Presses, except printing,
unspecified ............................... 165 13.3 131 10.6 87 7.0 301 24.3 7Assembly presses ...................... 10 2.1 97 20.3 53 11.1 182 38.0 19Brake presses ............................ 53 7.7 48 6.9 55 8.0 127 18.4 3Punch presses ........................... 109 16.0 87 12.8 31 4.6 205 30.1 10Presses, except printing,
n.e.c. ....................................... 70 8.8 112 14.1 92 11.5 131 16.4 7Sawing machinery— stationary ...... 823 11.6 973 13.7 443 6.2 1,619 22.8 7
Sawing machinery— stationary,unspecified ............................... 217 14.4 134 8.9 91 6.0 408 27.1 9
Arm saws, radial arm saws ........ 13 7.8 11 6.6 1 .6 59 35.5 6Band saws .................................. 217 11.3 237 12.4 148 7.7 181 9.4 4Table saws ................................. 315 12.0 396 15.0 101 3.8 837 31.8 11Sawing machinery— stationary,
n.e.c. ....................................... 61 6.9 195 22.0 102 11.5 135 15.2 10Threading and tapping machines ... 5 1.7 32 11.0 4 1.4 24 8.2 2Other metal, woodworking, andspecial material machinery ........... 563 25.1 212 9.4 76 3.4 269 12.0 5Spot welding machinery ............. 183 15.1 57 4.7 37 3.1 127 10.5 3Metal, woodworking, and special
material machinery, n.e.c. ....... 371 38.2 151 15.6 39 4.0 133 13.7 9Office and business machinery .......... 740 13.5 298 5.4 134 2.4 950 17.3 3
Office and business machinery,unspecified ................................... 12 21.4 1 1.8 3 5.4 8 14.3 3
Electronic computers andperipheral equipment ................... 296 8.7 210 6.2 104 3.0 450 13.2 2Electronic computers and
peripheral equipment,unspecified ............................... 2 .9 91 41.9 6 2.8 10 4.6 5
See footnotes at end of table.
Page 18
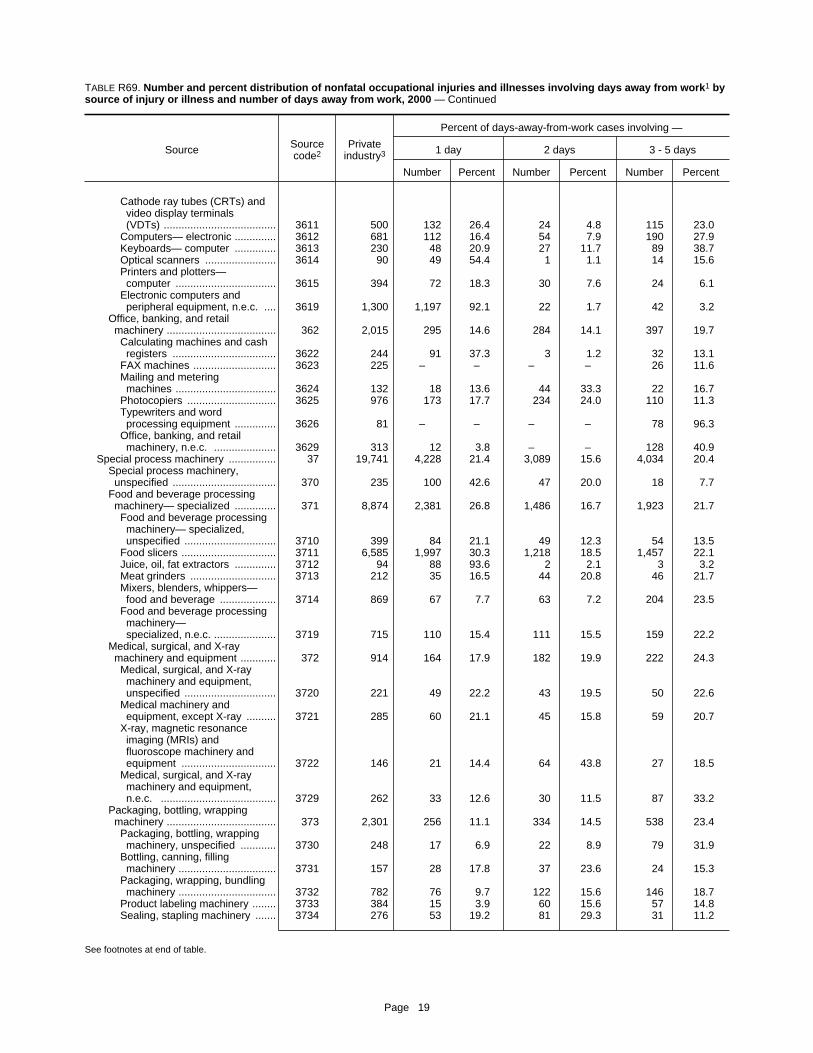
TABLE R69. Number and percent distribution of nonfatal occupational injuries and illnesses involving days away from work1 bysource of injury or illness and number of days away from work, 2000 — Continued
Source Sourcecode2
Privateindustry3
Percent of days-away-from-work cases involving —
1 day 2 days 3 - 5 days
Number Percent Number Percent Number Percent
Cathode ray tubes (CRTs) andvideo display terminals(VDTs) ...................................... 3611 500 132 26.4 24 4.8 115 23.0
Computers— electronic .............. 3612 681 112 16.4 54 7.9 190 27.9Keyboards— computer .............. 3613 230 48 20.9 27 11.7 89 38.7Optical scanners ........................ 3614 90 49 54.4 1 1.1 14 15.6Printers and plotters—computer .................................. 3615 394 72 18.3 30 7.6 24 6.1
Electronic computers andperipheral equipment, n.e.c. .... 3619 1,300 1,197 92.1 22 1.7 42 3.2
Office, banking, and retailmachinery ..................................... 362 2,015 295 14.6 284 14.1 397 19.7
Calculating machines and cashregisters ................................... 3622 244 91 37.3 3 1.2 32 13.1
FAX machines ............................ 3623 225 – – – – 26 11.6Mailing and meteringmachines .................................. 3624 132 18 13.6 44 33.3 22 16.7
Photocopiers .............................. 3625 976 173 17.7 234 24.0 110 11.3Typewriters and wordprocessing equipment .............. 3626 81 – – – – 78 96.3
Office, banking, and retailmachinery, n.e.c. ..................... 3629 313 12 3.8 – – 128 40.9
Special process machinery ................ 37 19,741 4,228 21.4 3,089 15.6 4,034 20.4Special process machinery,unspecified ................................... 370 235 100 42.6 47 20.0 18 7.7
Food and beverage processingmachinery— specialized .............. 371 8,874 2,381 26.8 1,486 16.7 1,923 21.7
Food and beverage processingmachinery— specialized,unspecified ............................... 3710 399 84 21.1 49 12.3 54 13.5
Food slicers ................................ 3711 6,585 1,997 30.3 1,218 18.5 1,457 22.1Juice, oil, fat extractors .............. 3712 94 88 93.6 2 2.1 3 3.2Meat grinders ............................. 3713 212 35 16.5 44 20.8 46 21.7Mixers, blenders, whippers—food and beverage ................... 3714 869 67 7.7 63 7.2 204 23.5
Food and beverage processingmachinery—specialized, n.e.c. ..................... 3719 715 110 15.4 111 15.5 159 22.2
Medical, surgical, and X-raymachinery and equipment ............ 372 914 164 17.9 182 19.9 222 24.3
Medical, surgical, and X-raymachinery and equipment,unspecified ............................... 3720 221 49 22.2 43 19.5 50 22.6
Medical machinery andequipment, except X-ray .......... 3721 285 60 21.1 45 15.8 59 20.7
X-ray, magnetic resonanceimaging (MRIs) andfluoroscope machinery andequipment ................................ 3722 146 21 14.4 64 43.8 27 18.5
Medical, surgical, and X-raymachinery and equipment,n.e.c. ....................................... 3729 262 33 12.6 30 11.5 87 33.2
Packaging, bottling, wrapping machinery ..................................... 373 2,301 256 11.1 334 14.5 538 23.4
Packaging, bottling, wrappingmachinery, unspecified ............ 3730 248 17 6.9 22 8.9 79 31.9
Bottling, canning, fillingmachinery ................................. 3731 157 28 17.8 37 23.6 24 15.3
Packaging, wrapping, bundlingmachinery ................................. 3732 782 76 9.7 122 15.6 146 18.7
Product labeling machinery ........ 3733 384 15 3.9 60 15.6 57 14.8Sealing, stapling machinery ....... 3734 276 53 19.2 81 29.3 31 11.2
See footnotes at end of table.
Page 19
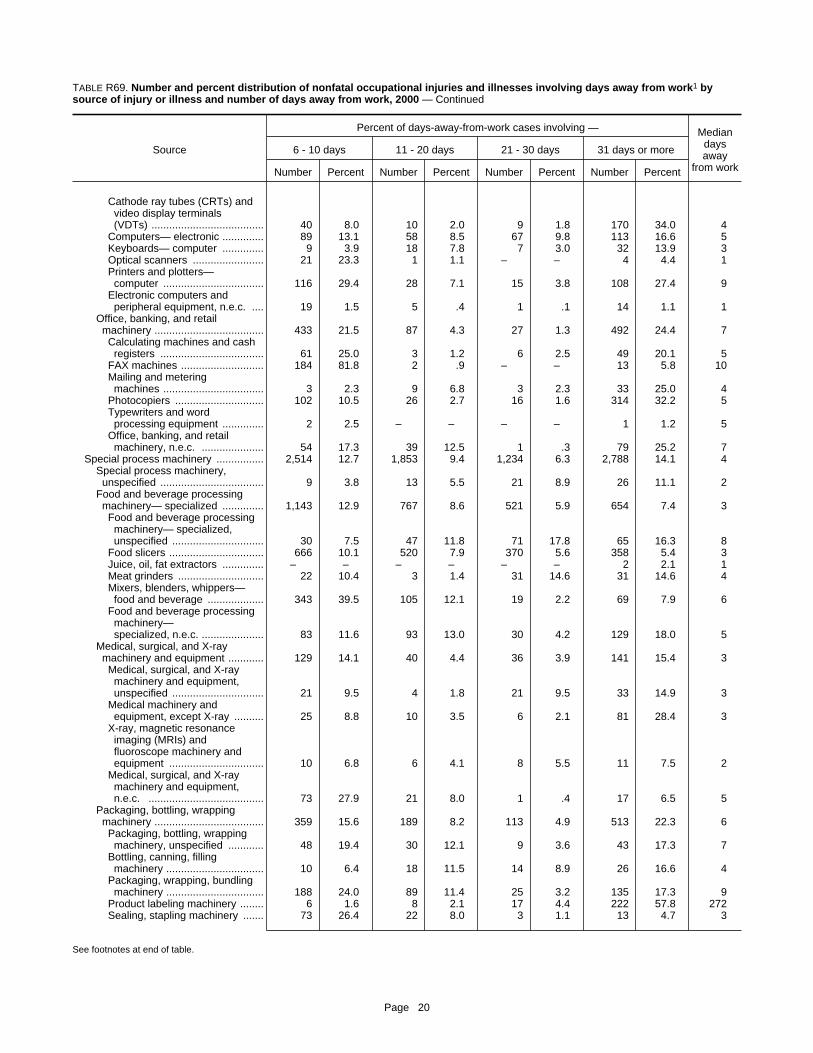
TABLE R69. Number and percent distribution of nonfatal occupational injuries and illnesses involving days away from work1 bysource of injury or illness and number of days away from work, 2000 — Continued
Source
Percent of days-away-from-work cases involving — Mediandaysaway
from work
6 - 10 days 11 - 20 days 21 - 30 days 31 days or more
Number Percent Number Percent Number Percent Number Percent
Cathode ray tubes (CRTs) andvideo display terminals(VDTs) ...................................... 40 8.0 10 2.0 9 1.8 170 34.0 4
Computers— electronic .............. 89 13.1 58 8.5 67 9.8 113 16.6 5Keyboards— computer .............. 9 3.9 18 7.8 7 3.0 32 13.9 3Optical scanners ........................ 21 23.3 1 1.1 – – 4 4.4 1Printers and plotters—
computer .................................. 116 29.4 28 7.1 15 3.8 108 27.4 9Electronic computers and
peripheral equipment, n.e.c. .... 19 1.5 5 .4 1 .1 14 1.1 1Office, banking, and retailmachinery ..................................... 433 21.5 87 4.3 27 1.3 492 24.4 7Calculating machines and cash
registers ................................... 61 25.0 3 1.2 6 2.5 49 20.1 5FAX machines ............................ 184 81.8 2 .9 – – 13 5.8 10Mailing and metering
machines .................................. 3 2.3 9 6.8 3 2.3 33 25.0 4Photocopiers .............................. 102 10.5 26 2.7 16 1.6 314 32.2 5Typewriters and word
processing equipment .............. 2 2.5 – – – – 1 1.2 5Office, banking, and retail
machinery, n.e.c. ..................... 54 17.3 39 12.5 1 .3 79 25.2 7Special process machinery ................ 2,514 12.7 1,853 9.4 1,234 6.3 2,788 14.1 4
Special process machinery,unspecified ................................... 9 3.8 13 5.5 21 8.9 26 11.1 2
Food and beverage processingmachinery— specialized .............. 1,143 12.9 767 8.6 521 5.9 654 7.4 3Food and beverage processing
machinery— specialized,unspecified ............................... 30 7.5 47 11.8 71 17.8 65 16.3 8
Food slicers ................................ 666 10.1 520 7.9 370 5.6 358 5.4 3Juice, oil, fat extractors .............. – – – – – – 2 2.1 1Meat grinders ............................. 22 10.4 3 1.4 31 14.6 31 14.6 4Mixers, blenders, whippers—
food and beverage ................... 343 39.5 105 12.1 19 2.2 69 7.9 6Food and beverage processing
machinery—specialized, n.e.c. ..................... 83 11.6 93 13.0 30 4.2 129 18.0 5
Medical, surgical, and X-raymachinery and equipment ............ 129 14.1 40 4.4 36 3.9 141 15.4 3Medical, surgical, and X-ray
machinery and equipment,unspecified ............................... 21 9.5 4 1.8 21 9.5 33 14.9 3
Medical machinery andequipment, except X-ray .......... 25 8.8 10 3.5 6 2.1 81 28.4 3
X-ray, magnetic resonanceimaging (MRIs) andfluoroscope machinery andequipment ................................ 10 6.8 6 4.1 8 5.5 11 7.5 2
Medical, surgical, and X-raymachinery and equipment,n.e.c. ....................................... 73 27.9 21 8.0 1 .4 17 6.5 5
Packaging, bottling, wrapping machinery ..................................... 359 15.6 189 8.2 113 4.9 513 22.3 6Packaging, bottling, wrapping
machinery, unspecified ............ 48 19.4 30 12.1 9 3.6 43 17.3 7Bottling, canning, filling
machinery ................................. 10 6.4 18 11.5 14 8.9 26 16.6 4Packaging, wrapping, bundling
machinery ................................. 188 24.0 89 11.4 25 3.2 135 17.3 9Product labeling machinery ........ 6 1.6 8 2.1 17 4.4 222 57.8 272Sealing, stapling machinery ....... 73 26.4 22 8.0 3 1.1 13 4.7 3
See footnotes at end of table.
Page 20

TABLE R69. Number and percent distribution of nonfatal occupational injuries and illnesses involving days away from work1 bysource of injury or illness and number of days away from work, 2000 — Continued
Source Sourcecode2
Privateindustry3
Percent of days-away-from-work cases involving —
1 day 2 days 3 - 5 days
Number Percent Number Percent Number Percent
Packaging, bottling, wrappingmachinery, n.e.c. ..................... 3739 454 66 14.5 13 2.9 201 44.3
Paper production machinery .......... 374 797 106 13.3 149 18.7 134 16.8Paper production machinery,unspecified ............................... 3740 273 36 13.2 19 7.0 17 6.2
Slitters, winders— paperproduction ................................ 3745 189 36 19.0 21 11.1 53 28.0
Paper production machinery,n.e.c. ....................................... 3749 265 20 7.5 101 38.1 31 11.7
Printing machinery andequipment .................................... 375 2,768 546 19.7 391 14.1 565 20.4
Printing machinery andequipment, unspecified ............ 3750 415 94 22.7 54 13.0 86 20.7
Bindery machinery ..................... 3751 283 63 22.3 80 28.3 60 21.2Presses— printing ...................... 3753 1,544 203 13.1 210 13.6 349 22.6Typesetting machinery ............... 3754 64 – – – – – –Printing machinery andequipment, n.e.c. ..................... 3759 453 186 41.1 48 10.6 71 15.7
Textile, apparel, leather productionmachinery ..................................... 376 1,474 331 22.5 185 12.6 277 18.8
Textile, apparel, leatherproduction machinery,unspecified ............................... 3760 152 30 19.7 3 2.0 11 7.2
Knitting machinery ...................... 3762 89 14 15.7 10 11.2 52 58.4Sewing, stitching machinery ....... 3764 588 170 28.9 117 19.9 85 14.5Spinning machinery .................... 3765 77 – – 6 7.8 29 37.7Weaving machinery .................... 3766 46 9 19.6 6 13.0 9 19.6Textile, apparel, leatherproduction machinery, n.e.c. ... 3769 473 105 22.2 36 7.6 89 18.8
Other special process machinery ... 379 2,378 344 14.5 315 13.2 357 15.0Other special processmachinery, unspecified ............ 3790 57 29 50.9 7 12.3 7 12.3
Paint mixing machinery .............. 3795 69 52 75.4 – – – –Painting, priming, metal coatingmachinery ................................. 3796 121 4 3.3 – – 9 7.4
Pumps ........................................ 3797 1,557 198 12.7 228 14.6 276 17.7Special process machinery,n.e.c. ....................................... 3799 535 55 10.3 71 13.3 54 10.1
Miscellaneous machinery ................... 39 10,679 2,060 19.3 1,296 12.1 2,274 21.3Audio and video equipment ............ 391 2,118 382 18.0 291 13.7 542 25.6
Audio and video equipment,unspecified ............................... 3910 66 – – 18 27.3 28 42.4
Radios, stereos, and other audioequipment ................................ 3911 65 30 46.2 6 9.2 11 16.9
Telephones and communicationequipment ................................ 3912 276 20 7.2 32 11.6 42 15.2
Televisions ................................. 3913 1,564 323 20.7 227 14.5 415 26.5Video players and recorders—tape and disk ............................ 3914 54 2 3.7 – – – –
Audio and video equipment,n.e.c. ....................................... 3919 92 7 7.6 9 9.8 46 50.0
Product assembly machinery,n.e.c. ........................................... 392 311 36 11.6 25 8.0 92 29.6
Product testing, inspecting, anddiagnostic machinery, n.e.c. ........ 393 141 35 24.8 24 17.0 25 17.7
Other machinery ............................. 399 8,110 1,607 19.8 956 11.8 1,616 19.9Other machinery, unspecified .... 3990 188 9 4.8 13 6.9 38 20.2Air compressors ......................... 3991 895 192 21.5 95 10.6 208 23.2Garbage disposals ..................... 3992 39 – – 3 7.7 28 71.8Snowblowers .............................. 3994 111 23 20.7 5 4.5 2 1.8Snow plows ................................ 3995 107 – – 37 34.6 12 11.2Trash compactors ...................... 3997 491 120 24.4 33 6.7 50 10.2
See footnotes at end of table.
Page 21

TABLE R69. Number and percent distribution of nonfatal occupational injuries and illnesses involving days away from work1 bysource of injury or illness and number of days away from work, 2000 — Continued
Source
Percent of days-away-from-work cases involving — Mediandaysaway
from work
6 - 10 days 11 - 20 days 21 - 30 days 31 days or more
Number Percent Number Percent Number Percent Number Percent
Packaging, bottling, wrappingmachinery, n.e.c. ..................... 33 7.3 22 4.8 45 9.9 74 16.3 4
Paper production machinery .......... 30 3.8 144 18.1 91 11.4 143 17.9 7Paper production machinery,
unspecified ............................... 1 .4 65 23.8 71 26.0 65 23.8 20Slitters, winders— paper
production ................................ 13 6.9 23 12.2 12 6.3 31 16.4 4Paper production machinery,
n.e.c. ....................................... 11 4.2 54 20.4 7 2.6 40 15.1 4Printing machinery andequipment .................................... 346 12.5 266 9.6 232 8.4 422 15.2 5Printing machinery and
equipment, unspecified ............ 77 18.6 56 13.5 23 5.5 25 6.0 3Bindery machinery ..................... 44 15.5 3 1.1 4 1.4 29 10.2 2Presses— printing ...................... 122 7.9 159 10.3 182 11.8 318 20.6 6Typesetting machinery ............... 64 100.0 – – – – – – 8Printing machinery and
equipment, n.e.c. ..................... 38 8.4 40 8.8 21 4.6 50 11.0 2Textile, apparel, leather productionmachinery ..................................... 158 10.7 140 9.5 113 7.7 269 18.2 5Textile, apparel, leather
production machinery,unspecified ............................... 31 20.4 29 19.1 20 13.2 29 19.1 11
Knitting machinery ...................... 5 5.6 1 1.1 2 2.2 4 4.5 3Sewing, stitching machinery ....... 76 12.9 51 8.7 8 1.4 80 13.6 3Spinning machinery .................... 1 1.3 1 1.3 11 14.3 28 36.4 24Weaving machinery .................... 7 15.2 – – – – 16 34.8 5Textile, apparel, leather
production machinery, n.e.c. ... 32 6.8 57 12.1 62 13.1 92 19.5 6Other special process machinery ... 340 14.3 293 12.3 107 4.5 621 26.1 8
Other special processmachinery, unspecified ............ – – 7 12.3 – – 6 10.5 1
Paint mixing machinery .............. 2 2.9 14 20.3 – – – – 1Painting, priming, metal coating
machinery ................................. 3 2.5 – – 10 8.3 95 78.5 240Pumps ........................................ 224 14.4 184 11.8 73 4.7 373 24.0 7Special process machinery,
n.e.c. ....................................... 111 20.7 79 14.8 24 4.5 142 26.5 10Miscellaneous machinery ................... 1,369 12.8 1,329 12.4 707 6.6 1,644 15.4 5
Audio and video equipment ............ 182 8.6 241 11.4 105 5.0 374 17.7 5Audio and video equipment,
unspecified ............................... 16 24.2 – – 2 3.0 3 4.5 4Radios, stereos, and other audio
equipment ................................ 1 1.5 1 1.5 13 20.0 2 3.1 2Telephones and communication
equipment ................................ 14 5.1 98 35.5 7 2.5 62 22.5 11Televisions ................................. 139 8.9 141 9.0 70 4.5 250 16.0 4Video players and recorders—
tape and disk ............................ – – – – 3 5.6 49 90.7 108Audio and video equipment,
n.e.c. ....................................... 11 12.0 1 1.1 11 12.0 7 7.6 4Product assembly machinery,n.e.c. ........................................... 28 9.0 21 6.8 66 21.2 43 13.8 6
Product testing, inspecting, anddiagnostic machinery, n.e.c. ........ 3 2.1 18 12.8 6 4.3 31 22.0 4
Other machinery ............................. 1,157 14.3 1,049 12.9 529 6.5 1,196 14.7 5Other machinery, unspecified .... 61 32.4 13 6.9 18 9.6 37 19.7 8Air compressors ......................... 116 13.0 113 12.6 28 3.1 143 16.0 5Garbage disposals ..................... 1 2.6 5 12.8 2 5.1 – – 4Snowblowers .............................. 10 9.0 13 11.7 33 29.7 25 22.5 22Snow plows ................................ 12 11.2 1 .9 22 20.6 23 21.5 10Trash compactors ...................... 82 16.7 36 7.3 – – 171 34.8 7
See footnotes at end of table.
Page 22
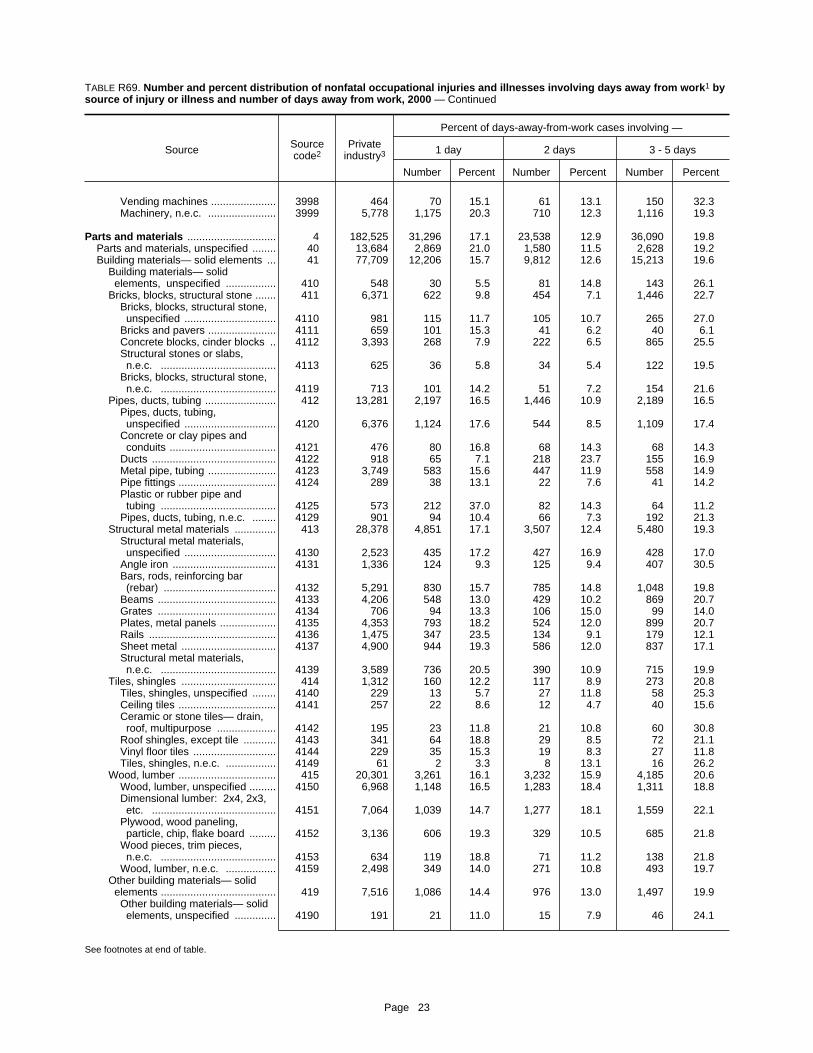
TABLE R69. Number and percent distribution of nonfatal occupational injuries and illnesses involving days away from work1 bysource of injury or illness and number of days away from work, 2000 — Continued
Source Sourcecode2
Privateindustry3
Percent of days-away-from-work cases involving —
1 day 2 days 3 - 5 days
Number Percent Number Percent Number Percent
Vending machines ...................... 3998 464 70 15.1 61 13.1 150 32.3Machinery, n.e.c. ....................... 3999 5,778 1,175 20.3 710 12.3 1,116 19.3
Parts and materials .............................. 4 182,525 31,296 17.1 23,538 12.9 36,090 19.8Parts and materials, unspecified ........ 40 13,684 2,869 21.0 1,580 11.5 2,628 19.2Building materials— solid elements ... 41 77,709 12,206 15.7 9,812 12.6 15,213 19.6
Building materials— solidelements, unspecified ................. 410 548 30 5.5 81 14.8 143 26.1
Bricks, blocks, structural stone ....... 411 6,371 622 9.8 454 7.1 1,446 22.7Bricks, blocks, structural stone,unspecified ............................... 4110 981 115 11.7 105 10.7 265 27.0
Bricks and pavers ....................... 4111 659 101 15.3 41 6.2 40 6.1Concrete blocks, cinder blocks .. 4112 3,393 268 7.9 222 6.5 865 25.5Structural stones or slabs,n.e.c. ....................................... 4113 625 36 5.8 34 5.4 122 19.5
Bricks, blocks, structural stone,n.e.c. ....................................... 4119 713 101 14.2 51 7.2 154 21.6
Pipes, ducts, tubing ........................ 412 13,281 2,197 16.5 1,446 10.9 2,189 16.5Pipes, ducts, tubing,unspecified ............................... 4120 6,376 1,124 17.6 544 8.5 1,109 17.4
Concrete or clay pipes andconduits .................................... 4121 476 80 16.8 68 14.3 68 14.3
Ducts .......................................... 4122 918 65 7.1 218 23.7 155 16.9Metal pipe, tubing ....................... 4123 3,749 583 15.6 447 11.9 558 14.9Pipe fittings ................................. 4124 289 38 13.1 22 7.6 41 14.2Plastic or rubber pipe andtubing ....................................... 4125 573 212 37.0 82 14.3 64 11.2
Pipes, ducts, tubing, n.e.c. ........ 4129 901 94 10.4 66 7.3 192 21.3Structural metal materials .............. 413 28,378 4,851 17.1 3,507 12.4 5,480 19.3
Structural metal materials,unspecified ............................... 4130 2,523 435 17.2 427 16.9 428 17.0
Angle iron ................................... 4131 1,336 124 9.3 125 9.4 407 30.5Bars, rods, reinforcing bar(rebar) ...................................... 4132 5,291 830 15.7 785 14.8 1,048 19.8
Beams ........................................ 4133 4,206 548 13.0 429 10.2 869 20.7Grates ........................................ 4134 706 94 13.3 106 15.0 99 14.0Plates, metal panels ................... 4135 4,353 793 18.2 524 12.0 899 20.7Rails ........................................... 4136 1,475 347 23.5 134 9.1 179 12.1Sheet metal ................................ 4137 4,900 944 19.3 586 12.0 837 17.1Structural metal materials,n.e.c. ....................................... 4139 3,589 736 20.5 390 10.9 715 19.9
Tiles, shingles ................................ 414 1,312 160 12.2 117 8.9 273 20.8Tiles, shingles, unspecified ........ 4140 229 13 5.7 27 11.8 58 25.3Ceiling tiles ................................. 4141 257 22 8.6 12 4.7 40 15.6Ceramic or stone tiles— drain,roof, multipurpose .................... 4142 195 23 11.8 21 10.8 60 30.8
Roof shingles, except tile ........... 4143 341 64 18.8 29 8.5 72 21.1Vinyl floor tiles ............................ 4144 229 35 15.3 19 8.3 27 11.8Tiles, shingles, n.e.c. ................. 4149 61 2 3.3 8 13.1 16 26.2
Wood, lumber ................................. 415 20,301 3,261 16.1 3,232 15.9 4,185 20.6Wood, lumber, unspecified ......... 4150 6,968 1,148 16.5 1,283 18.4 1,311 18.8Dimensional lumber: 2x4, 2x3,etc. .......................................... 4151 7,064 1,039 14.7 1,277 18.1 1,559 22.1
Plywood, wood paneling,particle, chip, flake board ......... 4152 3,136 606 19.3 329 10.5 685 21.8
Wood pieces, trim pieces,n.e.c. ....................................... 4153 634 119 18.8 71 11.2 138 21.8
Wood, lumber, n.e.c. ................. 4159 2,498 349 14.0 271 10.8 493 19.7Other building materials— solid elements ....................................... 419 7,516 1,086 14.4 976 13.0 1,497 19.9
Other building materials— solid elements, unspecified .............. 4190 191 21 11.0 15 7.9 46 24.1
See footnotes at end of table.
Page 23
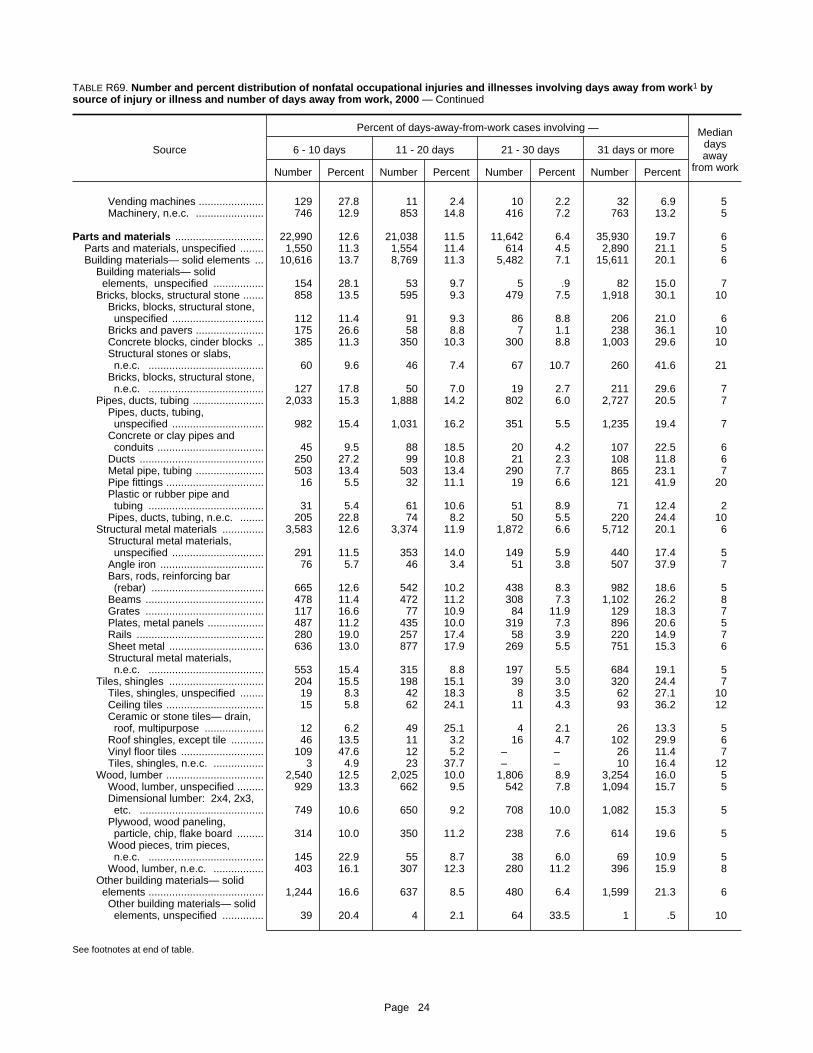
TABLE R69. Number and percent distribution of nonfatal occupational injuries and illnesses involving days away from work1 bysource of injury or illness and number of days away from work, 2000 — Continued
Source
Percent of days-away-from-work cases involving — Mediandaysaway
from work
6 - 10 days 11 - 20 days 21 - 30 days 31 days or more
Number Percent Number Percent Number Percent Number Percent
Vending machines ...................... 129 27.8 11 2.4 10 2.2 32 6.9 5Machinery, n.e.c. ....................... 746 12.9 853 14.8 416 7.2 763 13.2 5
Parts and materials .............................. 22,990 12.6 21,038 11.5 11,642 6.4 35,930 19.7 6Parts and materials, unspecified ........ 1,550 11.3 1,554 11.4 614 4.5 2,890 21.1 5Building materials— solid elements ... 10,616 13.7 8,769 11.3 5,482 7.1 15,611 20.1 6
Building materials— solidelements, unspecified ................. 154 28.1 53 9.7 5 .9 82 15.0 7
Bricks, blocks, structural stone ....... 858 13.5 595 9.3 479 7.5 1,918 30.1 10Bricks, blocks, structural stone,
unspecified ............................... 112 11.4 91 9.3 86 8.8 206 21.0 6Bricks and pavers ....................... 175 26.6 58 8.8 7 1.1 238 36.1 10Concrete blocks, cinder blocks .. 385 11.3 350 10.3 300 8.8 1,003 29.6 10Structural stones or slabs,
n.e.c. ....................................... 60 9.6 46 7.4 67 10.7 260 41.6 21Bricks, blocks, structural stone,
n.e.c. ....................................... 127 17.8 50 7.0 19 2.7 211 29.6 7Pipes, ducts, tubing ........................ 2,033 15.3 1,888 14.2 802 6.0 2,727 20.5 7
Pipes, ducts, tubing,unspecified ............................... 982 15.4 1,031 16.2 351 5.5 1,235 19.4 7
Concrete or clay pipes andconduits .................................... 45 9.5 88 18.5 20 4.2 107 22.5 6
Ducts .......................................... 250 27.2 99 10.8 21 2.3 108 11.8 6Metal pipe, tubing ....................... 503 13.4 503 13.4 290 7.7 865 23.1 7Pipe fittings ................................. 16 5.5 32 11.1 19 6.6 121 41.9 20Plastic or rubber pipe and
tubing ....................................... 31 5.4 61 10.6 51 8.9 71 12.4 2Pipes, ducts, tubing, n.e.c. ........ 205 22.8 74 8.2 50 5.5 220 24.4 10
Structural metal materials .............. 3,583 12.6 3,374 11.9 1,872 6.6 5,712 20.1 6Structural metal materials,
unspecified ............................... 291 11.5 353 14.0 149 5.9 440 17.4 5Angle iron ................................... 76 5.7 46 3.4 51 3.8 507 37.9 7Bars, rods, reinforcing bar
(rebar) ...................................... 665 12.6 542 10.2 438 8.3 982 18.6 5Beams ........................................ 478 11.4 472 11.2 308 7.3 1,102 26.2 8Grates ........................................ 117 16.6 77 10.9 84 11.9 129 18.3 7Plates, metal panels ................... 487 11.2 435 10.0 319 7.3 896 20.6 5Rails ........................................... 280 19.0 257 17.4 58 3.9 220 14.9 7Sheet metal ................................ 636 13.0 877 17.9 269 5.5 751 15.3 6Structural metal materials,
n.e.c. ....................................... 553 15.4 315 8.8 197 5.5 684 19.1 5Tiles, shingles ................................ 204 15.5 198 15.1 39 3.0 320 24.4 7
Tiles, shingles, unspecified ........ 19 8.3 42 18.3 8 3.5 62 27.1 10Ceiling tiles ................................. 15 5.8 62 24.1 11 4.3 93 36.2 12Ceramic or stone tiles— drain,
roof, multipurpose .................... 12 6.2 49 25.1 4 2.1 26 13.3 5Roof shingles, except tile ........... 46 13.5 11 3.2 16 4.7 102 29.9 6Vinyl floor tiles ............................ 109 47.6 12 5.2 – – 26 11.4 7Tiles, shingles, n.e.c. ................. 3 4.9 23 37.7 – – 10 16.4 12
Wood, lumber ................................. 2,540 12.5 2,025 10.0 1,806 8.9 3,254 16.0 5Wood, lumber, unspecified ......... 929 13.3 662 9.5 542 7.8 1,094 15.7 5Dimensional lumber: 2x4, 2x3,
etc. .......................................... 749 10.6 650 9.2 708 10.0 1,082 15.3 5Plywood, wood paneling,
particle, chip, flake board ......... 314 10.0 350 11.2 238 7.6 614 19.6 5Wood pieces, trim pieces,
n.e.c. ....................................... 145 22.9 55 8.7 38 6.0 69 10.9 5Wood, lumber, n.e.c. ................. 403 16.1 307 12.3 280 11.2 396 15.9 8
Other building materials— solid elements ....................................... 1,244 16.6 637 8.5 480 6.4 1,599 21.3 6Other building materials— solid
elements, unspecified .............. 39 20.4 4 2.1 64 33.5 1 .5 10
See footnotes at end of table.
Page 24

TABLE R69. Number and percent distribution of nonfatal occupational injuries and illnesses involving days away from work1 bysource of injury or illness and number of days away from work, 2000 — Continued
Source Sourcecode2
Privateindustry3
Percent of days-away-from-work cases involving —
1 day 2 days 3 - 5 days
Number Percent Number Percent Number Percent
Fencing and screeningmaterials, n.e.c. ....................... 4191 594 13 2.2 26 4.4 90 15.2
Flashing ...................................... 4192 103 – – 24 23.3 31 30.1Glass, window panes ................. 4193 1,891 297 15.7 265 14.0 341 18.0Gutters, downspouts .................. 4194 102 6 5.9 8 7.8 14 13.7Sheet flooring ............................. 4195 65 12 18.5 4 6.2 6 9.2Siding— aluminum, vinyl ............ 4196 263 89 33.8 23 8.7 32 12.2Structural hardware, n.e.c. ........ 4197 313 86 27.5 17 5.4 53 16.9Wallboard, drywall ...................... 4198 2,611 450 17.2 356 13.6 521 20.0Other building materials— solidelements, n.e.c. ....................... 4199 1,383 112 8.1 237 17.1 362 26.2
Fasteners, connectors, ropes, ties ..... 42 20,146 4,477 22.2 3,361 16.7 4,470 22.2Fasteners, connectors, ropes, ties,unspecified ................................... 420 57 5 8.8 – – 5 8.8
Fasteners ....................................... 421 11,583 2,923 25.2 2,007 17.3 2,717 23.5Clamps, couplings ...................... 4211 557 84 15.1 48 8.6 156 28.0Nails, brads, tacks ...................... 4212 7,241 1,677 23.2 1,295 17.9 1,759 24.3Nuts, bolts, washers ................... 4213 956 134 14.0 224 23.4 206 21.5Rivets ......................................... 4214 87 19 21.8 11 12.6 17 19.5Screws ....................................... 4215 587 90 15.3 210 35.8 84 14.3Staples ....................................... 4217 955 287 30.1 160 16.8 327 34.2Fasteners, n.e.c. ....................... 4219 1,141 625 54.8 58 5.1 151 13.2
Ropes, ties ..................................... 422 7,593 1,447 19.1 1,266 16.7 1,524 20.1Ropes, ties, unspecified ............. 4220 449 41 9.1 50 11.1 49 10.9Bands ......................................... 4221 950 343 36.1 100 10.5 186 19.6Bungee cords ............................. 4222 399 69 17.3 31 7.8 62 15.5Chains, n.e.c. ............................ 4223 1,455 107 7.4 291 20.0 295 20.3Rope, twine, string ..................... 4224 222 10 4.5 38 17.1 41 18.5Strapping .................................... 4225 1,240 350 28.2 325 26.2 204 16.5Wire— nonelectrical ................... 4226 2,040 361 17.7 370 18.1 632 31.0Ropes, ties, n.e.c. ..................... 4229 839 165 19.7 61 7.3 56 6.7
Valves, nozzles .............................. 423 683 65 9.5 83 12.2 104 15.2Fasteners, connectors, ropes, ties, n.e.c. ........................................... 429 230 37 16.1 5 2.2 120 52.2
Hoisting accessories .......................... 43 1,086 238 21.9 174 16.0 203 18.7Hoisting accessories, unspecified .. 430 174 50 28.7 29 16.7 48 27.6Fixtures, load indicators ................. 431 127 46 36.2 30 23.6 15 11.8Hooks, shackles, magnets,clamshells .................................... 432 626 133 21.2 88 14.1 121 19.3
Slings ............................................. 433 40 2 5.0 9 22.5 2 5.0Hoisting accessories, n.e.c. .......... 439 118 7 5.9 18 15.3 17 14.4
Machine, tool, and electric parts ........ 44 23,463 3,846 16.4 2,477 10.6 4,758 20.3Machine, tool, and electric parts,unspecified ................................... 440 710 162 22.8 119 16.8 178 25.1
Electric parts .................................. 441 9,767 1,294 13.2 971 9.9 2,323 23.8Electric parts, unspecified .......... 4410 317 70 22.1 36 11.4 69 21.8Electrical wiring .......................... 4411 4,177 761 18.2 339 8.1 699 16.7Generators ................................. 4412 719 70 9.7 132 18.4 195 27.1Magnetic and electrolytic apparatus ................................. 4413 47 1 2.1 2 4.3 10 21.3
Motors ........................................ 4414 1,633 165 10.1 88 5.4 687 42.1Power lines, transformers,convertors ................................ 4415 996 64 6.4 227 22.8 160 16.1
Relays, rheostats, starters,controls ..................................... 4416 156 26 16.7 9 5.8 56 35.9
Switchboards, switches, fuses ... 4417 694 40 5.8 52 7.5 86 12.4Electric parts, n.e.c. ................... 4419 1,029 98 9.5 87 8.5 361 35.1
Machine and appliance parts ......... 442 11,176 2,042 18.3 1,119 10.0 1,979 17.7Machine and appliance parts,unspecified ............................... 4420 1,202 205 17.1 92 7.7 246 20.5
Dies, molds, patterns ................. 4421 3,538 706 20.0 260 7.3 490 13.8
See footnotes at end of table.
Page 25

TABLE R69. Number and percent distribution of nonfatal occupational injuries and illnesses involving days away from work1 bysource of injury or illness and number of days away from work, 2000 — Continued
Source
Percent of days-away-from-work cases involving — Mediandaysaway
from work
6 - 10 days 11 - 20 days 21 - 30 days 31 days or more
Number Percent Number Percent Number Percent Number Percent
Fencing and screeningmaterials, n.e.c. ....................... 374 63.0 3 0.5 2 0.3 85 14.3 10
Flashing ...................................... 32 31.1 4 3.9 3 2.9 8 7.8 3Glass, window panes ................. 365 19.3 163 8.6 123 6.5 337 17.8 6Gutters, downspouts .................. 47 46.1 – – – – 27 26.5 6Sheet flooring ............................. 16 24.6 10 15.4 9 13.8 9 13.8 10Siding— aluminum, vinyl ............ 29 11.0 24 9.1 4 1.5 62 23.6 4Structural hardware, n.e.c. ........ 23 7.3 18 5.8 8 2.6 108 34.5 6Wallboard, drywall ...................... 199 7.6 282 10.8 231 8.8 573 21.9 5Other building materials— solid
elements, n.e.c. ....................... 119 8.6 129 9.3 36 2.6 388 28.1 5Fasteners, connectors, ropes, ties ..... 2,370 11.8 1,751 8.7 1,115 5.5 2,601 12.9 4
Fasteners, connectors, ropes, ties,unspecified ................................... 4 7.0 – – – – 43 75.4 39
Fasteners ....................................... 1,381 11.9 914 7.9 580 5.0 1,060 9.2 3Clamps, couplings ...................... 81 14.5 61 11.0 9 1.6 117 21.0 5Nails, brads, tacks ...................... 913 12.6 575 7.9 403 5.6 619 8.5 3Nuts, bolts, washers ................... 57 6.0 110 11.5 85 8.9 139 14.5 3Rivets ......................................... 9 10.3 2 2.3 8 9.2 21 24.1 5Screws ....................................... 122 20.8 31 5.3 9 1.5 40 6.8 2Staples ....................................... 80 8.4 78 8.2 10 1.0 12 1.3 3Fasteners, n.e.c. ....................... 101 8.9 39 3.4 57 5.0 110 9.6 1
Ropes, ties ..................................... 923 12.2 689 9.1 451 5.9 1,293 17.0 5Ropes, ties, unspecified ............. 54 12.0 93 20.7 34 7.6 128 28.5 15Bands ......................................... 161 16.9 56 5.9 40 4.2 62 6.5 4Bungee cords ............................. 80 20.1 15 3.8 1 .3 141 35.3 8Chains, n.e.c. ............................ 268 18.4 150 10.3 77 5.3 266 18.3 6Rope, twine, string ..................... 16 7.2 30 13.5 39 17.6 49 22.1 11Strapping .................................... 114 9.2 74 6.0 30 2.4 144 11.6 2Wire— nonelectrical ................... 167 8.2 163 8.0 73 3.6 273 13.4 4Ropes, ties, n.e.c. ..................... 64 7.6 109 13.0 156 18.6 228 27.2 16
Valves, nozzles .............................. 54 7.9 136 19.9 76 11.1 164 24.0 12Fasteners, connectors, ropes, ties, n.e.c. ........................................... 8 3.5 12 5.2 7 3.0 41 17.8 4
Hoisting accessories .......................... 92 8.5 73 6.7 42 3.9 263 24.2 4Hoisting accessories, unspecified .. 11 6.3 12 6.9 2 1.1 23 13.2 3Fixtures, load indicators ................. 6 4.7 3 2.4 5 3.9 21 16.5 2Hooks, shackles, magnets,clamshells .................................... 64 10.2 48 7.7 30 4.8 142 22.7 5
Slings ............................................. 4 10.0 6 15.0 2 5.0 15 37.5 14Hoisting accessories, n.e.c. .......... 7 5.9 4 3.4 4 3.4 61 51.7 47
Machine, tool, and electric parts ........ 2,759 11.8 3,444 14.7 1,503 6.4 4,675 19.9 7Machine, tool, and electric parts,unspecified ................................... 38 5.4 90 12.7 54 7.6 69 9.7 4
Electric parts .................................. 899 9.2 1,438 14.7 628 6.4 2,214 22.7 7Electric parts, unspecified .......... 32 10.1 48 15.1 8 2.5 54 17.0 4Electrical wiring .......................... 434 10.4 868 20.8 312 7.5 763 18.3 8Generators ................................. 35 4.9 51 7.1 56 7.8 181 25.2 5Magnetic and electrolytic
apparatus ................................. – – – – 32 68.1 2 4.3 22Motors ........................................ 90 5.5 163 10.0 126 7.7 314 19.2 5Power lines, transformers,
convertors ................................ 125 12.6 85 8.5 11 1.1 324 32.5 9Relays, rheostats, starters,
controls ..................................... 19 12.2 9 5.8 22 14.1 16 10.3 5Switchboards, switches, fuses ... 85 12.2 102 14.7 46 6.6 283 40.8 18Electric parts, n.e.c. ................... 78 7.6 112 10.9 15 1.5 277 26.9 5
Machine and appliance parts ......... 1,534 13.7 1,754 15.7 723 6.5 2,024 18.1 7Machine and appliance parts,
unspecified ............................... 213 17.7 113 9.4 81 6.7 252 21.0 7Dies, molds, patterns ................. 366 10.3 910 25.7 237 6.7 568 16.1 10
See footnotes at end of table.
Page 26
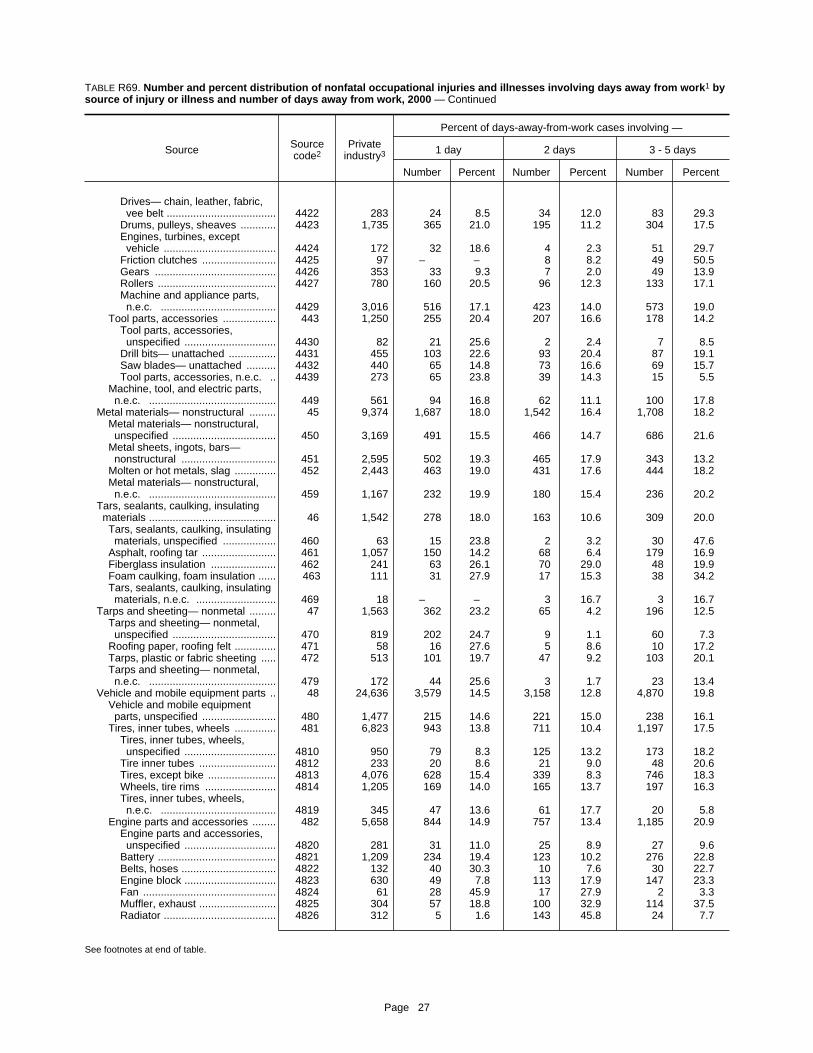
TABLE R69. Number and percent distribution of nonfatal occupational injuries and illnesses involving days away from work1 bysource of injury or illness and number of days away from work, 2000 — Continued
Source Sourcecode2
Privateindustry3
Percent of days-away-from-work cases involving —
1 day 2 days 3 - 5 days
Number Percent Number Percent Number Percent
Drives— chain, leather, fabric,vee belt ..................................... 4422 283 24 8.5 34 12.0 83 29.3
Drums, pulleys, sheaves ............ 4423 1,735 365 21.0 195 11.2 304 17.5Engines, turbines, exceptvehicle ...................................... 4424 172 32 18.6 4 2.3 51 29.7
Friction clutches ......................... 4425 97 – – 8 8.2 49 50.5Gears ......................................... 4426 353 33 9.3 7 2.0 49 13.9Rollers ........................................ 4427 780 160 20.5 96 12.3 133 17.1Machine and appliance parts,n.e.c. ....................................... 4429 3,016 516 17.1 423 14.0 573 19.0
Tool parts, accessories .................. 443 1,250 255 20.4 207 16.6 178 14.2Tool parts, accessories,unspecified ............................... 4430 82 21 25.6 2 2.4 7 8.5
Drill bits— unattached ................ 4431 455 103 22.6 93 20.4 87 19.1Saw blades— unattached .......... 4432 440 65 14.8 73 16.6 69 15.7Tool parts, accessories, n.e.c. .. 4439 273 65 23.8 39 14.3 15 5.5
Machine, tool, and electric parts,n.e.c. ........................................... 449 561 94 16.8 62 11.1 100 17.8
Metal materials— nonstructural ......... 45 9,374 1,687 18.0 1,542 16.4 1,708 18.2Metal materials— nonstructural,unspecified ................................... 450 3,169 491 15.5 466 14.7 686 21.6
Metal sheets, ingots, bars—nonstructural ................................ 451 2,595 502 19.3 465 17.9 343 13.2
Molten or hot metals, slag .............. 452 2,443 463 19.0 431 17.6 444 18.2Metal materials— nonstructural,n.e.c. ........................................... 459 1,167 232 19.9 180 15.4 236 20.2
Tars, sealants, caulking, insulatingmaterials ........................................... 46 1,542 278 18.0 163 10.6 309 20.0
Tars, sealants, caulking, insulatingmaterials, unspecified .................. 460 63 15 23.8 2 3.2 30 47.6
Asphalt, roofing tar ......................... 461 1,057 150 14.2 68 6.4 179 16.9Fiberglass insulation ...................... 462 241 63 26.1 70 29.0 48 19.9Foam caulking, foam insulation ...... 463 111 31 27.9 17 15.3 38 34.2Tars, sealants, caulking, insulatingmaterials, n.e.c. ........................... 469 18 – – 3 16.7 3 16.7
Tarps and sheeting— nonmetal ......... 47 1,563 362 23.2 65 4.2 196 12.5Tarps and sheeting— nonmetal,unspecified ................................... 470 819 202 24.7 9 1.1 60 7.3
Roofing paper, roofing felt .............. 471 58 16 27.6 5 8.6 10 17.2Tarps, plastic or fabric sheeting ..... 472 513 101 19.7 47 9.2 103 20.1Tarps and sheeting— nonmetal,n.e.c. ........................................... 479 172 44 25.6 3 1.7 23 13.4
Vehicle and mobile equipment parts .. 48 24,636 3,579 14.5 3,158 12.8 4,870 19.8Vehicle and mobile equipmentparts, unspecified ......................... 480 1,477 215 14.6 221 15.0 238 16.1
Tires, inner tubes, wheels .............. 481 6,823 943 13.8 711 10.4 1,197 17.5Tires, inner tubes, wheels,unspecified ............................... 4810 950 79 8.3 125 13.2 173 18.2
Tire inner tubes .......................... 4812 233 20 8.6 21 9.0 48 20.6Tires, except bike ....................... 4813 4,076 628 15.4 339 8.3 746 18.3Wheels, tire rims ........................ 4814 1,205 169 14.0 165 13.7 197 16.3Tires, inner tubes, wheels,n.e.c. ....................................... 4819 345 47 13.6 61 17.7 20 5.8
Engine parts and accessories ........ 482 5,658 844 14.9 757 13.4 1,185 20.9Engine parts and accessories,unspecified ............................... 4820 281 31 11.0 25 8.9 27 9.6
Battery ........................................ 4821 1,209 234 19.4 123 10.2 276 22.8Belts, hoses ................................ 4822 132 40 30.3 10 7.6 30 22.7Engine block ............................... 4823 630 49 7.8 113 17.9 147 23.3Fan ............................................. 4824 61 28 45.9 17 27.9 2 3.3Muffler, exhaust .......................... 4825 304 57 18.8 100 32.9 114 37.5Radiator ...................................... 4826 312 5 1.6 143 45.8 24 7.7
See footnotes at end of table.
Page 27
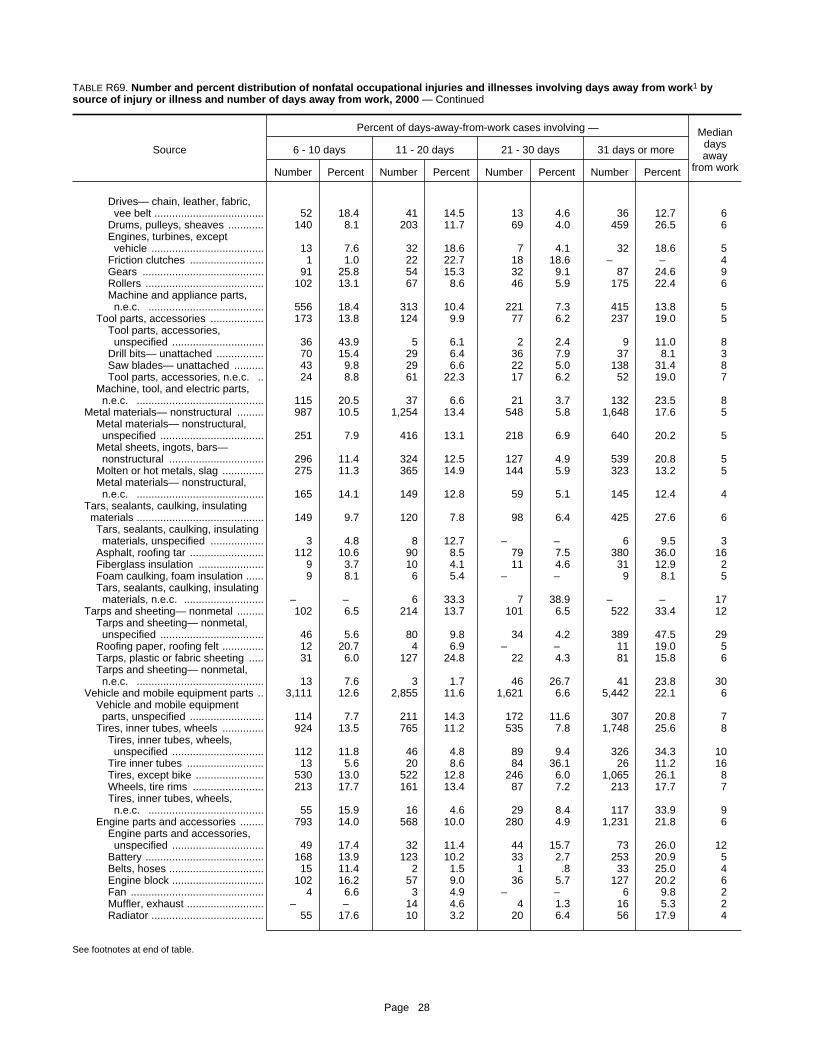
TABLE R69. Number and percent distribution of nonfatal occupational injuries and illnesses involving days away from work1 bysource of injury or illness and number of days away from work, 2000 — Continued
Source
Percent of days-away-from-work cases involving — Mediandaysaway
from work
6 - 10 days 11 - 20 days 21 - 30 days 31 days or more
Number Percent Number Percent Number Percent Number Percent
Drives— chain, leather, fabric,vee belt ..................................... 52 18.4 41 14.5 13 4.6 36 12.7 6
Drums, pulleys, sheaves ............ 140 8.1 203 11.7 69 4.0 459 26.5 6Engines, turbines, except
vehicle ...................................... 13 7.6 32 18.6 7 4.1 32 18.6 5Friction clutches ......................... 1 1.0 22 22.7 18 18.6 – – 4Gears ......................................... 91 25.8 54 15.3 32 9.1 87 24.6 9Rollers ........................................ 102 13.1 67 8.6 46 5.9 175 22.4 6Machine and appliance parts,
n.e.c. ....................................... 556 18.4 313 10.4 221 7.3 415 13.8 5Tool parts, accessories .................. 173 13.8 124 9.9 77 6.2 237 19.0 5
Tool parts, accessories,unspecified ............................... 36 43.9 5 6.1 2 2.4 9 11.0 8
Drill bits— unattached ................ 70 15.4 29 6.4 36 7.9 37 8.1 3Saw blades— unattached .......... 43 9.8 29 6.6 22 5.0 138 31.4 8Tool parts, accessories, n.e.c. .. 24 8.8 61 22.3 17 6.2 52 19.0 7
Machine, tool, and electric parts,n.e.c. ........................................... 115 20.5 37 6.6 21 3.7 132 23.5 8
Metal materials— nonstructural ......... 987 10.5 1,254 13.4 548 5.8 1,648 17.6 5Metal materials— nonstructural,unspecified ................................... 251 7.9 416 13.1 218 6.9 640 20.2 5
Metal sheets, ingots, bars—nonstructural ................................ 296 11.4 324 12.5 127 4.9 539 20.8 5
Molten or hot metals, slag .............. 275 11.3 365 14.9 144 5.9 323 13.2 5Metal materials— nonstructural,n.e.c. ........................................... 165 14.1 149 12.8 59 5.1 145 12.4 4
Tars, sealants, caulking, insulatingmaterials ........................................... 149 9.7 120 7.8 98 6.4 425 27.6 6
Tars, sealants, caulking, insulatingmaterials, unspecified .................. 3 4.8 8 12.7 – – 6 9.5 3
Asphalt, roofing tar ......................... 112 10.6 90 8.5 79 7.5 380 36.0 16Fiberglass insulation ...................... 9 3.7 10 4.1 11 4.6 31 12.9 2Foam caulking, foam insulation ...... 9 8.1 6 5.4 – – 9 8.1 5Tars, sealants, caulking, insulatingmaterials, n.e.c. ........................... – – 6 33.3 7 38.9 – – 17
Tarps and sheeting— nonmetal ......... 102 6.5 214 13.7 101 6.5 522 33.4 12Tarps and sheeting— nonmetal,unspecified ................................... 46 5.6 80 9.8 34 4.2 389 47.5 29
Roofing paper, roofing felt .............. 12 20.7 4 6.9 – – 11 19.0 5Tarps, plastic or fabric sheeting ..... 31 6.0 127 24.8 22 4.3 81 15.8 6Tarps and sheeting— nonmetal,n.e.c. ........................................... 13 7.6 3 1.7 46 26.7 41 23.8 30
Vehicle and mobile equipment parts .. 3,111 12.6 2,855 11.6 1,621 6.6 5,442 22.1 6Vehicle and mobile equipmentparts, unspecified ......................... 114 7.7 211 14.3 172 11.6 307 20.8 7
Tires, inner tubes, wheels .............. 924 13.5 765 11.2 535 7.8 1,748 25.6 8Tires, inner tubes, wheels,
unspecified ............................... 112 11.8 46 4.8 89 9.4 326 34.3 10Tire inner tubes .......................... 13 5.6 20 8.6 84 36.1 26 11.2 16Tires, except bike ....................... 530 13.0 522 12.8 246 6.0 1,065 26.1 8Wheels, tire rims ........................ 213 17.7 161 13.4 87 7.2 213 17.7 7Tires, inner tubes, wheels,
n.e.c. ....................................... 55 15.9 16 4.6 29 8.4 117 33.9 9Engine parts and accessories ........ 793 14.0 568 10.0 280 4.9 1,231 21.8 6
Engine parts and accessories,unspecified ............................... 49 17.4 32 11.4 44 15.7 73 26.0 12
Battery ........................................ 168 13.9 123 10.2 33 2.7 253 20.9 5Belts, hoses ................................ 15 11.4 2 1.5 1 .8 33 25.0 4Engine block ............................... 102 16.2 57 9.0 36 5.7 127 20.2 6Fan ............................................. 4 6.6 3 4.9 – – 6 9.8 2Muffler, exhaust .......................... – – 14 4.6 4 1.3 16 5.3 2Radiator ...................................... 55 17.6 10 3.2 20 6.4 56 17.9 4
See footnotes at end of table.
Page 28

TABLE R69. Number and percent distribution of nonfatal occupational injuries and illnesses involving days away from work1 bysource of injury or illness and number of days away from work, 2000 — Continued
Source Sourcecode2
Privateindustry3
Percent of days-away-from-work cases involving —
1 day 2 days 3 - 5 days
Number Percent Number Percent Number Percent
Transmission .............................. 4827 1,155 161 13.9 145 12.6 292 25.3Engine parts and accessories,n.e.c. ....................................... 4829 1,574 238 15.1 81 5.1 273 17.3
Trailers ........................................... 483 3,060 470 15.4 544 17.8 817 26.7Windshields, vehicle windows ........ 484 420 60 14.3 20 4.8 34 8.1Vehicle and mobile equipmentparts, n.e.c. ................................. 489 7,197 1,047 14.5 904 12.6 1,398 19.4
Parts and materials, n.e.c. ................ 49 9,323 1,752 18.8 1,206 12.9 1,735 18.6
Persons, plants, animals, andminerals .............................................. 5 386,885 52,170 13.5 46,813 12.1 77,816 20.1
Animals and animal products ............. 51 11,004 3,090 28.1 2,390 21.7 2,271 20.6Animals, unspecified ...................... 510 124 8 6.5 59 47.6 6 4.8Animal products— nonfood ............ 511 301 95 31.6 27 9.0 84 27.9
Bones, shells .............................. 5111 178 44 24.7 4 2.2 65 36.5Hides— leather .......................... 5114 78 33 42.3 18 23.1 12 15.4
Birds and fowl ................................. 512 122 54 44.3 18 14.8 37 30.3Turkeys ...................................... 5125 49 16 32.7 6 12.2 20 40.8
Fish, shellfish ................................. 513 212 67 31.6 40 18.9 43 20.3Insects, arachnids (spiders, ticks,scorpions, etc.) ............................. 514 4,717 1,731 36.7 1,392 29.5 801 17.0
Mammals, except humans ............. 515 5,230 1,076 20.6 813 15.5 1,279 24.5Mammals, unspecified ............... 5150 51 42 82.4 – – 6 11.8Cats ............................................ 5151 1,172 287 24.5 232 19.8 456 38.9Cattle .......................................... 5152 855 117 13.7 113 13.2 187 21.9Dogs ........................................... 5153 2,051 358 17.5 371 18.1 450 21.9Horses ........................................ 5154 769 230 29.9 46 6.0 93 12.1Swine ......................................... 5157 230 21 9.1 38 16.5 60 26.1Mammals, n.e.c. ........................ 5159 77 20 26.0 9 11.7 12 15.6
Reptiles, snakes ............................. 516 198 20 10.1 39 19.7 17 8.6Animals, n.e.c. ............................... 519 98 40 40.8 – – 2 2.0
Food products— fresh or processed .. 52 9,086 2,109 23.2 1,834 20.2 1,920 21.1Food products— fresh orprocessed, unspecified ................ 520 779 92 11.8 328 42.1 144 18.5
Bakery products, candy,confections, snack foods .............. 521 132 6 4.5 52 39.4 8 6.1
Beverages, n.e.c. .......................... 522 435 95 21.8 60 13.8 107 24.6Dairy products ................................ 523 226 26 11.5 13 5.8 83 36.7Fruits, nuts, vegetables .................. 524 450 108 24.0 69 15.3 134 29.8Grains, grain mill products ............. 525 66 3 4.5 8 12.1 11 16.7Meat, poultry .................................. 526 1,242 244 19.6 327 26.3 119 9.6Seafood .......................................... 527 187 115 61.5 9 4.8 61 32.6Multiple foods or groceries ............. 528 247 1 .4 30 12.1 31 12.6Other food products— fresh orprocessed ..................................... 529 5,321 1,419 26.7 938 17.6 1,223 23.0
Fats, oils ..................................... 5291 4,277 1,079 25.2 770 18.0 1,025 24.0Other food products— fresh orprocessed, n.e.c. ..................... 5299 1,029 330 32.1 168 16.3 194 18.9
Infectious and parasitic agents ........... 53 1,594 481 30.2 204 12.8 349 21.9Infectious and parasitic agents,unspecified ................................... 530 237 64 27.0 27 11.4 52 21.9
Bacteria .......................................... 531 407 144 35.4 16 3.9 137 33.7Fungi .............................................. 532 102 9 8.8 17 16.7 21 20.6Viruses ........................................... 533 757 237 31.3 112 14.8 120 15.9Infectious and parasitic agents, n.e.c. ........................................... 539 91 26 28.6 32 35.2 18 19.8
Metallic minerals ................................ 54 50 3 6.0 2 4.0 7 14.0Metallic minerals, unspecified ........ 540 49 3 6.1 2 4.1 6 12.2
Nonmetallic minerals, except fuel ...... 55 4,788 624 13.0 503 10.5 1,124 23.5Nonmetallic minerals, except fuel,unspecified ................................... 550 341 58 17.0 32 9.4 45 13.2
Boulders ......................................... 552 43 – – 2 4.7 – –
See footnotes at end of table.
Page 29
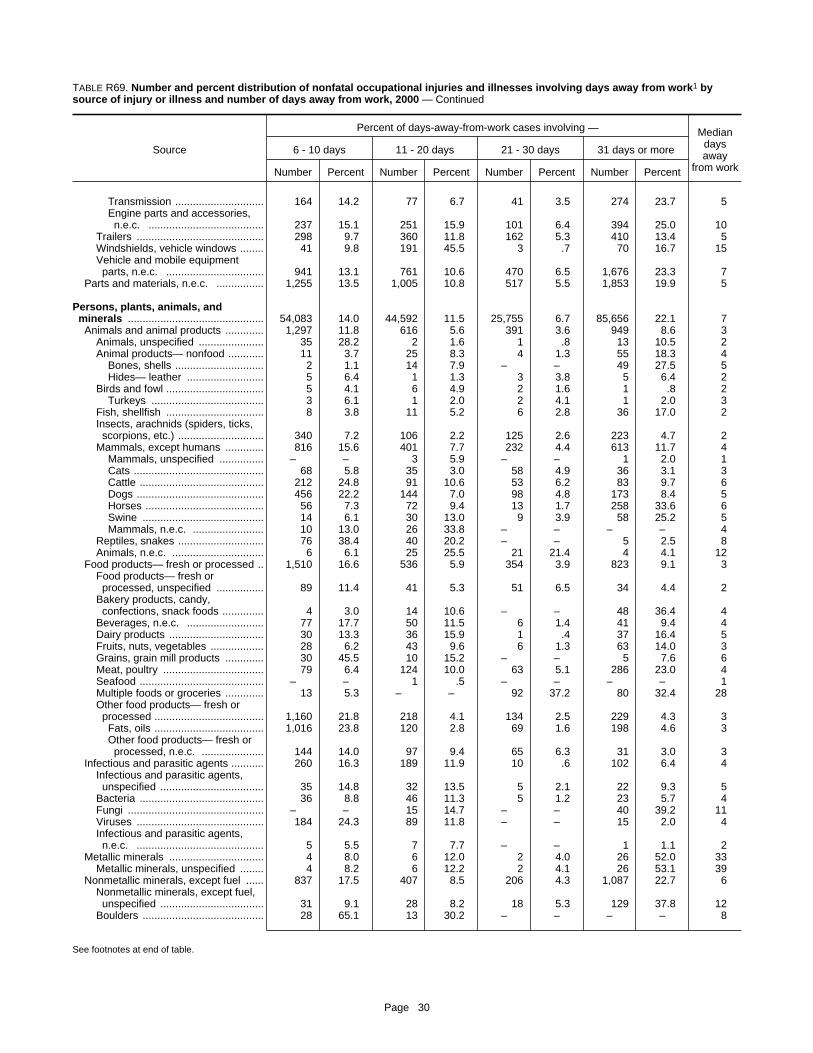
TABLE R69. Number and percent distribution of nonfatal occupational injuries and illnesses involving days away from work1 bysource of injury or illness and number of days away from work, 2000 — Continued
Source
Percent of days-away-from-work cases involving — Mediandaysaway
from work
6 - 10 days 11 - 20 days 21 - 30 days 31 days or more
Number Percent Number Percent Number Percent Number Percent
Transmission .............................. 164 14.2 77 6.7 41 3.5 274 23.7 5Engine parts and accessories,
n.e.c. ....................................... 237 15.1 251 15.9 101 6.4 394 25.0 10Trailers ........................................... 298 9.7 360 11.8 162 5.3 410 13.4 5Windshields, vehicle windows ........ 41 9.8 191 45.5 3 .7 70 16.7 15Vehicle and mobile equipmentparts, n.e.c. ................................. 941 13.1 761 10.6 470 6.5 1,676 23.3 7
Parts and materials, n.e.c. ................ 1,255 13.5 1,005 10.8 517 5.5 1,853 19.9 5
Persons, plants, animals, andminerals .............................................. 54,083 14.0 44,592 11.5 25,755 6.7 85,656 22.1 7
Animals and animal products ............. 1,297 11.8 616 5.6 391 3.6 949 8.6 3Animals, unspecified ...................... 35 28.2 2 1.6 1 .8 13 10.5 2Animal products— nonfood ............ 11 3.7 25 8.3 4 1.3 55 18.3 4
Bones, shells .............................. 2 1.1 14 7.9 – – 49 27.5 5Hides— leather .......................... 5 6.4 1 1.3 3 3.8 5 6.4 2
Birds and fowl ................................. 5 4.1 6 4.9 2 1.6 1 .8 2Turkeys ...................................... 3 6.1 1 2.0 2 4.1 1 2.0 3
Fish, shellfish ................................. 8 3.8 11 5.2 6 2.8 36 17.0 2Insects, arachnids (spiders, ticks,scorpions, etc.) ............................. 340 7.2 106 2.2 125 2.6 223 4.7 2
Mammals, except humans ............. 816 15.6 401 7.7 232 4.4 613 11.7 4Mammals, unspecified ............... – – 3 5.9 – – 1 2.0 1Cats ............................................ 68 5.8 35 3.0 58 4.9 36 3.1 3Cattle .......................................... 212 24.8 91 10.6 53 6.2 83 9.7 6Dogs ........................................... 456 22.2 144 7.0 98 4.8 173 8.4 5Horses ........................................ 56 7.3 72 9.4 13 1.7 258 33.6 6Swine ......................................... 14 6.1 30 13.0 9 3.9 58 25.2 5Mammals, n.e.c. ........................ 10 13.0 26 33.8 – – – – 4
Reptiles, snakes ............................. 76 38.4 40 20.2 – – 5 2.5 8Animals, n.e.c. ............................... 6 6.1 25 25.5 21 21.4 4 4.1 12
Food products— fresh or processed .. 1,510 16.6 536 5.9 354 3.9 823 9.1 3Food products— fresh orprocessed, unspecified ................ 89 11.4 41 5.3 51 6.5 34 4.4 2
Bakery products, candy,confections, snack foods .............. 4 3.0 14 10.6 – – 48 36.4 4
Beverages, n.e.c. .......................... 77 17.7 50 11.5 6 1.4 41 9.4 4Dairy products ................................ 30 13.3 36 15.9 1 .4 37 16.4 5Fruits, nuts, vegetables .................. 28 6.2 43 9.6 6 1.3 63 14.0 3Grains, grain mill products ............. 30 45.5 10 15.2 – – 5 7.6 6Meat, poultry .................................. 79 6.4 124 10.0 63 5.1 286 23.0 4Seafood .......................................... – – 1 .5 – – – – 1Multiple foods or groceries ............. 13 5.3 – – 92 37.2 80 32.4 28Other food products— fresh orprocessed ..................................... 1,160 21.8 218 4.1 134 2.5 229 4.3 3Fats, oils ..................................... 1,016 23.8 120 2.8 69 1.6 198 4.6 3Other food products— fresh or
processed, n.e.c. ..................... 144 14.0 97 9.4 65 6.3 31 3.0 3Infectious and parasitic agents ........... 260 16.3 189 11.9 10 .6 102 6.4 4
Infectious and parasitic agents,unspecified ................................... 35 14.8 32 13.5 5 2.1 22 9.3 5
Bacteria .......................................... 36 8.8 46 11.3 5 1.2 23 5.7 4Fungi .............................................. – – 15 14.7 – – 40 39.2 11Viruses ........................................... 184 24.3 89 11.8 – – 15 2.0 4Infectious and parasitic agents, n.e.c. ........................................... 5 5.5 7 7.7 – – 1 1.1 2
Metallic minerals ................................ 4 8.0 6 12.0 2 4.0 26 52.0 33Metallic minerals, unspecified ........ 4 8.2 6 12.2 2 4.1 26 53.1 39
Nonmetallic minerals, except fuel ...... 837 17.5 407 8.5 206 4.3 1,087 22.7 6Nonmetallic minerals, except fuel,unspecified ................................... 31 9.1 28 8.2 18 5.3 129 37.8 12
Boulders ......................................... 28 65.1 13 30.2 – – – – 8
See footnotes at end of table.
Page 30

TABLE R69. Number and percent distribution of nonfatal occupational injuries and illnesses involving days away from work1 bysource of injury or illness and number of days away from work, 2000 — Continued
Source Sourcecode2
Privateindustry3
Percent of days-away-from-work cases involving —
1 day 2 days 3 - 5 days
Number Percent Number Percent Number Percent
Clay— natural and processed ........ 553 92 4 4.3 9 9.8 67 72.8Dirt, earth ....................................... 554 439 80 18.2 57 13.0 97 22.1Rocks, crushed stone ..................... 555 3,368 378 11.2 367 10.9 757 22.5Sand, gravel ................................... 556 338 88 26.0 12 3.6 124 36.7Nonmetallic minerals, except fuel,n.e.c. ........................................... 559 144 10 6.9 22 15.3 34 23.6
Person— injured or ill worker ............. 56 265,555 29,094 11.0 28,123 10.6 50,500 19.0Bodily conditions of injured, illworker .......................................... 561 5,875 413 7.0 485 8.3 1,076 18.3
Bodily motion or position of injured,ill worker ....................................... 562 258,504 28,518 11.0 27,595 10.7 49,230 19.0
Person— injured or ill worker,n.e.c. ........................................... 569 1,177 163 13.8 43 3.7 195 16.6
Person— other than injured or illworker .............................................. 57 88,264 15,347 17.4 12,497 14.2 20,202 22.9
Person— other than injured, illworker, unspecified ...................... 570 1,458 250 17.1 256 17.6 238 16.3
Bodily fluids or substances ofperson .......................................... 571 583 55 9.4 310 53.2 100 17.2
Co-worker, former co-worker ofinjured or ill worker ....................... 572 2,788 390 14.0 435 15.6 628 22.5
Health care patient or resident ofhealth care facility ........................ 573 74,610 13,196 17.7 10,257 13.7 17,365 23.3
Person— other than injured or illworker, n.e.c. ............................... 579 8,821 1,454 16.5 1,238 14.0 1,870 21.2
Plants, trees, vegetation— notprocessed ......................................... 58 6,492 1,422 21.9 1,254 19.3 1,444 22.2
Plants, trees, vegetation— notprocessed, unspecified ................ 580 303 47 15.5 59 19.5 137 45.2
Field crops ...................................... 582 84 72 85.7 5 6.0 5 6.0Flowers ........................................... 583 38 – – 6 15.8 18 47.4Houseplants ................................... 584 94 61 64.9 2 2.1 12 12.8Poison ivy, oak, sumac .................. 585 640 213 33.3 147 23.0 172 26.9Shrubs, grasses ............................. 586 312 74 23.7 89 28.5 30 9.6Trees, logs ..................................... 587 4,433 886 20.0 799 18.0 906 20.4Plants, trees, vegetation— notprocessed, n.e.c. ......................... 589 587 68 11.6 147 25.0 165 28.1
Persons, plants, animals, andminerals, n.e.c. ................................ 59 52 – – 5 9.6 – –
Structures and surfaces ...................... 6 321,561 42,709 13.3 37,988 11.8 60,895 18.9Structures and surfaces,unspecified ....................................... 60 952 50 5.3 58 6.1 113 11.9
Building systems ................................ 61 133 19 14.3 8 6.0 8 6.0Building systems, unspecified ........ 610 82 3 3.7 1 1.2 8 9.8Climate control system ................... 611 19 13 68.4 – – – –Plumbing system ............................ 612 19 – – 3 15.8 – –
Floors, walkways, ground surfaces .... 62 278,495 36,214 13.0 31,331 11.3 52,132 18.7Floors, walkways, ground surfaces,unspecified ................................... 620 17,730 1,871 10.6 1,945 11.0 3,237 18.3
Escalators ...................................... 621 599 100 16.7 95 15.9 142 23.7Floors ............................................. 622 147,825 20,154 13.6 17,411 11.8 29,006 19.6
Floor, unspecified ....................... 6220 8,283 984 11.9 721 8.7 1,639 19.8Floor of building .......................... 6221 132,318 18,219 13.8 15,961 12.1 26,232 19.8Floor of elevator ......................... 6222 273 55 20.1 16 5.9 41 15.0Floor of mine .............................. 6223 520 11 2.1 11 2.1 55 10.6Floor of scaffold, staging, ortemporary work platform .......... 6224 1,198 161 13.4 190 15.9 281 23.5
Floor of vehicle ........................... 6225 1,999 277 13.9 239 12.0 479 24.0Floor, n.e.c. ............................... 6229 3,234 448 13.9 274 8.5 279 8.6
Ground ........................................... 623 53,827 5,413 10.1 5,146 9.6 8,585 15.9
See footnotes at end of table.
Page 31

TABLE R69. Number and percent distribution of nonfatal occupational injuries and illnesses involving days away from work1 bysource of injury or illness and number of days away from work, 2000 — Continued
Source
Percent of days-away-from-work cases involving — Mediandaysaway
from work
6 - 10 days 11 - 20 days 21 - 30 days 31 days or more
Number Percent Number Percent Number Percent Number Percent
Clay— natural and processed ........ 1 1.1 3 3.3 – – 8 8.7 3Dirt, earth ....................................... 19 4.3 17 3.9 23 5.2 146 33.3 5Rocks, crushed stone ..................... 713 21.2 320 9.5 113 3.4 721 21.4 7Sand, gravel ................................... 43 12.7 6 1.8 53 15.7 13 3.8 5Nonmetallic minerals, except fuel,n.e.c. ........................................... 1 .7 19 13.2 – – 58 40.3 13
Person— injured or ill worker ............. 36,656 13.8 32,847 12.4 20,107 7.6 68,228 25.7 9Bodily conditions of injured, illworker .......................................... 689 11.7 805 13.7 605 10.3 1,802 30.7 14
Bodily motion or position of injured,ill worker ....................................... 35,805 13.9 31,901 12.3 19,428 7.5 66,026 25.5 9
Person— injured or ill worker,n.e.c. ........................................... 163 13.8 142 12.1 73 6.2 400 34.0 12
Person— other than injured or illworker .............................................. 12,695 14.4 9,536 10.8 4,527 5.1 13,459 15.2 5
Person— other than injured, illworker, unspecified ...................... 235 16.1 209 14.3 16 1.1 254 17.4 5
Bodily fluids or substances ofperson .......................................... 8 1.4 92 15.8 9 1.5 8 1.4 2
Co-worker, former co-worker ofinjured or ill worker ....................... 323 11.6 320 11.5 184 6.6 508 18.2 5
Health care patient or resident ofhealth care facility ........................ 10,872 14.6 8,096 10.9 4,036 5.4 10,789 14.5 5
Person— other than injured or illworker, n.e.c. ............................... 1,259 14.3 819 9.3 282 3.2 1,899 21.5 5
Plants, trees, vegetation— notprocessed ......................................... 806 12.4 455 7.0 146 2.2 966 14.9 4
Plants, trees, vegetation— notprocessed, unspecified ................ 25 8.3 6 2.0 7 2.3 22 7.3 4
Field crops ...................................... – – – – – – 2 2.4 1Flowers ........................................... 2 5.3 – – 7 18.4 4 10.5 4Houseplants ................................... 9 9.6 5 5.3 2 2.1 3 3.2 1Poison ivy, oak, sumac .................. 74 11.6 35 5.5 – – – – 2Shrubs, grasses ............................. 17 5.4 60 19.2 2 .6 41 13.1 2Trees, logs ..................................... 553 12.5 323 7.3 93 2.1 874 19.7 4Plants, trees, vegetation— notprocessed, n.e.c. ......................... 127 21.6 26 4.4 35 6.0 19 3.2 4
Persons, plants, animals, andminerals, n.e.c. ................................ 18 34.6 – – 11 21.2 17 32.7 23
Structures and surfaces ...................... 36,824 11.5 37,375 11.6 21,112 6.6 84,658 26.3 8Structures and surfaces,unspecified ....................................... 71 7.5 69 7.2 59 6.2 532 55.9 48
Building systems ................................ 6 4.5 – – – – 92 69.2 45Building systems, unspecified ........ – – – – – – 70 85.4 45Climate control system ................... 6 31.6 – – – – – – 1Plumbing system ............................ – – – – – – 16 84.2 31
Floors, walkways, ground surfaces .... 32,114 11.5 31,987 11.5 18,601 6.7 76,117 27.3 8Floors, walkways, ground surfaces,unspecified ................................... 2,123 12.0 1,640 9.2 1,152 6.5 5,763 32.5 10
Escalators ...................................... 42 7.0 48 8.0 35 5.8 137 22.9 4Floors ............................................. 16,679 11.3 15,626 10.6 9,525 6.4 39,424 26.7 7
Floor, unspecified ....................... 833 10.1 833 10.1 474 5.7 2,800 33.8 10Floor of building .......................... 14,972 11.3 14,060 10.6 8,634 6.5 34,240 25.9 7Floor of elevator ......................... 35 12.8 21 7.7 54 19.8 51 18.7 9Floor of mine .............................. 37 7.1 57 11.0 35 6.7 315 60.6 49Floor of scaffold, staging, or
temporary work platform .......... 141 11.8 104 8.7 47 3.9 273 22.8 5Floor of vehicle ........................... 208 10.4 184 9.2 137 6.9 475 23.8 6Floor, n.e.c. ............................... 453 14.0 367 11.3 145 4.5 1,269 39.2 17
Ground ........................................... 6,630 12.3 7,628 14.2 3,750 7.0 16,675 31.0 12
See footnotes at end of table.
Page 32
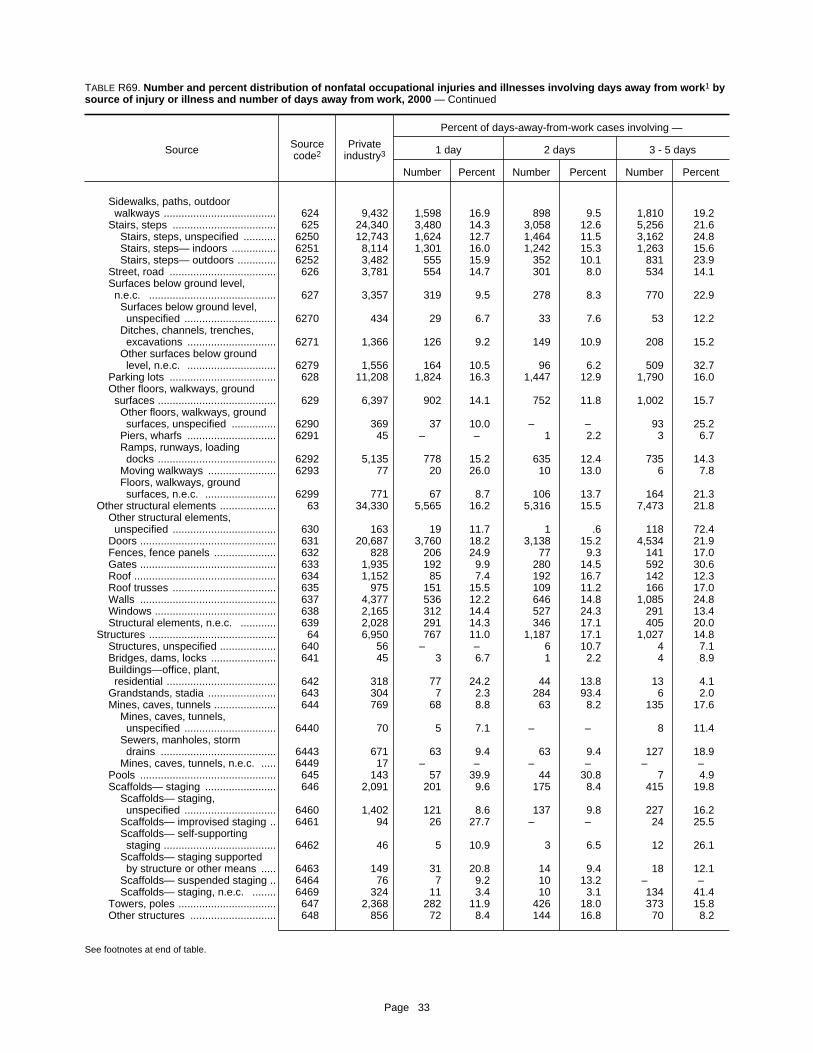
TABLE R69. Number and percent distribution of nonfatal occupational injuries and illnesses involving days away from work1 bysource of injury or illness and number of days away from work, 2000 — Continued
Source Sourcecode2
Privateindustry3
Percent of days-away-from-work cases involving —
1 day 2 days 3 - 5 days
Number Percent Number Percent Number Percent
Sidewalks, paths, outdoorwalkways ...................................... 624 9,432 1,598 16.9 898 9.5 1,810 19.2
Stairs, steps ................................... 625 24,340 3,480 14.3 3,058 12.6 5,256 21.6Stairs, steps, unspecified ........... 6250 12,743 1,624 12.7 1,464 11.5 3,162 24.8Stairs, steps— indoors ............... 6251 8,114 1,301 16.0 1,242 15.3 1,263 15.6Stairs, steps— outdoors ............. 6252 3,482 555 15.9 352 10.1 831 23.9
Street, road .................................... 626 3,781 554 14.7 301 8.0 534 14.1Surfaces below ground level,n.e.c. ........................................... 627 3,357 319 9.5 278 8.3 770 22.9
Surfaces below ground level,unspecified ............................... 6270 434 29 6.7 33 7.6 53 12.2
Ditches, channels, trenches,excavations .............................. 6271 1,366 126 9.2 149 10.9 208 15.2
Other surfaces below groundlevel, n.e.c. .............................. 6279 1,556 164 10.5 96 6.2 509 32.7
Parking lots .................................... 628 11,208 1,824 16.3 1,447 12.9 1,790 16.0Other floors, walkways, groundsurfaces ........................................ 629 6,397 902 14.1 752 11.8 1,002 15.7
Other floors, walkways, groundsurfaces, unspecified ............... 6290 369 37 10.0 – – 93 25.2
Piers, wharfs .............................. 6291 45 – – 1 2.2 3 6.7Ramps, runways, loadingdocks ........................................ 6292 5,135 778 15.2 635 12.4 735 14.3
Moving walkways ....................... 6293 77 20 26.0 10 13.0 6 7.8Floors, walkways, groundsurfaces, n.e.c. ........................ 6299 771 67 8.7 106 13.7 164 21.3
Other structural elements ................... 63 34,330 5,565 16.2 5,316 15.5 7,473 21.8Other structural elements,unspecified ................................... 630 163 19 11.7 1 .6 118 72.4
Doors .............................................. 631 20,687 3,760 18.2 3,138 15.2 4,534 21.9Fences, fence panels ..................... 632 828 206 24.9 77 9.3 141 17.0Gates .............................................. 633 1,935 192 9.9 280 14.5 592 30.6Roof ................................................ 634 1,152 85 7.4 192 16.7 142 12.3Roof trusses ................................... 635 975 151 15.5 109 11.2 166 17.0Walls .............................................. 637 4,377 536 12.2 646 14.8 1,085 24.8Windows ......................................... 638 2,165 312 14.4 527 24.3 291 13.4Structural elements, n.e.c. ............ 639 2,028 291 14.3 346 17.1 405 20.0
Structures ........................................... 64 6,950 767 11.0 1,187 17.1 1,027 14.8Structures, unspecified ................... 640 56 – – 6 10.7 4 7.1Bridges, dams, locks ...................... 641 45 3 6.7 1 2.2 4 8.9Buildings—office, plant,residential ..................................... 642 318 77 24.2 44 13.8 13 4.1
Grandstands, stadia ....................... 643 304 7 2.3 284 93.4 6 2.0Mines, caves, tunnels ..................... 644 769 68 8.8 63 8.2 135 17.6
Mines, caves, tunnels,unspecified ............................... 6440 70 5 7.1 – – 8 11.4
Sewers, manholes, stormdrains ....................................... 6443 671 63 9.4 63 9.4 127 18.9
Mines, caves, tunnels, n.e.c. ..... 6449 17 – – – – – –Pools .............................................. 645 143 57 39.9 44 30.8 7 4.9Scaffolds— staging ........................ 646 2,091 201 9.6 175 8.4 415 19.8
Scaffolds— staging,unspecified ............................... 6460 1,402 121 8.6 137 9.8 227 16.2
Scaffolds— improvised staging .. 6461 94 26 27.7 – – 24 25.5Scaffolds— self-supportingstaging ...................................... 6462 46 5 10.9 3 6.5 12 26.1
Scaffolds— staging supportedby structure or other means ..... 6463 149 31 20.8 14 9.4 18 12.1
Scaffolds— suspended staging .. 6464 76 7 9.2 10 13.2 – –Scaffolds— staging, n.e.c. ........ 6469 324 11 3.4 10 3.1 134 41.4
Towers, poles ................................. 647 2,368 282 11.9 426 18.0 373 15.8Other structures ............................. 648 856 72 8.4 144 16.8 70 8.2
See footnotes at end of table.
Page 33
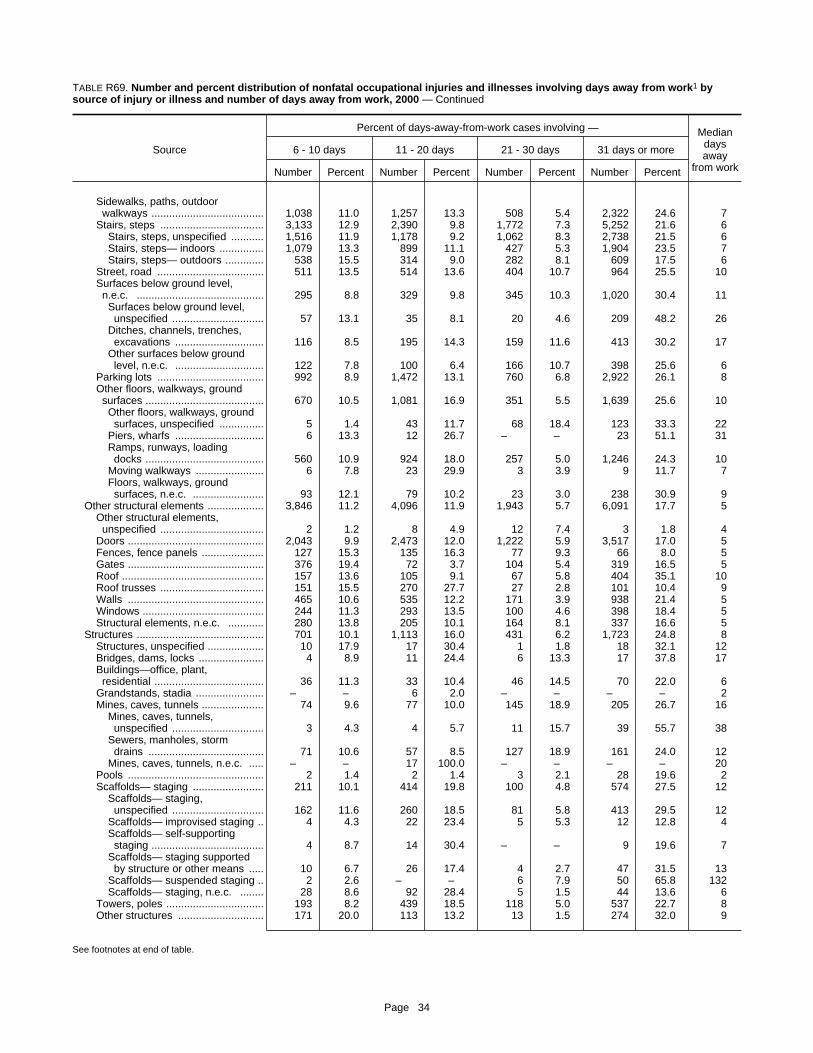
TABLE R69. Number and percent distribution of nonfatal occupational injuries and illnesses involving days away from work1 bysource of injury or illness and number of days away from work, 2000 — Continued
Source
Percent of days-away-from-work cases involving — Mediandaysaway
from work
6 - 10 days 11 - 20 days 21 - 30 days 31 days or more
Number Percent Number Percent Number Percent Number Percent
Sidewalks, paths, outdoorwalkways ...................................... 1,038 11.0 1,257 13.3 508 5.4 2,322 24.6 7
Stairs, steps ................................... 3,133 12.9 2,390 9.8 1,772 7.3 5,252 21.6 6Stairs, steps, unspecified ........... 1,516 11.9 1,178 9.2 1,062 8.3 2,738 21.5 6Stairs, steps— indoors ............... 1,079 13.3 899 11.1 427 5.3 1,904 23.5 7Stairs, steps— outdoors ............. 538 15.5 314 9.0 282 8.1 609 17.5 6
Street, road .................................... 511 13.5 514 13.6 404 10.7 964 25.5 10Surfaces below ground level,n.e.c. ........................................... 295 8.8 329 9.8 345 10.3 1,020 30.4 11Surfaces below ground level,
unspecified ............................... 57 13.1 35 8.1 20 4.6 209 48.2 26Ditches, channels, trenches,
excavations .............................. 116 8.5 195 14.3 159 11.6 413 30.2 17Other surfaces below ground
level, n.e.c. .............................. 122 7.8 100 6.4 166 10.7 398 25.6 6Parking lots .................................... 992 8.9 1,472 13.1 760 6.8 2,922 26.1 8Other floors, walkways, groundsurfaces ........................................ 670 10.5 1,081 16.9 351 5.5 1,639 25.6 10Other floors, walkways, ground
surfaces, unspecified ............... 5 1.4 43 11.7 68 18.4 123 33.3 22Piers, wharfs .............................. 6 13.3 12 26.7 – – 23 51.1 31Ramps, runways, loading
docks ........................................ 560 10.9 924 18.0 257 5.0 1,246 24.3 10Moving walkways ....................... 6 7.8 23 29.9 3 3.9 9 11.7 7Floors, walkways, ground
surfaces, n.e.c. ........................ 93 12.1 79 10.2 23 3.0 238 30.9 9Other structural elements ................... 3,846 11.2 4,096 11.9 1,943 5.7 6,091 17.7 5
Other structural elements,unspecified ................................... 2 1.2 8 4.9 12 7.4 3 1.8 4
Doors .............................................. 2,043 9.9 2,473 12.0 1,222 5.9 3,517 17.0 5Fences, fence panels ..................... 127 15.3 135 16.3 77 9.3 66 8.0 5Gates .............................................. 376 19.4 72 3.7 104 5.4 319 16.5 5Roof ................................................ 157 13.6 105 9.1 67 5.8 404 35.1 10Roof trusses ................................... 151 15.5 270 27.7 27 2.8 101 10.4 9Walls .............................................. 465 10.6 535 12.2 171 3.9 938 21.4 5Windows ......................................... 244 11.3 293 13.5 100 4.6 398 18.4 5Structural elements, n.e.c. ............ 280 13.8 205 10.1 164 8.1 337 16.6 5
Structures ........................................... 701 10.1 1,113 16.0 431 6.2 1,723 24.8 8Structures, unspecified ................... 10 17.9 17 30.4 1 1.8 18 32.1 12Bridges, dams, locks ...................... 4 8.9 11 24.4 6 13.3 17 37.8 17Buildings—office, plant,residential ..................................... 36 11.3 33 10.4 46 14.5 70 22.0 6
Grandstands, stadia ....................... – – 6 2.0 – – – – 2Mines, caves, tunnels ..................... 74 9.6 77 10.0 145 18.9 205 26.7 16
Mines, caves, tunnels,unspecified ............................... 3 4.3 4 5.7 11 15.7 39 55.7 38
Sewers, manholes, stormdrains ....................................... 71 10.6 57 8.5 127 18.9 161 24.0 12
Mines, caves, tunnels, n.e.c. ..... – – 17 100.0 – – – – 20Pools .............................................. 2 1.4 2 1.4 3 2.1 28 19.6 2Scaffolds— staging ........................ 211 10.1 414 19.8 100 4.8 574 27.5 12
Scaffolds— staging,unspecified ............................... 162 11.6 260 18.5 81 5.8 413 29.5 12
Scaffolds— improvised staging .. 4 4.3 22 23.4 5 5.3 12 12.8 4Scaffolds— self-supporting
staging ...................................... 4 8.7 14 30.4 – – 9 19.6 7Scaffolds— staging supported
by structure or other means ..... 10 6.7 26 17.4 4 2.7 47 31.5 13Scaffolds— suspended staging .. 2 2.6 – – 6 7.9 50 65.8 132Scaffolds— staging, n.e.c. ........ 28 8.6 92 28.4 5 1.5 44 13.6 6
Towers, poles ................................. 193 8.2 439 18.5 118 5.0 537 22.7 8Other structures ............................. 171 20.0 113 13.2 13 1.5 274 32.0 9
See footnotes at end of table.
Page 34

TABLE R69. Number and percent distribution of nonfatal occupational injuries and illnesses involving days away from work1 bysource of injury or illness and number of days away from work, 2000 — Continued
Source Sourcecode2
Privateindustry3
Percent of days-away-from-work cases involving —
1 day 2 days 3 - 5 days
Number Percent Number Percent Number Percent
Guardrails, road dividers ............ 6481 231 39 16.9 35 15.2 22 9.5Other structures, n.e.c. .............. 6489 602 33 5.5 105 17.4 48 8.0
Structures and surfaces, n.e.c. ......... 69 700 92 13.1 88 12.6 142 20.3
Tools, instruments, and equipment ... 7 103,921 23,086 22.2 15,760 15.2 21,503 20.7Tools, instruments, and equipment,unspecified ....................................... 70 4,103 720 17.5 497 12.1 1,124 27.4
Handtools— nonpowered ................... 71 51,078 12,238 24.0 8,763 17.2 10,480 20.5Handtools— nonpowered,unspecified ................................... 710 211 63 29.9 25 11.8 35 16.6
Boring handtools— nonpowered .... 711 440 137 31.1 67 15.2 83 18.9Augers ........................................ 7111 40 – – – – – –Braces ........................................ 7112 172 89 51.7 32 18.6 14 8.1Drills ........................................... 7113 222 45 20.3 34 15.3 70 31.5
Cutting handtools— nonpowered ... 712 27,129 7,532 27.8 5,181 19.1 5,598 20.6Cutting handtools—nonpowered, unspecified ......... 7120 134 42 31.3 9 6.7 22 16.4
Axes, hatchets ............................ 7121 183 78 42.6 10 5.5 49 26.8Bolt cutters ................................. 7122 269 110 40.9 29 10.8 18 6.7Chisels ....................................... 7123 160 31 19.4 17 10.6 25 15.6Knives ........................................ 7124 22,163 6,259 28.2 4,057 18.3 4,699 21.2Saws .......................................... 7125 339 43 12.7 41 12.1 60 17.7Scissors, snips, shears .............. 7126 1,598 433 27.1 304 19.0 226 14.1Cutting handtools—nonpowered, n.e.c. .................. 7129 2,283 536 23.5 715 31.3 499 21.9
Digging handtools— nonpowered .. 713 4,354 862 19.8 354 8.1 1,112 25.5Digging handtools—nonpowered, unspecified ......... 7130 125 4 3.2 1 .8 58 46.4
Hoes ........................................... 7131 62 14 22.6 8 12.9 4 6.5Picks ........................................... 7132 198 6 3.0 5 2.5 104 52.5Shovels ...................................... 7133 3,569 781 21.9 332 9.3 862 24.2Trowels ....................................... 7134 127 15 11.8 5 3.9 34 26.8Digging handtools—nonpowered, n.e.c. .................. 7139 274 43 15.7 3 1.1 50 18.2
Gripping handtools—nonpowered ................................. 714 1,366 299 21.9 157 11.5 388 28.4
Gripping handtools—nonpowered, unspecified ......... 7140 166 23 13.9 43 25.9 15 9.0
Pliers, tongs ............................... 7141 456 112 24.6 32 7.0 187 41.0Vises, clamps ............................. 7142 597 108 18.1 67 11.2 166 27.8Gripping handtools—nonpowered, n.e.c. .................. 7149 148 55 37.2 16 10.8 21 14.2
Measuring handtools—nonpowered ................................. 715 725 210 29.0 153 21.1 184 25.4
Calipers, micrometers ................ 7151 52 5 9.6 17 32.7 22 42.3Gauges ....................................... 7153 130 12 9.2 7 5.4 50 38.5Rulers, tape measures ............... 7156 133 59 44.4 16 12.0 48 36.1Measuring handtools—nonpowered, n.e.c. .................. 7159 356 129 36.2 77 21.6 59 16.6
Striking and nailing handtools—nonpowered ................................. 716 6,843 1,222 17.9 1,300 19.0 1,313 19.2
Striking and nailing handtools— nonpowered, unspecified ......... 7160 375 42 11.2 91 24.3 99 26.4
Hammers .................................... 7161 3,616 543 15.0 522 14.4 657 18.2Mallets ........................................ 7162 122 24 19.7 41 33.6 15 12.3Punches, counterpunches,countersinks ............................. 7163 406 4 1.0 354 87.2 5 1.2
Sledges ...................................... 7164 2,128 555 26.1 284 13.3 459 21.6Striking handtools—nonpowered, n.e.c. .................. 7169 197 53 26.9 7 3.6 78 39.6
Surfacing handtools—nonpowered ................................. 717 773 290 37.5 131 16.9 118 15.3
See footnotes at end of table.
Page 35

TABLE R69. Number and percent distribution of nonfatal occupational injuries and illnesses involving days away from work1 bysource of injury or illness and number of days away from work, 2000 — Continued
Source
Percent of days-away-from-work cases involving — Mediandaysaway
from work
6 - 10 days 11 - 20 days 21 - 30 days 31 days or more
Number Percent Number Percent Number Percent Number Percent
Guardrails, road dividers ............ 27 11.7 32 13.9 4 1.7 71 30.7 7Other structures, n.e.c. .............. 142 23.6 79 13.1 9 1.5 188 31.2 9
Structures and surfaces, n.e.c. ......... 86 12.3 111 15.9 78 11.1 103 14.7 6
Tools, instruments, and equipment ... 12,821 12.3 10,277 9.9 5,421 5.2 15,053 14.5 4Tools, instruments, and equipment,unspecified ....................................... 526 12.8 360 8.8 177 4.3 700 17.1 5
Handtools— nonpowered ................... 6,817 13.3 4,581 9.0 2,348 4.6 5,850 11.5 4Handtools— nonpowered,unspecified ................................... 37 17.5 10 4.7 14 6.6 27 12.8 3
Boring handtools— nonpowered .... 29 6.6 52 11.8 10 2.3 63 14.3 3Augers ........................................ 6 15.0 – – – – 34 85.0 236Braces ........................................ 10 5.8 27 15.7 1 .6 – – 1Drills ........................................... 13 5.9 22 9.9 9 4.1 28 12.6 3
Cutting handtools— nonpowered ... 3,684 13.6 2,209 8.1 1,010 3.7 1,914 7.1 3Cutting handtools—
nonpowered, unspecified ......... 20 14.9 25 18.7 – – 16 11.9 5Axes, hatchets ............................ – – 1 .5 21 11.5 24 13.1 4Bolt cutters ................................. 13 4.8 57 21.2 43 16.0 – – 2Chisels ....................................... 59 36.9 19 11.9 – – 9 5.6 8Knives ........................................ 3,145 14.2 1,653 7.5 705 3.2 1,645 7.4 3Saws .......................................... 98 28.9 53 15.6 21 6.2 24 7.1 6Scissors, snips, shears .............. 189 11.8 266 16.6 108 6.8 71 4.4 3Cutting handtools—
nonpowered, n.e.c. .................. 160 7.0 135 5.9 112 4.9 127 5.6 2Digging handtools— nonpowered .. 651 15.0 378 8.7 234 5.4 763 17.5 5
Digging handtools—nonpowered, unspecified ......... 27 21.6 4 3.2 18 14.4 13 10.4 5
Hoes ........................................... 9 14.5 – – – – 28 45.2 6Picks ........................................... 40 20.2 33 16.7 2 1.0 8 4.0 3Shovels ...................................... 395 11.1 332 9.3 204 5.7 664 18.6 5Trowels ....................................... 38 29.9 9 7.1 10 7.9 16 12.6 7Digging handtools—
nonpowered, n.e.c. .................. 143 52.2 – – – – 34 12.4 6Gripping handtools—nonpowered ................................. 115 8.4 51 3.7 97 7.1 258 18.9 3Gripping handtools—
nonpowered, unspecified ......... 19 11.4 12 7.2 9 5.4 45 27.1 6Pliers, tongs ............................... 43 9.4 7 1.5 3 .7 71 15.6 3Vises, clamps ............................. 38 6.4 24 4.0 76 12.7 118 19.8 5Gripping handtools—
nonpowered, n.e.c. .................. 16 10.8 8 5.4 9 6.1 24 16.2 3Measuring handtools—nonpowered ................................. 33 4.6 38 5.2 56 7.7 50 6.9 3Calipers, micrometers ................ – – 7 13.5 – – – – 4Gauges ....................................... 23 17.7 7 5.4 11 8.5 20 15.4 5Rulers, tape measures ............... 2 1.5 6 4.5 – – 3 2.3 2Measuring handtools—
nonpowered, n.e.c. .................. 6 1.7 17 4.8 46 12.9 24 6.7 2Striking and nailing handtools—nonpowered ................................. 1,126 16.5 654 9.6 346 5.1 882 12.9 5Striking and nailing handtools—
nonpowered, unspecified ......... 14 3.7 51 13.6 30 8.0 48 12.8 5Hammers .................................... 798 22.1 382 10.6 255 7.1 459 12.7 6Mallets ........................................ 20 16.4 4 3.3 – – 17 13.9 2Punches, counterpunches,
countersinks ............................. 37 9.1 6 1.5 – – – – 2Sledges ...................................... 252 11.8 211 9.9 58 2.7 307 14.4 4Striking handtools—
nonpowered, n.e.c. .................. 4 2.0 – – 3 1.5 52 26.4 4Surfacing handtools—nonpowered ................................. 59 7.6 42 5.4 77 10.0 57 7.4 2
See footnotes at end of table.
Page 36

TABLE R69. Number and percent distribution of nonfatal occupational injuries and illnesses involving days away from work1 bysource of injury or illness and number of days away from work, 2000 — Continued
Source Sourcecode2
Privateindustry3
Percent of days-away-from-work cases involving —
1 day 2 days 3 - 5 days
Number Percent Number Percent Number Percent
Files ............................................ 7171 104 11 10.6 2 1.9 13 12.5Sanders ...................................... 7173 40 7 17.5 – – 7 17.5Surfacing handtools—nonpowered, n.e.c. .................. 7179 569 270 47.5 128 22.5 81 14.2
Turning handtools— nonpowered .. 718 4,102 789 19.2 672 16.4 633 15.4Turning handtools—nonpowered, unspecified ......... 7180 168 34 20.2 8 4.8 10 6.0
Screwdrivers .............................. 7181 667 146 21.9 193 28.9 100 15.0Wrenches ................................... 7182 3,193 601 18.8 468 14.7 486 15.2Turning handtools—nonpowered, n.e.c. .................. 7189 74 8 10.8 3 4.1 37 50.0
Other handtools— nonpowered ..... 719 5,135 835 16.3 723 14.1 1,016 19.8Other handtools— nonpowered,unspecified ............................... 7190 17 7 41.2 2 11.8 – –
Brooms, mops, and othercleaning tools ........................... 7191 1,623 200 12.3 158 9.7 450 27.7
Crowbars .................................... 7192 1,944 311 16.0 325 16.7 376 19.3Pitchforks, spading forks ............ 7193 64 – – 4 6.2 26 40.6Rakes ......................................... 7194 280 54 19.3 13 4.6 46 16.4Stapling tools— nonpowered ..... 7195 131 14 10.7 86 65.6 7 5.3Other handtools— nonpowered,n.e.c. ....................................... 7199 1,076 249 23.1 134 12.5 111 10.3
Handtools— powered ......................... 72 17,852 4,364 24.4 2,344 13.1 3,678 20.6Handtools— powered,unspecified ................................... 720 242 25 10.3 36 14.9 34 14.0
Boring handtools— powered .......... 721 3,456 628 18.2 527 15.2 801 23.2Boring handtools— powered,unspecified ............................... 7210 36 1 2.8 17 47.2 1 2.8
Augers— powered ..................... 7211 299 10 3.3 186 62.2 13 4.3Drills— powered ......................... 7213 2,558 498 19.5 201 7.9 712 27.8Routers and molders—powered ................................... 7214 456 74 16.2 105 23.0 64 14.0
Boring handtools— powered,n.e.c. ....................................... 7219 93 42 45.2 18 19.4 6 6.5
Cutting handtools— powered ......... 722 4,884 773 15.8 272 5.6 1,012 20.7Cutting handtools— powered,unspecified ............................... 7220 125 25 20.0 13 10.4 25 20.0
Chainsaws— powered ............... 7221 802 149 18.6 67 8.4 240 29.9Chisels— powered ..................... 7222 17 2 11.8 2 11.8 5 29.4Knives— powered ...................... 7223 82 34 41.5 – – 33 40.2Saws— powered, exceptchainsaws ................................ 7224 2,973 369 12.4 164 5.5 415 14.0
Cutting handtools— powered,n.e.c. ....................................... 7229 885 194 21.9 25 2.8 293 33.1
Striking and nailing handtools—powered ....................................... 723 1,862 139 7.5 309 16.6 503 27.0
Hammers— powered ................. 7231 346 13 3.8 36 10.4 196 56.6Jackhammers— powered .......... 7232 1,194 82 6.9 218 18.3 186 15.6Riveters— powered .................... 7234 227 28 12.3 21 9.3 111 48.9Striking and nailing handtools—powered, n.e.c. ........................ 7239 73 15 20.5 34 46.6 – –
Surfacing handtools— powered ..... 724 1,963 393 20.0 186 9.5 541 27.6Buffers, polishers, waxers—powered ................................... 7241 557 137 24.6 63 11.3 78 14.0
Hand grinders— powered .......... 7242 678 168 24.8 52 7.7 144 21.2Sanders— powered ................... 7243 426 72 16.9 46 10.8 118 27.7Sandblasters— powered ............ 7244 212 6 2.8 2 .9 189 89.2Surfacing handtools— powered,n.e.c. ....................................... 7249 69 – – 19 27.5 13 18.8
Turning handtools, powered ........... 725 812 190 23.4 101 12.4 185 22.8Turning handtools— powered,unspecified ............................... 7250 47 – – 10 21.3 26 55.3
See footnotes at end of table.
Page 37
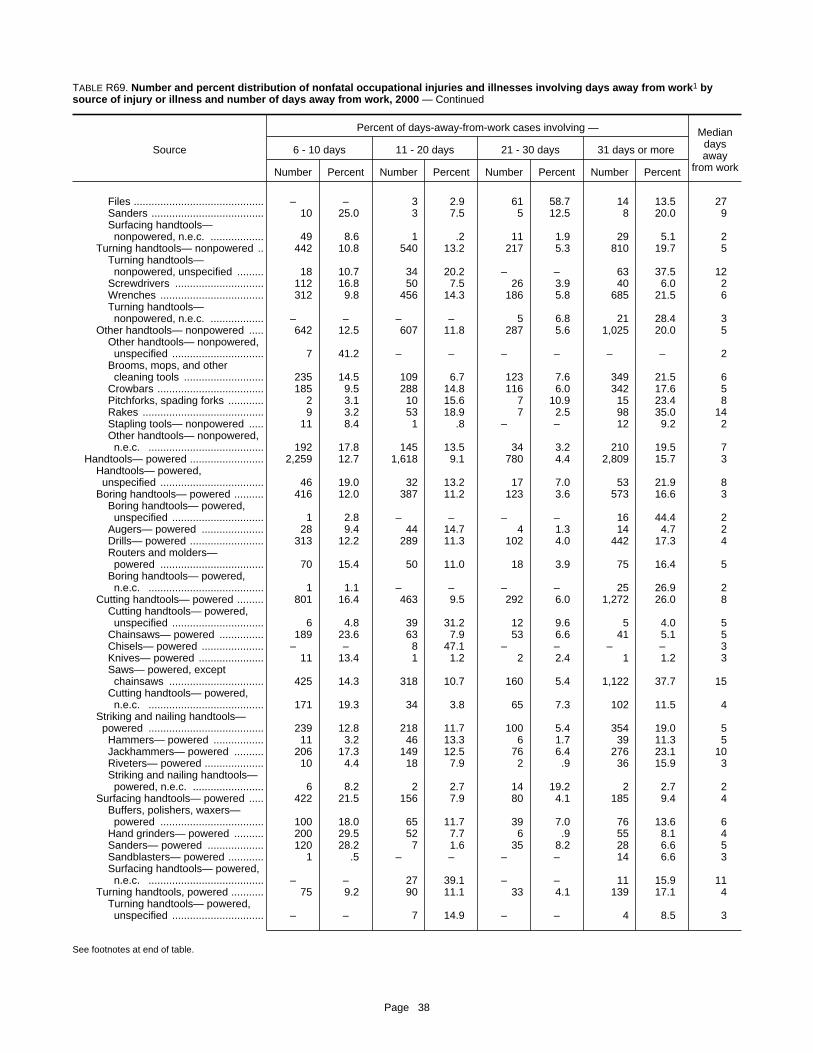
TABLE R69. Number and percent distribution of nonfatal occupational injuries and illnesses involving days away from work1 bysource of injury or illness and number of days away from work, 2000 — Continued
Source
Percent of days-away-from-work cases involving — Mediandaysaway
from work
6 - 10 days 11 - 20 days 21 - 30 days 31 days or more
Number Percent Number Percent Number Percent Number Percent
Files ............................................ – – 3 2.9 61 58.7 14 13.5 27Sanders ...................................... 10 25.0 3 7.5 5 12.5 8 20.0 9Surfacing handtools—
nonpowered, n.e.c. .................. 49 8.6 1 .2 11 1.9 29 5.1 2Turning handtools— nonpowered .. 442 10.8 540 13.2 217 5.3 810 19.7 5
Turning handtools—nonpowered, unspecified ......... 18 10.7 34 20.2 – – 63 37.5 12
Screwdrivers .............................. 112 16.8 50 7.5 26 3.9 40 6.0 2Wrenches ................................... 312 9.8 456 14.3 186 5.8 685 21.5 6Turning handtools—
nonpowered, n.e.c. .................. – – – – 5 6.8 21 28.4 3Other handtools— nonpowered ..... 642 12.5 607 11.8 287 5.6 1,025 20.0 5
Other handtools— nonpowered,unspecified ............................... 7 41.2 – – – – – – 2
Brooms, mops, and othercleaning tools ........................... 235 14.5 109 6.7 123 7.6 349 21.5 6
Crowbars .................................... 185 9.5 288 14.8 116 6.0 342 17.6 5Pitchforks, spading forks ............ 2 3.1 10 15.6 7 10.9 15 23.4 8Rakes ......................................... 9 3.2 53 18.9 7 2.5 98 35.0 14Stapling tools— nonpowered ..... 11 8.4 1 .8 – – 12 9.2 2Other handtools— nonpowered,
n.e.c. ....................................... 192 17.8 145 13.5 34 3.2 210 19.5 7Handtools— powered ......................... 2,259 12.7 1,618 9.1 780 4.4 2,809 15.7 3
Handtools— powered,unspecified ................................... 46 19.0 32 13.2 17 7.0 53 21.9 8
Boring handtools— powered .......... 416 12.0 387 11.2 123 3.6 573 16.6 3Boring handtools— powered,
unspecified ............................... 1 2.8 – – – – 16 44.4 2Augers— powered ..................... 28 9.4 44 14.7 4 1.3 14 4.7 2Drills— powered ......................... 313 12.2 289 11.3 102 4.0 442 17.3 4Routers and molders—
powered ................................... 70 15.4 50 11.0 18 3.9 75 16.4 5Boring handtools— powered,
n.e.c. ....................................... 1 1.1 – – – – 25 26.9 2Cutting handtools— powered ......... 801 16.4 463 9.5 292 6.0 1,272 26.0 8
Cutting handtools— powered,unspecified ............................... 6 4.8 39 31.2 12 9.6 5 4.0 5
Chainsaws— powered ............... 189 23.6 63 7.9 53 6.6 41 5.1 5Chisels— powered ..................... – – 8 47.1 – – – – 3Knives— powered ...................... 11 13.4 1 1.2 2 2.4 1 1.2 3Saws— powered, except
chainsaws ................................ 425 14.3 318 10.7 160 5.4 1,122 37.7 15Cutting handtools— powered,
n.e.c. ....................................... 171 19.3 34 3.8 65 7.3 102 11.5 4Striking and nailing handtools—powered ....................................... 239 12.8 218 11.7 100 5.4 354 19.0 5Hammers— powered ................. 11 3.2 46 13.3 6 1.7 39 11.3 5Jackhammers— powered .......... 206 17.3 149 12.5 76 6.4 276 23.1 10Riveters— powered .................... 10 4.4 18 7.9 2 .9 36 15.9 3Striking and nailing handtools—
powered, n.e.c. ........................ 6 8.2 2 2.7 14 19.2 2 2.7 2Surfacing handtools— powered ..... 422 21.5 156 7.9 80 4.1 185 9.4 4
Buffers, polishers, waxers—powered ................................... 100 18.0 65 11.7 39 7.0 76 13.6 6
Hand grinders— powered .......... 200 29.5 52 7.7 6 .9 55 8.1 4Sanders— powered ................... 120 28.2 7 1.6 35 8.2 28 6.6 5Sandblasters— powered ............ 1 .5 – – – – 14 6.6 3Surfacing handtools— powered,
n.e.c. ....................................... – – 27 39.1 – – 11 15.9 11Turning handtools, powered ........... 75 9.2 90 11.1 33 4.1 139 17.1 4
Turning handtools— powered,unspecified ............................... – – 7 14.9 – – 4 8.5 3
See footnotes at end of table.
Page 38
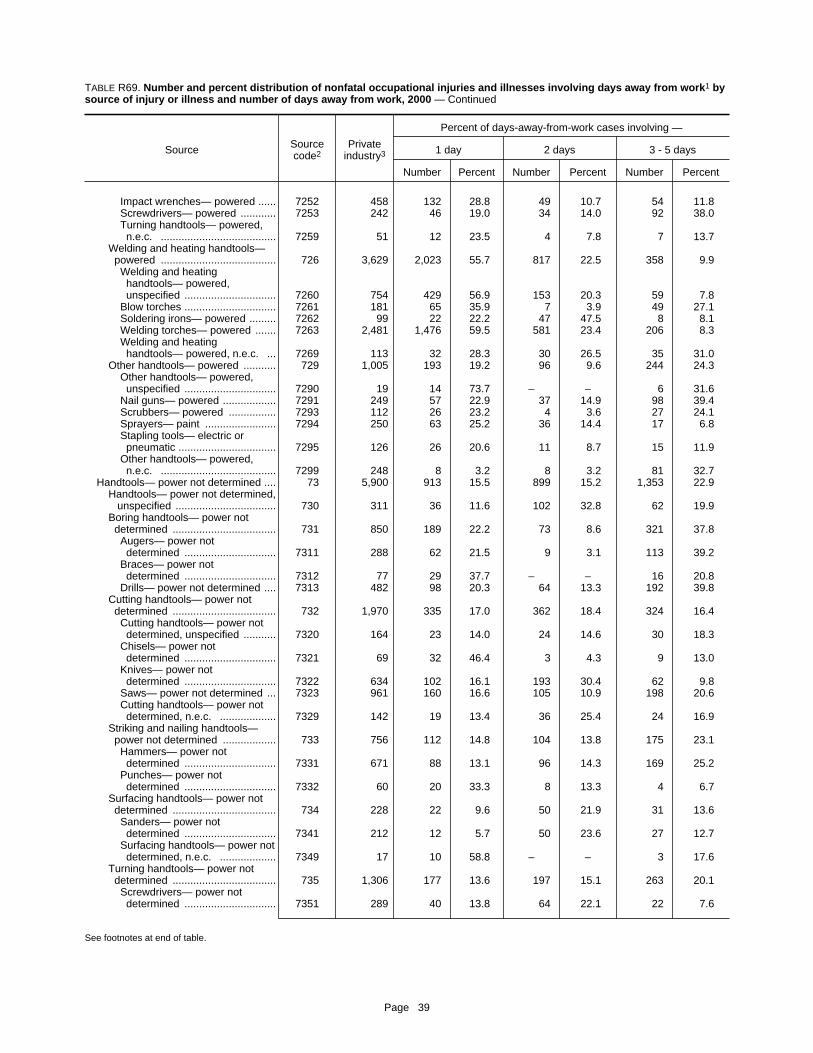
TABLE R69. Number and percent distribution of nonfatal occupational injuries and illnesses involving days away from work1 bysource of injury or illness and number of days away from work, 2000 — Continued
Source Sourcecode2
Privateindustry3
Percent of days-away-from-work cases involving —
1 day 2 days 3 - 5 days
Number Percent Number Percent Number Percent
Impact wrenches— powered ...... 7252 458 132 28.8 49 10.7 54 11.8Screwdrivers— powered ............ 7253 242 46 19.0 34 14.0 92 38.0Turning handtools— powered,n.e.c. ....................................... 7259 51 12 23.5 4 7.8 7 13.7
Welding and heating handtools—powered ....................................... 726 3,629 2,023 55.7 817 22.5 358 9.9
Welding and heatinghandtools— powered,unspecified ............................... 7260 754 429 56.9 153 20.3 59 7.8
Blow torches ............................... 7261 181 65 35.9 7 3.9 49 27.1Soldering irons— powered ......... 7262 99 22 22.2 47 47.5 8 8.1Welding torches— powered ....... 7263 2,481 1,476 59.5 581 23.4 206 8.3Welding and heatinghandtools— powered, n.e.c. ... 7269 113 32 28.3 30 26.5 35 31.0
Other handtools— powered ........... 729 1,005 193 19.2 96 9.6 244 24.3Other handtools— powered,unspecified ............................... 7290 19 14 73.7 – – 6 31.6
Nail guns— powered .................. 7291 249 57 22.9 37 14.9 98 39.4Scrubbers— powered ................ 7293 112 26 23.2 4 3.6 27 24.1Sprayers— paint ........................ 7294 250 63 25.2 36 14.4 17 6.8Stapling tools— electric orpneumatic ................................. 7295 126 26 20.6 11 8.7 15 11.9
Other handtools— powered,n.e.c. ....................................... 7299 248 8 3.2 8 3.2 81 32.7
Handtools— power not determined .... 73 5,900 913 15.5 899 15.2 1,353 22.9Handtools— power not determined, unspecified .................................. 730 311 36 11.6 102 32.8 62 19.9
Boring handtools— power notdetermined ................................... 731 850 189 22.2 73 8.6 321 37.8
Augers— power notdetermined ............................... 7311 288 62 21.5 9 3.1 113 39.2
Braces— power notdetermined ............................... 7312 77 29 37.7 – – 16 20.8
Drills— power not determined .... 7313 482 98 20.3 64 13.3 192 39.8Cutting handtools— power notdetermined ................................... 732 1,970 335 17.0 362 18.4 324 16.4
Cutting handtools— power notdetermined, unspecified ........... 7320 164 23 14.0 24 14.6 30 18.3
Chisels— power notdetermined ............................... 7321 69 32 46.4 3 4.3 9 13.0
Knives— power notdetermined ............................... 7322 634 102 16.1 193 30.4 62 9.8
Saws— power not determined ... 7323 961 160 16.6 105 10.9 198 20.6Cutting handtools— power notdetermined, n.e.c. ................... 7329 142 19 13.4 36 25.4 24 16.9
Striking and nailing handtools—power not determined .................. 733 756 112 14.8 104 13.8 175 23.1
Hammers— power notdetermined ............................... 7331 671 88 13.1 96 14.3 169 25.2
Punches— power notdetermined ............................... 7332 60 20 33.3 8 13.3 4 6.7
Surfacing handtools— power notdetermined ................................... 734 228 22 9.6 50 21.9 31 13.6
Sanders— power notdetermined ............................... 7341 212 12 5.7 50 23.6 27 12.7
Surfacing handtools— power notdetermined, n.e.c. ................... 7349 17 10 58.8 – – 3 17.6
Turning handtools— power notdetermined ................................... 735 1,306 177 13.6 197 15.1 263 20.1
Screwdrivers— power notdetermined ............................... 7351 289 40 13.8 64 22.1 22 7.6
See footnotes at end of table.
Page 39

TABLE R69. Number and percent distribution of nonfatal occupational injuries and illnesses involving days away from work1 bysource of injury or illness and number of days away from work, 2000 — Continued
Source
Percent of days-away-from-work cases involving — Mediandaysaway
from work
6 - 10 days 11 - 20 days 21 - 30 days 31 days or more
Number Percent Number Percent Number Percent Number Percent
Impact wrenches— powered ...... 38 8.3 71 15.5 32 7.0 83 18.1 5Screwdrivers— powered ............ 31 12.8 12 5.0 1 .4 24 9.9 3Turning handtools— powered,
n.e.c. ....................................... 1 2.0 – – – – 27 52.9 40Welding and heating handtools—powered ....................................... 156 4.3 79 2.2 63 1.7 131 3.6 1Welding and heating
handtools— powered,unspecified ............................... 28 3.7 16 2.1 42 5.6 28 3.7 1
Blow torches ............................... 18 9.9 13 7.2 11 6.1 18 9.9 4Soldering irons— powered ......... 15 15.2 1 1.0 – – 6 6.1 2Welding torches— powered ....... 90 3.6 42 1.7 11 .4 75 3.0 1Welding and heating
handtools— powered, n.e.c. ... 5 4.4 8 7.1 – – 4 3.5 2Other handtools— powered ........... 105 10.4 194 19.3 71 7.1 103 10.2 5
Other handtools— powered,unspecified ............................... – – – – – – – – 1
Nail guns— powered .................. 17 6.8 35 14.1 6 2.4 – – 4Scrubbers— powered ................ 18 16.1 4 3.6 10 8.9 23 20.5 5Sprayers— paint ........................ 2 .8 63 25.2 41 16.4 28 11.2 14Stapling tools— electric or
pneumatic ................................. 46 36.5 23 18.3 3 2.4 2 1.6 7Other handtools— powered,
n.e.c. ....................................... 22 8.9 69 27.8 11 4.4 50 20.2 12Handtools— power not determined .... 549 9.3 1,017 17.2 263 4.5 906 15.4 5
Handtools— power not determined, unspecified .................................. 11 3.5 56 18.0 9 2.9 35 11.3 3
Boring handtools— power notdetermined ................................... 80 9.4 70 8.2 38 4.5 79 9.3 5Augers— power not
determined ............................... 38 13.2 39 13.5 2 .7 24 8.3 5Braces— power not
determined ............................... – – 4 5.2 20 26.0 7 9.1 3Drills— power not determined .... 42 8.7 25 5.2 16 3.3 45 9.3 3
Cutting handtools— power notdetermined ................................... 178 9.0 415 21.1 108 5.5 248 12.6 5Cutting handtools— power not
determined, unspecified ........... 18 11.0 18 11.0 – – 51 31.1 10Chisels— power not
determined ............................... – – 22 31.9 – – 2 2.9 2Knives— power not
determined ............................... 32 5.0 229 36.1 1 .2 15 2.4 3Saws— power not determined ... 116 12.1 123 12.8 92 9.6 167 17.4 7Cutting handtools— power not
determined, n.e.c. ................... 14 9.9 22 15.5 15 10.6 13 9.2 3Striking and nailing handtools—power not determined .................. 92 12.2 161 21.3 34 4.5 77 10.2 5Hammers— power not
determined ............................... 81 12.1 152 22.7 18 2.7 66 9.8 5Punches— power not
determined ............................... 8 13.3 9 15.0 12 20.0 – – 3Surfacing handtools— power notdetermined ................................... 20 8.8 25 11.0 22 9.6 59 25.9 7Sanders— power not
determined ............................... 20 9.4 25 11.8 18 8.5 59 27.8 7Surfacing handtools— power not
determined, n.e.c. ................... – – – – 4 23.5 – – 1Turning handtools— power notdetermined ................................... 138 10.6 241 18.5 50 3.8 241 18.5 6Screwdrivers— power not
determined ............................... – – 31 10.7 23 8.0 109 37.7 20
See footnotes at end of table.
Page 40
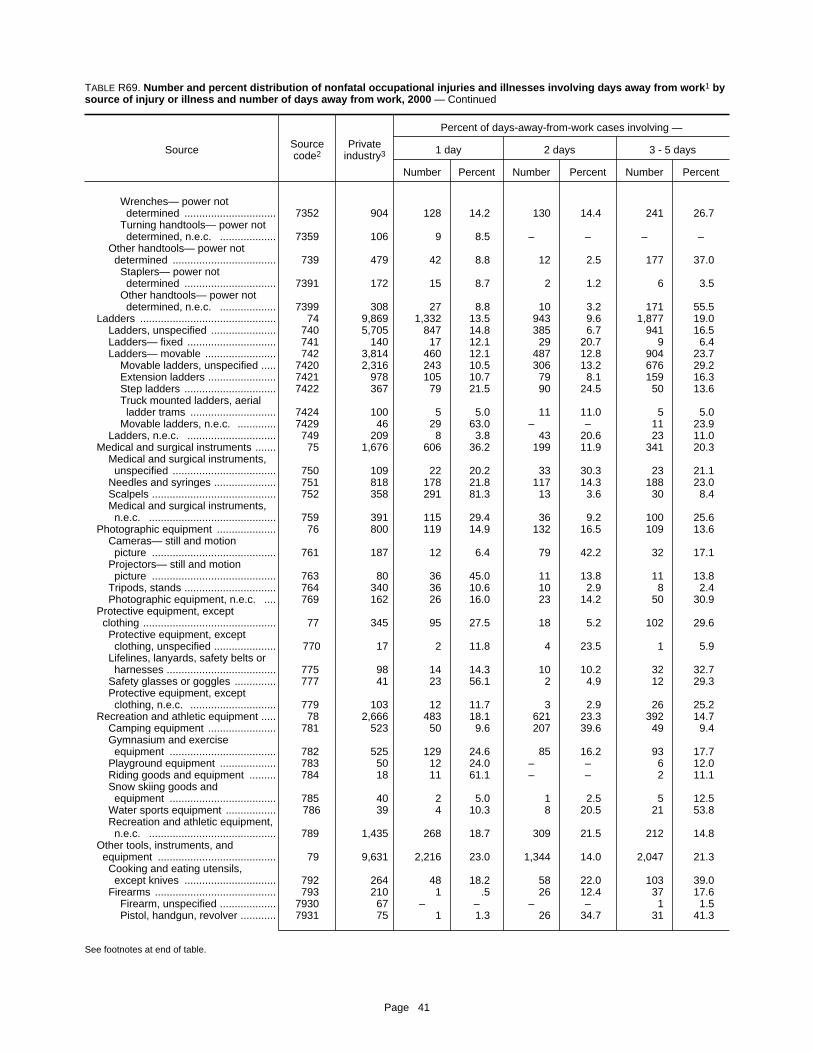
TABLE R69. Number and percent distribution of nonfatal occupational injuries and illnesses involving days away from work1 bysource of injury or illness and number of days away from work, 2000 — Continued
Source Sourcecode2
Privateindustry3
Percent of days-away-from-work cases involving —
1 day 2 days 3 - 5 days
Number Percent Number Percent Number Percent
Wrenches— power notdetermined ............................... 7352 904 128 14.2 130 14.4 241 26.7
Turning handtools— power notdetermined, n.e.c. ................... 7359 106 9 8.5 – – – –
Other handtools— power not determined ................................... 739 479 42 8.8 12 2.5 177 37.0
Staplers— power notdetermined ............................... 7391 172 15 8.7 2 1.2 6 3.5
Other handtools— power notdetermined, n.e.c. ................... 7399 308 27 8.8 10 3.2 171 55.5
Ladders .............................................. 74 9,869 1,332 13.5 943 9.6 1,877 19.0Ladders, unspecified ...................... 740 5,705 847 14.8 385 6.7 941 16.5Ladders— fixed .............................. 741 140 17 12.1 29 20.7 9 6.4Ladders— movable ........................ 742 3,814 460 12.1 487 12.8 904 23.7
Movable ladders, unspecified ..... 7420 2,316 243 10.5 306 13.2 676 29.2Extension ladders ....................... 7421 978 105 10.7 79 8.1 159 16.3Step ladders ............................... 7422 367 79 21.5 90 24.5 50 13.6Truck mounted ladders, aerialladder trams ............................. 7424 100 5 5.0 11 11.0 5 5.0
Movable ladders, n.e.c. ............. 7429 46 29 63.0 – – 11 23.9Ladders, n.e.c. .............................. 749 209 8 3.8 43 20.6 23 11.0
Medical and surgical instruments ....... 75 1,676 606 36.2 199 11.9 341 20.3Medical and surgical instruments,unspecified ................................... 750 109 22 20.2 33 30.3 23 21.1
Needles and syringes ..................... 751 818 178 21.8 117 14.3 188 23.0Scalpels .......................................... 752 358 291 81.3 13 3.6 30 8.4Medical and surgical instruments,n.e.c. ........................................... 759 391 115 29.4 36 9.2 100 25.6
Photographic equipment .................... 76 800 119 14.9 132 16.5 109 13.6Cameras— still and motionpicture .......................................... 761 187 12 6.4 79 42.2 32 17.1
Projectors— still and motionpicture .......................................... 763 80 36 45.0 11 13.8 11 13.8
Tripods, stands ............................... 764 340 36 10.6 10 2.9 8 2.4Photographic equipment, n.e.c. .... 769 162 26 16.0 23 14.2 50 30.9
Protective equipment, exceptclothing ............................................. 77 345 95 27.5 18 5.2 102 29.6
Protective equipment, exceptclothing, unspecified ..................... 770 17 2 11.8 4 23.5 1 5.9
Lifelines, lanyards, safety belts orharnesses ..................................... 775 98 14 14.3 10 10.2 32 32.7
Safety glasses or goggles .............. 777 41 23 56.1 2 4.9 12 29.3Protective equipment, exceptclothing, n.e.c. ............................. 779 103 12 11.7 3 2.9 26 25.2
Recreation and athletic equipment ..... 78 2,666 483 18.1 621 23.3 392 14.7Camping equipment ....................... 781 523 50 9.6 207 39.6 49 9.4Gymnasium and exerciseequipment .................................... 782 525 129 24.6 85 16.2 93 17.7
Playground equipment ................... 783 50 12 24.0 – – 6 12.0Riding goods and equipment ......... 784 18 11 61.1 – – 2 11.1Snow skiing goods andequipment .................................... 785 40 2 5.0 1 2.5 5 12.5
Water sports equipment ................. 786 39 4 10.3 8 20.5 21 53.8Recreation and athletic equipment,n.e.c. ........................................... 789 1,435 268 18.7 309 21.5 212 14.8
Other tools, instruments, andequipment ........................................ 79 9,631 2,216 23.0 1,344 14.0 2,047 21.3
Cooking and eating utensils,except knives ............................... 792 264 48 18.2 58 22.0 103 39.0
Firearms ......................................... 793 210 1 .5 26 12.4 37 17.6Firearm, unspecified ................... 7930 67 – – – – 1 1.5Pistol, handgun, revolver ............ 7931 75 1 1.3 26 34.7 31 41.3
See footnotes at end of table.
Page 41

TABLE R69. Number and percent distribution of nonfatal occupational injuries and illnesses involving days away from work1 bysource of injury or illness and number of days away from work, 2000 — Continued
Source
Percent of days-away-from-work cases involving — Mediandaysaway
from work
6 - 10 days 11 - 20 days 21 - 30 days 31 days or more
Number Percent Number Percent Number Percent Number Percent
Wrenches— power notdetermined ............................... 75 8.3 188 20.8 20 2.2 123 13.6 5
Turning handtools— power notdetermined, n.e.c. ................... 64 60.4 18 17.0 7 6.6 8 7.5 6
Other handtools— power not determined ................................... 30 6.3 49 10.2 2 .4 166 34.7 10Staplers— power not
determined ............................... 1 .6 6 3.5 – – 141 82.0 160Other handtools— power not
determined, n.e.c. ................... 29 9.4 43 14.0 2 .6 25 8.1 5Ladders .............................................. 953 9.7 1,320 13.4 749 7.6 2,695 27.3 9
Ladders, unspecified ...................... 612 10.7 893 15.7 503 8.8 1,525 26.7 12Ladders— fixed .............................. 17 12.1 1 .7 10 7.1 57 40.7 10Ladders— movable ........................ 286 7.5 403 10.6 232 6.1 1,042 27.3 6
Movable ladders, unspecified ..... 165 7.1 281 12.1 170 7.3 475 20.5 5Extension ladders ....................... 75 7.7 104 10.6 33 3.4 422 43.1 18Step ladders ............................... 38 10.4 18 4.9 26 7.1 67 18.3 3Truck mounted ladders, aerial
ladder trams ............................. – – – – 3 3.0 76 76.0 38Movable ladders, n.e.c. ............. 4 8.7 – – – – 2 4.3 1
Ladders, n.e.c. .............................. 37 17.7 23 11.0 3 1.4 71 34.0 9Medical and surgical instruments ....... 196 11.7 132 7.9 49 2.9 155 9.2 3
Medical and surgical instruments,unspecified ................................... 20 18.3 – – 3 2.8 8 7.3 2
Needles and syringes ..................... 125 15.3 62 7.6 40 4.9 107 13.1 4Scalpels .......................................... 17 4.7 4 1.1 – – 4 1.1 1Medical and surgical instruments,n.e.c. ........................................... 34 8.7 65 16.6 5 1.3 36 9.2 3
Photographic equipment .................... 61 7.6 44 5.5 262 32.8 73 9.1 9Cameras— still and motionpicture .......................................... 4 2.1 10 5.3 3 1.6 47 25.1 3
Projectors— still and motionpicture .......................................... 15 18.8 – – 6 7.5 – – 2
Tripods, stands ............................... 19 5.6 12 3.5 243 71.5 12 3.5 26Photographic equipment, n.e.c. .... 20 12.3 20 12.3 10 6.2 14 8.6 5
Protective equipment, exceptclothing ............................................. 39 11.3 45 13.0 – – 46 13.3 5
Protective equipment, exceptclothing, unspecified ..................... 2 11.8 1 5.9 – – 8 47.1 15
Lifelines, lanyards, safety belts orharnesses ..................................... 1 1.0 21 21.4 – – 22 22.4 5
Safety glasses or goggles .............. 1 2.4 2 4.9 – – 1 2.4 1Protective equipment, exceptclothing, n.e.c. ............................. 30 29.1 19 18.4 – – 13 12.6 6
Recreation and athletic equipment ..... 465 17.4 203 7.6 139 5.2 363 13.6 4Camping equipment ....................... 182 34.8 6 1.1 – – 29 5.5 3Gymnasium and exerciseequipment .................................... 34 6.5 78 14.9 11 2.1 94 17.9 4
Playground equipment ................... 10 20.0 3 6.0 1 2.0 17 34.0 6Riding goods and equipment ......... 4 22.2 – – – – – – 1Snow skiing goods andequipment .................................... 13 32.5 1 2.5 8 20.0 10 25.0 7
Water sports equipment ................. – – – – 6 15.4 – – 3Recreation and athletic equipment,n.e.c. ........................................... 219 15.3 102 7.1 112 7.8 214 14.9 4
Other tools, instruments, andequipment ........................................ 956 9.9 956 9.9 656 6.8 1,457 15.1 4
Cooking and eating utensils,except knives ............................... 9 3.4 14 5.3 31 11.7 1 .4 4
Firearms ......................................... 70 33.3 7 3.3 – – 69 32.9 6Firearm, unspecified ................... 66 98.5 – – – – – – 6Pistol, handgun, revolver ............ 3 4.0 7 9.3 – – 7 9.3 3
See footnotes at end of table.
Page 42

TABLE R69. Number and percent distribution of nonfatal occupational injuries and illnesses involving days away from work1 bysource of injury or illness and number of days away from work, 2000 — Continued
Source Sourcecode2
Privateindustry3
Percent of days-away-from-work cases involving —
1 day 2 days 3 - 5 days
Number Percent Number Percent Number Percent
Rifle ............................................ 7932 60 – – – – – –Health care and orthopedicequipment, n.e.c. ......................... 794 2,313 603 26.1 357 15.4 395 17.1
Musical instruments ....................... 795 185 68 36.8 9 4.9 12 6.5Pianos ........................................ 7951 121 38 31.4 9 7.4 10 8.3Other musical instruments ......... 7959 55 21 38.2 – – 2 3.6
Sewing notions, n.e.c. ................... 796 258 90 34.9 32 12.4 54 20.9Fabric pins, safety pins .............. 7961 80 18 22.5 8 10.0 15 18.8Sewing needles .......................... 7962 168 67 39.9 20 11.9 39 23.2
Wheelchairs ................................... 797 3,408 632 18.5 395 11.6 764 22.4Writing, drawing, and art supplies .. 798 439 108 24.6 46 10.5 244 55.6
Writing, drawing, and artsupplies, unspecified ................ 7980 19 12 63.2 – – 6 31.6
Art supplies and materials,except paint .............................. 7981 108 56 51.9 29 26.9 7 6.5
Chalk, crayons, markingdevices ..................................... 7982 183 6 3.3 1 .5 174 95.1
Pens and pencils ........................ 7983 72 1 1.4 11 15.3 51 70.8Writing, drawing, art supplies,n.e.c. ....................................... 7989 57 32 56.1 5 8.8 5 8.8
Tools, instruments, and equipment,n.e.c. ........................................... 799 2,528 665 26.3 421 16.7 412 16.3
Vehicles ................................................. 8 138,788 18,932 13.6 15,984 11.5 26,186 18.9Vehicle, unspecified ........................... 80 1,242 132 10.6 101 8.1 213 17.1Air vehicle ........................................... 81 2,850 309 10.8 204 7.2 552 19.4
Aircraft, unspecified ........................ 810 1,058 107 10.1 65 6.1 178 16.8Aircraft— powered fixed wing ........ 811 1,585 175 11.0 128 8.1 374 23.6
Aircraft— powered fixed wing,unspecified ............................... 8110 534 17 3.2 46 8.6 108 20.2
Jet .............................................. 8111 1,030 159 15.4 82 8.0 247 24.0Propeller-driven aircraft .............. 8112 17 – – – – 15 88.2
Aircraft— powered rotary wing ....... 812 199 27 13.6 11 5.5 – –Helicopter ................................... 8121 166 – – 5 3.0 – –
Highway vehicle, motorized ............... 82 80,812 10,296 12.7 8,885 11.0 14,842 18.4Highway vehicle, motorized,unspecified ................................... 820 12,811 1,516 11.8 1,567 12.2 2,642 20.6
Automobile ..................................... 821 23,227 3,740 16.1 2,703 11.6 4,670 20.1Bus ................................................. 822 3,084 406 13.2 150 4.9 600 19.5Motorcycle, moped ......................... 823 384 16 4.2 9 2.3 40 10.4Motor home, recreational vehicle ... 824 211 89 42.2 5 2.4 13 6.2Truck .............................................. 825 36,515 4,156 11.4 3,993 10.9 5,890 16.1
Truck, unspecified ...................... 8250 15,823 1,945 12.3 1,607 10.2 2,560 16.2Delivery truck ............................. 8251 3,431 351 10.2 342 10.0 598 17.4Dump truck ................................. 8252 921 49 5.3 48 5.2 96 10.4Pickup truck ................................ 8253 1,507 308 20.4 269 17.9 200 13.3Semitrailer, tractor trailer, trailertruck ......................................... 8254 11,743 1,227 10.4 1,336 11.4 1,830 15.6
Truck, n.e.c. .............................. 8259 3,089 276 8.9 391 12.7 605 19.6Van— passenger or light delivery .. 826 3,926 316 8.0 391 10.0 849 21.6Highway vehicle, motorized,n.e.c. ........................................... 829 654 58 8.9 68 10.4 139 21.3
Highway vehicle, nonmotorized ......... 83 455 77 16.9 54 11.9 192 42.2Animal or human poweredvehicle .......................................... 831 455 77 16.9 54 11.9 192 42.2
Horse drawn carriage ................. 8311 42 35 83.3 4 9.5 – –Bicycle ........................................ 8312 388 41 10.6 48 12.4 176 45.4
Offroad vehicle, nonindustrial ............. 84 1,070 88 8.2 166 15.5 276 25.8Offroad vehicle, nonindustrial,unspecified ................................... 840 40 6 15.0 – – – –
All terrain vehicle (ATV) ................. 841 135 7 5.2 4 3.0 64 47.4Golf cart, powered .......................... 842 639 58 9.1 135 21.1 120 18.8
See footnotes at end of table.
Page 43

TABLE R69. Number and percent distribution of nonfatal occupational injuries and illnesses involving days away from work1 bysource of injury or illness and number of days away from work, 2000 — Continued
Source
Percent of days-away-from-work cases involving — Mediandaysaway
from work
6 - 10 days 11 - 20 days 21 - 30 days 31 days or more
Number Percent Number Percent Number Percent Number Percent
Rifle ............................................ 1 1.7 – – – – 59 98.3 38Health care and orthopedicequipment, n.e.c. ......................... 282 12.2 217 9.4 116 5.0 343 14.8 3
Musical instruments ....................... 56 30.3 8 4.3 18 9.7 15 8.1 7Pianos ........................................ 51 42.1 2 1.7 7 5.8 5 4.1 7Other musical instruments ......... 5 9.1 6 10.9 12 21.8 9 16.4 10
Sewing notions, n.e.c. ................... 31 12.0 45 17.4 – – 6 2.3 3Fabric pins, safety pins .............. 9 11.2 24 30.0 – – 6 7.5 3Sewing needles .......................... 21 12.5 21 12.5 – – – – 2
Wheelchairs ................................... 184 5.4 430 12.6 366 10.7 637 18.7 5Writing, drawing, and art supplies .. 12 2.7 12 2.7 7 1.6 10 2.3 3
Writing, drawing, and artsupplies, unspecified ................ – – – – – – – – 1
Art supplies and materials,except paint .............................. 7 6.5 4 3.7 – – 4 3.7 1
Chalk, crayons, markingdevices ..................................... – – 1 .5 – – – – 3
Pens and pencils ........................ 2 2.8 3 4.2 3 4.2 – – 3Writing, drawing, art supplies,
n.e.c. ....................................... 3 5.3 3 5.3 3 5.3 6 10.5 1Tools, instruments, and equipment,n.e.c. ........................................... 312 12.3 224 8.9 116 4.6 378 15.0 4
Vehicles ................................................. 16,578 11.9 15,081 10.9 9,121 6.6 36,906 26.6 8Vehicle, unspecified ........................... 204 16.4 124 10.0 40 3.2 428 34.5 10Air vehicle ........................................... 460 16.1 610 21.4 123 4.3 592 20.8 9
Aircraft, unspecified ........................ 143 13.5 252 23.8 51 4.8 263 24.9 11Aircraft— powered fixed wing ........ 227 14.3 294 18.5 59 3.7 328 20.7 8
Aircraft— powered fixed wing,unspecified ............................... 85 15.9 74 13.9 22 4.1 182 34.1 13
Jet .............................................. 141 13.7 220 21.4 37 3.6 144 14.0 6Propeller-driven aircraft .............. 1 5.9 – – – – 1 5.9 5
Aircraft— powered rotary wing ....... 84 42.2 64 32.2 12 6.0 1 .5 7Helicopter ................................... 84 50.6 64 38.6 12 7.2 1 .6 9
Highway vehicle, motorized ............... 9,369 11.6 8,541 10.6 5,600 6.9 23,279 28.8 9Highway vehicle, motorized,unspecified ................................... 1,661 13.0 1,101 8.6 712 5.6 3,611 28.2 8
Automobile ..................................... 2,321 10.0 2,574 11.1 1,044 4.5 6,176 26.6 7Bus ................................................. 524 17.0 396 12.8 261 8.5 746 24.2 8Motorcycle, moped ......................... 115 29.9 25 6.5 6 1.6 174 45.3 15Motor home, recreational vehicle ... 44 20.9 15 7.1 – – 46 21.8 3Truck .............................................. 3,861 10.6 3,917 10.7 3,269 9.0 11,430 31.3 12
Truck, unspecified ...................... 1,608 10.2 1,490 9.4 1,557 9.8 5,056 32.0 12Delivery truck ............................. 420 12.2 367 10.7 205 6.0 1,147 33.4 11Dump truck ................................. 82 8.9 152 16.5 81 8.8 412 44.7 21Pickup truck ................................ 136 9.0 128 8.5 69 4.6 398 26.4 5Semitrailer, tractor trailer, trailer
truck ......................................... 1,305 11.1 1,329 11.3 1,119 9.5 3,597 30.6 12Truck, n.e.c. .............................. 309 10.0 450 14.6 238 7.7 819 26.5 10
Van— passenger or light delivery .. 740 18.8 451 11.5 265 6.7 913 23.3 10Highway vehicle, motorized,n.e.c. ........................................... 102 15.6 63 9.6 42 6.4 183 28.0 9
Highway vehicle, nonmotorized ......... 38 8.4 34 7.5 22 4.8 39 8.6 4Animal or human poweredvehicle .......................................... 38 8.4 34 7.5 22 4.8 39 8.6 4Horse drawn carriage ................. 3 7.1 – – – – – – 1Bicycle ........................................ 33 8.5 34 8.8 22 5.7 35 9.0 4
Offroad vehicle, nonindustrial ............. 178 16.6 151 14.1 60 5.6 151 14.1 6Offroad vehicle, nonindustrial,unspecified ................................... 34 85.0 – – – – – – 6
All terrain vehicle (ATV) ................. 17 12.6 3 2.2 7 5.2 33 24.4 5Golf cart, powered .......................... 73 11.4 125 19.6 53 8.3 75 11.7 7
See footnotes at end of table.
Page 44

TABLE R69. Number and percent distribution of nonfatal occupational injuries and illnesses involving days away from work1 bysource of injury or illness and number of days away from work, 2000 — Continued
Source Sourcecode2
Privateindustry3
Percent of days-away-from-work cases involving —
1 day 2 days 3 - 5 days
Number Percent Number Percent Number Percent
Snowmobile .................................... 843 73 – – 18 24.7 11 15.1Offroad vehicle, nonindustrial,n.e.c. ........................................... 849 182 17 9.3 9 4.9 81 44.5
Plant and industrial powered vehicles,tractors ............................................. 85 21,419 3,507 16.4 2,637 12.3 3,737 17.4
Plant and industrial poweredvehicles, unspecified .................... 850 356 94 26.4 37 10.4 82 23.0
Forklift ............................................ 851 17,757 2,985 16.8 2,309 13.0 2,929 16.5Forklift, unspecified .................... 8510 11,878 1,992 16.8 1,536 12.9 1,764 14.9Counterbalance rider— high lift .. 8511 36 – – 9 25.0 – –Hand/rider forklift truck—motorized ................................. 8512 1,092 190 17.4 235 21.5 167 15.3
Order picker high lift truck .......... 8513 87 13 14.9 2 2.3 25 28.7Pallet lift truck— motorized ........ 8514 2,754 646 23.5 284 10.3 713 25.9Platform lift truck— high or lowlift .............................................. 8515 306 22 7.2 34 11.1 47 15.4
Reach rider lift truck ................... 8516 106 – – – – – –Forklift, n.e.c. ............................. 8519 1,476 123 8.3 200 13.6 205 13.9
Powered industrial carrier, exceptforklifts .......................................... 852 1,075 250 23.3 83 7.7 233 21.7
Powered industrial carrier,except forklifts, unspecified ...... 8520 443 142 32.1 22 5.0 41 9.3
Container carrier ........................ 8521 125 60 48.0 – – 49 39.2Stacker carrier ............................ 8523 74 16 21.6 3 4.1 6 8.1Powered industrial carrier,except forklifts, n.e.c. .............. 8529 416 32 7.7 57 13.7 136 32.7
Tractor ............................................ 853 1,139 96 8.4 42 3.7 246 21.6Plant and industrial poweredvehicle, n.e.c. .............................. 859 1,092 83 7.6 165 15.1 248 22.7
Plant and industrial vehicle—nonpowered ..................................... 86 28,584 4,312 15.1 3,714 13.0 6,013 21.0
Plant and industrial vehicle— nonpowered, unspecified ............. 860 56 12 21.4 3 5.4 10 17.9
Cart, dolly, handtruck ..................... 861 26,880 3,933 14.6 3,575 13.3 5,709 21.2Wheelbarrow .................................. 862 1,055 224 21.2 71 6.7 218 20.7Plant and industrial vehicle—nonpowered, n.e.c. ...................... 869 593 143 24.1 65 11.0 75 12.6
Rail vehicle ......................................... 87 953 77 8.1 77 8.1 83 8.7Rail vehicle, unspecified ................. 870 142 22 15.5 19 13.4 22 15.5Amusement park rail vehicle .......... 871 53 5 9.4 5 9.4 9 17.0Train ............................................... 874 448 19 4.2 26 5.8 33 7.4Rail vehicle, n.e.c. ......................... 879 280 26 9.3 18 6.4 20 7.1
Water vehicle ..................................... 88 1,166 123 10.5 130 11.1 237 20.3Water vehicle, unspecified ............. 880 146 47 32.2 4 2.7 27 18.5Barge .............................................. 881 184 – – 4 2.2 32 17.4Canoe, kayak, rowboat, raft ........... 882 180 23 12.8 8 4.4 115 63.9Motorboat, yachts ........................... 884 324 16 4.9 26 8.0 14 4.3Ships— other than sail powered .... 886 183 7 3.8 45 24.6 45 24.6Tugboat, commercial fishing boat .. 887 56 6 10.7 18 32.1 4 7.1
Vehicles, n.e.c. .................................. 89 238 13 5.5 15 6.3 42 17.6
Other sources ....................................... 9 67,243 21,831 32.5 12,669 18.8 13,881 20.6Ammunition ........................................ 91 336 3 .9 17 5.1 23 6.8
Bullets ............................................ 911 281 1 .4 – – 13 4.6Apparel and textiles ............................ 92 4,137 724 17.5 475 11.5 854 20.6
Clothing and shoes ........................ 921 2,409 386 16.0 223 9.3 480 19.9Clothing, unspecified .................. 9210 458 134 29.3 23 5.0 78 17.0Belts, gloves, neckties,scarves ..................................... 9211 615 69 11.2 113 18.4 183 29.8
Blouses, shirts, dresses,trousers, skirts .......................... 9212 286 58 20.3 12 4.2 27 9.4
Hats, caps .................................. 9213 114 18 15.8 3 2.6 20 17.5
See footnotes at end of table.
Page 45

TABLE R69. Number and percent distribution of nonfatal occupational injuries and illnesses involving days away from work1 bysource of injury or illness and number of days away from work, 2000 — Continued
Source
Percent of days-away-from-work cases involving — Mediandaysaway
from work
6 - 10 days 11 - 20 days 21 - 30 days 31 days or more
Number Percent Number Percent Number Percent Number Percent
Snowmobile .................................... 10 13.7 1 1.4 – – 32 43.8 10Offroad vehicle, nonindustrial,n.e.c. ........................................... 44 24.2 21 11.5 – – 11 6.0 4
Plant and industrial powered vehicles,tractors ............................................. 2,217 10.4 2,105 9.8 1,349 6.3 5,868 27.4 7
Plant and industrial poweredvehicles, unspecified .................... 43 12.1 26 7.3 24 6.7 51 14.3 4
Forklift ............................................ 1,863 10.5 1,752 9.9 1,064 6.0 4,854 27.3 7Forklift, unspecified .................... 1,330 11.2 1,203 10.1 852 7.2 3,200 26.9 8Counterbalance rider— high lift .. 1 2.8 – – – – 26 72.2 35Hand/rider forklift truck—
motorized ................................. 155 14.2 88 8.1 37 3.4 220 20.1 3Order picker high lift truck .......... 3 3.4 1 1.1 12 13.8 30 34.5 6Pallet lift truck— motorized ........ 231 8.4 266 9.7 99 3.6 515 18.7 5Platform lift truck— high or low
lift .............................................. 54 17.6 26 8.5 13 4.2 111 36.3 10Reach rider lift truck ................... 9 8.5 9 8.5 2 1.9 86 81.1 72Forklift, n.e.c. ............................. 80 5.4 154 10.4 50 3.4 665 45.1 20
Powered industrial carrier, exceptforklifts .......................................... 125 11.6 74 6.9 92 8.6 217 20.2 5Powered industrial carrier,
except forklifts, unspecified ...... 62 14.0 10 2.3 33 7.4 133 30.0 6Container carrier ........................ 3 2.4 9 7.2 – – 4 3.2 3Stacker carrier ............................ 25 33.8 7 9.5 – – 17 23.0 8Powered industrial carrier,
except forklifts, n.e.c. .............. 35 8.4 48 11.5 59 14.2 49 11.8 4Tractor ............................................ 87 7.6 136 11.9 95 8.3 438 38.5 15Plant and industrial poweredvehicle, n.e.c. .............................. 99 9.1 116 10.6 74 6.8 307 28.1 7
Plant and industrial vehicle—nonpowered ..................................... 3,882 13.6 3,331 11.7 1,639 5.7 5,693 19.9 6
Plant and industrial vehicle— nonpowered, unspecified ............. 9 16.1 8 14.3 1 1.8 13 23.2 9
Cart, dolly, handtruck ..................... 3,649 13.6 3,198 11.9 1,433 5.3 5,385 20.0 6Wheelbarrow .................................. 126 11.9 76 7.2 120 11.4 220 20.9 6Plant and industrial vehicle—nonpowered, n.e.c. ...................... 99 16.7 50 8.4 85 14.3 75 12.6 6
Rail vehicle ......................................... 174 18.3 97 10.2 59 6.2 386 40.5 15Rail vehicle, unspecified ................. 19 13.4 7 4.9 2 1.4 50 35.2 6Amusement park rail vehicle .......... 23 43.4 4 7.5 – – 6 11.3 10Train ............................................... 90 20.1 59 13.2 19 4.2 202 45.1 20Rail vehicle, n.e.c. ......................... 32 11.4 26 9.3 31 11.1 127 45.4 27
Water vehicle ..................................... 38 3.3 67 5.7 209 17.9 362 31.0 19Water vehicle, unspecified ............. 10 6.8 24 16.4 11 7.5 23 15.8 5Barge .............................................. 3 1.6 4 2.2 20 10.9 121 65.8 91Canoe, kayak, rowboat, raft ........... 2 1.1 – – 12 6.7 19 10.6 5Motorboat, yachts ........................... 1 .3 11 3.4 128 39.5 127 39.2 29Ships— other than sail powered .... 9 4.9 21 11.5 7 3.8 49 26.8 5Tugboat, commercial fishing boat .. 9 16.1 – – 5 8.9 13 23.2 10
Vehicles, n.e.c. .................................. 19 8.0 22 9.2 20 8.4 107 45.0 21
Other sources ....................................... 6,789 10.1 5,157 7.7 1,998 3.0 4,917 7.3 -4Ammunition ........................................ 4 1.2 18 5.4 194 57.7 77 22.9 21
Bullets ............................................ – – 1 .4 194 69.0 72 25.6 30Apparel and textiles ............................ 557 13.5 718 17.4 153 3.7 657 15.9 6
Clothing and shoes ........................ 359 14.9 549 22.8 71 2.9 341 14.2 6Clothing, unspecified .................. 75 16.4 47 10.3 5 1.1 95 20.7 5Belts, gloves, neckties,
scarves ..................................... 113 18.4 41 6.7 16 2.6 80 13.0 4Blouses, shirts, dresses,
trousers, skirts .......................... 65 22.7 37 12.9 29 10.1 59 20.6 8Hats, caps .................................. 33 28.9 35 30.7 – – 5 4.4 7
See footnotes at end of table.
Page 46

TABLE R69. Number and percent distribution of nonfatal occupational injuries and illnesses involving days away from work1 bysource of injury or illness and number of days away from work, 2000 — Continued
Source Sourcecode2
Privateindustry3
Percent of days-away-from-work cases involving —
1 day 2 days 3 - 5 days
Number Percent Number Percent Number Percent
Shoes, boots, slippers,sandals ..................................... 9214 267 60 22.5 7 2.6 54 20.2
Suits, coats, jackets ................... 9215 77 8 10.4 14 18.2 16 20.8Clothing, n.e.c. .......................... 9219 592 40 6.8 51 8.6 102 17.2
Eye glasses, jewelry, andwatches ........................................ 922 70 6 8.6 16 22.9 5 7.1
Jewelry ....................................... 9222 51 1 2.0 10 19.6 1 2.0Textile products .............................. 923 626 101 16.1 64 10.2 166 26.5
Textile products, unspecified ...... 9230 103 5 4.9 12 11.7 32 31.1Fabric ......................................... 9231 361 55 15.2 33 9.1 65 18.0Yarn, thread ............................... 9232 80 39 48.8 10 12.5 20 25.0Textile products, n.e.c. .............. 9239 82 3 3.7 10 12.2 48 58.5
Laundry .......................................... 924 796 178 22.4 142 17.8 147 18.5Apparel and textiles, n.e.c. ............ 929 216 46 21.3 26 12.0 51 23.6
Atmospheric and environmentalconditions ......................................... 93 7,462 1,960 26.3 1,434 19.2 1,784 23.9
Atmospheric and environmentalconditions, unspecified ................. 930 43 16 37.2 17 39.5 7 16.3
Air pressure .................................... 931 852 119 14.0 114 13.4 303 35.6Air pressure, unspecified ............ 9310 204 4 2.0 6 2.9 84 41.2High pressure ............................. 9311 42 1 2.4 10 23.8 26 61.9Low pressure .............................. 9312 606 114 18.8 97 16.0 194 32.0
Fire, flame, smoke .......................... 934 3,056 745 24.4 503 16.5 551 18.0Fire, flame, smoke,unspecified ............................... 9340 452 76 16.8 19 4.2 100 22.1
Fire, flame .................................. 9341 1,971 303 15.4 427 21.7 313 15.9Smoke, fire gases ...................... 9342 633 367 58.0 57 9.0 139 22.0
Temperature extremes—environmental ............................... 936 2,786 852 30.6 718 25.8 811 29.1
Cold— environmental ................. 9361 215 23 10.7 109 50.7 57 26.5Heat— environmental ................ 9362 2,559 828 32.4 608 23.8 745 29.1
Weather and atmosphericconditions ..................................... 937 343 53 15.5 42 12.2 58 16.9
Ice, sleet, snow .......................... 9373 198 41 20.7 27 13.6 28 14.1Lightning ..................................... 9374 144 12 8.3 14 9.7 31 21.5
Other environmental conditions ..... 939 381 175 45.9 40 10.5 54 14.2Noise .......................................... 9391 192 43 22.4 36 18.8 26 13.5Environmental conditions,n.e.c. ....................................... 9399 158 116 73.4 5 3.2 15 9.5
Paper, books, magazines ................... 94 3,152 682 21.6 554 17.6 618 19.6Paper, books, magazines,unspecified ................................... 940 441 102 23.1 58 13.2 51 11.6
Books, notebooks, magazines,catalogues .................................... 941 711 147 20.7 99 13.9 134 18.8
Paper, sheets ................................. 942 1,199 246 20.5 235 19.6 276 23.0Paper, books, magazines, n.e.c. ... 949 801 186 23.2 162 20.2 157 19.6
Scrap, waste, debris ........................... 95 37,416 15,984 42.7 7,894 21.1 7,268 19.4Scrap, waste, debris, unspecified .. 950 3,036 1,472 48.5 661 21.8 529 17.4Chips, particles, splinters ............... 951 30,522 13,526 44.3 6,745 22.1 5,920 19.4
Chips, particles, splinters,unspecified ............................... 9510 7,551 4,121 54.6 1,565 20.7 1,238 16.4
Dirt particles ............................... 9511 2,901 1,401 48.3 660 22.8 544 18.8Glass chips or fibers ................... 9512 2,493 602 24.1 374 15.0 627 25.2Metal chips, particles .................. 9513 12,474 5,245 42.0 2,990 24.0 2,657 21.3Wood chips, sawdust ................. 9514 2,500 1,055 42.2 545 21.8 363 14.5Chips, particles, splinters,n.e.c. ....................................... 9519 2,603 1,102 42.3 611 23.5 491 18.9
Sewage .......................................... 952 43 17 39.5 10 23.3 15 34.9Trash, garbage ............................... 953 1,279 183 14.3 136 10.6 295 23.1Scrap, waste, debris, n.e.c. ........... 959 2,537 785 30.9 342 13.5 509 20.1
Steam, vapors, liquids, n.e.c. ............ 96 6,858 1,083 15.8 998 14.6 1,612 23.5Steam, vapors— nonchemical ....... 961 1,631 148 9.1 311 19.1 368 22.6
See footnotes at end of table.
Page 47
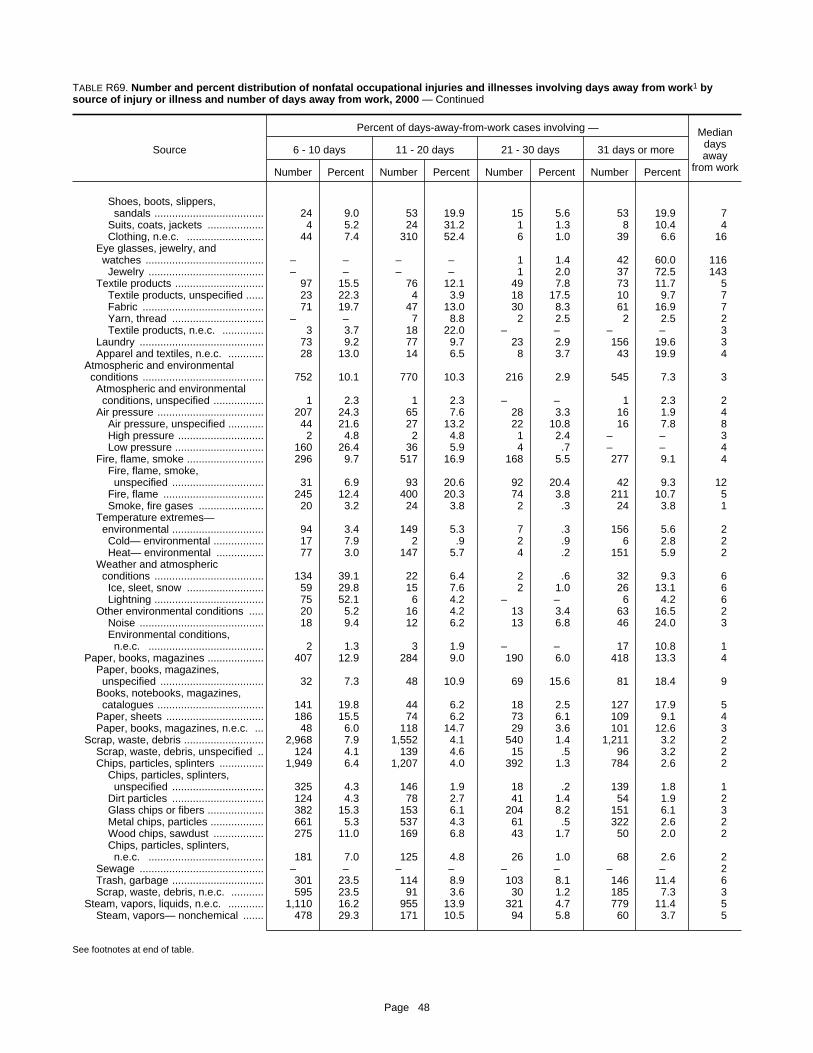
TABLE R69. Number and percent distribution of nonfatal occupational injuries and illnesses involving days away from work1 bysource of injury or illness and number of days away from work, 2000 — Continued
Source
Percent of days-away-from-work cases involving — Mediandaysaway
from work
6 - 10 days 11 - 20 days 21 - 30 days 31 days or more
Number Percent Number Percent Number Percent Number Percent
Shoes, boots, slippers,sandals ..................................... 24 9.0 53 19.9 15 5.6 53 19.9 7
Suits, coats, jackets ................... 4 5.2 24 31.2 1 1.3 8 10.4 4Clothing, n.e.c. .......................... 44 7.4 310 52.4 6 1.0 39 6.6 16
Eye glasses, jewelry, andwatches ........................................ – – – – 1 1.4 42 60.0 116Jewelry ....................................... – – – – 1 2.0 37 72.5 143
Textile products .............................. 97 15.5 76 12.1 49 7.8 73 11.7 5Textile products, unspecified ...... 23 22.3 4 3.9 18 17.5 10 9.7 7Fabric ......................................... 71 19.7 47 13.0 30 8.3 61 16.9 7Yarn, thread ............................... – – 7 8.8 2 2.5 2 2.5 2Textile products, n.e.c. .............. 3 3.7 18 22.0 – – – – 3
Laundry .......................................... 73 9.2 77 9.7 23 2.9 156 19.6 3Apparel and textiles, n.e.c. ............ 28 13.0 14 6.5 8 3.7 43 19.9 4
Atmospheric and environmentalconditions ......................................... 752 10.1 770 10.3 216 2.9 545 7.3 3
Atmospheric and environmentalconditions, unspecified ................. 1 2.3 1 2.3 – – 1 2.3 2
Air pressure .................................... 207 24.3 65 7.6 28 3.3 16 1.9 4Air pressure, unspecified ............ 44 21.6 27 13.2 22 10.8 16 7.8 8High pressure ............................. 2 4.8 2 4.8 1 2.4 – – 3Low pressure .............................. 160 26.4 36 5.9 4 .7 – – 4
Fire, flame, smoke .......................... 296 9.7 517 16.9 168 5.5 277 9.1 4Fire, flame, smoke,
unspecified ............................... 31 6.9 93 20.6 92 20.4 42 9.3 12Fire, flame .................................. 245 12.4 400 20.3 74 3.8 211 10.7 5Smoke, fire gases ...................... 20 3.2 24 3.8 2 .3 24 3.8 1
Temperature extremes—environmental ............................... 94 3.4 149 5.3 7 .3 156 5.6 2Cold— environmental ................. 17 7.9 2 .9 2 .9 6 2.8 2Heat— environmental ................ 77 3.0 147 5.7 4 .2 151 5.9 2
Weather and atmosphericconditions ..................................... 134 39.1 22 6.4 2 .6 32 9.3 6Ice, sleet, snow .......................... 59 29.8 15 7.6 2 1.0 26 13.1 6Lightning ..................................... 75 52.1 6 4.2 – – 6 4.2 6
Other environmental conditions ..... 20 5.2 16 4.2 13 3.4 63 16.5 2Noise .......................................... 18 9.4 12 6.2 13 6.8 46 24.0 3Environmental conditions,
n.e.c. ....................................... 2 1.3 3 1.9 – – 17 10.8 1Paper, books, magazines ................... 407 12.9 284 9.0 190 6.0 418 13.3 4
Paper, books, magazines,unspecified ................................... 32 7.3 48 10.9 69 15.6 81 18.4 9
Books, notebooks, magazines,catalogues .................................... 141 19.8 44 6.2 18 2.5 127 17.9 5
Paper, sheets ................................. 186 15.5 74 6.2 73 6.1 109 9.1 4Paper, books, magazines, n.e.c. ... 48 6.0 118 14.7 29 3.6 101 12.6 3
Scrap, waste, debris ........................... 2,968 7.9 1,552 4.1 540 1.4 1,211 3.2 2Scrap, waste, debris, unspecified .. 124 4.1 139 4.6 15 .5 96 3.2 2Chips, particles, splinters ............... 1,949 6.4 1,207 4.0 392 1.3 784 2.6 2
Chips, particles, splinters,unspecified ............................... 325 4.3 146 1.9 18 .2 139 1.8 1
Dirt particles ............................... 124 4.3 78 2.7 41 1.4 54 1.9 2Glass chips or fibers ................... 382 15.3 153 6.1 204 8.2 151 6.1 3Metal chips, particles .................. 661 5.3 537 4.3 61 .5 322 2.6 2Wood chips, sawdust ................. 275 11.0 169 6.8 43 1.7 50 2.0 2Chips, particles, splinters,
n.e.c. ....................................... 181 7.0 125 4.8 26 1.0 68 2.6 2Sewage .......................................... – – – – – – – – 2Trash, garbage ............................... 301 23.5 114 8.9 103 8.1 146 11.4 6Scrap, waste, debris, n.e.c. ........... 595 23.5 91 3.6 30 1.2 185 7.3 3
Steam, vapors, liquids, n.e.c. ............ 1,110 16.2 955 13.9 321 4.7 779 11.4 5Steam, vapors— nonchemical ....... 478 29.3 171 10.5 94 5.8 60 3.7 5
See footnotes at end of table.
Page 48

TABLE R69. Number and percent distribution of nonfatal occupational injuries and illnesses involving days away from work1 bysource of injury or illness and number of days away from work, 2000 — Continued
Source Sourcecode2
Privateindustry3
Percent of days-away-from-work cases involving —
1 day 2 days 3 - 5 days
Number Percent Number Percent Number Percent
Liquids ............................................ 962 5,228 935 17.9 687 13.1 1,244 23.8Liquids, unspecified .................... 9620 240 20 8.3 110 45.8 26 10.8Water .......................................... 9621 3,823 538 14.1 523 13.7 995 26.0Liquids, n.e.c. ............................ 9629 1,165 377 32.4 53 4.5 222 19.1
Other sources, n.e.c. ......................... 98 7,882 1,395 17.7 1,297 16.5 1,723 21.9
Nonclassifiable ..................................... 9999 29,603 4,072 13.8 3,457 11.7 5,928 20.0
See footnotes at end of table.
Page 49

TABLE R69. Number and percent distribution of nonfatal occupational injuries and illnesses involving days away from work1 bysource of injury or illness and number of days away from work, 2000 — Continued
Source
Percent of days-away-from-work cases involving — Mediandaysaway
from work
6 - 10 days 11 - 20 days 21 - 30 days 31 days or more
Number Percent Number Percent Number Percent Number Percent
Liquids ............................................ 632 12.1 784 15.0 226 4.3 719 13.8 5Liquids, unspecified .................... 44 18.3 16 6.7 2 .8 22 9.2 2Water .......................................... 526 13.8 455 11.9 147 3.8 638 16.7 5Liquids, n.e.c. ............................ 62 5.3 313 26.9 77 6.6 60 5.2 5
Other sources, n.e.c. ......................... 989 12.5 860 10.9 385 4.9 1,231 15.6 5
Nonclassifiable ..................................... 3,446 11.6 4,397 14.9 1,986 6.7 6,317 21.3 7
1 Days-away-from-work cases include those which result in days awayfrom work with or without restricted work activity.
2 Based on the 1992 Occupational Injury and Illness Classification Systemdeveloped by the Bureau of Labor Statistics.
3 Excludes farms with fewer than 11 employees.
NOTE: Dashes indicate data that are not available. Because of rounding,data may not sum to totals. n.e.c. = not elsewhere classified.
SOURCE: Bureau of Labor Statistics, U.S. Department of Labor
Page 50