OROMIA REGIONAL GOVERNMENT - cmpethiopia.org 2007 EF… · OROMIA REGIONAL GOVERNMENT ... Number of...
28
OROMIA REGIONAL GOVERNMENT COMMUNITY-LED ACCELERATED WASH (COWASH) PROJECT Consolidated Regional Performance Report (Quarter III of EFY 2007) Finfinne May 2015
Transcript of OROMIA REGIONAL GOVERNMENT - cmpethiopia.org 2007 EF… · OROMIA REGIONAL GOVERNMENT ... Number of...

OROMIA REGIONAL GOVERNMENT
COMMUNITY-LED ACCELERATED WASH (COWASH) PROJECT
Consolidated Regional Performance Report
(Quarter III of EFY 2007)
Finfinne
May 2015

Page 1 of 28
Table of Contents
1 INTRODUCTION 2
1.1 BACKGROUND 2
1.2 BASELINE SITUATION OF PROJECT INTERVENTION WOREDAS 2
1.3 BASIC PROJECT INFORMATION 3
2 PLANNED TARGET 5
2.1 ANNUAL TARGET (EFY 2007) 5
2.2 PLANNED TARGET IN THE THIRD QUARTER 5
2.3 PLANNED TARGET UNTIL THE END OF THIRD QUARTER 5
3 PERFORMANCE DURING THE REPORTING PERIOD 6
3.1 CAPACITY BUILDING DURING THE REPORTING PERIOD 6
3.1.1 PHYSIAL CAPACITY BUILDING 6
3.1.2 HUMAN CAPACITY BUILDING 6
3.2 CONSTRUCTION OF WASH FACILITIES DURING THE REPORTING PERIOD 8
3.3 FREQUENCY OF MEETINGS OF RWSC, ZWT AND WWT ON COWASH ISSUES 10
3.3.1 WWT MEETINGS ON COWASH ISSUES 11
3.3.2 ZWT MEETINGS ON COWASH 11
3.3.3 REGIONAL WASH STEERING COMMITTEE (RWSC) MEETINGS ON COWASH 12
3.4 SANITATION AND HYGIENE ACTIVITIES 12
3.5 FINANCIAL RESOURCE UTILIZATION DURING THE REPORTING PERIOD 12
3.6 MAJOR CHALLENGES FACED & MEASURES TAKEN DURING THE REPORTING PERIOD 13
3.7 OUTSTANDING ISSUES 14
ANNEX 15

Page 2 of 28
1 INTRODUCTION
1.1 BACKGROUND
Water-borne and water-related diseases are one of the major challenges and primary health problems of
developing countries including Ethiopia. Several studies indicate that socio-economic impact1 of inadequate
access to safe water supply and sanitation facilities is tantamount. Its impact ranges from loss of productivity,
low girls’ enrolment to life loss because of conflict and insecurity over scarce water resources and infectious
diseases mainly diarrhea, malaria, lymphatic filariasis, trachoma, and intestinal worms. According to World
Health Organization (WHO, date???), 1.4 up to 1.8 million and 0.5 up to 1.2 million people worldwide die
respectively from diarrheal and malaria cases. Related deaths and disability rates are highest among children
under age of five and reach 90% of related deaths. About 2,200 up to 5,000 children die on daily basis from
water and sanitation related diseases. More than three forth of whom are citizens of third world countries.
Inadequate access to safe water supply and sanitation facilities is responsible for most of these morbidity and
mortality cases. WHO (2008)2 estimated that 88% of mortality cases from diarrhea are due to use of unsafe
drinking water, inadequate water for hygiene and inadequate access to sanitation facilities. In addition, 77%,
27%, and 29% of morbidity cases from schistosomiasis3, trachoma, and intestinal helminthes can be reduced
by improving access to basic water supply and sanitation facilities as well as better hygiene practices. In view
of this fact, donors and government of Ethiopia has paid relentless effort and significant improvement has
been made in the last one or two decades. Ethiopia has registered significant improvement largely with an
implementation of health extension packages throughout the country, and expansion of health and water
supply infrastructure.
However, significant proportion of population especially those residing in rural areas of Ethiopia is not yet
accessible to water supply and sanitation facilities. National WASH inventory result released by Ministry of
Water and Energy (MOWE, date ??) indicates that only 48.85% of rural population, 31.39% of schools, and
31.86% of health institutions in the country are accessing safe water supply at the end of EFY 2003. Similarly,
60.39% of rural households, 32.74% of schools and 31.86% of health institutions are accessing improved pit
latrine. Yet, utilization figure may significantly be lower than access figure. Regional figure is significantly
lower than national figure where 24.73% of schools and 26.57% of health institutions are accessing water
supply and 28.58% of schools and 26.57% of health institutions are having access to sanitation facilities. But,
regional population accessing safe water supply is not significantly higher than national figure. In the next
section, Specific baseline situation of project woredas in the region is illustrated.
1.2 BASELINE SITUATION OF PROJECT INTERVENTION WOREDAS
In order to facilitate evaluation of project outcomes an attempt was made to establish baseline data of relevant
result indicators. Towards this end, official report from each project woreda is collected and illustrated here under. Though different figures were obtained at different time (in EFY 2005 and EFY 2006), recent and
more reliable data collected from project woredas is presented below. Yet, previous report was used where data is not available.
1 Water and sanitation program (WSP) estimated an economic loss of USD 4.2 billion per annum due inadequate acces s to water
supply and sanitation facilities in Bangladesh, which is 6.3% of gross domestic product (2007) 2 Pruss-Ustun A., Bos R., Gore F., & Bartram J, (2008), Safe water, better health: Costs, benefits and sustainability of
interventions to project and promote health. WHO, Geneva. 3 Pathogenic bacteria that causes diarrhea, vomiting

Page 3 of 28
Access to water supply at the end of EFY 2004, according to these sources, ranges from 44.6% in Gumay woreda to 78% in Abichu Nya’a woreda and access to improved pit latrine by rural population ranges from
18% in Tole woreda to 94% in Gumay woreda. Accessibility of the rural population in Ilfeta and Tole woreda to safe water supply at the end of EFY 2005 (the year program begun operation in the second batch three
woredas) were not obtained. Latrine access coverage at the end of EFY 2004 for Kersa and Abichu Nya’a woredas were not obtained. In their last report, however, it was indicated to be 45% and 55% respectively. Only 21 of 153 rural kebeles of project woredas were reported to be open deification free (ODF). All ODF
kebeles in project woredas are located in Kersa Woreda. With regard to institutional access to WASH services, very few had access to safe water supply and standard VIP latrine. Only 38 out of 210 schools and
23 out of 116 health institutions located in the rural areas of the first batch 5 woredas had access to safe water supply. Table 1.2a: Status of WASH services (Baseline Indicators), mid 2012 (at the end of 2004 EFY)
Source: Respective Woreda Water, Mineral and Energy office, Woreda Health Office, and Woreda Education Office
Table 1.2b: Status of WASH services (Baseline Indicators), mid 2013 (at the end of 2005 EFY)
S/n Woreda Safe Water Supply Access
Coverage (Rural)
Safe Rural Water Supply
Coverage (Usage)
Safe Water Supply Coverage
(No. of Rural Schools)
Safe Water Supply Coverage
(No. of Rural H/Inst.)
Non-function
ality Rate (%)
Latrine Access
Coverage (Rural)
Latrine Usage
Coverage (Rural)
Number of ODF Kebeles
6 Ilfeta na 38.2 8 3 5.7 36 na 0
7 Jeldu 49.7 na 1 3 24.3 33.3 43 0
8 Tole na 39.93 0 2 11.8 18 18 0 Source: Respective Woreda Water, Mineral and Energy office,Woreda Health Office, and Woreda Education Office
Table 1.2c: Status of WASH services (Baseline Indicators), mid 2014 (at the end of 2006 EFY)
S/n Woreda Safe Water Supply Access
Coverage (Rural)
Safe Rural Water Supply
Coverage (Usage)
Safe Water Supply Coverage
(No. of Rural Schools)
Safe Water Supply Coverage
(No. of Rural H/Inst.)
Non-function
ality Rate (%)
Latrine Access
Coverage (Rural)
Latrine Usage
Coverage (Rural)
Number of ODF
Kebeles
9 D/Inchini 67.11 67.11 7 20 9.42 73 63 0
10 K/Malima 73.84 57.6 12 31 4.31 39 20 0
11 Horro 84.2 84.2 8 2 11.83 84.75 39.34 0
12 A/Choman 72.7 72.7 18 2 3.6 79.25 46.4 0 Source: Respective Woreda Water, Mineral and Energy office,Woreda Health Office, and Woreda Education Office
1.3 BASIC PROJECT INFORM ATION
In response to inadequate access to Water supply and sanitation facilities and associated deaths and
disabilities explained above, FDRE and its constituent regions including Oromia, donors, NGOs and CSOs
have been implementing several development programs targeted at improving access to WASH facilities and
improved hygiene behavior. Community-led Accelerated WASH (COWASH) project is one among several
health and water sector development projects under implementation by the region with specific objective to
provide capacity building and investment support in the establishment of enabling environment and
implementation of community managed approach in selected woredas of the region.
S/n Woreda Safe Water
Supply Access Coverage
(Rural)
Safe Rural
Water Supply Coverage (Usage)
Safe Water
Supply Coverage (No. of Rural
Schools)
Safe Water
Supply Coverage (No. of Rural
H/Inst.)
Non-
functionality
Rate (%)
Latrine
Access Coverage
(Rural)
Latrine
Usage Coverage
(Rural)
Number
of ODF Kebeles
1 Karsa 46.3 56 13 11 10.88 na 64 21
2 Gumay 44.6 52.4 11 10 8.93 94 56 0
3 N/Benja 45.3 52 1 Na 14.17 84 71 0
4 Jidda 60 72 6 Na 3.45 55.7 57 0
5 A/ Nya’a 78 82.7 7 2 5.26 na 38 0

Page 4 of 28
The project adopts Community Managed Project (CMP) in which target communities through their elected
representatives are empowered to manage their project right from initiation of project need to operation and
maintenance phase including selection and contracting of contractors and purchase of construction materials,
construction supervision and effecting payment. Micro-finance institutions were also made part of the
implementation modality to provide communities with rural banking service. The project is funded by
Government of Finland, Oromia Regional State and the beneficiary community. According to the financing
agreement made between the Government of Finland and Oromia Finance and Economic Development
Bureau, the regional government finances investment and some operational cost of the project while the
government of Finland finances capacity building and some operational costs. Accordingly, the GoF pledged
to finance Euro 1,766,000.00 (equivalent to ETB 38,852,000.00) and the regional government has expressed
its commitment to finance ETB 72 million solely for construction of WASH facilities. The project was
designed to last for 4 years, 2005 - 2008 EFY.
Within this implementation framework, the region has begun implementation of COWASH project in EFY
2005. The project is being implemented in 12 selected woredas of the region. Particularly, it is being
implemented in 101 kebeles of the region. It has begun operation in 25 kebeles in 5 woredas in EFy 2005 and
increased to 61 in 8 woredas in EFY 2006 and 101 woredas in 12 woredas in EFY 2007. The following table
also shows number of CMP kebeles in each woreda in the last three years, 2005-2007.
Table1.3: Number of CMP Kebeles in Each Project Woreda
S/n Woreda Number of CMP Kebeles
EFY 2005 EFY 2006 EFY 2007
1 Karsa 5 10 15
2 Gumay 5 10 15
3 Nonno Benja 5 10 12
4 Jidda 5 10 11
5 Abichu Nya’a 5 6 8
6 Ilfeta 5 8
7 Jeldu 5 5
8 Tole 5 7
9 Dire Inchini 5
10 Karsa Malima 5
11 Horro 5
12 Abbay /Choman 5
Total 25 61 101
In the following two sections, target plan and performance of COWASH project in the region in the third
quarter, in the last nine months and in EFY 2007 is presented.

Page 5 of 28
2 PLANNED TARGET
2.1 ANNUAL TARGET (EFY 2007)
In EFY 2007, it was planned to
a) Build physical and human capacity of the region and project zones and woredas with different field and
office equipment and trainings;
b) Build ownership and management capacity of user communities in 12 project woredas with different types
of trainings
c) Trigger and follow-up 60 kebeles (5 in each project woreda) for open defecation free (ODF) status; and
d) Construct 134 new hand dug wells and 120 new spring on spots, and rehabilitate 2 spring on spots to
benefit 64,000 persons;
e) Construct 9 hand dug wells, 100% of 5 new, 50% of one new and 9% one rolled latrine projects to benefit
16 schools; and
f) Finally, construct another 9 hand dug wells and 5 new latrine projects and complete two latrine projects to
benefit 16 health institutions in the project woredas using CMP approach at a cost of about ETB 13.1
million.
2.2 PLANNED TARGET IN THE THIRD QUARTER
During the reporting period, it was planned to
a) Organize and deliver 8 different kinds of trainings (6 at woreda level & the remaining 2 at regional level);
b) Construct 49 hand dug wells, 59 spring on spots and 4 shallow wells for communities
c) Construct 9 hand dug wells and 5 standard VIP latrines
d) Construct 8 hand dug wells and 5 standard VIP latrines
e) Follow-up of 60 kebeles for ODF status
2.3 PLANNED TARGET UNTIL THE END OF THIRD QUARTER
By accomplishing planned activities in the last three quarters, the following targets were planned to be
achieved at the end of third quarter.
a) Complete the procurement of all physical capacity building items;
b) Complete delivering two-third training programs
c) Trigger and follow-up 60 kebeles (5 in each project woreda) for open defecation free (ODF) status; and
d) Complete the construction of 134 new hand dug wells and 120 new spring on spots, and rehabilitate 2
spring on spots;
e) Complete the construction of 9 hand dug wells, 5 new, 50% of one new and 9% one rolled latrine projects;
and
f) Finally, construct another 9 hand dug wells and 5 new latrine projects and complete two latrine projects.

Page 6 of 28
3 PERFORMANCE DURING THE REPORTING PERIOD
3.1 CAPACITY BUILDING DURING THE REPORTING PERIOD
3.1.1 PHYSIAL CAPACITY BUILDING
COWASH project has planned to procure field vehicle, office equipment’s, construction materials and equipment that help project woredas, zones & region to implement the project in an effective and efficient
manner. Based on this, up to end of the reporting period, goods amounting Birr 7,641,250 has been planned by the project.
At regional level, one additional field vehicle which is promised to solve the problem of field vehicle for supervision of project woredas and zones is on the process and the supplier was already identified in the
reporting period. Other planned materials such as desktop computer, printer and scanner were not purchased.
At zonal level, almost all procurements planned were not procured and reported, but in most zones the purchasing process is already completed and is expected to be procured in the beginning of fourth quarter.
At woreda level, a total of 22 Motorbikes (100%), 52 artisan hand tools (50.4%), 3 small diameter molds (14.28%), 3 Spring construction equipment (35%), 10 LCD Projector (71.4%), 2 Chain Blocks (25%), 27
Desk top Computers (64.3%), 32 Printers (80%), 3 Photocopy Machines (75%) were among the items procured in the reporting period. An estimated amount of Birr 3,096,086.52 was spent by the woredas for these procurements. Motorbikes of Suzuki brand were purchased at regional level with the delegation of the
project woredas.
Most of the items which are not procured by woredas were on purchase process and are expected to be finalized in the first month of upcoming quarter including water quality test kits in which the purchase is processed by regional water bureau on behalf of woredas.
3.1.2 HUMAN CAPACITY BUILDING
A total of 7 trainings were planned to be carried out in third quarter of 2007 EFY out of which 2 are at regional level, while the remaining 5 at Woreda Level. Accordingly, all of woreda level trainings except
GLOWS/WSP were provided. Moreover, 4 other training programs planned in 2nd quarter were also provided in the reporting period. One regional level training which was planned in second quarter has been provided in
the reporting period. (Annex 2.1). The main purpose of these trainings is to support the individual and the institutional/organizational capacity
needed for successful implementation of project. The goal is to enable people to fulfil their responsibilities and tasks within emerging structures. The details of the trainings are elaborated below.
3.1.2.1 REGIONAL LEVEL TRAININGS
WASHCO CMP Management Training of trainers training was given at Wolisso town for 2007 EFY newly selected 4 Project Woredas and one zone by RSU staffs. The Woreda Finance office auditors have also
participated in the training based on the assumption that they will give technical support for CMP supervisors’ on issues related to financial management including document handling.
Other trainings which were planned by WaSH sector offices i.e (BoFED 2 trainings, Health 1 training, Education 1) in second quarter were also not given in the third quarter of the fiscal year. The weak sectoral
collaboration and loose coordination is still the main problem..

Page 7 of 28
3.1.2.2 WOREDA LEVEL TRAININGS
3.1.2.2.1 KWT Training in CMP Promotion, Application preparation and Appraisal
Kebelle WaSH team training on CMP promotion, application preparation, appraisal and approval and M&E (Both New & Refreshment) was given for a total of 792 KWT members drawn from 92 kebelles of 12 CMP
Woredas. The Refreshment training was given for 436 KWT members of 54 CMP Kebelles, while 326 KWT members from 38 CMP Kebelles received the training for the first time. More than 93% of planned participants (762) attended the training. The training was conducted by Water, Health and Education staffs
that were trained on CMP management at regional level.
The methodology employed for the training includes presentation, group work, and drama. In this training, woreda water office, health & education experts which took key role in CMP were also trained with this kebelle WaSH actors. In some Woredas, woreda administrators made opening and closing remarks, which
makes KebelleWaSH actors to give due attention to the CMP processes. 3.1.2.2.2 Artisan Training
New artisans training in HDW and SPD construction has been started in 6 old and new CMP woredas in the
reporting period. From planned artisan trainees, 62 (71.2%) have started the training. Theoretical training was already given in almost 6 woredas. The practical training was given and planned to be given in hand dug well
and spring development sites under construction in CMP Kebeles in the woredas. The under achievement is mainly due to some woredas have been at the stage of selecting artisans.
Though there is difference in the training days across woredas, in the reporting period no woreda has completed and reported the artisan training. 3.1.2.2.3 WASHCO CMP Management & Implementation
Based on the ToT training of CMP management held at the regional level, WASHCO CMP management and implementation training have been held in all CMP woredas by trained woreda experts in the reporting period. A total of 2,186 (950 female) WASHCO members, kebelle managers, Woreda level WASH actors were
trained for 3 days by trained Woreda staffs and this accounts 109% of planned trainees. The major reason for over achievement is that some woredas (i.e. NonoBenja, Gumay, and Kersa) are constructing WPs more than
their plan. A total of birr 745,190 Birr was spent for the training. 3.1.2.2.4 Training of WASHCO members in O & M, Environmental Sanitation & Hygiene and Water Safety
Planning
In the reporting period, COWASH has planned to train a total of 1,472 WASHCO members in post construction activities especially on how to operate and maintain their schemes. Consequently, a total of 901
(500 females) WASHCO members drawn from 143 WPs received the training with a total cost of about 242,790 Birr for a total of 3 days in each training session. WASHCOs of COWASH Projects constructed in
2005 and 2006 EFY but not received the training were made part of the training. 3.1.2.2.5 Training of Pump attendants and care takers
Pump attendants and caretakers are responsible to make minor maintenance and involved in daily
management of water schemes and generally plays great role in sustainability of water schemes. Pump attendants and caretakers were trained by woreda level experts who took ToT training at Fiche town
last fiscal year. Water supply projects that were completed in the previous fiscal years (2005 and 2006 EFY) were represented by two pump attendants/caretakers for the training. In the reporting period, a total of 52 (3
female) pump attendants and caretakers were trained with a total cost of Birr 30,208.99. 3.1.2.2.6 Training of Kebelle level Experts in CLTSH
A total of 165 (37 females) experts drawn from health centers, health post and woreda health office and health
institutions were trained on Community Led Total Sanitation & Hygiene (CLTSH) with an objective of

Page 8 of 28
freeing CMP kebelles from open defecation in particular and improving the health and wellbeing of the kebelles population in general.
A total of 7 woredas conducted this training with an exception of Tole, Kersa, Jida, Kersa Malima and Abay
Chomen woredas. The training was given by woreda level health office experts. A total of Birr 55,267 was spent for the 5 days training. 3.1.2.2.7 Training on Gender mainstreaming
Women’s empowerment and their full participation on the basis of equality in all spheres of society are fundamental for the achievement of sustainable development. Cognizant of this fact, COWASH has been giving training for kebelle WaSH team members to strengthen the participation of women in WASH.
Thus, all woredas provided gender awareness and mainstreaming training to KWT members. A total of 315
(147 females) participated in the training held for 3 days. The training was delivered by woreda women’s, children and youth office in close collaboration with Woreda Water, Mines & Energy offices with total cost of Birr 99,422.
3.1.2.3 Workshops
In third quarter of the fiscal year no workshop was planned by COWASH project. But Whole system in the
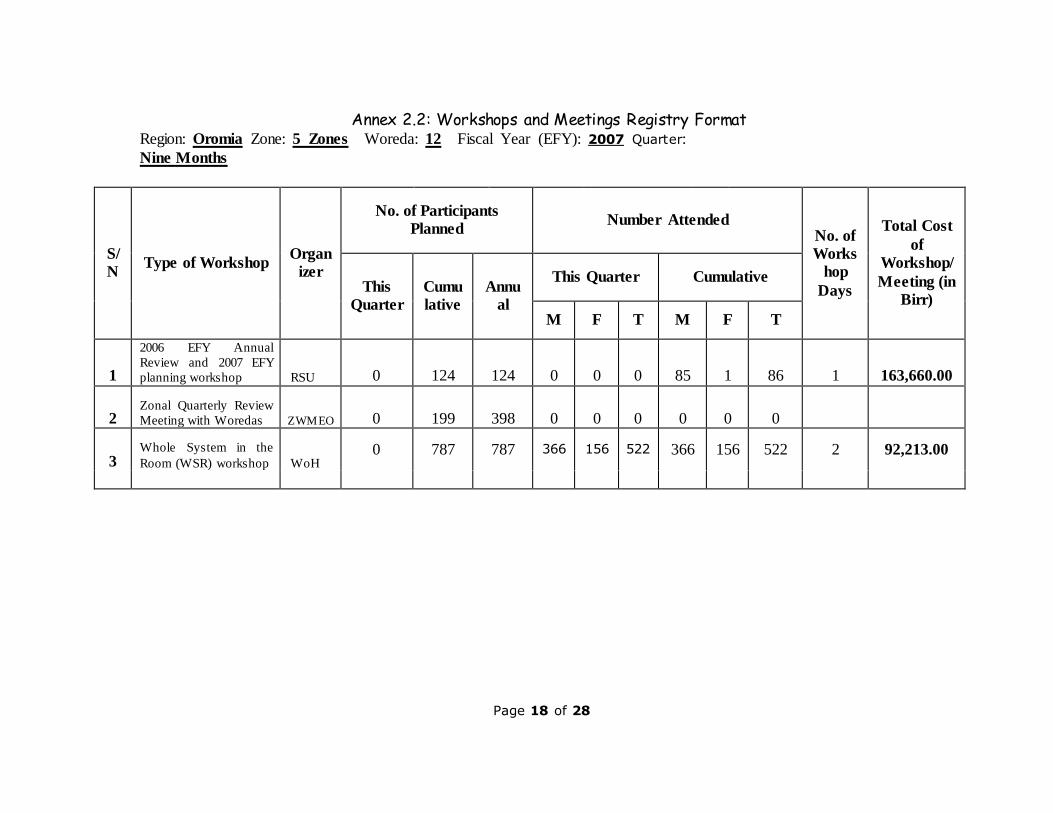
room workshop which was planned in second quarter of fiscal year was given in the reporting period. Based on this, out of 12 CMP woredas 5 successfully provided the training with a total cost of Birr 92,213. Woreda performance reports show that 66.3% (522) of planned participants attended the workshop (Annex 2.2)
3.2 CONSTRUCTION OF WASH FACILITIES DURING THE REPORTING PERIOD
In the third quarter, only 58 (41%) hand dug wells, 74 (74%) spring on spot, and rehabilitation of existing one hand dug well and one spring on spot (100%) was constructed. Out of total planned target for the nine months, only 52% was achieved due to poor performance by Ilfeta, Abichu Nya’a, Tole, Jeldu, and Karsa woredas.
Third batch woredas are on preparatory activities and is premature to judge their performance. And yet, they seem to be committed as compared to some first and second batch project woreads.
Table 3.2a: Number of Projects Constructed During and until the end of Reporting Period
S/n Type of Project Planned Achieved Percent Achieved
Quarter
III
Until
Quarter III
Quarter
III
Until
Quarter III
Quarter
III
Until
Quarter III
1 Spring on Spot 59 120 74 89 125 74 2 Hand Dug Wells 66 152 58 62 88 41
3 Shallow Wells 4 7 0 0 0 0 4 Rehabilitation 2 2 2 2 100 100
5 Standard School VIPL 4 7 0 0 0 0 6 Standard VIPL for H/Inst. 5 7 0 0 0 0
Total 140 294 134 153 95 52
Shallow Wells: It was planned to construct 7 shallow wells in two woredas namely, Jidaa (4 shallow wells) and Abichu Nya’a (3 shallow wells) at a total cost of Birr 870,000.00. According to report obtained from both woredas, both are on tendering stage for the selection of drilling companies. Abichu Nya’a woreda reported
that no bidder shown interest and the woreda has advertised on Ethiopian Herald for the second time and said it will remain open until May 19/ 2015.
Standard School VIP Latrine: In the EFY 2007, it was planned to complete one on-going project (Ayida Dawo Primary School in Jidda). Accordingly, 5 of the latrines were completed and one of them, Girma Primary School in Kersa woreda, is on still under construction (50.0%). some Birr 1,461,150n has been spent
for the construction of the 6 latrines.

Page 9 of 28
Moreover, an estimated 38% of planned target of the construction of standard VIP latrine for school was constructed. Construction of Baso School standard VIPL located in Abichu Nya’a woreda has shown no
progress due to poor project monitoring and supervision and decision making by the woreda. The project was on an estimated 95% at the end of EFY 2006 and spent more than Birr 194,338.70. The woreda claims that
additional budget is needed. But, the woreda has neither allocated budget during annual planning meeting nor utilized cash on hand of more than Birr 43,294.48 and 20 quintals of cement. Construction of Bicho Primary school VIPL located in Jeldu woreda has not commenced due to weak coordination structure of the woreda.
Delay in the construction of Ayida Dawo Primary school VIPL is reported to be due to unavailability of construction material specifically stone, which was initially planned to be contributed by the community.
However, the woreda WASH team responded late in the third quarter and completion of the project demands close supervision and prompt action by the woreda WASH team. Progress of the construction of other schools VIPL is modest. See table below.
Construction quality varies from woreda to woreda and in most project woredas, failure to comply with
standard design and specification, poor workmanship, malicious procurement process and fund utilization, changing PTA members, and failure to follow the prescribed CMP approach. Inadequate technical capacity of woreda staffs to support artisans in maintaining good construction quality and in some woredas, for instance
in Nonno Benja woreda, negligence to monitor and supervise local contractors/ artisans is affecting construction quality and cost negatively. In almost all woredas, the decision and the size of collection
chamber constructed seldom depend on discharge of the source and the beneficiary population. Table 3.2b: Progress of the Construction of Standard School VIPL S/n School Name Woreda Status at
the end of
EFY 2006
Planned Achieved Per cent
Achieved
Status until
the end of
Quarter III
1 Bicho Primary School (1-8) Jeldu 0% 100% 0% 0% 0%
2 Shambal Abebe Bikila Sec. School Jidda 0% 100% 20% 20% 20%
3 Ayida Dawo Primary School (1-8) Jidda 91.1% 8.9% 3.9% 44% 95%
4 Girma Primary School (1-8) Karsa 0% 50% 30% 60% 30%
5 Abeebe Primary School (18) Tole 0% 100% 50% 50% 50%
6 Nago Agayo Primary School (1-8) Gumay 0% 100% 80% 80% 80%
7 Hawisa Bulo Primary School (1-8) Gumay 0% 100% 50% 50% 50%
8 Baso Primary school (1-8) A/Nya’a 95% 0% 0% 0% 95%
Average 23.3% 70% 29% 38% 53%
Standard H/Institutions’ VIP Latrine: It was planned to complete two (2) (i.e. Girma H/Post and Ankaso
Health Post) and construct 100% of five (5) new health institutions’ latrine projects at a cost of Birr 486,000.00. But, an estimated 34% of planned 77% is completed due to poor performance by WWT and
health office of Kersa, Jeldu, Tole, and Gumay woredas. As can be seen in the table below, both 2 on-going projects planned to be facilitated by Kersa Woreda health office were not completed and three projects, i.e. one project each in Kersa, Jeldu and Tole woredas have not yet commenced construction.
Table 3.2c: Progress of the Construction of Health Institutions’ Latrine Projects S/n Health Inst. Name Woreda Status at
the end of
EFY 2006
Planned Achieved Per cent
Achieved
Status until
the end of
Quarter III
1 Tatesa Health Post Jeldu 0% 100% 0% 0% 0%
2 Karra Gora Health Post Karsa 0% 100% 0% 0% 0%
3 Girma Health Post Karsa 80% 20% 18% 90% 98%
4 Ankaso Health Post Karsa 80% 20% 18% 90% 98%
5 Kursiti Arada Leka Health Post Tole 0% 100% 0% 0% 0%
6 Kurbo Dage Health Post Gumay 0% 100% 50% 50% 50%
7 Muti Health Post Abichu 0% 100% 10% 10% 10%
Average 23% 77% 14% 34% 37%

Page 10 of 28
Analysis of performance of the project by woredas shows large variation in construction ranging from 0% to
169%. Gumay and Nonno Benja woredas have completed more than their plan and Ilfeta and Abichu Nya’a and Ilfeta woredas completed none. Jeldu woreda, who is constructing rolled over projects is currently on
50% of its total annual plan. Out of total constructed 153 projects, about two third is contributed by two woredas, Nonno Benja and Gumay
woredas and about 17% is contributed by Kersa woreda. Three woredas namely Jeldu, Tole and Jidda contributed 16% of total constructed projects until the end of EFY 2006. Other woredas completed no
projects. In terms of target beneficiary, on the other hand, 57% of planned number of community water supply projects
and 44% of target number of school water supply projects were constructed/ achieved. No water supply project planned to benefit health institutions is reported to be completed until the end of the reporting period,
i.e. ZERO percent. Comparison of school and health institutions latrine projects shows similar footing. Yet, if the volume of work is considered, health institutions latrine project is lagging behind school latrine projects.
Table 3.2d: Project performance by intervention woredas S/n Woredas Total
Planned
Community Institutional HDW Total
Achieved
Percent
Achieved HDW SoS Rehab. School H/Inst.
1 Karsa 48 12 14 0 0 0 26 54
2 Gumay 29 18 26 2 3 HDWs 0 49 169
3 Nonno Benja 43 23 30 0 1 HDW 0 54 126
4 Jida 25 5 0 0 0 0 5 20
5 Abichu Nya’a 24 0 0 0 0 0 0 0
6 Ilfeta 20 0 0 0 0 0 0 0
7 Tole 35 0 6 0 0 0 6 17
8 Jeldu 26 0 13 0 0 0 13 50
9 New Woredas 44 0 0 0 0 0 0 0
Total 294 58 89 2 4 0 153 52
3.3 FREQUENCY OF MEETINGS OF RWSC, ZWT AND WWT ON COWASH ISSUES
In the Community Managed Project (CMP) approach, WASH coordination structures are presumed to meet
on regular basis to provide guidance and direction for efficient and effective implementation of the project in
their jurisdiction. Implementation of the project naturally demands direction on selection of target kebeles,
selection and assignment of supervisors and focal persons, budget allocation and annual work plan
preparation, approval of applications, release of investment fund, monitoring and performance review, and
etc. Approval of CMP applications can be made at a time or more based on the decision of sector offices.
Release of investment fund, according to the CMP approach, is made on four installments, i.e. 20%, 30%,
30%, and 20%. But, the number of installments is left flexible as volume of transaction/ payment varies.
Target plan of WASH coordination structures’ meetings cannot be determined. But, the number of WWT
meetings in a given fiscal year depends on these factors and these issues must be addressed. Moreover, the
ultimate output of WASH coordination structures meeting is effective and efficient project implementation in
specific jurisdiction. In addition to number of meetings, quality, cost and time of execution of project
activities best explains the commitment and effort of WASH coordination structures. Yet, performance of
WASH coordination structure at all levels demands an in depth analysis and close monitoring and

Page 11 of 28
supervision. For the way forward, it seems to create inefficiency to transfer additional budget for Sanitation
activities without monitoring and supervision and progress review report by regional health bureau.
3.3.1 WWT Meetings on COWASH Issues
Number of meetings held by WWT of Ilfeta, Horro, Jeldu, Tole, and Jeldu woreda seems to explain project
performance, specifically in terms of number of projects completed, in these particular woredas and needs
utmost attention by all actors in the system. Number of meetings held by WWT of Nonno Benja, Gumay
woreda commensurate with number of projects completed. In sum and as can be seen in the table below
WWT of project woreads met only 4 times on average in the last three quarters.
Table 3.3.1: Number of Times WWT met until the end of third quarter
S/n
Name of Project Woreda
No. of times the WWT met &
discussed on COWASH issues
in the Nine Months
How many of the WWT meetings held on
COWASH issues in the Nine Months have
signed Minutes of Meetings?
1 Kersa 7 5
2 Gumay 8 6
3 Nonno Benja 9 9
4 Jida 7 7
5 Abichu Nya’a 2 2
6 Tole 2 2
7 Ilfeta 0 0
8 Jeldu 2 2
9 Dirre Inchini 4 4
10 Kersa Malima 3 3
11 Abbay Choman 3 3
12 Horro 1 0
Average 4 3.6
3.3.2 ZWT Meetings on COWASH
As it is clearly illustrated in the table, it can be concluded that no Zonal WASH team has met for COWASH
project issues, which in fact demands urgent solution. The figures are loudly shouting than the report saying
coordination structures at all levels demand revitalization.
Table 3.3.2: Number of Times ZWT met until the end of third quarter
Name of Project Zone
No. of times the ZWT met &
discussed on COWASH
issues in the Six Months
How many of the ZWT meetings held
on COWASH issues have signed
Minutes of Meetings?
Jima 0 0
North Shoa 0 0
West Shoa 0 0
South West Shoa 0 0
Horro Guduru Wallaga 1 1

Page 12 of 28
3.3.3 Regional WaSH Steering Committee (RWSC) Meetings on COWASH
The RWSC is expected to meet twice in a fiscal year. The WASH Steering Committee of the region has met
once (Nov 17, 2015) in the nine months Representation and participation by sector bureaus except by the
regional finance and economic development bureau (BOFED) is better in this meeting than similar meetings
held before. Responsible and decisive staffs (process owners of WASH program) were represented by
regional education and health bureau and an agreement was reached for RSU and these staffs to meet
regularly and discuss on COWASH project implementation and improve communication among sector
bureaus. An agreement was also reached to conduct joint supervision. Finally, the steering committee has
approved EFY 2006 performance report and EFY 2007 annual action plan of the project. Yet, the desire to
meet on regular basis by RSU and regional technical staffs could not successful.
Table 3.3.3: Number of Times RWSC met until the end of third quarter of 2007 EFY
Name of Region
No. of times the RWC met
& discussed on COWASH
issues in the Nine Months
How many of the RWSC meetings
held on COWASH issues have
signed Minutes of Meetings?
Oromia 1 1
3.4 SANITATION AND HYGIENE ACTIVITIES
It was planned to make 5 kebeles open defecation free (ODF) in each project woreda through the triggering
and follow-up of 150 villages/ Garees (i.e. 30 villages in each kebele) in each project woredas at the end of
the current fiscal year at a cost of Birr 3.96 million (i.e. 330,000.00 per woreda for 12 project woredas) with
an assumption that project woredas will conduct the triggering and follow activities, the regional and zonal
health offices shall discharge their duty of monitoring and technical support to project woredas, the regional
technical staffs including RSU coordinate activities through regular meeting, and the regional health bureau
shall authorize BoFED for budget transfer to project woredas health offices. The plan was prepared by
Oromia Health Bureau in accordance with CLTSH implementation guideline and accepted by the regional
WASH Steering Committee (RWSC) during the approval of EFY 2007 annual work plan. Out of these 3.96
million Birr allocated for this component, Birr 990,000.00 was transferred to relevant implementing
government agency as a quick start and to know their performance and additional budget was not yet
transferred due to no monitoring and follow-up report from the supervisory organ so as to identify challenges
and indicate the way forward.
3.5 FINANCIAL RESOURCE UTILIZATION DURING THE REPORTING PERIOD
Very small percentage of the annual budget was utilized due to delay in the approval of the annual work plan
and release of first and second quarter funds. Out of total 35.6 million of 2007 EFY, only 9.4 million, or
28.9% was utilized until the end of third quarter. Specifically, only 5.0 million (or 38.2% of annual budget)
allocated for construction activities, only Birr 2.41 million (or 31.4% of annual budget) allocated for physical
capacity building, only Birr 1.3 million (or 13% of annual budget) allocated for human capacity building, and
only Birr 450,990.00 (37.2% of annual budget allocated for operational activities were utilized until the end of
the third quarter. About 76% of annual budget allocated for investment activities were transferred to

Page 13 of 28
implementing government agencies and yet 69% of total GOE fund transferred to the same were utilized until
the end of the reporting period.
Similarly, out of total capacity building fund, which is to be covered by GoF, only 35% has been transferred
to implementing government agencies. And yet only 58% of amount transferred to the same were utilized
mainly due to inadequate attention and effort made by implementing government organizations at all levels
for procurement of physical capacity building items and trainings in addition to late endorsement and approval
of EFY 2007 annual work plan. Workload and engagement of officials at all levels to attend review meeting
and annual action planning workshop planned to be organized at regional level has significantly delayed the
preparation of EFY annual work plan, hence its endorsement before mid-October 2014 and approval on Nov.
17, 2015. Capacity building budget was accordingly requested and released from Ministry of Foreign Affairs
of Finland on 5th December 2014 and 14th January 2015 respectively. Timely organizing review meeting
workshop may be in the early summer season, i.e. July, should be considered central for the way forward.
Failure to comply with principles of the project, for instance reluctance to build local private capacity (both
artisans and suppliers), lack of clear assignment and empowering of technical staffs, and failure to adopt the
CMP approach is another possible reason for poor utilization by project woredas.
3.6 MAJOR CHALLENGES FACED & MEASURES TAKEN DURING THE REPORTING PERIOD
3.6.1 Major Challenges Faced & Measures Taken
Main challenges that have affected the performance of the project in the region in the last nine months were
delay in the preparation of annual work plan and subsequent activities; different methodologies adopted after the organizing of review meeting and action planning workshop have failed due to competing work
assignments at different levels.
Table 3.5 Major Challenges Faced and Measures Taken
S/n Major Challenge(s) Faced Measure(s) Taken
1 Delay in the preparation and approval of EFY 2007 Annual Work Plan due to busy engagement
by officials at all levels to undertake review meeting and annual action planning workshop,
which is an input for the preparation of annual work plan
Annual work plan was made to be consolidated by RSU after having
discussion with Woreda WASH Team at respective woreda capital. The plan was
finalized before the end of October 2014 and approved in the mid of November 2014.
2 Due to delay in the preparation of EFY 2007 annual work plan, first and second quarter budget was requested late and delay of budget release has
significantly affected project progress.
Woredas were informed to use cash on hand or to borrow from other programs and execute project activities in accordance
with approved annual work plan. Some woredas have benefitted from this advice
and reduced the effect of budget delay on their performance.

Page 14 of 28
3.6.2 Outstanding Issues
a) Delay in the preparation & approval of annual plan: -since 2005 EFY regional COWASH plan was
prepared & approved in the month of December/January and budget was released in the month of
February. Almost there is a maximum of five effective working months. Providing 13 Woreda Level
trainings, 2 Zonal level review meetings and 11 regional level trainings together with Construction work
within 5 month is a mess. So in order to achieve the project objectives and make the trainings effective as
well to use resources efficiently this issue needs urgent solution.
b) Weak coordination structures at all levels: regional, zonal and woreda level has significantly reduced
project performance. Inadequate involvement by Oromia Education Bureau, Oromia Health Bureau, and
Oromia Finance and Economic Development Bureau has affected the project to be well coordinated.
Inadequate attention by Oromia Finance and Economic Development Bureau made the project not to have
robust and strong financial management and controlling system especially at woreda and community
level. Inadequate achievement in sanitation and hygiene component and poor qualities of the construction
of institutional latrine projects solely due to inadequate attention accorded by Oromia Education and
Health Bureaus. Strengthening WASH coordination structure at all levels is central to the effectiveness
and sustainability of project results. For the coming fiscal year, it is also advisable to inform and reach on
consensus with these two bureaus to allocate investment budget and operational budget needed to
construct institutional latrines and conduct supervision from their own as budget allocated by Oromia
Water Mineral and Energy Bureau for these activities is creating low ownership and commitment by these
two bureaus.
c) Reluctance by woreda office and technical staffs to maintain standard regional design and specification
and good workmanship of small water supply projects (spring on spots and hand dug wells), inadequate
technical capacity of woreda technical staffs, and inadequate attention by WWT for close construction
supervision has also affected quality of construction. The technical staffs seem to be irresponsive to
technical comments given by RSU staffs as adequate enforcement by WWT is not there.
Page 15 of 28
ANNEX

Page 16 of 28
Annex 1: Summary of Major Mater ials Planned and Procured
Region: Oromia Fiscal Year(EFY): 2007 Quarter: Nine Months
This
QuarterCumulative Annual
This
QuarterCumulative
1 Artisan Hand Tools No. 0 103 103 52 52 64,293 WMEOs of 7 Project Woredas
2 Spring Equipment No. 0 10 10 3 3 63,309 WMEOs of 3 Project Woredas
3 LCD Projector No. 0 14 14 10 10 172,638 WMEOs of 10 Project Woredas
4 Water Quality Test Kits No. 0 8 8 0 0 -
5 Fax Machine No. 0 3 3 2 2 19,300 WMEOs of 2 Project Woredas
6 Dewatering Pump No. 0 2 2 0 0 -
7 File Cabinet No. 0 22 22 9 9 42,800 WMEOs of 5 Project Woredas
8 Chain Blocks No. 0 8 8 2 2 5,300 WMEOs of 2 Project Woredas
9 Exteral Hard Disk No. 0 1 1 1 1 2,500 WMEOs of 1 Project Woredas
10 GPS No. 0 14 14 2 2 10,300 WMEOs of 2 Project Woredas
11 Stabiliser No. 0 50 50 29 29 26,510
WMEO, WHO, WEO, WoFED, WYCH offices
of 5 Project WOredas
12 Small Dia. Mold No. 0 21 21 3 3 36,000 WMEOs of 1 Project Woredas
13 Desktop Computer Set 0 42 42 27 27 388,690
WMEO, WHO, WEO, WoFED, WYCH offices
of 6 Project WOredas
14 Digital Camera No. 0 13 13 8 8 27,276 WMEOs of 6 Project Woredas
15 Motor Bike Set 0 22 22 22 22 1,891,817
WMEO, WHO, WEO, WoFED, WYCH offices
of 7 Project WOredas
16 Printer No. 0 40 40 32 32 223,308
WMEO, WHO, WEO, WoFED, WYCH offices
of 7 Project WOredas
17 Lap Top Computer No. 0 2 2 2 2 30,800 WMEOs of 2 Project Woredas
18 Photocopy Machine No. 0 4 4 3 3 91,247 WMEOs of 3 Project Woredas
19 Double Pick up Car No. 0 1 1 0 0 -
20 Other (specify)
3,096,086.52
Total Cost
(in Birr)Beneficiary Office(s)
Quantity Planned
S/N
Total
Material or Equipment Unit
Quantity Procured
WMEOs= Woreda Water, Mineral & Energy Offices; WHO = Woreda Health Office, WEO = Woreda Education office; WoFED = Woreda Finance & Economic Development Office; WYCH = Woreda Women’ Youth & Children office

Page 17 of 28
Annex 2.1: Training Registry Format
Region: Oromia Fiscal Year(EFY): 2007 Quarter: 3rd
S/
N Type of Training Trainer
Planned No. of Trainees Number Trained No. of
Days
Train
ed
Pre and Post Test Result
Total Cost
of Training
(in Birr) This
Quarter
Cumulativ
e
Annua
l
This Quarter Cumulative
M F T M F T Pre Post
1 WWT CMP Management Training RSU, FTAT 0 127 127 0 0 0 54 7 61 3 44.4 70.49 145,600.00
2 CMP Promotion, Appli., Appr.& M&E Training RSU, FTAT 0 56 56 0 0 0 20 2 22 3 70.6 91.23 61,351.00
3 WASHCO ToT in CMP Management RSU, FTAT 0 68 68 23 3 26 23 3 26 3 43.4 72.68 82,000.00
4 Financial Training for Finance Personnel BoFED, RSU 0 32 32
5 ToT in O&MM of Water Schemes RSU 32 32 32
6 Train Woreda Staff WPs Design Preparation, Site Selection & Supervision
RSU 0 51 51
7 Train Woreda Staff On Institutional Latrine Design 0 51 51
8
Train Woreda/Zonal Staff on CMP Finance
Management & Guideline 0 54
54
9 CLTSH ToT OHB 0 34 34
10 School WaSH OEB 0 28 28
11 ToT on GLOWS/WSP 39 39 39
12 KWT Training in CMP Promotion, Application, Preparation, Appraisal
WWO, WHO, WEO 0 819 819 557 205 762 557 205 762 3
-
287,214.13
13 Training of New Artisans WWO 44 87 87 51 11 62 51 11 62 * 47,957.40
14 Refreshment Training for Old Artisans WWO 175 175 175 0 0 0 0 0 0
15 WASHCO Training on CMP Implementation WWO,
WHO, WEO 1001 2194 2194 1226 950 2186 1226 950 2186 3 -
745,190.00
16 Training of WASHCO members in O & M, Environmental Sanitation & Hygiene WWO 1472 2716 4183 401 500 901 401 500 901 5
- 381,853.00
17 Training of Pump attendants care takers WWO 474 892 1262 49 3 52 49 3 52 3 - 30,208.99
18 Training of Health Center level Experts in CLTSH WHO 0 180 180 128 37 165 128 37 165 5 - 64,521.90
19 Training on Gender mainstreaming WWO, WYC 0 335 335 168 147 315 168 147 315 2 - 99,422.00
20
Training of WASHCO members in Selected
Kebelles on GLOWS/WSP WWO 350 350 350 0 0 0 0 0 0
Total
1,945,318.42
Please note that each training cost indicated above does not include Ilfeta and Tole Woredas training cost FTAT = Federal Technical Assistance Team RSU = Regional Support Unit Staffs BoFED = Bureau of Finance & Economic Development
O HB = Oromia Health Bureau O EB = Oromia Education Bureau WWO = Woreda Water, Mineral & Energy Office WHO = Woreda Health Office WEO = Woreda Education Office WYC = Woreda Women, Youth & Children Office * Indicates there is day difference among woredas’
Page 18 of 28
Annex 2.2: Workshops and Meetings Registry Format
Region: Oromia Zone: 5 Zones Woreda: 12 Fiscal Year (EFY): 2007 Quarter:
Nine Months
S/
N Type of Workshop
Organ
izer
No. of Participants
Planned Number Attended
No. of
Works
hop
Days
Total Cost
of
Workshop/
Meeting (in
Birr) This
Quarter
Cumu
lative
Annu
al
This Quarter Cumulative
M F T M F T
1
2006 EFY Annual
Review and 2007 EFY
planning workshop RSU 0 124 124 0 0 0 85 1 86 1 163,660.00
2 Zonal Quarterly Review
Meeting with Woredas ZWMEO 0 199 398 0 0 0 0 0 0
3 Whole System in the
Room (WSR) workshop WoH 0 787 787 366 156 522 366 156 522 2 92,213.00

Page 19 of 28
Annex 3-1: Water Supply Schemes Constructed in the Reporting Period Region: Oromia Fiscal Year(EFY): 2007 Quarter: 3rd
Note: HDW – Hand Dug Well; SPD – On Spot Spring; SW- Shallow Well; DW- Deep Well; RWH – Roof Water Harvesting, RPS – Rural Piped Scheme
Th i s
Quart erCumulat i ve Annua l Th i s Quart er
Cumulat i v
e
A. Community Water Points
HDW with RP
HDW 70.5 126 126 54 58 9150 9454SPD 62 116 122 74 89 17133 17565SW 3.5 7 7DW
RWH
RPS from SP
RPS from DW
Subtotal 136 249 255 128 147 26,283 27,019 B. Institutional Water Points
B.1 School Water PointsHDW with RP
HDW 9.5 9 9 4 4 1173SPD
SW
DW
RWH
RPS from SP
RPS from DW
Subtotal 9.50 9.00 9.00 4.00 4.00 1,173.00
B.2 Health Institutions Water Points
HDW with RP
HDW 4 8 8SPD
SW
DW
RWH
RPS from SP
RPS from DW
Subtotal 4.00 8.00 8.00 - - -
Total 149.50 266.00 272.00 132.00 151.00 27,456.00
Type of Water Point (WP)
No. of WPs Const ruc t ion
Compl e t ed
No. of Peop l e Having
Access t o the
COMPLETED WPs
w i th in 1 .5 km rad ius
of the WPs
Ac tua l No of
Peop l e Using
the Compl e t ed
WPs
No. of WPs P l anned to be
Const ruc t ed

Page 20 of 28
Annex 3-2: Number of Water Supply Schemes Rehabilitated in Reporting Period Region: Oromia Fiscal Year(EFY): 2007 Quarter: 3rd
This Quarter Cumulative Annaul This Quarter Cumulative
A. Community Water Points
HDW with RP
HDW 0.5 1 1 1 1 125 125SPD 0.5 1 1 1 1 169 169SW
DW
RWH
RPS from SP
RPS from DW
Subtotal 1.00 2.00 2.00 2.00 2.00 294.00 294.00
B. Institutional Water Points
B.1 School Water Points
HDW with RP
HDW
SPD
SW
DW
RWH
RPS from SP
RPS from DW
Subtotal - - - - - -
B.2 Health Institutions Water Points
HDW with RP
HDW
SPD
SW
DW
RWH
RPS from SP
RPS from DW
Subtotal - - - - - -
Total 1.00 2.00 2.00 2.00 2.00 294.00
Type of Water Point(WP)
No. of WPs Rehabilitation
Completed
No. of People Having
Access to the
REHABILITATED WPs
with in 1.5km radius of
the WPs
Actual no. of
People using the
Rehabilitated
WPs
No. of WPs Planned to be Rehabilitated
Note: HDW – Hand Dug Well; SPD – On Spot Spring; SW- Shallow Well; DW- Deep Well; RWH – Roof Water Harvesting, RPS- Rural Piped
scheme

Page 21 of 28
Annex 3-3: Summary of Water Suply Schemes Planned, Applications submitted & Approved in the Reporting Period
Region:Oromia Fiscal Year(EFY): 2007 Quarter: 3rd
<50% >50% Total
A. Community Water Points
HDW with RP
HDW 134 170 148 147 143 28 22 20 34 3 5SPD 120 166 144 141 137 25 7 11 18SW 7 10 10 10 7 7DW
RWH
RPS from SP
RPS from DW
Subtotal 261 346 302 298 287 60 29 31 52 3 5.00
B. Institutional Water Points
B.1 School Water Points
HDW with RP
HDW 9 13 9 9 9 2 2
SPD
SW
DW
RWH
RPS from SP
RPS from DW
Subtotal 9 13 9 9 9 0 2 0 2 - -
B.2 Health Institutions Water Points
HDW with RP
HDW 9 7 5 4 4 2 1 1
SPD
SW
DW
RWH
RPS from SP
RPS from DW
Subtotal 9 7.00 5.00 4.00 4.00 2.00 - 1.00 1.00 - -
Total 279 366 316 311 300 62 31 32 55 3 5
No. of WPs Not
Started
Construction
No. of WPs
Abandoned (could
not be constructed)
No. of WPs
Applications
Approved by
WWT
No. of WPs under constructionNo. of
Trials
made
Type of Water
Point(WP)
No. of
Planned
WPs
No. of WPs
Applications
made
No. of WPs
Applications Desk
Appraised
No. of WPs
Application Field
Appraised
`

Page 22 of 28
Annex 3-4: Summary of Water Suply Schemes Constructed by COWASH until end of the Reporting Period
(2004 EFY + 2005 EFY+ 2006EFY + Reporting Period)
Region: Oromia Fiscal Year(EFY): 2007 Quarter: 3rd
HDW
with
RP
HDW SPD SW DW RWH
RPS
from
SP
RPS
from
DW
Total
HDW
with
RP
HDW SPD SW DW RWH
RPS
from
SP
RPS
from
DW
TotalHDW
with RPHDW SPD SW DW RWH
RPS
from
SP
RPS
from
DW
Total
A. 2004 EFY
A.1 Community WPs - - -
A.2 School WPs - - -
A.3 Health Facilities WPs - - -
Subtotal - - - # - - - - - - - # - - - - - - - - - - - -
B. 2005EFY
B.1 Community WPs 86 39 125 13485 5953 19438 9916 5669 15585
B.2 School WPs 6 2 8 2581 1115 3696 1940 234 2174
B.3 Health Facilities WPs 4 1 5 2304 1556 3860 2290 356 2646
Subtotal - 96 42 - - - - 138 - 18370 8624 - - - - 26994 14146 6259 - - - - 20405
C. 2006EFY
C.1 Community WPs 166 160 326 32216 28122 60338 30035 27394 57429
C.2 School WPs 10 4 14 5172 3111 8283 -
C.3 Health Facilities WPs 3 0 3 1389 0 1389 -
Subtotal - 171 163 - - - - 343 - 38777 31233 - - - - 70010 30035 27394 - - - - 57429
D. 2007EFY Reporting Period
D.1 Community WPs 58 89 147 9150 17133 26283 9454 17,565 27019
D.2 School WPs 4 0 4 1173 1173 -
D.3 Health Facilities WPs 0 - -
Subtotal - 62 89 0 0 0 - 151 - 10323 17133 - - - - 27456 - 9454 17,565 - - - - 27,019
E. Total (2004 + 2005
+2006 + Reporting
Period)E.1 Community WPs - 310 288 - - - - 598 - 54,851 51,208 - - - - ##### - 49,405 50,628 - - - - 100,033
E.2 School WPs - 20 6 - - - - 26 - 8,926 4,226 - - - - 13,152 - 1,940 234 - - - - 2,174
E.3 Health Facilities WPs - 7 1 - - - - 8 - 3,693 1,556 - - - - 5,249 - 2,290 356 - - - - 2,646
Total - 337 295 - - - - 632 - 67,470 56,990 - - - - ##### - 53,635 51,218 - - - - 104,853
No. of People Having Access to the COMPLETED WPs with in 1.5km radius of the WPs
Year of Construction
No. of Water Points Constructed No. of People using the water points
Annex 3-5: Summary of Water Suply Schemes Rehabilitated by COWASH until end of the Reporting Period
(2004EFY + 2005EFY + 2006EFY + 2007 EFY Reporting Period)

Page 23 of 28
Region: Oromia Fiscal Year(EFY): 2007 Quarter: 3rd
HDW
with
RP
HDW SPD SW DW RWH
RPS
from
SP
RPS
from
DW
Total
HDW
with
RP
HDW SPD SW DW RWH
RPS
from
SP
RPS
from
DW
TotalHDW
with RPHDW SPD SW DW RWH
RPS
from
SP
RPS
from
DW
Total
A. 2004 EFY
A.1 Community WPs - - -
A.2 School WPs - - -
A.3 Health Facilities WPs - - -
Subtotal - - - - - - - - - - - - - - - - - - - - - - - -
B. 2005EFY
B.1 Community WPs 1 1 - - - - 2 170 136 306 195 164 359
B.2 School WPs 1 0 - - - - 1 0 0 415 0 0 415
B.3 Health Facilities WPs 0 0 - - - - 0 0 0 0 0 0 0
Subtotal 0 2 1 - - - - 3 0 170 136 0 0 0 0 721 0 195 164 0 0 0 0 - 774
C. 2006EFY -
C.1 Community WPs 1 2 - - - - 3 143 270 413 170 310 480
C.2 School WPs 1 0 - - - - 1 830 0 830 920 0 920
C.3 Health Facilities WPs 0 0 - - - - 0 0 0 0 0 0 0 -
Subtotal 0 2 2 - - - - 4 0 973 270 0 0 0 0 1243 0 1090 310 0 0 0 0 - 1,400
D. 2007EFY Reporting Period
D.1 Community WPs 1 1 2 125 169 294 125 169 294
D.2 School WPs - -
D.3 Health Facilities WPs - -
Subtotal - 1 1 - - - 2 - 125 169 - - - - 294 - 125 169 - - - - - - 294
E. Total (2004 + 2005
+2006 + Reporting
Period)E.1 Community WPs - 3 4 - - - 7 - 438 575 - - - - 1,013 - 490 643 - - - - - - 1,133
E.2 School WPs - 2 - - - - 2 - 830 - - - - - 830 - 920 - - - - - - - 1,335
E.3 Health Facilities WPs - - - - - - - - - - - - - - - - - - - - - - - - -
Total - 5 4 - - - 9 - 1,268 575 - - - - 1,843 - 1,410 643 - - - - - - 2,468
No. of People Having Access to the REHABILITATED WPs with in
1.5km radius of the WPs
Year of Construction
No. of Water Points Rehabilitated No. of People using the Rehabilitated Water Points

Page 24 of 28
Annex 3-6: Site Selection, Study & Design & Drilling for Construction of RPS in the Reporting Period
Region: Oromia Fiscal Year(EFY): 2007 Quarter: 3rd
Not
Starte
d
Accom
plished
(<50%
)
Accomp
lished
(>=50
%)
Complete
d
Not
Starte
d
Accom
plishe
d
(<50%
)
Accompl
ished
(>=50%
)
Complete
d
Site Selection
for Drilling
Deep Well for
RPS
No
0 0 0Drilling of
Deep Wells for
RPS
No0 0 0
Study & Design
of Deep Wells
for RPS
No0 0 0
Study & Design
of Springs for
RPS
No0 0 0Construction of
Deep Wells for
RPSNo
0 0 0
Construction of
Springs for RPSNo
0 0 0
Number of
People
having
access to
the
Completed
Technologie
s within
1.5km
This
Quarte
r
Cumulativ
e
Annu
al
This Quarter Cumulative
Type of Activity Unit
Plan Achievement Actual
Number of
Beneficiary
Population
of the
Completed
Technologi
es

Page 25 of 28
Annex 4-1: Institutional Latrines Constructed in the Reporting Period
Region: Oromia Fiscal Year(EFY): 2007 Quarter: Nine Months
This Quarter Cumulative Annual This Quarter Cumulative Male Female Total
A. School2.30 5.59 5.59 -
B. Health Institution 2.70 5.40 5.40 -
Total (A+B) 5.00 10.99 10.99 - -
RemarkInstitution
No. of Latrines Construction
CompletedNo. of Latrines Planned to be Constructed
Estimated No. of People Benefiting from
the Completed Latrine
Annex 4-2: Summary of Institutional Latrines Planned, Applications submitted and Approved in the Fiscal Year
Region: Oromia Fiscal Year(EFY): 2007 Quarter: Nine Months
A. Schools 7 3 3 2 2 2 2
B. Health
Institutions 7 5 5 4 2 1 1
Total (A+B) 14 8 8 6 4 1 2 3
>50% Total<50%
No. of Latrines
Applications
Approved by
WWT
Institution
No. of
Planned
Latrines
No. of Latrines
Applications
made
No. of Latrines
Applications Desk
Appraised
No. of Latrines
Application Field
Appraised
No. of Latrines under
construction

Page 26 of 28
Annex 4-3: Summary of Institutional Latrines Constructed by COWASH until end of the Reporting Period
(2004EFY + 2005EFY + 2006EFY + 2007 EFY Reporting Period)
Region: Oromia Fiscal Year(EFY): 2007 Quarter: 3rd
Male Female Total
A. 2004 EFY
A.1 School Latrines
A.2 Health Facilities Latrines
Subtotal - - - -
B. 2005EFY
B.1 School Latrines 2 745 2646 3391
B.2 Health Facilities Latrines 6 2554 2131 4685
Subtotal 8 3299 4777 8076
C. 2006EFY
C.1 School Latrines 3 1769 1824 3593
C.2 Health Facilities Latrines 3 1130 1120 2250
Subtotal 6 2899 2944 5843
D. 2007EFY Reporting Period
D.1 School Latrines
D.2 Health Facilities Latrines
Subtotal - - - -
E. Total (2004EFY+2005EFY+2006EFY +
2007 EFY Reporting Period)
D.1 School Latrines 5 2514 4470 6984
D.2 Health Facilities Latrines 9 3684 3251 6935
Total 14 6198 7721 13919
No. of People Benefiting from the Completed
LatrinesYear of Construction/!nstitution
No. of Latrines
Constructed

Page 27 of 28
Annex 5.1: COWASH Funds Utilization Performance
Region:Oromia Fiscal Year(EFY): 2007 Quarter: Nine Months
1 2 3 4 5 6 7 8 9 10 11 12 13 14 15 16 17 18 19
Planned for
this
Quarter
(14+17)
Utilized
this
Quarter
(15+18)
Planned for
this Quarter
Utilized this
Quarter
Planned for
this Quarter
Utilized
this
Quarter
GoF GoETotal
(1+2)GoF GoE GoF+GoE GoF GoE GoF+GoE GoF + GoE GoF + GoE
Cumulative
(9/6)*100
This
Quarter
(11/10)*1
00
GoF GoF GoE GoE
INVESTMENT COST 13,152,618 13,152,618 ######### 13,152,618.00 5,023,494.35 5,023,494.35 6,168,497 5,023,494.35 38.2 81.4 6,168,496.96 5,023,494.35 81.4
PHYSICAL CAPACITY
BUILDING COST7,664,250 7,664,250 7,664,250.00 7,664,250.00 2,406,362 2,406,361.94 - 2,406,361.94 31.4 100+ - 2,406,361.94 100+
HUMAN CAPACITY
BUILDING COST12,788,460 12,788,460 9,900,102.33 9,900,102.33 1,287,650 1,287,649.55 223,366.00 1,287,649.55 13.0 100+ 223,366.00 1,287,650 100+
OPERATIONAL COST 758,400 1,259,272 2,017,672 580,800.00 1,259,272 1,840,072.00 450,990 232,892 683,882.19 563,964.85 366,586.24 37.2 65.0 193,600.00 170,132.00 87.9 370,365 196,454 53.0
TOTAL 21,211,110.0 ######## 35,623,000.0 ######### 14,411,890.00 32,557,042.33 ######## 5,256,386.54 9,401,388.03 6,955,827.81 9,084,092.08 28.88 130.60 416,966.00 3,864,143.49 926.73 6,538,861.81 5,219,948.59 79.83
Total in Euro (1 Euro =
24 Birr) 922,222.2 626,603.9 1,548,826.1 788,919.7 626,603.9 1,415,523.6 180,217.5 228,538.5 408,756.0 302,427.3 394,960.5 28.88 130.60 18,129.0 168,006.2 926.73 284,298.3 226,954.3 79.83
Utilization
(%)
(18/17)*1
00
CategoryPlanned(Annual) Cumulative Planned Cumulative Utilized Utilization(%)
Utilization
(%)
(15/16)*
100
Annex 5.2: Total COWASH Funds (in Birr) Received and Utilized to date, by Fund Source, in Oromia Region
R eceived
( %)
Transf erred
( %)
GoF 28,016,347.24 27,823,787.44 17,424,409.49 10,399,377.95 10,591,937.75 62.2 62.6
GoE 33,706,573.62 29,682,115.39 23,012,354.54 6,669,760.85 10,694,219.08 68.3 77.5
To t al 6 1,72 2 ,9 2 0 .8 6 57,50 5,9 0 2 .8 3 4 0 ,4 3 6 ,76 4 .0 3 17,0 6 9 ,13 8 .8 0 2 1,2 8 6 ,156 .8 3 6 5.5 70 .3
U sage f rom
B udget
Source
R eceived f rom
Source t o dat e
Transf erred t o
B enef iciar ies t o
dat e
U t il ized by
B enef iciar ies t o
dat e
B alance f rom
R eceived t o dat e
B alance f rom
Transf erred t o
dat e