OrmatTechnologiesInc. - Duke University Investment · PDF fileOrmatTechnologiesInc. ... Ormat&...
20
Ormat Technologies Inc. Artur Shikhaleev, Tej Dhond, John Li, Michael Kiffel, Joey Maginnis September 20, 2015
Transcript of OrmatTechnologiesInc. - Duke University Investment · PDF fileOrmatTechnologiesInc. ... Ormat&...

Ormat Technologies Inc.
Artur Shikhaleev, Tej Dhond, John Li, Michael Kiffel, Joey Maginnis September 20, 2015

2
Table of Contents
I. Investment Thesis II. Industry Overview III. Company Analysis IV. ValuaLon V. Conclusion VI. Appendix
I. Investment Thesis

4
Ormat Technologies Inc. (NYSE: ORA)
RecommendaLon: Buy Current Price: $36.40 Price Target: $42.62
Ormat Technologies is an industry leader in geothermal energy. Ver8cal integra8on, superior technology, and worldwide u8liza8on of geothermal energy will be the key drivers in apprecia8on of Ormat’s stock.
n Geothermal energy will get out of wind and solar industries’ shadow due to wider public acceptance and parLcipaLon in Tesla’s gigafactory
n ReducLon in extracLon costs due to developments in EGS technology
n VerLcal integraLon will serve as a safety net against fluctuaLons in electricity prices
CATALYSTS
RISKS
n Lower electricity prices will have a negaLve impact on top-‐line performance
n Possibility of geopoliLcal problems in developing countries (e.g. Kenya and Indonesia)
n Reliance on regulaLon about tax credits

II. Industry Overview
6
InternaLonal
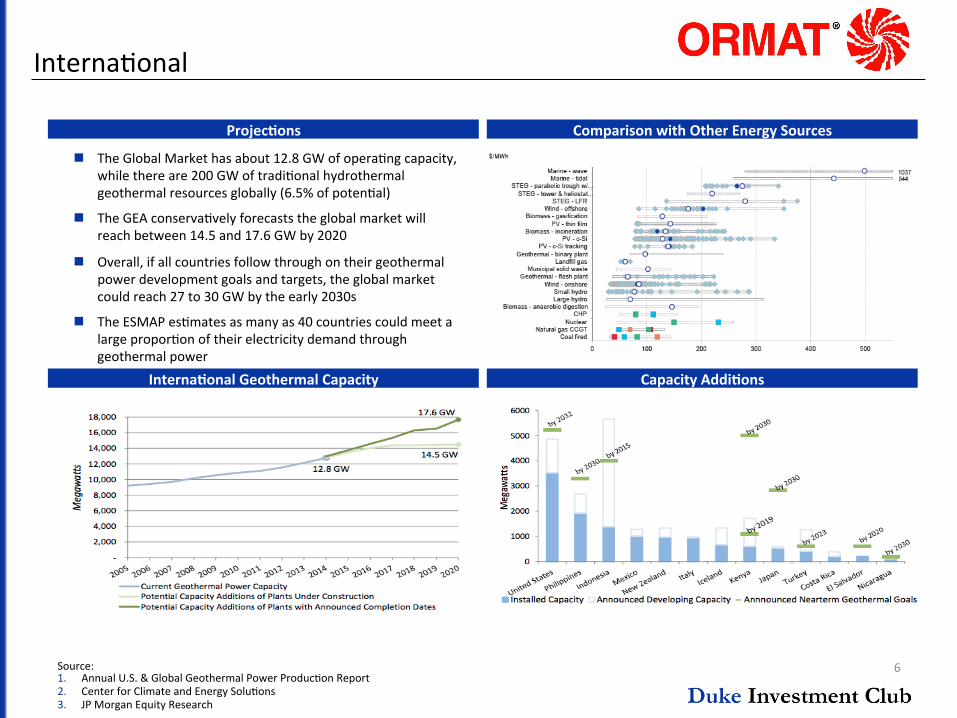
Comparison with Other Energy Sources Projec8ons
Source: 1. Annual U.S. & Global Geothermal Power ProducLon Report 2. Center for Climate and Energy SoluLons 3. JP Morgan Equity Research
n The Global Market has about 12.8 GW of operaLng capacity, while there are 200 GW of tradiLonal hydrothermal geothermal resources globally (6.5% of potenLal)
n The GEA conservaLvely forecasts the global market will reach between 14.5 and 17.6 GW by 2020
n Overall, if all countries follow through on their geothermal power development goals and targets, the global market could reach 27 to 30 GW by the early 2030s
n The ESMAP esLmates as many as 40 countries could meet a large proporLon of their electricity demand through geothermal power
Interna8onal Geothermal Capacity Capacity Addi8ons

7
DomesLc
Policy Updates
US Geothermal Capacity
Transmission
n ProducLon Tax Credit (PTC) and Investment Tax Credit (ITC)
n Uncertainty about whether the two would conLnue to be in affect stalled construcLon of projects in 2014
n Congress extended the effects of the ITC and PTC in 2014 but only in the short term
n Expected to be renewed in 2016
n California’s raises RPS goal from 33% by 2020 to 50% by 2030
Geothermal Growth in the US
Source: 1. Annual U.S. & Global Geothermal Power ProducLon Report 2. Center for Climate and Energy SoluLons
n Total United States nameplate capacity was about 3,500 MW at the end of 2014 with 700 MW added since 2005
n U.S. Market has about 1,250 MW of geothermal power under construcLon
n These projects could be brought online within the next 17-‐33 months
n Lower than expected growth in 2014 was due to poliLcal uncertainty in regard to tax credits and weaker than expected transmission capability
n Renewable energy producLon is highly concentrated in the west while energy consumpLon is concentrated in the east
n Big push in California to improve transmission capability

8
Environment of Low Energy Prices
Historical O&G Prices
Future Projec8ons Effect of Associated Gas
Sector Overview
Source: 1. EIA 2. Bloomberg 3. Ormat Website
n Prices are not correlated since oil and gas are mutually exclusive fuels in terms of consumpLon and natural gas contracts are not Led to oil price
n Yet, natural gas and oil are complements in producLon (associated gas)
n StarLng last year, natural gas price has been falling as the price of oil and other commodiLes
n This created a negaLve pressure on electricity prices, which is a risk to Ormat’s performance
n US oil companies reacted to a downfall in oil price by reducing the number of rigs
n As a side-‐effect, this caused a reducLon in producLon of associated gas
n If this trend conLnues, we might see a scarcity in natural gas that could bring electricity prices up
n In effect, geothermal and other renewable energy companies will be direct beneficiaries of this macro effect
$0.00
$2.00
$4.00
$6.00
$8.00
$10.00
$0.00
$20.00
$40.00
$60.00
$80.00
$100.00
$120.00
2010 2011 2012 2013 2014 2015
WTI Oil Price HH Gas Price
0
500
1,000
1,500
2,000
0 500,000
1,000,000 1,500,000 2,000,000 2,500,000 3,000,000 3,500,000
Jan-‐2013 Jul-‐2013 Jan-‐2014 Jul-‐2014 Jan-‐2015
Shale Gas ProducLon AcLve Rigs

III. Company Analysis

10
Segment Breakdown
Product Segment
Electricity Opera8ng Performance Product Opera8ng Performance
n Designs, manufactures, and sells equipment for geothermal and recovered energy-‐based electricity generaLon, remote power units and other power generaLng units
n Chile Contract
n EPC contract for $98.9 million
n Scheduled for compleLon in mid-‐2017
n Shows technology ahracLve in hot locaLons
Electricity Segment
n Develops, builds, owns and operates geothermal and recovered energy-‐based power and sell the electricity they generate
n Owns and operates 650 MW in 18 geothermal and REG plants
n Increasing efficiency means higher margins
n Sarulla consorLum deal in Indonesia
n Commencement of operaLons of second phase of McGinness Hills
0
200
400
600
800
2012 2013 2014 2015
$MM
Revenue EBITDA
0
50
100
150
200
250
2012 2013 2014 2015
$MM
Revenue EBITDA

11
Catalysts
Compe88ve Advantage
Project Map
n Ormat energy converter
n Recovers energy with unused heat
n Used in binary and REG models
n Developed and patented GCCU power plants
n Gets extra energy out of steam
n Saves water, an important asset for steam power plants in the dry west
n EGS Technology
n “Fracking” geothermal resource for greater energy extracLon
n JV with DOE and GeothermEx
n VerLcal integraLon, a step-‐ahead technology, and geographical diversificaLon create a margin of safety for a potenLal investor
Future Projects
Source: 1. Ormat Website
n Backlog at $347.5 million
n Revenue source for next 2-‐3 years
n EsLmated to generate $180-‐$190 million in 2015
n Chile contract
n EPC contract for $98.9 million scheduled for mid-‐2017
n Shows technology ahracLve in hot locaLons
n Sarulla consorLum deal in Indonesia
n Ormat gets $254 million to build 330 MW Sarulla geothermal project in North Sumatra
0
20
40
60
2012 2013 2014
$M
EBITDA per kWh

12
Tesla Gigafactory
Impact on Ormat Technologies
Gigafactory Concept Design Key Points
Source: 1. Tesla Website 2. Renewable Energy World
n The factory will be based in Reno, Nevada
n Perfect environment for energy producLon solar and wind sources
n Enormous geothermal resources and proximity to lithium factories
n Ability to extract lithium from geothermal power plants’ wastewater
n Ormat, which is also based in Reno and supplies most of its energy needs, makes for a perfect partner to Tesla
n AssumpLons:
n Electricity price in Nevada – 10.17 cents per kWh
n Gigafactory power consumpLon once online – 100 MW
n Geothermal parLcipaLon – 30%
n Increase in revenue by $24MM or 4% growth
n PosiLve PR in light of partnership with Elon Musk will lead to popularizaLon of geothermal energy
“This factory will produce its own energy as well. Through combinaCon of geothermal, wind and solar, it will
produce all the energy that it needs.” – Elon Musk
Gigafactory Press Conference

IV. Valua8on

14
Comparable Analysis Electricity Segment P / E EV / EBITDA (in millions) Share Equity Enterprise Company Name Price Value Value CY15E CY16E CY15E CY16E NextEra Energy Partners LP $25.84 550 2,750 38.3 x 25.7 x 14.2 x 10.1 x NRG Yield $15.63 2,060 6,470 22.0 x 17.5 x 12.0 x 10.2 x Transalta Renewables $10.91 2,080 2,600 24.3 x 22.0 x 12.3 x 10.5 x Abengoa Yield $19.34 1,940 7,410 27.3 x 17.6 x 13.6 x 10.7 x
Maximum $25.84 2,080 7,410 38.3 x 25.7 x 14.2 x 10.7 x 75th PercenLle $20.97 2,065 6,705 30.1 x 22.9 x 13.8 x 10.6 x Median $17.49 2,000 4,610 25.8 x 19.8 x 13.0 x 10.4 x 25th PercenLle $14.45 1,593 2,713 23.7 x 17.6 x 12.2 x 10.2 x Minimum $10.91 550 2,600 22.0 x 17.5 x 12.0 x 10.1 x
Product Segment P / E EV / EBITDA (in millions) Share Equity Enterprise Company Name Price Value Value CY15E CY16E CY15E CY16E PowerSecure $12.33 277 283 7.6 x 21.1 x 14.9 x 8.1 x Fluor Corp $43.29 6,270 5,660 12.4 x 12.3 x 5.3 x 5.5 x KBR Inc. $16.68 2,410 1,800 17.2 x 15.5 x 6.9 x 6.5 x Chicago Bridge & Iron $42.60 4,530 6,380 9.3 x 9.5 x 6.1 x 6.4 x
Maximum $43.29 6,270 6,380 17.2 x 21.1 x 14.9 x 8.1 x 75th PercenLle $42.77 4,965 5,840 13.6 x 16.9 x 8.9 x 6.9 x Median $29.64 3,470 3,730 10.9 x 13.9 x 6.5 x 6.5 x 25th PercenLle $15.59 1,877 1,421 8.9 x 11.6 x 5.9 x 6.2 x Minimum $12.33 277 283 7.6 x 9.5 x 5.3 x 5.5 x
Product Segment <--------------------EBITDA Multipes------------------> 5.7 6.1 6.5 6.9 7.3
2015 Product EBITDA: 25.78 Implied EV: 146.95 157.26 167.57 177.88 188.19
Electricity Segment <--------------------EBITDA Multipes------------------> 12.2 12.6 13 13.4 13.8
2015 Electricity EBITDA: 224.92 Implied EV: 2744.02 2833.99 2923.96 3013.93 3103.90
Combined Valuation Combined EV: 2890.97 2991.25 3091.53 3191.81 3292.09
Assumed # of Shares (Mill): 49 Implied MCAP: 1831.97 1932.25 2032.53 2132.81 2233.09 Share Price: $37.39 $39.43 $41.48 $43.53 $45.57
Ormat Technologies $36.40 1,780 2,520 36.4 x 20.9 x 9.8 x 9.5 x
15
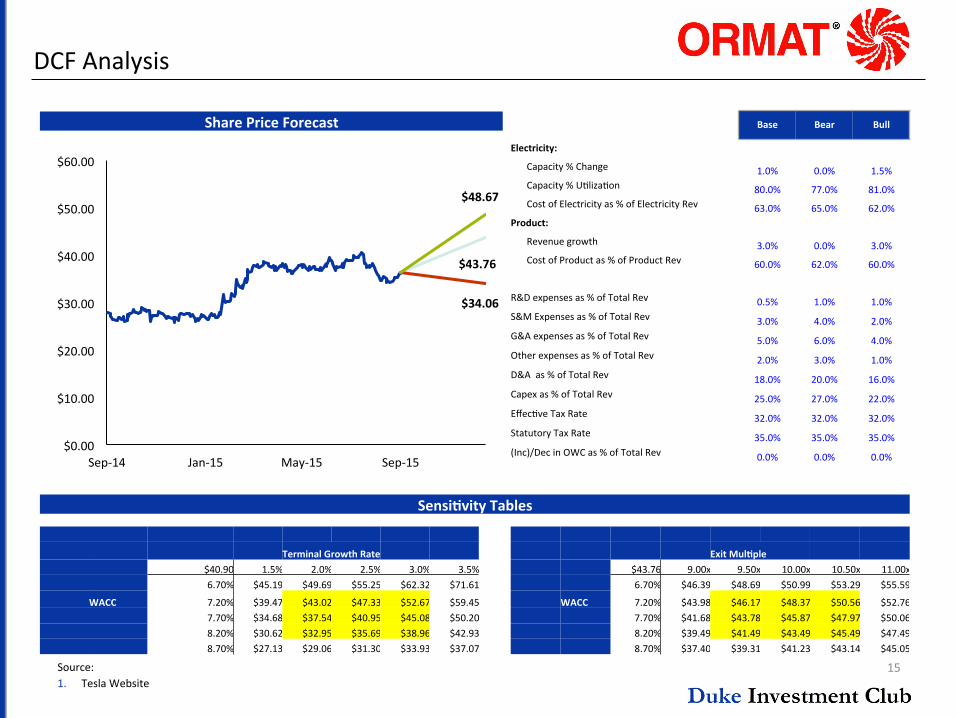
DCF Analysis
Source: 1. Tesla Website
$43.76
$34.06
$48.67
$0.00
$10.00
$20.00
$30.00
$40.00
$50.00
$60.00
Sep-‐14 Jan-‐15 May-‐15 Sep-‐15
Share Price Forecast
Sensi8vity Tables
Base Bear Bull
Electricity:
Capacity % Change 1.0% 0.0% 1.5% Capacity % ULlizaLon 80.0% 77.0% 81.0% Cost of Electricity as % of Electricity Rev 63.0% 65.0% 62.0%
Product:
Revenue growth 3.0% 0.0% 3.0% Cost of Product as % of Product Rev 60.0% 62.0% 60.0%
R&D expenses as % of Total Rev 0.5% 1.0% 1.0% S&M Expenses as % of Total Rev 3.0% 4.0% 2.0% G&A expenses as % of Total Rev 5.0% 6.0% 4.0% Other expenses as % of Total Rev 2.0% 3.0% 1.0% D&A as % of Total Rev 18.0% 20.0% 16.0% Capex as % of Total Rev 25.0% 27.0% 22.0% EffecLve Tax Rate 32.0% 32.0% 32.0% Statutory Tax Rate 35.0% 35.0% 35.0% (Inc)/Dec in OWC as % of Total Rev 0.0% 0.0% 0.0%
Terminal Growth Rate $40.90 1.5% 2.0% 2.5% 3.0% 3.5% 6.70% $45.19 $49.69 $55.25 $62.32 $71.61
WACC 7.20% $39.47 $43.02 $47.33 $52.67 $59.45 7.70% $34.68 $37.54 $40.95 $45.08 $50.20 8.20% $30.62 $32.95 $35.69 $38.96 $42.93 8.70% $27.13 $29.06 $31.30 $33.93 $37.07
Exit Mul8ple $43.76 9.00x 9.50x 10.00x 10.50x 11.00x 6.70% $46.39 $48.69 $50.99 $53.29 $55.59
WACC 7.20% $43.98 $46.17 $48.37 $50.56 $52.76 7.70% $41.68 $43.78 $45.87 $47.97 $50.06 8.20% $39.49 $41.49 $43.49 $45.49 $47.49 8.70% $37.40 $39.31 $41.23 $43.14 $45.05

16
ValuaLon Summary
Valua8on Methodology High Low Average
Discounted Cash Flow $48.67 $34.06 $43.76
Comps (EV/EBITDA) $45.57 $37.39 $41.48
Average Target Price $47.12 $35.73 $42.62
$48.67
$45.57
$47.12
$34.06
$37.39 $35.73
$43.76 $41.48 $42.62
$30.00
$35.00
$40.00
$45.00
$50.00
DCF Comps (EV/EBITDA) Average Target Price

V. Conclusion

18
Closing Thoughts
n Aqer significant research into Ormat Technologies Inc. (NYSE: ORA), we believe that Ormat is undervalued despite strong industry fundamentals and robust internal innova8on poised to promote future growth
n Ormat is a vicLm of a recent sell-‐off in renewable energy stocks due to a short-‐term decline in electricity prices
n Geothermal energy has oqen been overshadowed by the solar and wind sources, but increasing cost efficiency and stability of the resource will insure that geothermal has an hour to shine
n PosiLon as a market standard for quality of technology and improvement in EGS will become main drives for long-‐term growth of the company
n Ver8cal integra8on and geographical diversifica8on provide a safety net for a potenLal investor in terms of recurrent revenue stream
n Tesla gigafactory can become a short-‐term catalyst that will rejuvenate company’s image and spread its worldwide appeal
POST-‐DILIGENCE OPINION

VI. Appendix

20
DCF ProjecLons
2012 2013 2014 2015 2016 2017 2018 2019 2020 2021 2022 2023 2024 2025
Electricity:
Capacity % Change 9% 3% 1% 21% 5% 10% 5% 3% 3% 3% 1% 1% 1%
Capacity % ULlizaLon 78% 81% 80% 80% 80% 80% 80% 80% 80% 80% 80% 80% 80% 80%
Implied average sales price % Change -‐3% 11% -‐5% -‐3% -‐2% -‐1% 0% 1% 1% 1% 1% 1% 1%
Cost of Electricity as % of Electricity Rev 75% 71% 65% 63% 62% 61% 60% 59% 58% 57% 56% 55% 54% 53%
Product:
Revenue growth 9% -‐13% 3% 3% 3% 3% 2% 1% 1% 1% 1% 1% 1%
Cost of Product as % of Product Rev 72% 69% 62% 60% 60% 60% 60% 60% 60% 60% 60% 60% 60% 60%
R&D expenses as % of Total Rev 1% 1% 0.1% 1% 1% 1% 1% 1% 1% 1% 1% 1% 1% 1%
S&M Expenses as % of Total Rev 3% 5% 3% 3% 3% 3% 3% 3% 3% 3% 3% 3% 3% 3%
G&A expenses as % of Total Rev 6% 5% 5% 5% 5% 5% 5% 5% 5% 5% 5% 5% 5% 5%
Other expenses as % of Total Rev 1% 1% 3% 2% 2% 2% 2% 2% 2% 2% 2% 2% 2% 2%
D&A as % of Total Rev 20% 17% 18% 18% 18% 18% 18% 18% 18% 18% 18% 18% 18% 18%
Capex as % of Total Rev 46% 38% 27% 25% 24% 23% 22% 21% 20% 19% 18% 18% 18% 18%
EffecLve Tax Rate 1% 27% 32% 32% 32% 32% 32% 32% 32% 32% 32% 32% 32% 32%
Statutory Tax Rate 35% 35% 35% 35% 35% 35% 35% 35% 35% 35% 35% 35% 35% 35%
(Inc)/Dec in OWC as % of Total Rev 7% -‐7% 6% 0% 0% 0% 0% 0% 0% 0% 0% 0% 0% 0%