

Orlando MSA Market Overview - Landing Page Orlando MSA Market Overview Overview ... 7 Atlanta, GA...
22
Orlando MSA Market Overview July 2015
-
Upload
truongkhuong -
Category
Documents
-
view
214 -
download
0
Transcript of Orlando MSA Market Overview - Landing Page Orlando MSA Market Overview Overview ... 7 Atlanta, GA...

Orlando MSA Market OverviewJuly 2015

Orlando MSA Market Overview
Overview Labor Market Payroll Employment Commercial Real Estate Residential Real Estate Consumer Spending Business Sentiment Transportation Visitor Industry
Labor Market
2
4
6
8
10
12
14
2000 2001 2002 2003 2004 2005 2006 2007 2008 2009 2010 2011 2012 2013 2014 2015
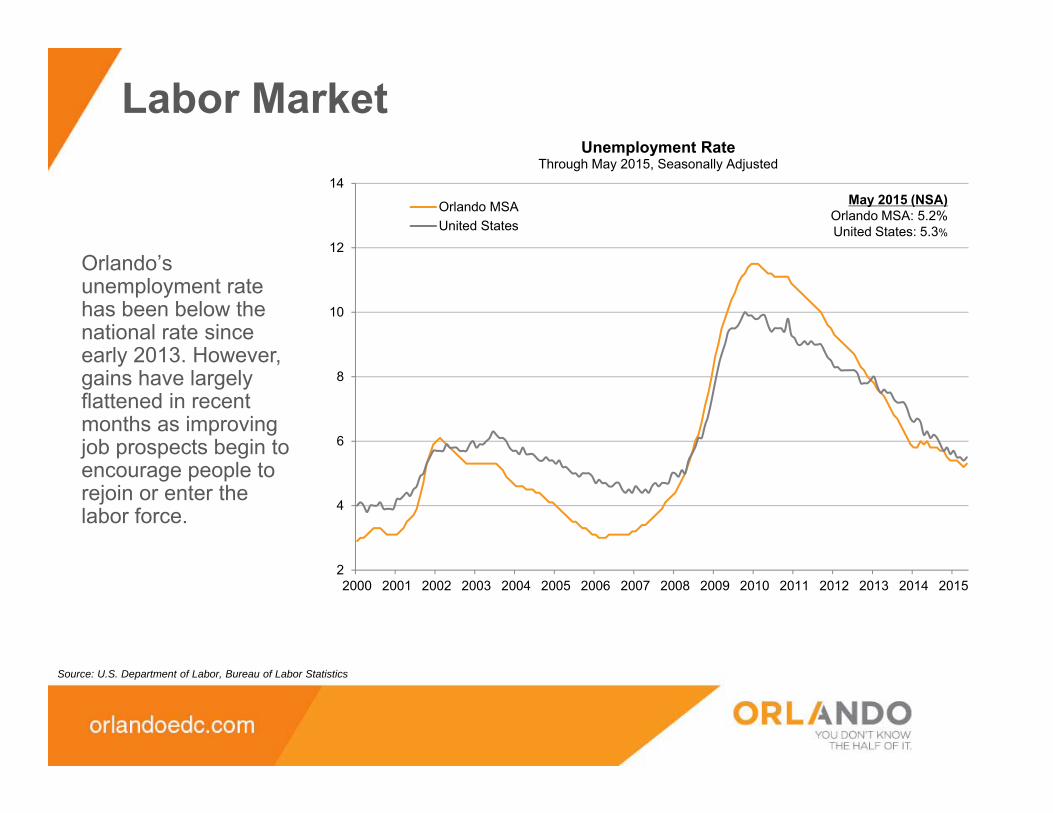
Unemployment RateThrough May 2015, Seasonally Adjusted
Orlando MSAUnited States
May 2015 (NSA)Orlando MSA: 5.2%United States: 5.3%
Source: U.S. Department of Labor, Bureau of Labor Statistics
Orlando’s unemployment rate has been below the national rate since early 2013. However, gains have largely flattened in recent months as improving job prospects begin to encourage people to rejoin or enter the labor force.
Labor Market
2,000
4,000
6,000
8,000
10,000
12,000
2005 2006 2007 2008 2009 2010 2011 2012 2013 2014 2015
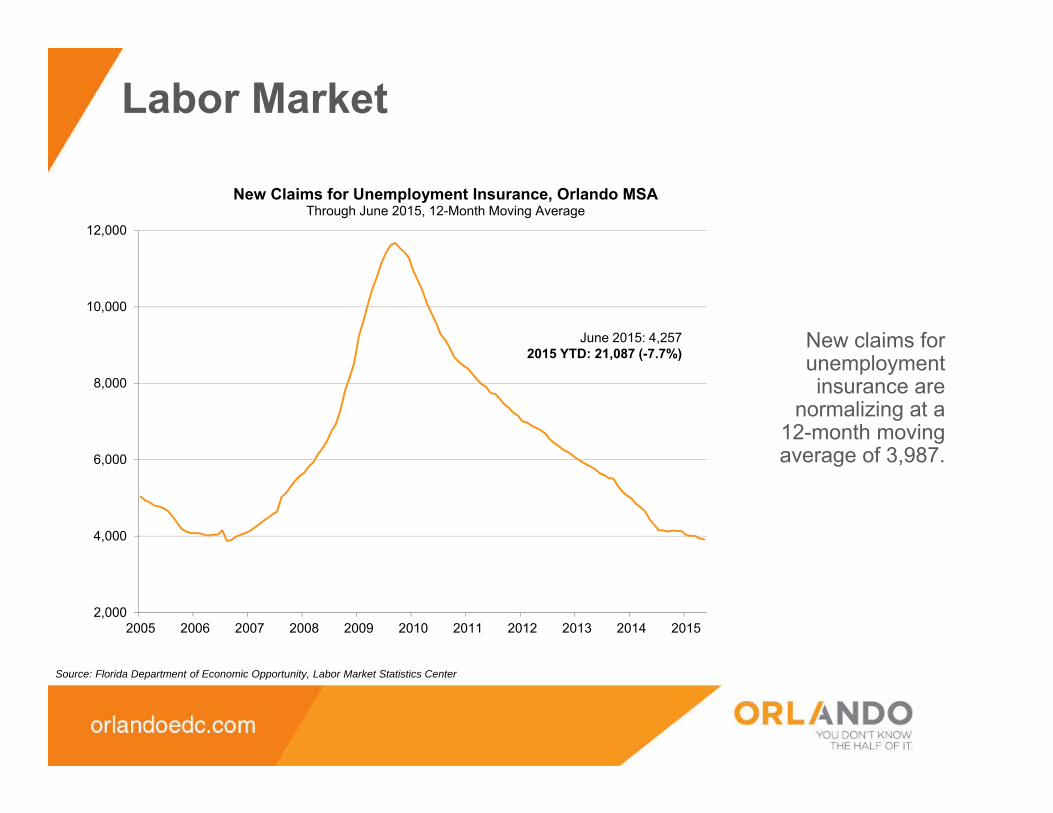
New Claims for Unemployment Insurance, Orlando MSAThrough June 2015, 12-Month Moving Average
Source: Florida Department of Economic Opportunity, Labor Market Statistics Center
June 2015: 4,2572015 YTD: 21,087 (-7.7%)
New claims for unemployment insurance are
normalizing at a 12-month moving average of 3,987.

Labor Market
-10%
-5%
0%
5%
10%
15%
20%
25%
30%
July August September October November December January February March April May June
New Job Postings, Orlando MSAThrough June 2015, Y/Y % Change
Source: WantedAnalytics
Year-to-date labor demand in the region, measured by new online job postings, increased 6% year-over-year in June.
June 2015: 25,959 (0.0%)2015 YTD: 159,991 (6.3%)
Payroll Employment
Source: U.S. Department of Labor, Bureau of Labor Statistics
800
850
900
950
1,000
1,050
1,100
1,150
1,200
2000 2001 2002 2003 2004 2005 2006 2007 2008 2009 2010 2011 2012 2013 2014 2015
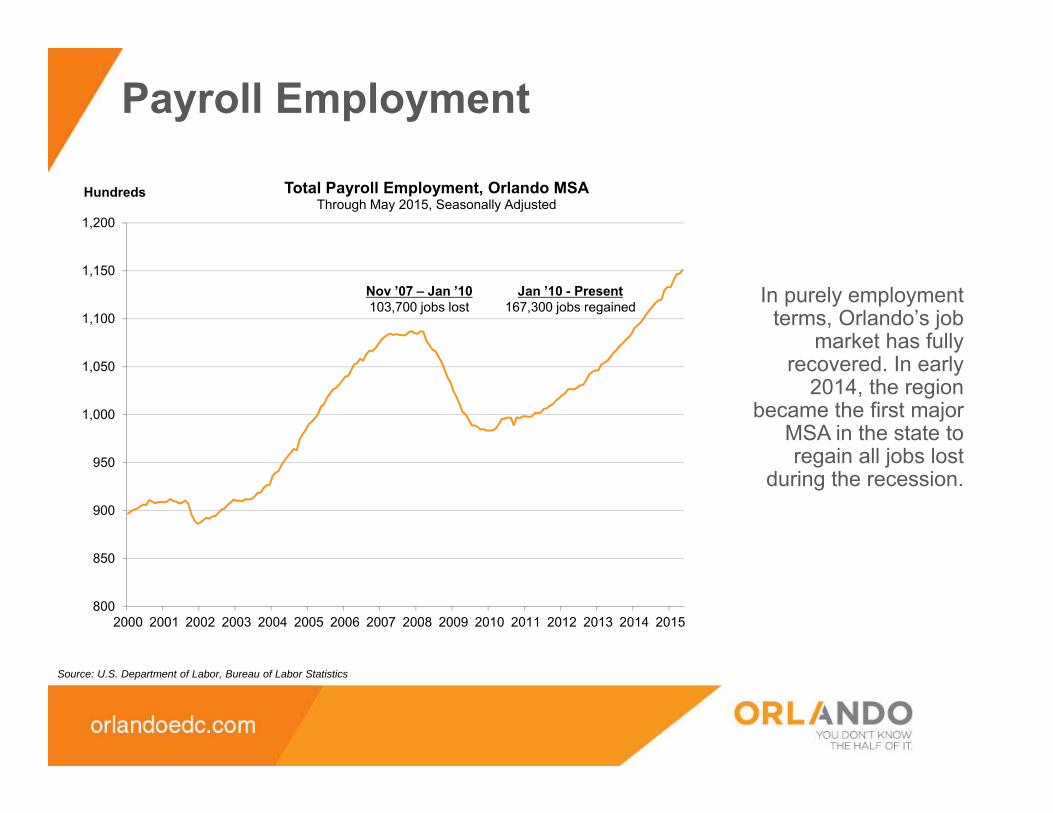
Hundreds Total Payroll Employment, Orlando MSAThrough May 2015, Seasonally Adjusted
Nov ’07 – Jan ’10103,700 jobs lost
Jan ’10 - Present167,300 jobs regained
In purely employment terms, Orlando’s job
market has fully recovered. In early
2014, the region became the first major
MSA in the state to regain all jobs lost
during the recession.
Payroll Employment
Source: U.S. Department of Labor, Bureau of Labor Statistics
-8
-4
0
4
8
2000 2001 2002 2003 2004 2005 2006 2007 2008 2009 2010 2011 2012 2013 2014 2015
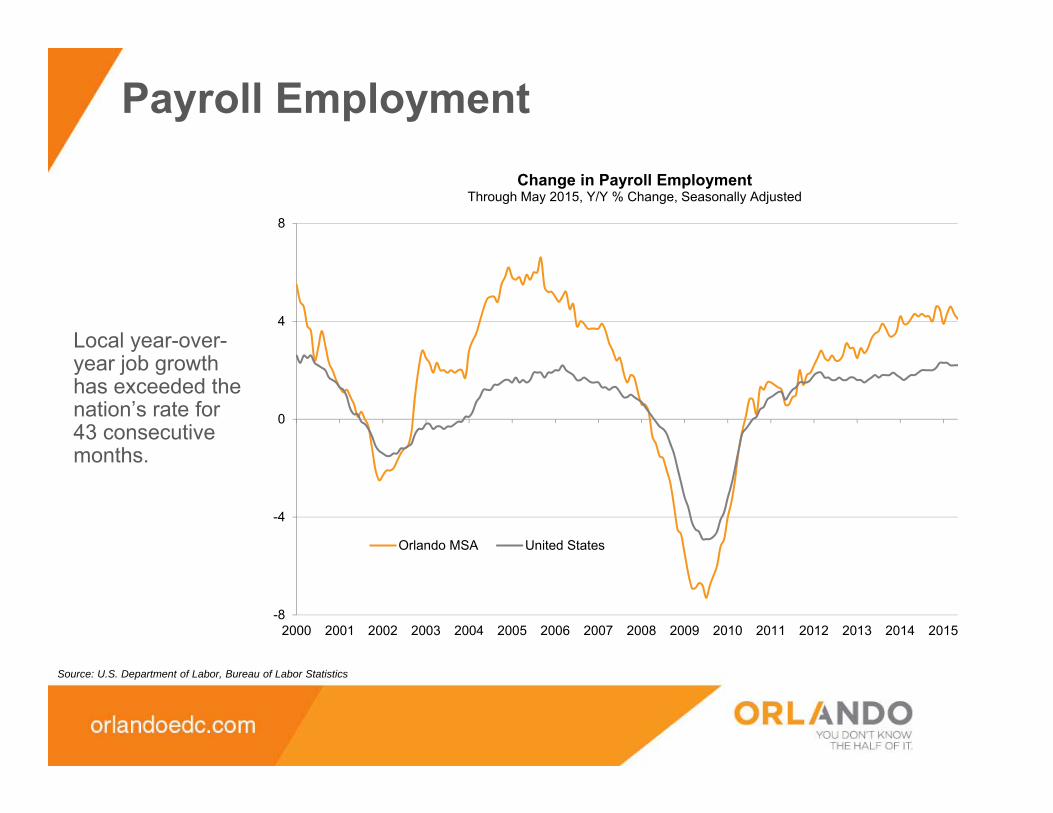
Change in Payroll EmploymentThrough May 2015, Y/Y % Change, Seasonally Adjusted
Orlando MSA United States
Local year-over-year job growth has exceeded the nation’s rate for 43 consecutive months.
Payroll Employment
Source: U.S. Department of Labor, Bureau of Labor Statistics
-30
-20
-10
0
10
20
2006 2007 2008 2009 2010 2011 2012 2013 2014 2015
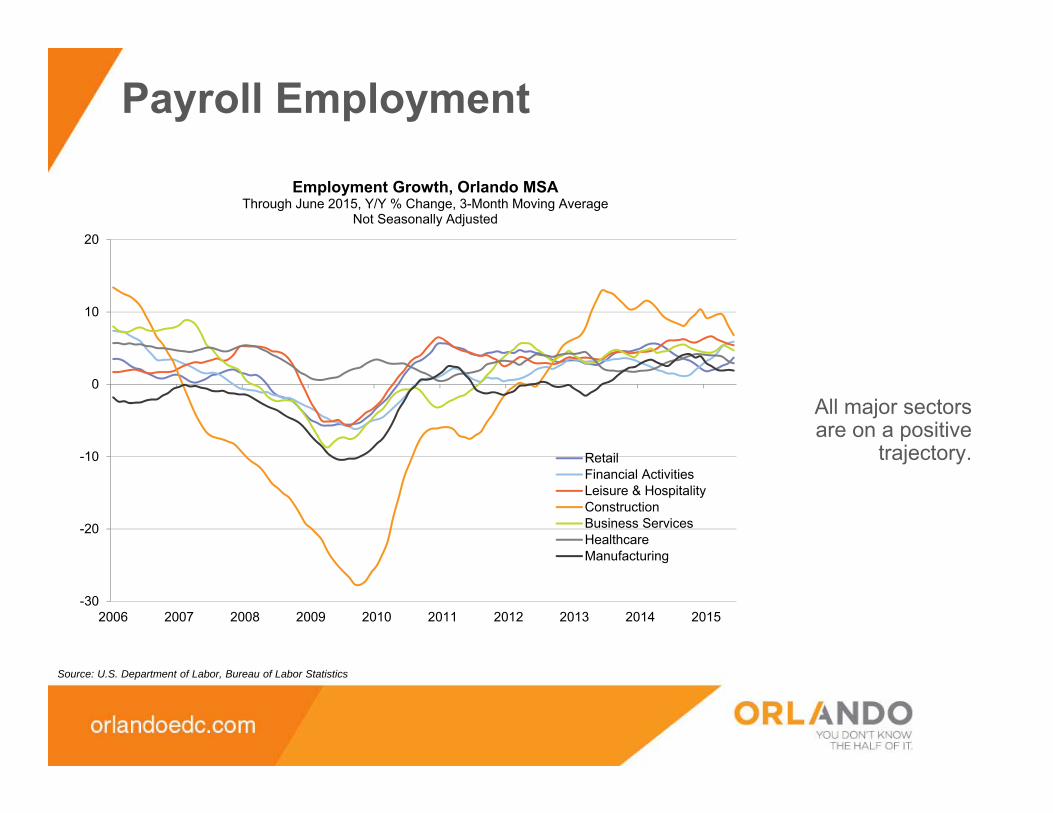
Employment Growth, Orlando MSAThrough June 2015, Y/Y % Change, 3-Month Moving Average
Not Seasonally Adjusted
RetailFinancial ActivitiesLeisure & HospitalityConstructionBusiness ServicesHealthcareManufacturing
All major sectors are on a positive
trajectory.
Payroll Employment
Source: U.S. Department of Labor, Bureau of Labor Statistics
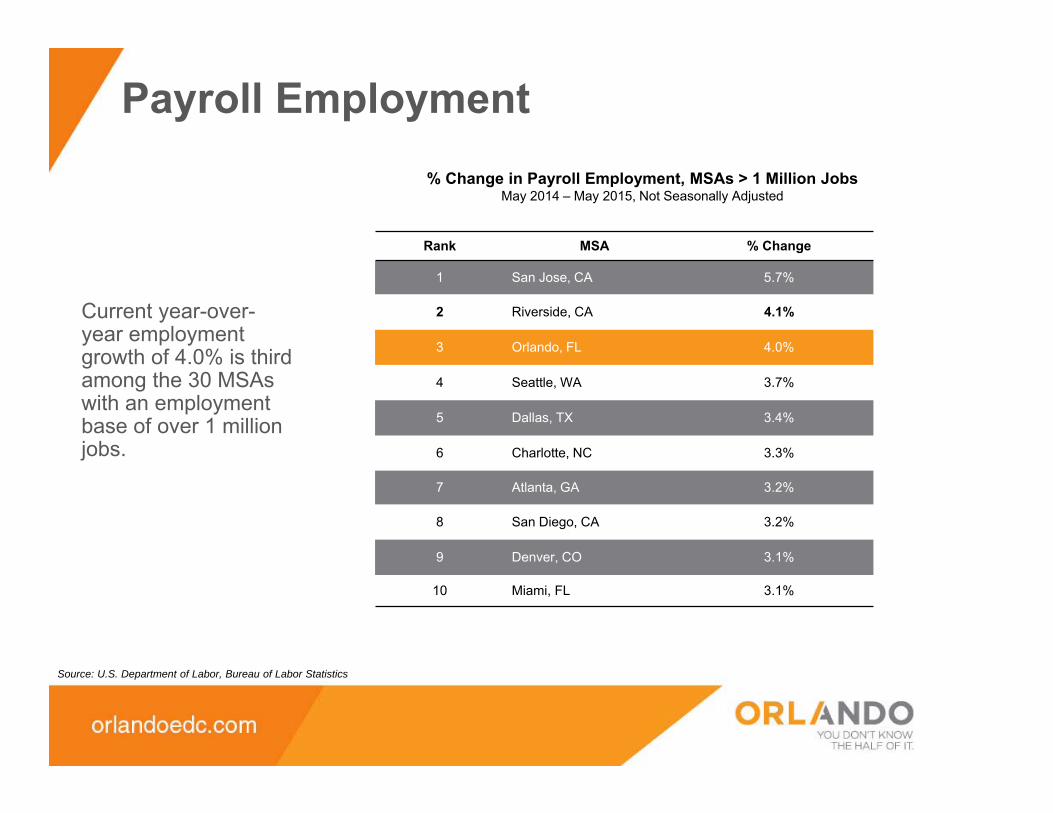
% Change in Payroll Employment, MSAs > 1 Million JobsMay 2014 – May 2015, Not Seasonally Adjusted
Current year-over-year employment growth of 4.0% is third among the 30 MSAs with an employment base of over 1 million jobs.
Rank MSA % Change
1 San Jose, CA 5.7%
2 Riverside, CA 4.1%
3 Orlando, FL 4.0%
4 Seattle, WA 3.7%
5 Dallas, TX 3.4%
6 Charlotte, NC 3.3%
7 Atlanta, GA 3.2%
8 San Diego, CA 3.2%
9 Denver, CO 3.1%
10 Miami, FL 3.1%
Payroll Employment
Source: U.S. Department of Labor, Bureau of Labor Statistics
1,400
-100
13,000
3,700
8,200
3,800
-200
1,500
6,500
4,400
900
4,100
1.3%
-0.3%
5.6%
2.8%
4.4%
5.4%
-0.8%
4.7% 4.8%
10.4%
2.3%
7.4%
-2%
0%
2%
4%
6%
8%
10%
12%
-1,000
2,000
5,000
8,000
11,000
14,000
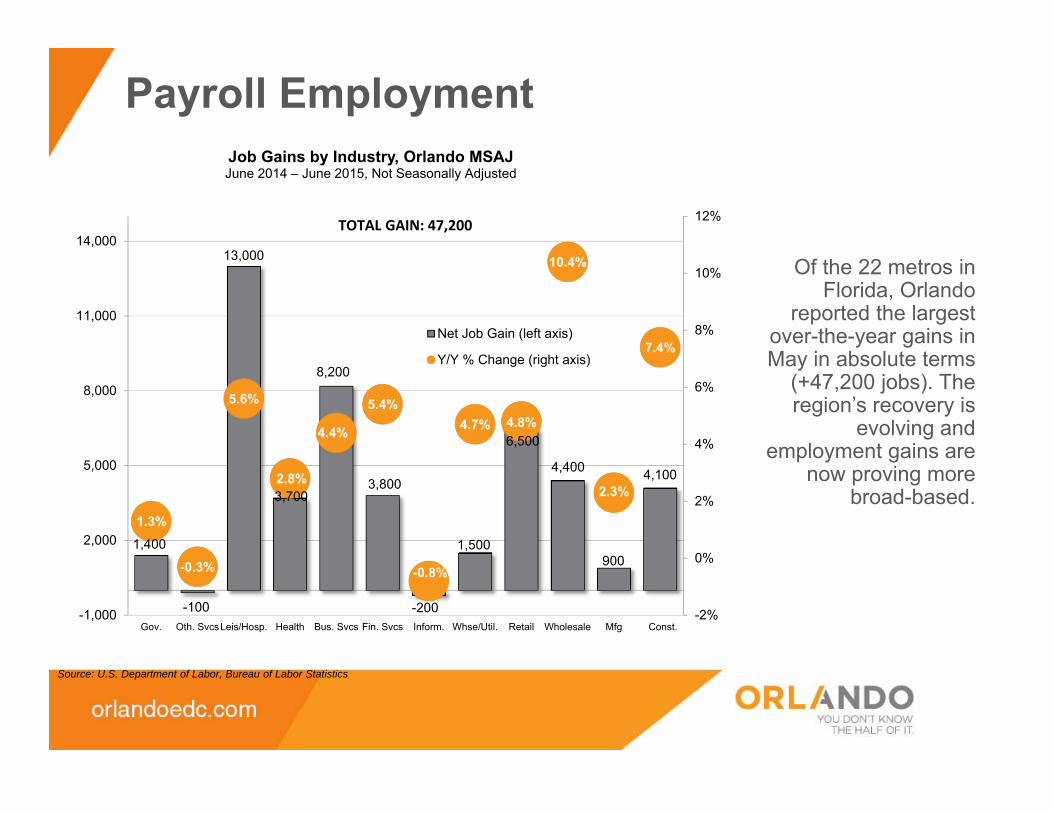
Gov. Oth. SvcsLeis/Hosp. Health Bus. Svcs Fin. Svcs Inform. Whse/Util. Retail Wholesale Mfg Const.
Job Gains by Industry, Orlando MSAJJune 2014 – June 2015, Not Seasonally Adjusted
Net Job Gain (left axis)
Y/Y % Change (right axis)
TOTAL GAIN: 47,200
Of the 22 metros in Florida, Orlando
reported the largest over-the-year gains in May in absolute terms
(+47,200 jobs). The region’s recovery is
evolving and employment gains are
now proving more broad-based.
Payroll Employment
Source: U.S. Department of Labor, Bureau of Labor Statistics
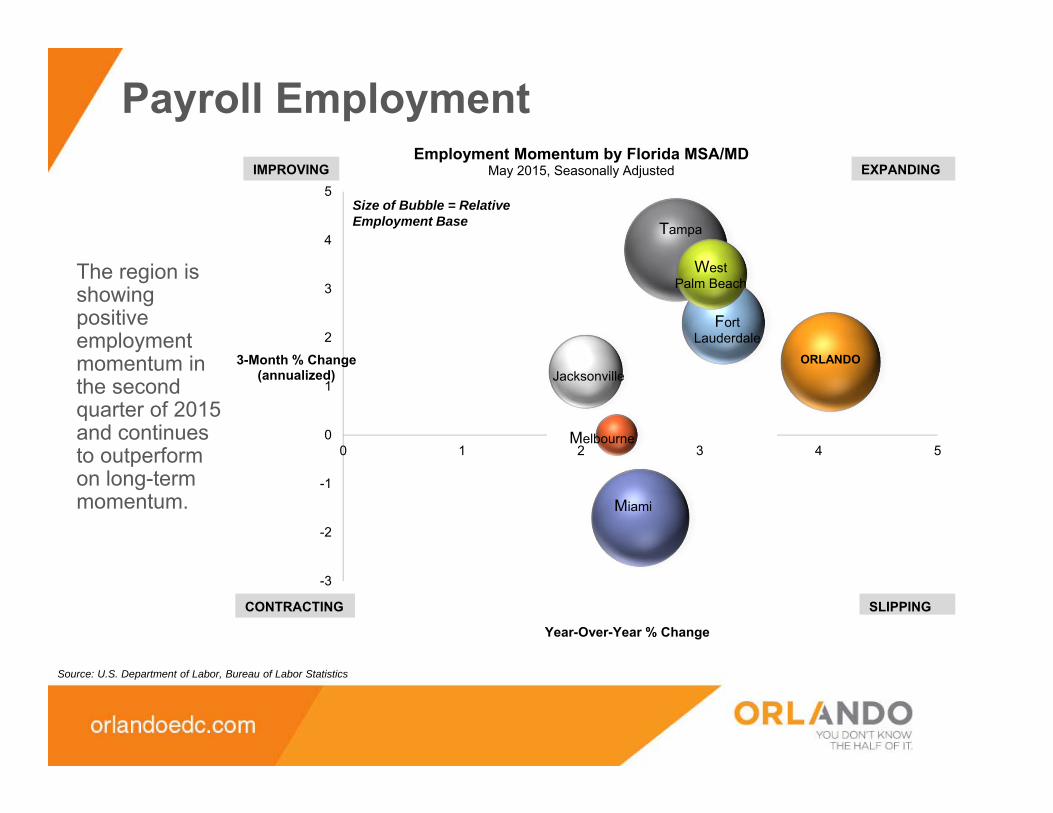
ORLANDOJacksonville
Tampa
Fort Lauderdale
West Palm Beach
Miami
Melbourne
-3
-2
-1
0
1
2
3
4
5
0 1 2 3 4 5
3-Month % Change (annualized)
Year-Over-Year % Change
Employment Momentum by Florida MSA/MDMay 2015, Seasonally Adjusted
Size of Bubble = Relative Employment Base
EXPANDING
CONTRACTING
IMPROVING
SLIPPING
The region is showing positive employment momentum in the second quarter of 2015 and continues to outperform on long-term momentum.
Commercial Real Estate
Source: CBRE
20.1%
19.0% 19.1%19.4%
19.0%
16.9%
$20.02
$19.72 $19.60 $19.62
$19.98$20.15
$18
$19
$20
$21
15%
17%
19%
21%
23%
25%
Q4 2010 Q4 2011 Q4 2012 Q4 2013 Q4 2014 Q2 2015
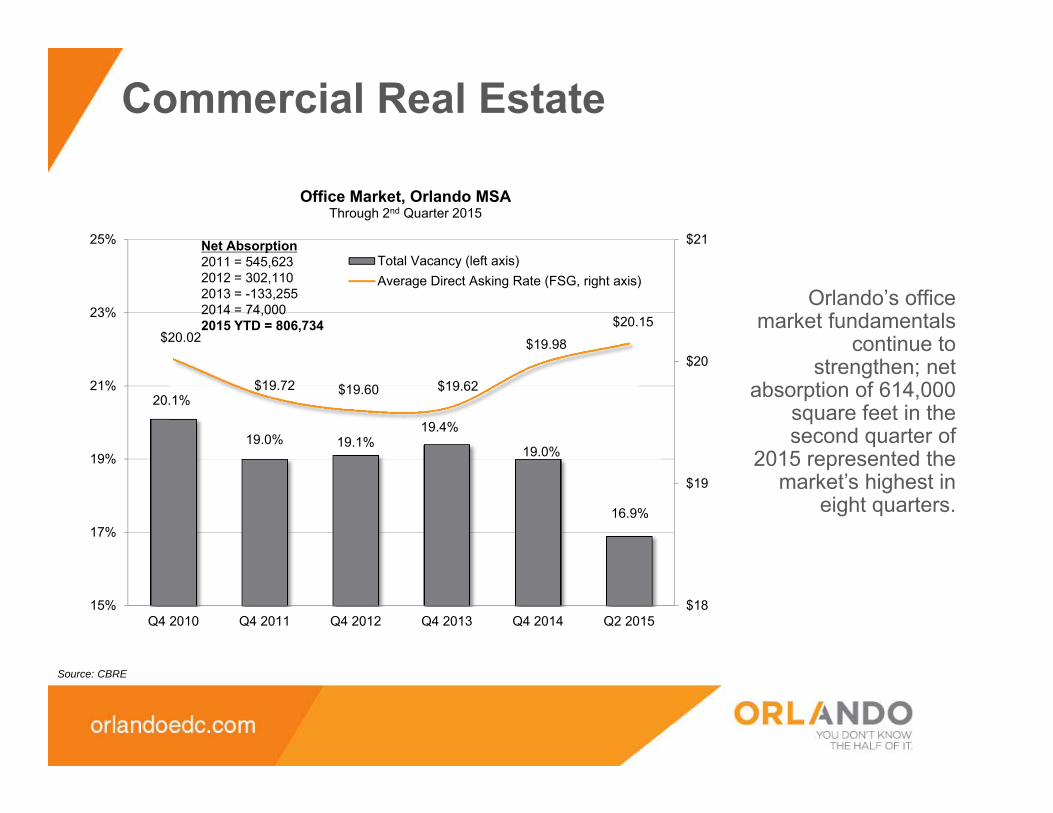
Office Market, Orlando MSAThrough 2nd Quarter 2015
Total Vacancy (left axis)Average Direct Asking Rate (FSG, right axis)
Net Absorption2011 = 545,6232012 = 302,1102013 = -133,2552014 = 74,0002015 YTD = 806,734
Orlando’s office market fundamentals
continue to strengthen; net
absorption of 614,000 square feet in the second quarter of
2015 represented the market’s highest in
eight quarters.
Commercial Real Estate
Source: CBRE
15.8% 15.6%
13.2%
11.7%
9.9%9.5%
$5.35$5.23 $4.94 $4.97 $5.21 $5.37
$0
$2
$4
$6
$8
5%
10%
15%
20%
25%
Q4 2010 Q4 2011 Q4 2012 Q4 2013 Q4 2014 Q2 2015
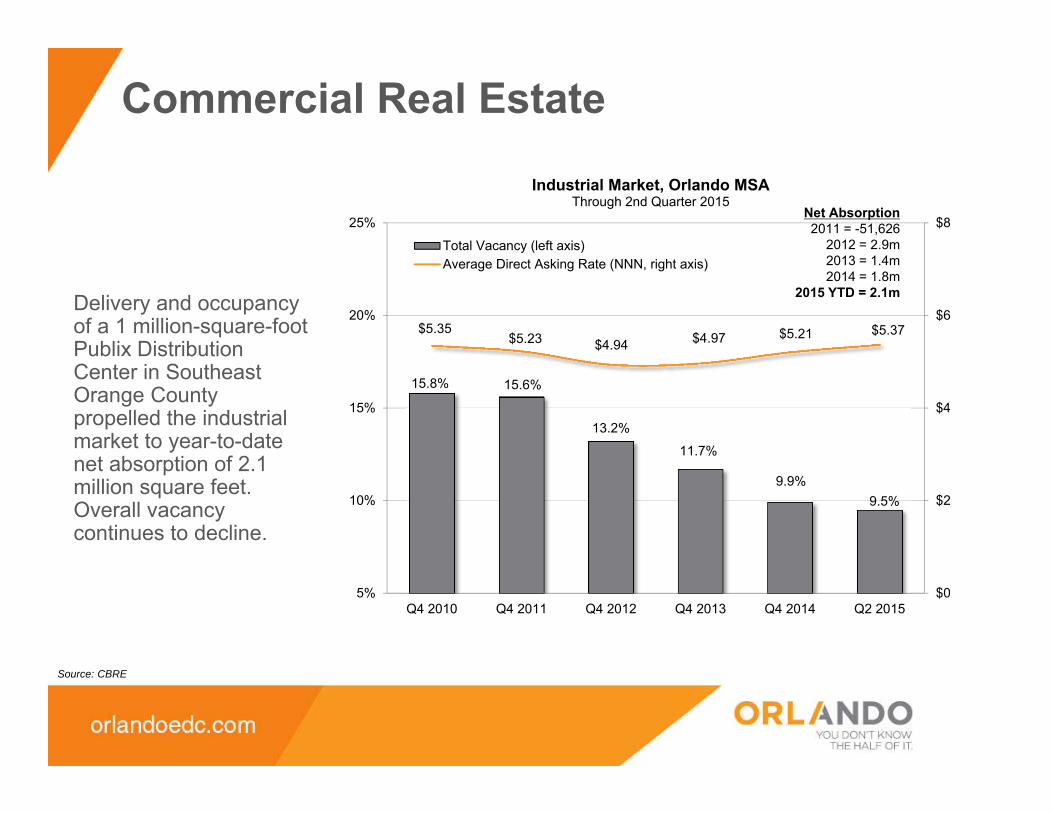
Industrial Market, Orlando MSAThrough 2nd Quarter 2015
Total Vacancy (left axis)Average Direct Asking Rate (NNN, right axis)
Net Absorption2011 = -51,626
2012 = 2.9m2013 = 1.4m2014 = 1.8m
2015 YTD = 2.1mDelivery and occupancy of a 1 million-square-foot Publix Distribution Center in Southeast Orange County propelled the industrial market to year-to-date net absorption of 2.1 million square feet. Overall vacancy continues to decline.

Residential Real Estate
Source: Orlando Regional Realtor Association
0
1,000
2,000
3,000
4,000
-60%
-40%
-20%
0%
20%
40%
60%
80%
100%
12-Month Moving Average
Y/Y % Change3-Month Moving Average
Home Sales vs. Median Home Price, Orlando MSAThrough June 2015
Median Sales Price (left axis)Homes Sales (right axis) Home sales have an
opportunity over the next 12 months to
settle into a pattern of more traditional
growth as the impact of both institutional
investment and distressed sales
wanes.

Residential Real Estate
Source: U.S. Census Bureau
0
5,000
10,000
15,000
20,000
25,000
30,000
2000 2001 2002 2003 2004 2005 2006 2007 2008 2009 2010 2011 2012 2013 2014 2015
Housing Permits, Orlando MSAUnits Authorized, Through May 2015
12-Month Moving Average Annualized Rate
Single-Family Units
Multi-Family UnitsReports of a construction bubble appear premature. Although multi-family permitting is on the rise, total activity remains below historic norms.
Consumer Spending
80
100
120
140
160
180
200
2000 2001 2002 2003 2004 2005 2006 2007 2008 2009 2010 2011 2012 2013 2014 201550
70
90
110
130
150
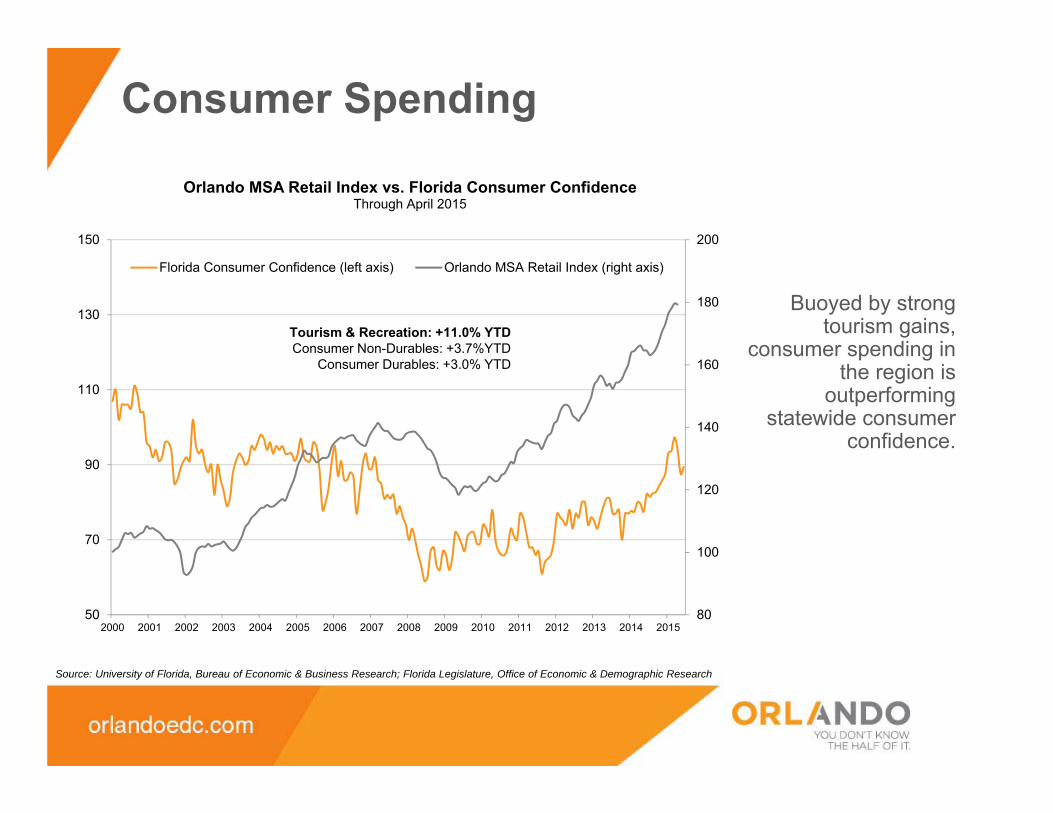
Orlando MSA Retail Index vs. Florida Consumer ConfidenceThrough April 2015
Florida Consumer Confidence (left axis) Orlando MSA Retail Index (right axis)
Tourism & Recreation: +11.0% YTDConsumer Non-Durables: +3.7%YTD
Consumer Durables: +3.0% YTD
Source: University of Florida, Bureau of Economic & Business Research; Florida Legislature, Office of Economic & Demographic Research
Buoyed by strong tourism gains,
consumer spending in the region is
outperforming statewide consumer
confidence.
Business Sentiment
Source: Florida Department of Revenue
-30%
-20%
-10%
0%
10%
20%
30%
Jan-05 Jan-06 Jan-07 Jan-08 Jan-09 Jan-10 Jan-11 Jan-12 Jan-13 Jan-14 Jan-15
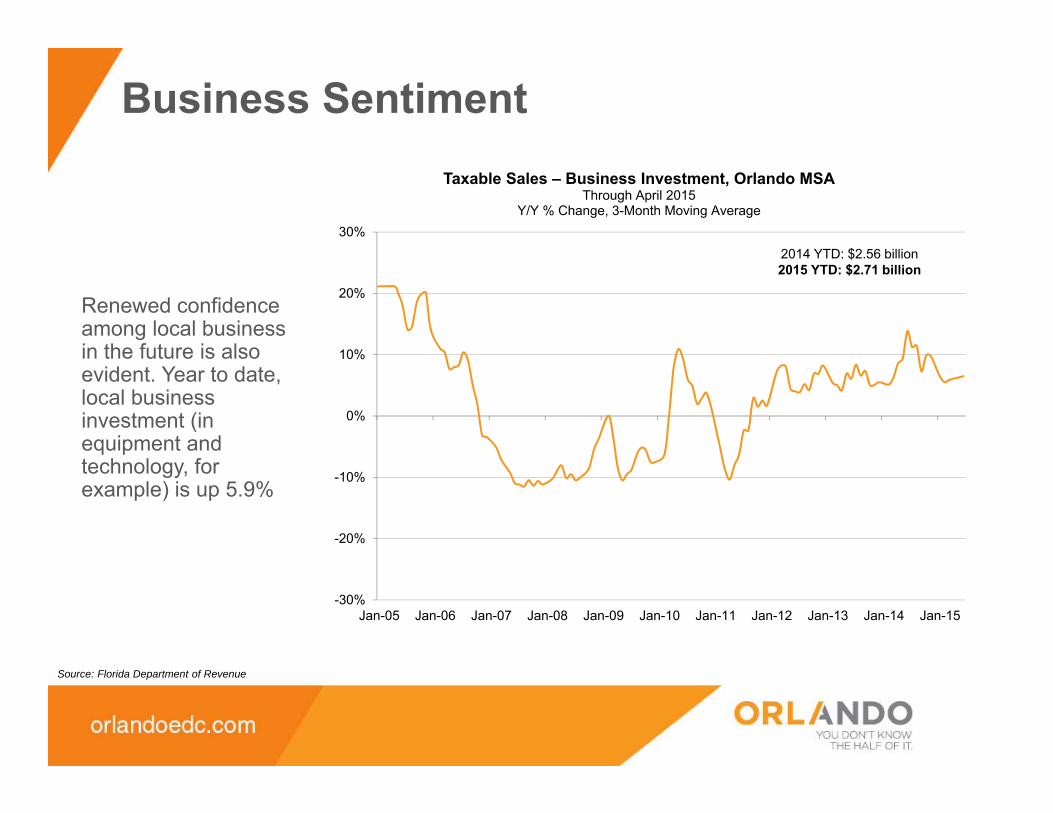
Taxable Sales – Business Investment, Orlando MSAThrough April 2015
Y/Y % Change, 3-Month Moving Average
2014 YTD: $2.56 billion2015 YTD: $2.71 billion
Renewed confidence among local business in the future is also evident. Year to date, local business investment (in equipment and technology, for example) is up 5.9%
Transportation
0%
2%
4%
6%
8%
10%
June July August September October November December January February March April May
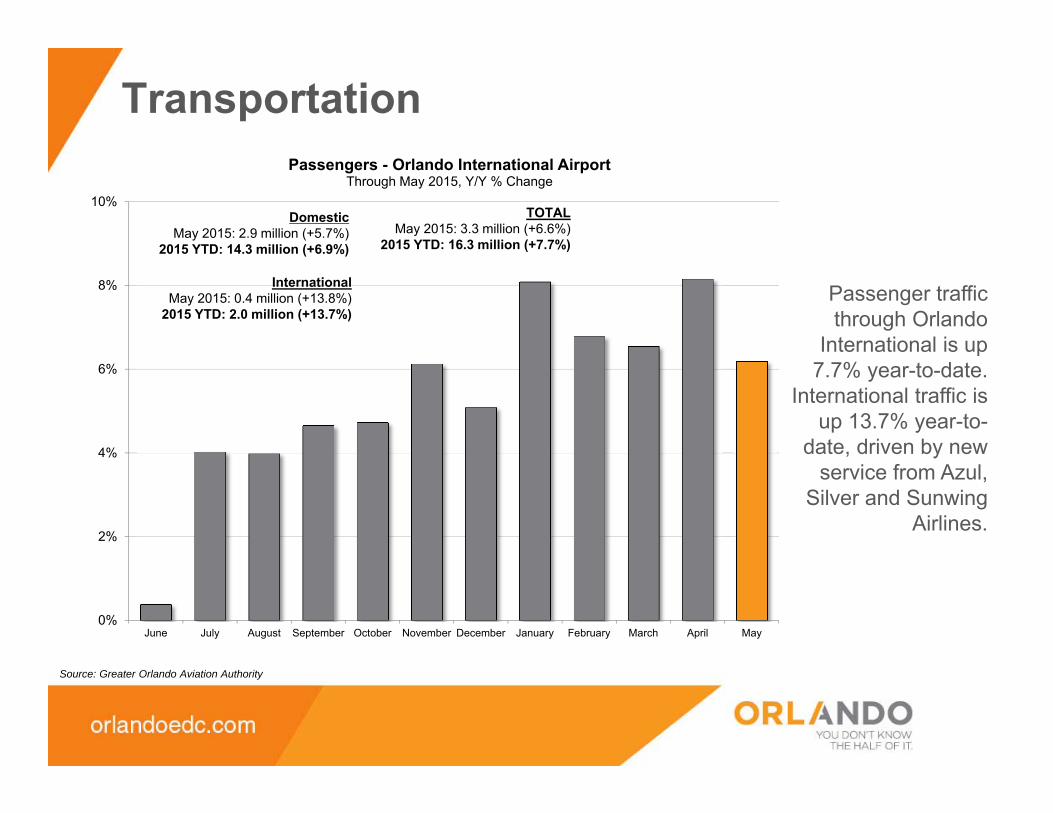
Passengers - Orlando International AirportThrough May 2015, Y/Y % Change
DomesticMay 2015: 2.9 million (+5.7%)
2015 YTD: 14.3 million (+6.9%)
Source: Greater Orlando Aviation Authority
Passenger traffic through Orlando
International is up 7.7% year-to-date.
International traffic is up 13.7% year-to-
date, driven by new service from Azul,
Silver and SunwingAirlines.
InternationalMay 2015: 0.4 million (+13.8%)
2015 YTD: 2.0 million (+13.7%)
TOTALMay 2015: 3.3 million (+6.6%)
2015 YTD: 16.3 million (+7.7%)
Transportation
-5%
0%
5%
10%
15%
20%
25%
June July August September October November December January February March April May
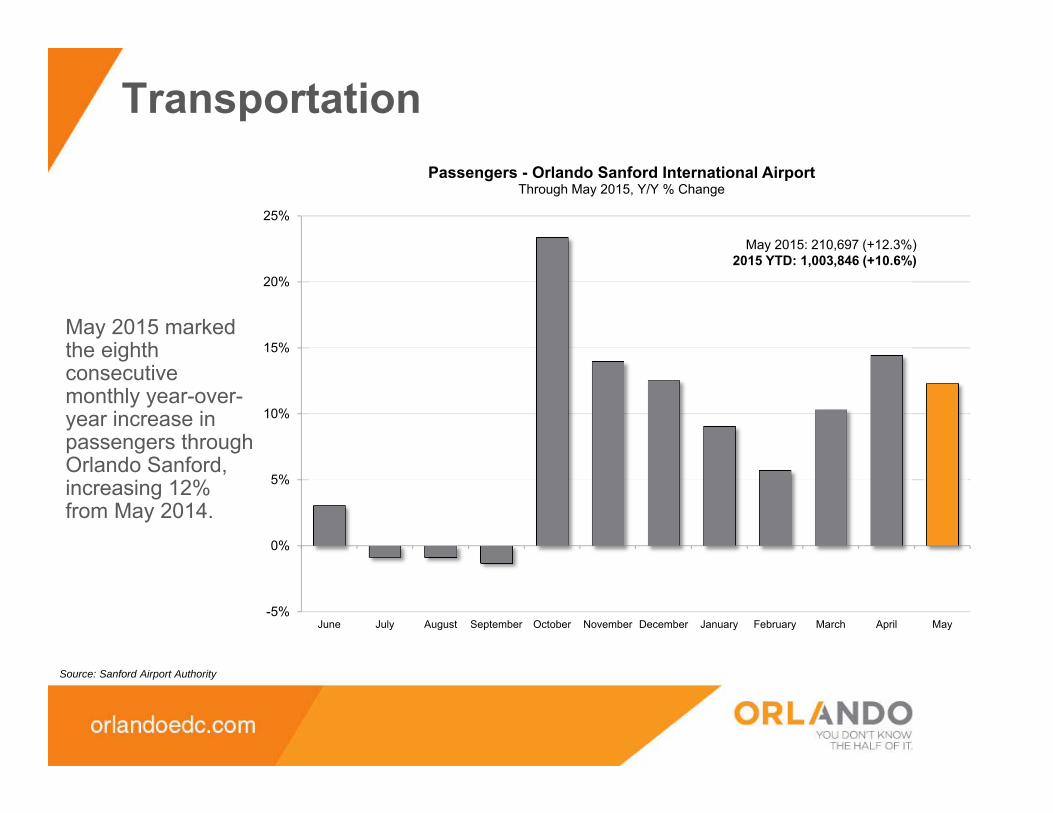
Passengers - Orlando Sanford International AirportThrough May 2015, Y/Y % Change
May 2015: 210,697 (+12.3%)2015 YTD: 1,003,846 (+10.6%)
Source: Sanford Airport Authority
May 2015 marked the eighth consecutive monthly year-over-year increase in passengers through Orlando Sanford, increasing 12% from May 2014.
Visitor Industry
Source: Visit Orlando
0%
2%
4%
6%
8%
10%
June July August September October November December January February March April May0
2
4
6
8
10
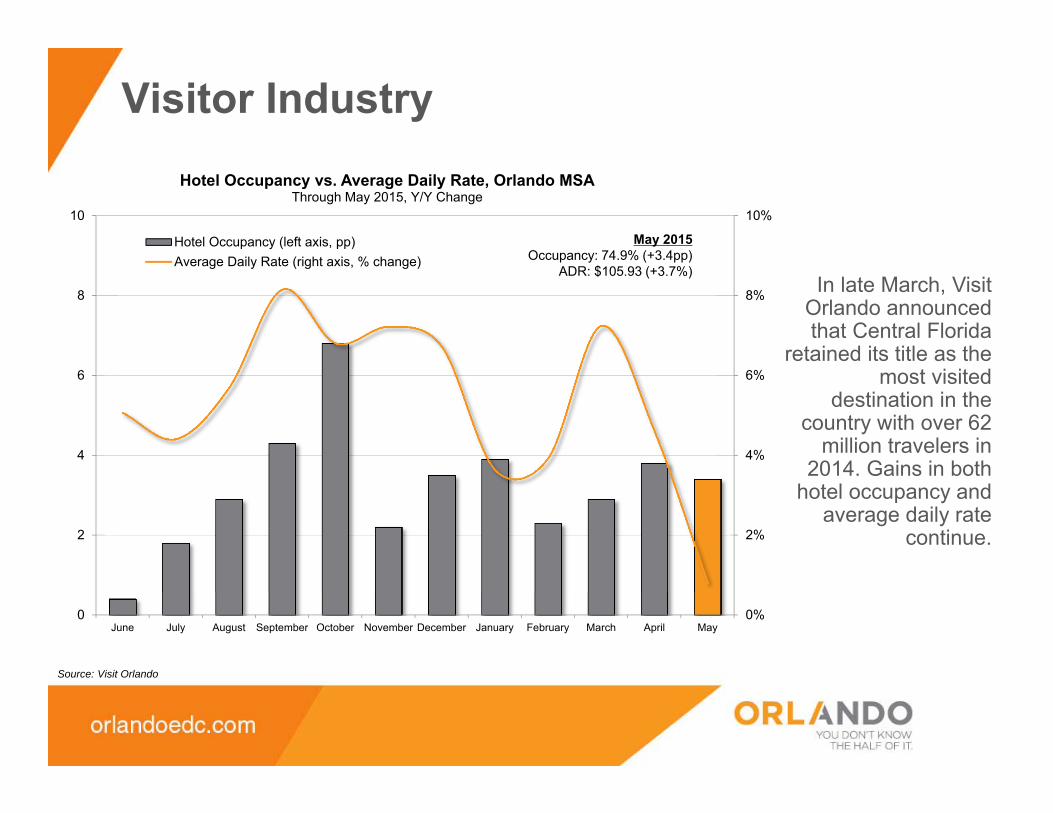
Hotel Occupancy vs. Average Daily Rate, Orlando MSAThrough May 2015, Y/Y Change
Hotel Occupancy (left axis, pp)Average Daily Rate (right axis, % change)
May 2015Occupancy: 74.9% (+3.4pp)
ADR: $105.93 (+3.7%)In late March, Visit
Orlando announced that Central Florida
retained its title as the most visited
destination in the country with over 62
million travelers in 2014. Gains in both
hotel occupancy and average daily rate
continue.