Originally published as: Bock, G., Wylegalla, K...
8
Originally published as: Bock, G., Wylegalla, K., Stromeyer, D., Grünthal, G. (2002): The Wittenburg MW = 3.1 Earthquake of May 19, 2000: an unusual tectonic event in northeastern Germany - In: Korn, W. (Eds.), Ten Years of German Regional Seismic Network (GRSN), Kommission für Geowissenschaftliche Gemeinschaftsforschung (DFG), 220-224
Transcript of Originally published as: Bock, G., Wylegalla, K...

Originally published as: Bock, G., Wylegalla, K., Stromeyer, D., Grünthal, G. (2002): The Wittenburg MW = 3.1 Earthquake of May 19, 2000: an unusual tectonic event in northeastern Germany - In: Korn, W. (Eds.), Ten Years of German Regional Seismic Network (GRSN), Kommission für Geowissenschaftliche Gemeinschaftsforschung (DFG), 220-224

6 Source Mechanism Studies
220
6.6 The Wittenburg Mw = 3.1 Earthquake of May 19,2000: An Unusual Tectonic Event in NortheasternGermany
Günter Bock, Kurt Wylegalla, Dietrich Stromeyer,and Gottfried Grünthal
German earthquake catalogues (Leydecker 1986, Grünthal 1988)list three significant historical earthquakes in the lowlands ofnorthern Germany that are documented by macroseismic obser-vations: the 1323 Lüneburg event, an earthquake 1410 nearWittstock in northeastern Germany (the “Prignitz” earthquake),and the 1770 event at Alfhausen (western Lower Saxony). The1410 Prignitz earthquake, however, is no longer listed in morerecent earthquake catalogues (Grünthal et al. 1998, Leydecker2001) as it was most likely located near Magdeburg (Grünthaland Meier 1995).
The Wittenburg earthquake was the first instrumentally re-corded event in northeastern Germany. It was well recorded byGRSN stations (Fig. 6.17) and also by stations of other networks(Gorleben network, Danish Seismograph Network, Fig. 6.18). Itwas not felt as evidenced by macroseismic inquiries carried outimmediately after the event (G. Leydecker, pers. comm.). We useddata of available seismograph stations (mainly GRSN stations) toderive the source parameters of the event (Tab. 6.2) and to inves-tigate its origin (tectonic or non-tectonic). The outcome of ourstudy illustrates the potential of the GRSN to monitor seismicactivity in northern Germany.
In a first step, we relocated the event with the earthquake lo-cation program Hypo71 (Lee and Lahr 1972). P- and S-wave arri-val times were carefully read from the digital seismograms usinga variety of filter settings that were chosen to optimize the signal-to-noise ratio of P- and S-phases. The crustal model used in thelocation was based an the results of the BASIN96 profile (Bayer

6.6 The Wittenburg Mw = 3.1 Earthquake of May 19, 2000
221
et al., 1999). An important result of the hypocentre location wasthe relatively great depth, between 16 and 17 km, in the pre-Permian basement. This depth estimate is not well constrainedby travel times because the nearest station (BSEG) is 62 kmaway from the epicentre. Varying the crustal model and pickedP- and S-wave arrival times within uncertainty limits yieldeduncertainties of the hypocentral locations that are only 2-3 kmfor both, epicentre and focal depth. The calculated standard er-rors are 3-4 km for the epicentre and 2-3 km for depth. The epi-central location is well constrained because the azimuthal gap inthe station coverage is only 60°. The rms reduction for the in-ferred great depth is 48% relative to a surface focus, and 36%relative to 5 km depth. The large focal depth is also consistentwith the fact that the earthquake was not felt.
Figure 6.17: Unprocessed GRSN broadband seismograms (vertical component) ofthe P-waves for the Wittenburg earthquake. Note the clear dilational polarities ofPn at MOX, CLZ, and CLZ. The timescale is valid for the BSEG record only wherethe first arriving phase is Pg. The other seismograms have been aligned an the Pgonset of BSEG.
Wittenburg. 19 May 2000,19:22:41.4 UT
6 Source Mechanism Studies
222
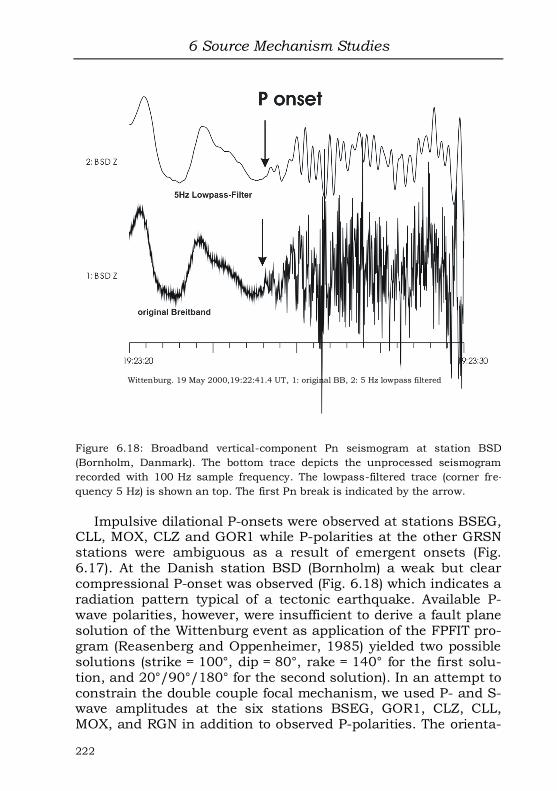
Impulsive dilational P-onsets were observed at stations BSEG,CLL, MOX, CLZ and GOR1 while P-polarities at the other GRSNstations were ambiguous as a result of emergent onsets (Fig.6.17). At the Danish station BSD (Bornholm) a weak but clearcompressional P-onset was observed (Fig. 6.18) which indicates aradiation pattern typical of a tectonic earthquake. Available P-wave polarities, however, were insufficient to derive a fault planesolution of the Wittenburg event as application of the FPFIT pro-gram (Reasenberg and Oppenheimer, 1985) yielded two possiblesolutions (strike = 100°, dip = 80°, rake = 140° for the first solu-tion, and 20°/90°/180° for the second solution). In an attempt toconstrain the double couple focal mechanism, we used P- and S-wave amplitudes at the six stations BSEG, GOR1, CLZ, CLL,MOX, and RGN in addition to observed P-polarities. The orienta-
Figure 6.18: Broadband vertical-component Pn seismogram at station BSD(Bornholm, Danmark). The bottom trace depicts the unprocessed seismogramrecorded with 100 Hz sample frequency. The lowpass-filtered trace (corner fre-quency 5 Hz) is shown an top. The first Pn break is indicated by the arrow.
Wittenburg. 19 May 2000,19:22:41.4 UT, 1: original BB, 2: 5 Hz lowpass filtered
6.6 The Wittenburg Mw = 3.1 Earthquake of May 19, 2000
223
tion of the double couple described by strike , dip δ and rake λof the equivalent shear dislocation was determined by a gridsearch over the parameter space 0° ≤ ≤ 360°, -90° ≤ λ ≤ 90°,and 0° ≤ δ ≤ 90°. A misfit function defined by a logarithmic l1norm between observed and theoretical amplitudes was mini-mized as function of , δ, λ. The reflectivity method (Fuchs andMüller 1971, Kind 1979) was employed to calculate theoreticalamplitudes. The method is described at greater detail by Bock(1992) and Bock et al. (1994).
P-wave amplitudes were measured an the vertical componentsof the BSEG and GOR1 records, while Sg amplitudes were meas-ured on all three components at BSEG, CLZ, CLL, MOX andRGN. At GOR1 we used only the Sg amplitude on the transverse(SH) component. To obtain a good signal-to-noise ratio recordshad to be bandpass-filtered between 0.3 Hz and 2 Hz. The fre-quency range of the signals does not allow an inversion of themoment tensor utilizing the full waveforms. However, the ampli-tudes of the initial Pg and Sg onsets are probably less likely in-fluenced by unmodelled structural effects. We used as input datafor the inversion the zero-to-peak amplitudes of Pg and Sg onsetsat BSEG and GOR1. For GOR1 we used relative Pg/Sg ampli-tudes in the inversion. For the other stations we measured themaximum peak-to-peak amplitude of Sg, but these stations weregiven only 12.5% the weight assigned to the BSEG and GOR1data because of their large epicentral distance (>1.7°) and be-cause the Sg waveforms were more complicated than at BSEG.
The parameters of the focal mechanism solution are given inTab. 6.2; this solution comes very close to the first possible solu-tion indicated by polarities only. It is a strike slip solution with adip slip component. The error bounds of strike and dip directionsof the nodal planes are estimated from the width of the misfitfunction; they are given in Tab. 6.2. The seismic moment is 5.0 ·1013 Nm based on all data used. This corresponds to a momentmagnitude Mw = 3.1. The trend of the P-axis is approximately N-S which is in agreement with the directions of the regional stressfield east of the Elbe river (Fig. 6.19). It plunges 31° from thehorizontal. The Pn takeoff angles at the stations CLL, CLZ, andMOX are close to the P-axis; this agrees well with the clear dila-tional Pn onsets observed at these stations. Similarly, the com-pressional Pn onset at BSD is consistent witb the fact that itstakeoff direction is close to the T-axis of the focal mechanism.
6 Source Mechanism Studies
224
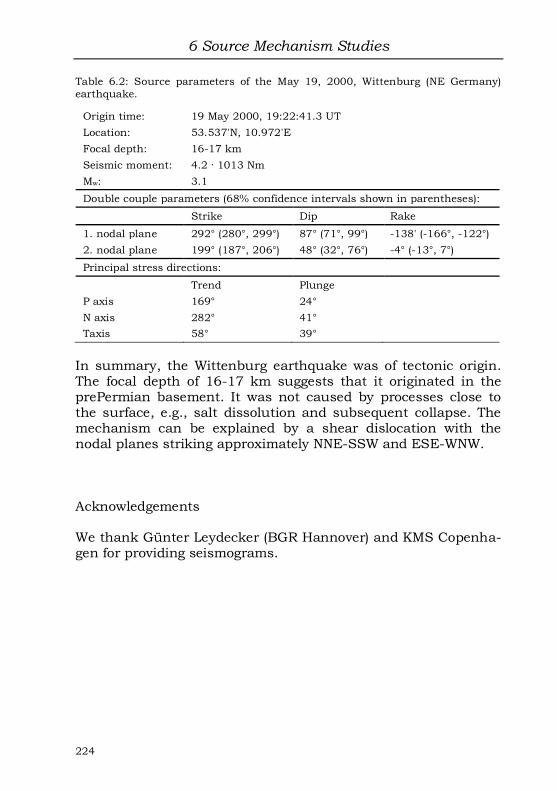
Table 6.2: Source parameters of the May 19, 2000, Wittenburg (NE Germany)earthquake.
Origin time: 19 May 2000, 19:22:41.3 UT
Location: 53.537'N, 10.972'E
Focal depth: 16-17 km
Seismic moment: 4.2 · 1013 Nm
Mw: 3.1
Double couple parameters (68% confidence intervals shown in parentheses):
Strike Dip Rake
1. nodal plane 292° (280°, 299°) 87° (71°, 99°) -138' (-166°, -122°)
2. nodal plane 199° (187°, 206°) 48° (32°, 76°) -4° (-13°, 7°)
Principal stress directions:
Trend Plunge
P axis 169° 24°
N axis 282° 41°Taxis 58° 39°
In summary, the Wittenburg earthquake was of tectonic origin.The focal depth of 16-17 km suggests that it originated in theprePermian basement. It was not caused by processes close tothe surface, e.g., salt dissolution and subsequent collapse. Themechanism can be explained by a shear dislocation with thenodal planes striking approximately NNE-SSW and ESE-WNW.
Acknowledgements
We thank Günter Leydecker (BGR Hannover) and KMS Copenha-gen for providing seismograms.

6.6 The Wittenburg Mw = 3.1 Earthquake of May 19, 2000
225
6.6.1 References
Bayer, U., Scheck, M., Rabbel, W. (1999): An integrated study of the NE Germanbasin. Tectonophysics, 314, 285-307.
Bock, G. (1992): The Woods Reef (New South Wales) earthquake of 14 November1990: Focal mechanism derived from amplitude ratios and synthetic seis-mograms. Australian Journal of Earth Sciences, 40, 369-376.
Figure 6.19: Stress map of northern central Europe. Data are from the WorldStress Map Project (Müller et al. 2000); the actual data for northeastern Germanyare by Palmer and Groß (1999). Superimposed an the map is the location andfault plane solution of the Wittenburg event. The stations used in this study areplotted as open triangles (GRSN) and squares (other stations).

6 Source Mechanism Studies
226
Bock, G., Hanka, W., Kind, R. (1994): EMSC rapid source parameter determina-tion. CSEM/EMSC Newsletter, No. 6, December 1994, 2-4.
Fuchs, K., Müller, G. (1971): Computation of synthetic seismograms with thereflectivity method and comparison with observations. Geophysical Journalof the Royal Astronomical Society, 23, 417-433.
Grünthal, G. (1988): Erdbebenkatalog des Territoriums der Deutschen Demokra-tischen Republik und angrenzender Gebiete von 823 bis 1984. Veröffentli-chungen des Zentralinstituts für die Physik der Erde, No. 99, Potsdam.
Grünthal, G., Meier, R. (1995): Das "Prignitz"-Erdbeben von 1409. Brandenburgi-sche Geowissenschaftliche Beiträge, 2, 5-27.
Grünthal, G., Mayer-Rosa, D., Lenhardt, W. (1998): Abschätzung der Erdbeben-gefährdung für die D-A-CH Staaten Deutschland, Österreich, Schweiz. Bau-technik, 75, Heft 10.
Kind, R. (1979): Extensions of the reflectivity method. Journal of Geophysics, 45,373-380.
Lee, W. H. K., Lahr, J. C. (1972): HYPO71: A computer program for determininghypocenter, magnitude, and first motion pattern of local earthquakes. U. S.Geological Survey, Open File Report.
Leydecker, G. (1986): Erdbebenkatalog für die Bundesrepublik Deutschland mitRandgebieten für die Jahre 1000-1981. Geologisches Jahrbuch, E36, 3-83.
Leydecker, G. (2001): Earthquake Catalogue for the federal Republic of Germanyand Adjacent Areas for the Years 800-1995, for damaging Earthquakes till2000. Datafile, http://www.bgr.de/quakecat, Federal institute for Geo-sciences and Natural Resources, Hannover, Germany.
Müller, B., Reinecker, J., Fuchs, K. (2000): The 2000 release of the World StressMap. Available online www.world-stress-map.org.
Palmer, J., Groß, U. (1999): Richtung der rezenten, horizontalen Hauptspannungim Subsalinar Nordostdeutschlands. Z. geol. Wiss., 27, 189-200.
Reasenberg, P. A., Oppenheimer, D. (1985): FPFIT, FPPLOT, and FPPAGE: For-tran computer programs for calculating and displaying earthquake fault-plane solutions, US Geological Survey, Open-file report 85-739, 109 pp.