Payroll/HRMS Retirement Transition January 2015 Molly O’Gorman Billings Tom Drzaic.

Original Research ajog.org
OBSTETRICS
Competing risks model in screening for preeclampsia by maternalfactors and biomarkers at 11-13 weeks gestationNeil O’Gorman, MD; David Wright, PhD; Argyro Syngelaki, RM; Ranjit Akolekar, MD; Alan Wright, PhD;Leona C. Poon, MD; Kypros H. Nicolaides, MD
BACKGROUND: Preeclampsia affects approximately 3% of all preg- RESULTS: In pregnancies that experienced preeclampsia, the values of
nancies and is a major cause of maternal and perinatal morbidity anddeath. In the last decade, extensive research has been devoted to early
screening for preeclampsia with the aim of reducing the prevalence of the
disease through pharmacologic intervention in the high-risk group starting
from the first trimester of pregnancy.
OBJECTIVE: The purpose of this study was to develop a model for
preeclampsia based on maternal demographic characteristics and med-
ical history (maternal factors) and biomarkers.
STUDY DESIGN: The data for this study were derived from prospective
screening for adverse obstetric outcomes in women who attended for their
routine first hospital visit at 11-13 weeks gestation in 2 maternity hospitals in
England. We screened 35,948 singleton pregnancies that included 1058
pregnancies (2.9%) that experienced preeclampsia. Bayes theorem was
used to combine the a priori risk from maternal factors with various com-
binations of uterine artery pulsatility index, mean arterial pressure, serum
pregnancy-associated plasma protein-A, and placental growth factor mul-
tiple of the median values. Five-fold cross validation was used to assess the
performance of screening for preeclampsia that delivered at <37 weeks
gestation (preterm-preeclampsia) and �37 weeks gestation (term-
preeclampsia) by models that combined maternal factors with individual
biomarkers and their combination with screening by maternal factors alone.
Cite this article as: O’Gorman N, Wright D, Syngelaki A,et al. Competing risks model in screening for pre-
eclampsia by maternal factors and biomarkers at 11-13
weeks gestation. Am J Obstet Gynecol 2016;���:����.0002-9378/$36.00ª 2015 Published by Elsevier Inc.http://dx.doi.org/10.1016/j.ajog.2015.08.034
uterine artery pulsatility index and mean arterial pressure were increased,
and the values of serum pregnancy-associated plasma protein-A and
placental growth factor were decreased. For all biomarkers, the deviation
from normal was greater for early than late preeclampsia; therefore, the
performance of screening was related inversely to the gestational age at
which delivery became necessary for maternal and/or fetal indications.
Combined screening by maternal factors, uterine artery pulsatility index,
mean arterial pressure, and placental growth factor predicted 75%
(95% confidence interval, 70-80%) of preterm-preeclampsia and 47%
(95% confidence interval, 44-51%) of term-preeclampsia, at a false-
positive rate of 10%; inclusion of pregnancy-associated plasma protein-
A did not improve the performance of screening. Such detection rates
are superior to the respective values of 49% (95% confidence interval,
43-55%) and 38% (34-41%) that were achieved by screening with
maternal factors alone.
CONCLUSION: Combination of maternal factors and biomarkers
provides effective first-trimester screening for preterm-preeclampsia.
Key words: Bayes theorem, first trimester screening, mean arterialpressure, placental growth factor, preeclampsia, pregnancy-associated
plasma protein-A, uterine artery
reeclampsia affects 2-3% of all
P pregnancies and is a major cause ofmaternal and perinatal morbidity anddeath.1,2 In the last decade extensiveresearch has been devoted to screeningfor preeclampsia with the aims of (1) toreduce the prevalence of the diseasethrough pharmacologic intervention inthe high-risk group3,4 and (2) to mini-mize adverse perinatal events for thosewho experience preeclampsia by thedetermination of the appropriate timeand place for delivery.5 The traditionalapproach to screening for preeclampsiais to identify risk factors from maternaldemographic characteristics and medi-cal history (maternal factors), but suchan approach can identify only 35% of allpreeclampsia and approximately 40% ofpreterm-preeclampsia, at false-positiverate (FPR) of 10%.6,7
An alternative approach to screening,which allows estimation of individualpatient- specific risks of preeclampsiathat requires delivery before a specifiedgestation, is to use Bayes theorem tocombine the a priori risk from maternalcharacteristics and medical history(maternal factors) with the results ofvarious combinations of biophysical andbiochemical measurements that aremade at different times during preg-nancy.8,9 We adopted this approach us-ing a competing risk model for the timeto delivery with preeclampsia. Thismodel assumes that, if the pregnancywas to continue indefinitely, all women
would experience preeclampsia; whetherthey do so before a specified gestationalage depends on competition betweendelivery before or after the developmentof preeclampsia.8 The effect of maternalfactors is to modify the mean of thedistribution of gestational age at deliverywith preeclampsia so that, in pregnan-cies that are at low-risk for preeclampsia,the gestational age distribution is shiftedto the right with the implication that, inmost pregnancies, delivery actually willoccur before the development of pre-eclampsia. In high-risk pregnancies thedistribution is shifted to the left, andthe smaller the mean gestational age, thehigher is the risk for preeclampsia. Thedistribution of biomarkers is specifiedconditionally on the gestational age atdelivery with preeclampsia. For anywomen with specific maternal factorsand biomarker multiple of the median(MoM) values, the posterior distribution
Original Research OBSTETRICS ajog.org
of the time to delivery with preeclamp-sia, assuming that there is no other causeof delivery, is obtained from the appli-cation of Bayes theorem.
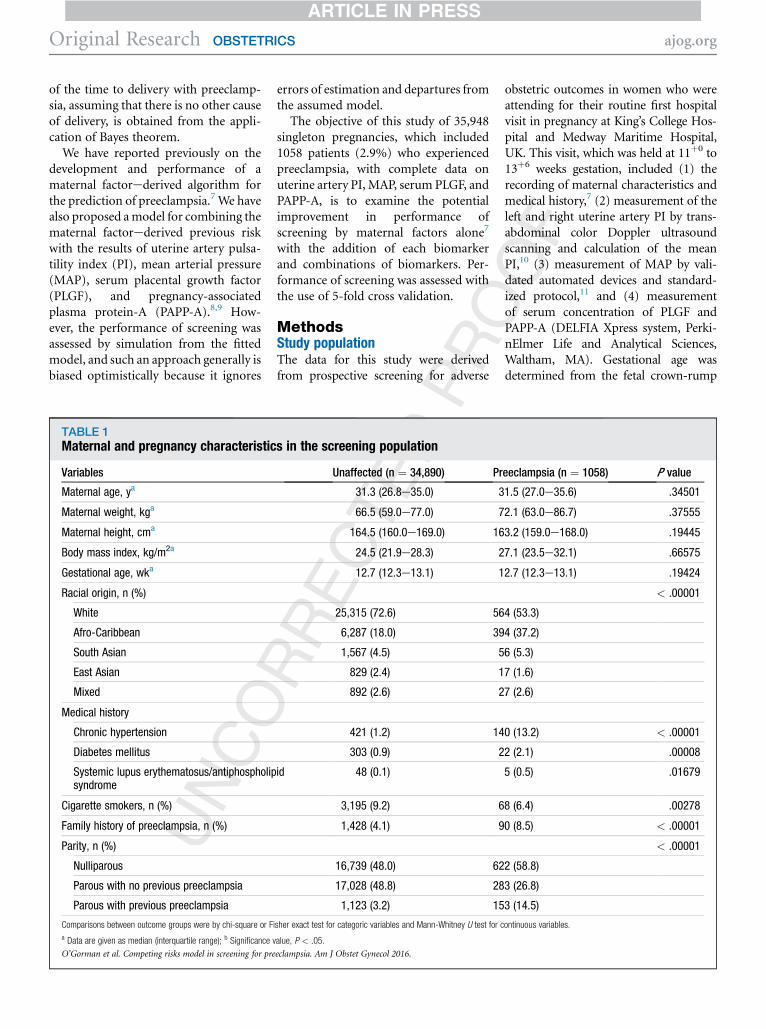
We have reported previously on thedevelopment and performance of amaternal factorederived algorithm forthe prediction of preeclampsia.7 We havealso proposed amodel for combining thematernal factorederived previous riskwith the results of uterine artery pulsa-tility index (PI), mean arterial pressure(MAP), serum placental growth factor(PLGF), and pregnancy-associatedplasma protein-A (PAPP-A).8,9 How-ever, the performance of screening wasassessed by simulation from the fittedmodel, and such an approach generally isbiased optimistically because it ignores
TABLE 1Maternal and pregnancy characteristic
Variables
Maternal age, ya
Maternal weight, kga
Maternal height, cma
Body mass index, kg/m2a
Gestational age, wka
Racial origin, n (%)
White
Afro-Caribbean
South Asian
East Asian
Mixed
Medical history
Chronic hypertension
Diabetes mellitus
Systemic lupus erythematosus/antiphospholipsyndrome
Cigarette smokers, n (%)
Family history of preeclampsia, n (%)
Parity, n (%)
Nulliparous
Parous with no previous preeclampsia
Parous with previous preeclampsia
Comparisons between outcome groups were by chi-square or F
a Data are given as median (interquartile range); b Significance v
O’Gorman et al. Competing risks model in screening for pre
errors of estimation and departures fromthe assumed model.The objective of this study of 35,948
singleton pregnancies, which included1058 patients (2.9%) who experiencedpreeclampsia, with complete data onuterine artery PI, MAP, serum PLGF, andPAPP-A, is to examine the potentialimprovement in performance ofscreening by maternal factors alone7
with the addition of each biomarkerand combinations of biomarkers. Per-formance of screening was assessed withthe use of 5-fold cross validation.
MethodsStudy populationThe data for this study were derivedfrom prospective screening for adverse
s in the screening population
Unaffected (n ¼ 34,890) Pr
31.3 (26.8e35.0) 3
66.5 (59.0e77.0) 7
164.5 (160.0e169.0) 16
24.5 (21.9e28.3) 2
12.7 (12.3e13.1) 1
25,315 (72.6) 56
6,287 (18.0) 39
1,567 (4.5) 5
829 (2.4) 1
892 (2.6) 2
421 (1.2) 14
303 (0.9) 2
id 48 (0.1)
3,195 (9.2) 6
1,428 (4.1) 9
16,739 (48.0) 62
17,028 (48.8) 28
1,123 (3.2) 15
isher exact test for categoric variables and Mann-Whitney U test for c
alue, P < .05.
eclampsia. Am J Obstet Gynecol 2016.
obstetric outcomes in women who wereattending for their routine first hospitalvisit in pregnancy at King’s College Hos-pital and Medway Maritime Hospital,UK. This visit, which was held at 11þ0 to13þ6 weeks gestation, included (1) therecording of maternal characteristics andmedical history,7 (2) measurement of theleft and right uterine artery PI by trans-abdominal color Doppler ultrasoundscanning and calculation of the meanPI,10 (3) measurement of MAP by vali-dated automated devices and standard-ized protocol,11 and (4) measurementof serum concentration of PLGF andPAPP-A (DELFIA Xpress system, Perki-nElmer Life and Analytical Sciences,Waltham, MA). Gestational age wasdetermined from the fetal crown-rump
eeclampsia (n ¼ 1058) P value
1.5 (27.0e35.6) .34501
2.1 (63.0e86.7) .37555
3.2 (159.0e168.0) .19445
7.1 (23.5e32.1) .66575
2.7 (12.3e13.1) .19424
< .00001
4 (53.3)
4 (37.2)
6 (5.3)
7 (1.6)
7 (2.6)
0 (13.2) < .00001
2 (2.1) .00008
5 (0.5) .01679
8 (6.4) .00278
0 (8.5) < .00001
< .00001
2 (58.8)
3 (26.8)
3 (14.5)
ontinuous variables.

TABLE 2Fitted regression model for marker log10 multiple of the median values ongestation at time of delivery for pregnancies with preeclampsia
Marker InterceptStandarderror Slope
Standarderror P value
Uterine artery pulsatility index 0.54453 0.05300 e0.013143 0.001401 < .0001
Mean arterial pressure 0.095640 0.014420 e0.0018240 0.0003811 < .0001
Pregnancy associated plasmaprotein-A
e0.62165 0.09721 0.014692 0.002569 < .0001
Placental growth factor e0.93687 0.07573 0.021930 0.002002 < .0001
O’Gorman et al. Competing risks model in screening for preeclampsia. Am J Obstet Gynecol 2016.
ajog.org OBSTETRICS Original Research
length.12 The women were screenedbetween February 2010 and July 2014and gave written informed consent toparticipate in the study, which wasapproved by the NHS Research EthicsCommittee.
TABLE 3Standard deviations and correlations f
VariableNo preeclampsia(95% confidence
Standard deviation
Uterine artery pulsatilityindex
0.12852 (0.127
Mean arterial pressure 0.03719 (0.036
Pregnancy-associatedplasma protein-A
0.23457 (0.232
Placental growth factor 0.17645 (0.175
Correlation
Uterine artery pulsatilityindex, mean arterialpressure
e0.05132 (e0.0
Uterine artery pulsatilityindex, pregnancy-associated plasmaprotein-A
e0.16039 (e0.1
Uterine artery pulsatilityindex, placental growthfactor
e0.14953 (e0.1
Mean arterial pressure,pregnancy-associatedplasma protein-A
e0.00565 (e0.0
Mean arterial pressure,placental growth factor
e0.02969 (e0.0
Pregnancy-associatedplasma protein-A,placental growth factor
0.31983 (0.310
a Estimates obtained from pooling data for the preeclampsia and
O’Gorman et al. Competing risks model in screening for pre
The inclusion criteria were singletonpregnancy undergoing first-trimestercombined screening for aneuploidy andsubsequently delivering a phenotypicallynormal live birth or stillbirth at�24 weeks gestation. We excluded
or log10 multiples of the median biomarke
interval)Preeclampsia(95% confidence interval)
57e0.12948) 0.14234 (0.13653e0.14868
91e0.03746) 0.03873 (0.03715e0.04045
84e0.23632) 0.26108 (0.25042e0.2727)
15e0.17777) 0.20141 (0.19318e0.21038
6178e e0.04085) e0.05229 (e0.11223e0.008
706e e0.15015) e0.14735 (e0.20582e e0.0
5977e e0.13925) e0.18512 (e0.24271e e0.1
1614e0.00484) 0.01349 (e0.04685e0.073
4017e e0.0192) 0.02101 (e0.03933e0.081
37e0.32923) 0.34729 (0.2931e0.39925)
no-preeclampsia groups.
eclampsia. Am J Obstet Gynecol 2016.
pregnancies with aneuploidies and ma-jor fetal abnormalities and those endingin termination, miscarriage, or fetaldeath before 24 weeks gestation.
Outcome measuresData on pregnancy outcome werecollected from the hospital maternityrecords or the general medical practi-tioners of the women. The obstetric re-cords of all women with preexistingor pregnancy-associated hypertensionwere examined to determine whether thecondition was preeclampsia, as definedby the International Society for the Studyof Hypertension in Pregnancy.13
Statistical analysesOur model for the gestational age atdelivery with preeclampsia was definedby 2 components: first, the previous
r values
Pooled(95% confidence interval)a
) 0.12894 (0.12801e0.12989)
) 0.03724 (0.03697e0.03751)
0.23539 (0.23368e0.23712)
) 0.17723 (0.17595e0.17854)
03) e0.05133 (e0.06163e e0.04101)
8784) e0.15992 (e0.16998e e0.14983)
2623) e0.15084 (e0.16093e e0.14072)
73) e0.00497 (e0.01531e0.00537)
21) e0.02791 (e0.03824e e0.01758)
0.32085 (0.31154e0.3301)

FIGURE 1Scatter diagram and regression line
Data show the 95% confidence limits for the relationship between uterine artery pulsatility index, mean arterial pressure, serum pregnancy-associatedplasma protein-A and placental growth factor multiple of the median and gestational age at delivery in pregnancies with preeclampsia.MoM, multiple of the median; PAPP-A, pregnancy-associated plasma protein-A; PLGF, placental growth factor; w, week.
O’Gorman et al. Competing risks model in screening for preeclampsia. Am J Obstet Gynecol 2016.
Original Research OBSTETRICS ajog.org
distribution based on maternal factors9
and, second, the conditional distributionof MoM biomarker values, given thegestational age with preeclampsia andmaternal factors. Values of uterine arteryPI, MAP, PAPP-A, and PLGF wereexpressed as a MoM adjustment forthose characteristics that were found toprovide a substantive contribution tothe log10 transformed value that includedthe maternal factors in the previousmodel.14-17 In the preeclampsia group, themean log10 MoM was assumed to dependlinearly with gestational age at delivery;this linear relationship was assumed tocontinue until the mean log10 MoM ofzero, beyond which the mean was taken aszero. Multivariable Gaussian distributionswere fitted to the log10 MoM values of thebiomarkers, and a common covariancematrix was assumed for these distribu-tions. Analysis of residuals was used tocheck the adequacy of the model andassess the effects of maternal factors onlog10 -transformed MoM values in preg-nancies with preeclampsia.
Five-fold cross validation18 was usedto assess the performance of screening
for preeclampsia that delivered at <37weeks gestation (preterm-preeclamp-sia), �37 weeks (term-preeclampsia),and subgroups of preeclampsia thatdelivered at<32, 32þ0-36þ6, 37þ0-39þ6,and�40weeks bymodels that combinedmaternal factors with individual bio-markers and their combination withscreening by maternal factors alone.9
The data were divided into 5 equalsubgroups; the model was then fitted 5times to different combinations of 4 ofthe 5 subgroups and used to predict arisk of preeclampsia in the remainingone-fifth of the data. In each case, thematernal factor model, the regressionmodels, and the covariance matrix werefitted to the training data set comprisingfour-fifths on the data and used to pro-duce risks for the hold out sample thatcomprised the remaining one-fifth of thedata.The following screening strategies
were considered: (1) the mini-combinedtest that comprised maternal factors,MAPand PAPP-A; (2) the biophysical testthat comprised maternal factors, uterineartery PI, and MAP; (3) the biochemical
test that comprised maternal factorsand serum PLGF and PAPP-A, and (4)the quadruple test that comprisedmaternal factors and all 4 biomarkers.This choice covers the different com-binations likely to be considered inclinical practice: the mini-combinedtest includes the least expensivebiochemical and biophysical measure-ments; the biophysical and biochemicaltest may be preferred in ultrasoundscanning only or laboratory-only set-tings, respectively; and the quadrupletest combines all 4 markers. For eachcombination of biomarkers, backwardelimination was used to determine thesubset of biomarkers that contributedto the screening performance.
The statistical software package R wasused for data analyses.19 The survivalpackage20 was used for fitting thematernal factors model, and the packagepROC21 was used for the receiver oper-ating characteristic curve analysis.
ResultsThe characteristics of the study popula-tion are summarized in Table 1.

½T2�½T3�
½F1�
FIGURE 2Receiver operating characteristic curves
Data show the prediction of (left) preterm preeclampsia and (right) term preeclampsia by maternalfactors (black ) and combination of maternal factors with uterine artery pulsatility index (blue ), meanarterial pressure (green ), serum pregnancy associated plasma protein-A (purple), and placentalgrowth factor (red ).
O’Gorman et al. Competing risks model in screening for preeclampsia. Am J Obstet Gynecol 2016.
ajog.org OBSTETRICS Original Research
Distribution of preeclampsiaaccording to gestational ageat deliveryIn the study population, there were 1058pregnancies that experienced pre-eclampsia. The gestational age at deliveryof these pregnancies was <32 weeks in66 cases (6.2%), 32þ0-36þ6 weeks in 226cases (21.4%), 37þ0-39þ6 weeks in514 cases (48.6%) and�40 weeks in 252cases (23.8%). Therefore, 292 of thecases (27.6%) of preeclampsia deliveredat <37 weeks, and 766 cases (72.4%)delivered at �37 weeks.
Distribution of preeclampsia inparous and nulliparous womenIn 17,361 of the 35,948 pregnancies(48.3%), the women were nulliparous; in18,587 pregnancies (51.7%), they wereparous, which included 1276 women(6.9%) with a history of preeclampsia in aprevious pregnancy and 17,311 women(93.1%)without a history of preeclampsia.In the current pregnancy, preeclampsiaoccurred in 1058 cases (2.9%), whichincluded 292 cases (0.8%) of preterm-preeclampsia and 766 cases (2.1%) ofterm-preeclampsia. The contribution ofparous women was 45.2% (132/292) topreterm-preeclampsia and 39.7% (304/766) to term-preeclampsia; the respectivevalues were 35.6% (47/132) and 34.9%(106/304) for parous women with pre-eclampsia in a previous pregnancy and64.4% (85/132) and 65.1% (198/304) forparous women without a history ofpreeclampsia.
Distribution of biomarkersThe distributions of log10MoM values ofthe biomarkers in unaffected pregnan-cies and in those that experienced pre-eclampsia are shown in Tables 2 and 3.The MoM values in the preeclampsiagroup and the fitted regression re-lationships with gestational age at de-livery are shown in Figure 1. All markersshowed more separation at earlier,rather than later, gestations; this is re-flected in their superior performance atdetection of early, rather than late, pre-eclampsia. It is notable that the regres-sion lines for uterine artery PI andPAPP-A intersect 1 MoM close toterm. These markers show little or no
discriminatory power beyond approxi-mately 40 weeks gestation, and theyperform relatively poorly in screening forlate preeclampsia. Conversely, MAP showsa degree of separation from 1 MoM atterm, and the performance of MAP forterm preeclampsia is relatively good.
Performance of screening forpreeclampsiaThe areas under the receiver operatingcharacteristic curves and performance ofscreening for preeclampsia by maternalfactors and biomarkers are given inFigure 2 and Tables 4 and 5. The per-formance of each biomarker in combi-nation with maternal factors wassuperior to that of screening by maternalfactors alone. Similarly, the performanceby a combination of �2 biomarkers wassuperior to that of screening by indi-vidual biomarkers. The only exceptionwas serum PAPP-A, which did not pro-vide significant improvement to any
combination of biomarkers thatincluded serum PLGF. Starting with thefull model, incorporating maternal fac-tors with all 4 biomarkers and applyingbackward elimination resulted in theremoval of PAPP-A at the first step forboth preterm-preeclampsia (P ¼ .15)and term-preeclampsia (P ¼ .98). In thebackward elimination, after the removalof PAPP-A, all other variables madesignificant contributions (P < .05).There is evidence therefore of a benefitfor screening with the combination ofmaternal factors, uterine artery PI, MAP,and serum PLGF (triple test), but not forthe inclusion of PAPP-A.
The performance of screening forpreterm-preeclampsia and term-pre-eclampsia by the mini-combined test(MAP and PAPP-A), biophysical test(uterine artery PI andMAP), biochemicaltest (serum PLGF and PAPP-A) and thetriple test (uterine artery PI, MAP andserum PLGF) is shown in Figure 3.

TABLE 4Detection rate at false-positive rates of 5% and 10% of preeclampsia with delivery at <37 and ‡37 weeksgestation in screening by maternal factors, biomarkers, and their combination
Method of screening
Preeclampsia
<37 Weeks gestation �37 Weeks gestation
Area underthe curve
False-positive detection rate(95% confidence interval)
Area underthe curve
False-positive detection rate(95% confidence interval)
5% 10% 5% 10%
Maternal factors 0.800 36 (30e41) 49 (43e55) 0.745 28 (24e31) 38 (34e41)
Maternal factors plus
Mean arterial pressure 0.845 44 (38e50) 59 (53e65) 0.781 30 (27e34) 43 (40e47)
Uterine artery pulsatility index 0.841 46 (40e52) 60 (54e66) 0.749 29 (26e33) 39 (35e43)
Pregnancy-associatedplasma protein-A
0.822 40 (34e46) 53 (48e59) 0.748 28 (25e31) 39 (35e42)
Placental growth factor 0.872 50 (44e56) 65 (60e71) 0.764 29 (25e32) 42 (38e45)
Mean arterial pressure,uterine artery pulsatility index
0.876 53 (47e59) 70 (64e75) 0.785 32 (28e35) 44 (41e48)
Mean arterial pressure,pregnancy-associatedplasma protein-A
0.860 48 (42e54) 61 (55e66) 0.783 31 (28e35) 45 (41e49)
Mean arterial pressure,placental growth factor
0.896 59 (53e64) 73 (67e78) 0.794 32 (29e36) 47 (44e51)
Uterine artery pulsatilityindex, pregnancy-associatedplasma protein-A
0.851 48 (42e54) 60 (54e65) 0.751 29 (26e32) 40 (36e43)
Uterine artery pulsatilityindex, placental growth factor
0.884 58 (52e63) 70 (64e75) 0.766 30 (26e33) 42 (38e46)
Placental growth factor,pregnancy-associatedplasma protein-A
0.873 50 (44e56) 66 (60e71) 0.764 29 (25e32) 42 (38e46)
Mean arterial pressure,uterine artery pulsatility index,pregnancy-associatedplasma protein-A
0.884 55 (49e61) 70 (65e75) 0.787 32 (29e35) 45 (41e48)
Mean arterial pressure,pregnancy-associatedplasma protein-A, placentalgrowth factor
0.897 59 (53e65) 73 (67e78) 0.794 32 (29e36) 48 (44e51)
Mean arterial pressure,uterine artery pulsatility index,placental growth factor
0.906 65 (59e71) 75 (70e80) 0.796 33 (30e37) 47 (44e51)
Uterine artery pulsatilityindex, pregnancy-associatedplasma protein-A, placentalgrowth factor
0.885 57 (51e63) 69 (64e74) 0.766 30 (26e33) 43 (39e46)
Mean arterial pressure,uterine artery pulsatility index,pregnancy-associatedplasma protein-A, placentalgrowth factor
0.907 64 (58e70) 75 (70e80) 0.796 33 (29e36) 48 (44e52)
O’Gorman et al. Competing risks model in screening for preeclampsia. Am J Obstet Gynecol 2016.
Original Research OBSTETRICS ajog.org

TABLE 5Detection rate at false-positive rates of 5% and 10% of preeclampsia with delivery at <32, 32-36.9, 37-39.9, and ‡40 weeksgestation in screening by maternal factors, biomarkers, and their combination
Method of screening
False-positive rate (95% confidence interval)
5% 10%
<32 Wk 32þ0 e 36þ6 Wk 37þ0 e 39þ6 Wk �40 Wk <32 Wk 32þ0 e 36þ6 Wk 37þ0 e 39þ6 Wk �40 Wk
Maternal factors 42 (30e55) 34 (27e40) 31 (27e35) 21 (16e26) 53 (40e65) 48 (42e55) 41 (37e45) 30 (25e36)
Maternal factors plus
Mean arterial pressure 48 (36e61) 43 (36e50) 35 (31e39) 21 (17e27) 65 (52e76) 58 (51e64) 48 (44e52) 34 (28e40)
Uterine artery pulsatility index 55 (42e67) 43 (37e50) 33 (29e37) 21 (16e27) 65 (52e76) 58 (52e65) 43 (38e47) 31 (26e37)
Pregnancy-associated plasma protein-A 44 (32e57) 39 (33e46) 32 (28e36) 20 (15e25) 59 (46e71) 52 (45e58) 42 (38e47) 31 (25e37)
Placental growth factor 67 (54e78) 46 (39e52) 33 (29e38) 19 (15e25) 80 (69e89) 61 (54e67) 45 (41e50) 35 (29e42)
Mean arterial pressure, uterine artery pulsatility index 56 (43e68) 52 (45e58) 36 (32e41) 23 (18e29) 80 (69e89) 67 (60e73) 49 (44e53) 36 (30e42)
Mean arterial pressure, pregnancy-associated plasmaprotein-A
52 (39e64) 47 (40e54) 36 (32e40) 22 (17e28) 65 (52e76) 59 (53e66) 50 (45e54) 36 (30e42)
Mean arterial pressure, placental growth factor 76 (64e85) 54 (47e60) 36 (32e40) 26 (21e32) 83 (72e91) 70 (63e76) 53 (48e57) 37 (31e44)
Uterine artery pulsatility index, pregnancy-associatedplasma protein-A
59 (46e71) 44 (38e51) 33 (29e37) 21 (16e27) 68 (56e79) 57 (50e64) 43 (39e48) 33 (27e39)
Uterine artery pulsatility index, placental growth factor 74 (62e84) 53 (46e59) 34 (30e39) 21 (16e26) 83 (72e91) 65 (59e72) 46 (41e50) 35 (29e41)
Placental growth factor, pregnancy-associated plasmaprotein-A
67 (54e78) 45 (39e52) 33 (29e37) 20 (15e26) 79 (67e88) 62 (55e68) 46 (41e50) 36 (30e42)
Mean arterial pressure, uterine artery pulsatility index,pregnancy-associated plasma protein-A
65 (52e76) 52 (45e59) 36 (31e40) 25 (19e30) 83 (72e91) 66 (60e73) 50 (45e54) 35 (29e41)
Mean arterial pressure, pregnancy-associatedplasma protein-A, placental growth factor
76 (64e85) 54 (47e61) 36 (32e40) 26 (21e32) 85 (74e92) 69 (63e75) 53 (48e57) 39 (33e45)
Mean arterial pressure, uterine artery pulsatilityindex, placental growth factor
82 (70e90) 60 (53e67) 37 (33e42) 27 (21e32) 89 (79e96) 71 (64e77) 53 (48e57) 38 (32e44)
Uterine artery pulsatility index, pregnancy-associatedplasma protein-A, placental growth factor
76 (64e85) 52 (45e58) 34 (30e38) 21 (16e26) 83 (72e91) 65 (58e71) 46 (42e51) 36 (30e42)
Mean arterial pressure, uterine artery pulsatilityindex, pregnancy-associated plasma protein-A,placental growth factor
82 (70e90) 59 (52e65) 37 (33e41) 26 (21e32) 89 (79e96) 71 (64e77) 54 (49e58) 38 (32e44)
O’Gorman et al. Competing risks model in screening for preeclampsia. Am J Obstet Gynecol 2016.
ajog.o
rgOBSTETRICSOrigin
alResearch

FIGURE 3Receiver operating characteristic curves
Data show the prediction of (left) preterm preeclampsia and (right) term preeclampsia by maternalfactors (black ), mini-combined test (green ), biophysical test (blue ), biochemical test (purple ), andthe triple test (red ).
O’Gorman et al. Competing risks model in screening for preeclampsia. Am J Obstet Gynecol 2016.
Original Research OBSTETRICS ajog.org
Performance of screening forpreeclampsia in subgroupsThe performance of screening by thetriple test in the prediction of preterm-preeclampsia and term-preeclampsiafor nulliparous and parous women ofAfro-Caribbean and white racial originare given in Tables 6 and 7. In thesecalculations, a risk cut-off was selectedto achieve a screen-positive rate ofapproximately 10%. At a risk cut-off of 1in 70 for preterm-preeclampsia and 1 in15 for term-preeclampsia, the FPR anddetection rate (DR) were higher innulliparous than in parous women, inparous women with, rather thanwithout, preeclampsia in a previouspregnancy, and in women of Afro-Caribbean, rather than white, racialorigin. In all groups, the risk of beingaffected, given a screen-positive result,was considerably higher that the preva-lence of the disease; whereas in thosewith a screen negative result, the risk wasconsiderably reduced.
In the lowest-risk group, white parouswomen with no history of preeclampsia,which comprised 35% of the population(12,726/35,948) and accounted for18% of cases (52/292) of preterm-preeclampsia, the DR for preterm-preeclampsia was 50%, and the FPRwas 2.7%; in total, 489 tests would needto be performed for each true positiveidentified. In the highest-risk group,Afro-Caribbean women with a historyof preeclampsia, which comprised 1%of the population (370/35,948) andaccounted for 7.5% of the cases (22/292)of preterm-preeclampsia, the DR forpreterm-preeclampsia was 100%, andthe FPR was 63.4%; in total 17 testswould need to be performed for eachtrue positive that is identified.The algorithm for estimation of risk
for preeclampsia based on maternalcharacteristics and biomarkers will beavailable free-of charge in the website ofthe Fetal Medicine Foundation (www.fetalmedicine.com).
CommentPrincipal findings of this studyIn pregnancies that experience pre-eclampsia, the MoM values of uterineartery PI andMAP are increased, and thevalues of serum PAPP-A and PLGF aredecreased. For all biomarkers, the devi-ation from normal is greater for early,rather than late, preeclampsia; therefore,the performance of screening is relatedinversely to the gestational age at whichdelivery becomes necessary for maternaland/or fetal indications.
Screening for preeclampsia by acombination of maternal factors, uterineartery PI, MAP, and serum PLGF at 11-13 weeks gestation can predict 75% ofpreterm-preeclampsia and 47% of term-preeclampsia, at an FPR of 10%. SuchDRs are superior to the respective valuesof 49% and 38% that are achieved byscreening with maternal factors alone.The performance of screening by bothbiophysical and biochemical markers issuperior to screening by either methodalone. Although serum PAPP-A im-proves the performance of screening bymaternal factors or biophysical markers,we found no evidence of improvementto any combination of biomarkers thatinclude serum PLGF.
The study has highlighted that, inscreening for preeclampsia, the FPR andDR are influenced by the characteristicsof the study population; for a given riskcut-off, they are both higher in nullipa-rous rather than in parous women and inthose of Afro-Caribbean rather thanwhite racial origin. Consequently, com-parison of the performance of screeningbetween studies requires the appropriateadjustments for the characteristics ofthe population under investigation.Although the risk of preeclampsia ishigher in nulliparous than parouswomen, the contribution of the lattergroup to preeclampsia should not beunderestimated because approximately45% of cases of preterm-preeclampsiawere from parous women, whichincluded 16% from parous women withpreeclampsia in a previous pregnancyand 29% from parous women without ahistory of preeclampsia. Similarly, 40%of cases of term-preeclampsia were fromparous women, which included 14%

TABLE 6Performance of screening for preeclampsia with delivery at <37 weeks gestation by an algorithm that combined maternal factors,uterine artery pulsatility index, mean arterial pressure, and serum placental growth factor at a risk cut-off of 1 in 70
Group
Prevalence, %(95% confidenceinterval)
Screen-positive rate, %(95% confidenceinterval)
False-positive rate, %(95% confidenceinterval)
Detection rate, %(95% confidenceinterval)
Risk of being affected given the result
Screen-positive, %(95% confidenceinterval)a
Screen-negative, %(95% confidenceinterval)b
All pregnancies 0.81 (0.72e0.91) 11.3 (11.0e11.6) 9.4 (9.1e9.7) 75.3 (70.0e80.2) 5.4 (4.8e6.2) 0.23 (0.18e0.28)
Nulliparous 0.92 (0.78e1.08) 14.1 (13.6e14.6) 12.1 (11.6e12.6) 75.00 (67.6e81.5) 4.9 (4.1e5.9) 0.27 (0.19e0.36)
Parous 0.71 (0.59e0.84) 8.7 (8.3e9.1) 7.0 (6.6e7.4) 75.8 (67.5e82.8) 6.2 (5.1e7.5) 0.19 (0.13e0.27)
No previous preeclampsia 0.49 (0.39e0.61) 5.3 (5.0e5.7) 4.5 (4.2e4.8) 64.7 (53.6e74.8) 6.0 (4.5e7.7) 0.18 (0.12e0.26)
Previous preeclampsia 3.68 (2.72e4.87) 54.0 (51.2e56.8) 48.5 (45.4e51.7) 95.7 (85.5e99.5) 6.5 (4.8e8.6) 0.34 (0.04e1.23)
Afro-Caribbean 1.84 (1.53e2.19) 27.3 (26.2e28.3) 23.2 (22.2e24.3) 87.8 (80.7e93.0) 5.9 (4.9e7.1) 0.31 (0.17e0.51)
Nulliparous 2.14 (1.61e2.78) 37.6 (35.7e39.6) 33.6 (31.6e35.6) 87.0 (75.1e94.6) 4.9 (3.7e6.5) 0.44 (0.18e0.91)
Parous 1.66 (1.29e2.10) 20.9 (19.7e22.2) 17.2 (16.0e18.5) 88.4 (78.4e94.9) 7.0 (5.4e8.9) 0.24 (0.11e0.48)
No previous preeclampsia 1.24 (0.91e1.65) 15.6 (14.5e16.8) 13.1 (12.0e14.3) 83.0 (69.2e92.4) 6.6 (4.7e8.9) 0.25 (0.11e0.49)
Previous preeclampsia 5.95 (3.76e8.86) 75.4 (70.7e79.7) 70.3 (64.5e75.7) 100 (84.6e100) 7.9 (5.0e11.7) 0.00 (0.00e3.97)
White 0.54 (0.45e0.63) 7.2 (6.9e7.5) 6.0 (5.7e6.3) 62.6 (54.0e70.6) 4.7 (3.8e5.8) 0.22 (0.16e0.28)
Nulliparous 0.66 (0.53e0.82) 9.5 (9.0e1.0) 8.2 (7.7e8.7) 65.5 (54.6e75.4) 4.6 (3.5e5.9) 0.25 (0.17e0.36)
Parous 0.41 (0.31e0.54) 4.6 (4.4e5.1) 3.9 (3.5e4.2) 57.7 (43.2e71.3) 5.0 (3.4e7.0) 0.18 (0.11e0.27)
No previous preeclampsia 0.29 (0.20e0.40) 2.1 (1.9e2.4) 1.9 (1.6e2.1) 38.2 (22.2e56.4) 5.1 (2.7e8.6) 0.18 (0.11e0.28)
Previous preeclampsia 2.23 (1.33e3.51) 43.4 (40.0e46.9) 38.7 (35.0e42.5) 94.4 (72.7e99.9) 4.9 (2.9e7.7) 0.22 (0.01e1.22)a Same as positive predictive value; b Same as 1 e negative predictive value.
O’Gorman et al. Competing risks model in screening for preeclampsia. Am J Obstet Gynecol 2016.
ajog.o
rgOBSTETRICSOrigin
alResearch

TABLE 7Performance of screening for preeclampsia with delivery at ‡37 weeks gestation by an algorithm that combined maternal factorseuterine arterypulsatility indexemean arterial pressure and serum placental growth factor at a risk cut-off of 1 in 15
Group
Prevalence, %(95% confidenceinterval)
Screen-positive rate, %(95% confidenceinterval)
False-positive rate, %(95% confidenceinterval)
Detection rate, %(95% confidenceinterval)
Risk of being affected given the result
Screen-positive, %(95% confidenceinterval)a
Screen-negative, %(95% confidenceinterval)b
All pregnancies 2.25 (2.10e2.42) 10.4 (10.1e10.7) 8.9 (8.6e9.2) 46.6 (43.0e50.2) 10.1 (9.2e11.2) 1.34 (1.22e1.48)
Nulliparous 2.82 (2.57e3.08) 13.0 (12.5e13.5) 11.4 (11.0e12.0) 41.8 (37.2e46.4) 9.1 (7.9e10.4) 1.89 (1.67e2.12)
Parous 1.73 (1.54e1.93) 8.0 (7.6e8.4) 6.6 (6.2e7.0) 54.0 (48.2e59.7) 11.7 (10.1e13.5) 0.86 (0.73e1.02)
No previous preeclampsia 1.20 (1.04e1.38) 4.3 (4.0e4.6) 3.7 (3.4e4.0) 34.3 (27.8e41.4) 9.7 (7.6e12.1) 0.82 (0.69e0.98)
Previous preeclampsia 9.28 (7.66e11.12) 61.1 (58.2e64.0) 56.5 (53.2e59.7) 90.6 (83.3e95.4) 13.8 (11.3e16.5) 2.25 (1.09e4.10)
Afro-Caribbean 4.36 (3.86e4.90) 28.8 (27.7e30.0) 25.6 (24.5e26.7) 74.2 (68.5e79.3) 11.2 (9.8e12.8) 1.58 (1.24e1.99)
Nulliparous 5.52 (4.63e6.52) 44.2 (42.2e46.3) 41.1 (39.0e43.3) 79.1 (71.0e85.7) 9.9 (8.1e11.9) 2.07 (1.37e3.00)
Parous 3.66 (3.09e4.30) 19.5 (18.3e20.8) 16.6 (15.4e17.9) 69.7 (61.5e77.1) 13.1 (10.7e15.7) 1.38 (1.00e1.85)
No previous preeclampsia 2.64 (2.14e3.22) 13.5 (12.4e14.7) 11.8 (10.7e12.9) 55.3 (44.7e65.6) 10.8 (8.2e13.9) 1.36 (0.99e1.84)
Previous preeclampsia 15.0 (11.27e19.39) 86.3 (82.0e89.8) 83.0 (77.7e87.5) 97.9 (88.9e100) 17.0 (12.8e22.0) 2.27 (0.06e12.02)
White 1.73 (1.57e1.90) 5.9 (5.6e6.2) 5.0 (4.7e5.3) 30.4 (26.0e35.0) 8.9 (7.5e10.5) 1.28 (1.14e1.43)
Nulliparous 2.30 (2.05e2.58) 7.3 (6.8e7.8) 6.4 (5.9e6.8) 26.5 (21.5e32.0) 8.4 (6.7e10.4) 1.83 (1.59e2.09)
Parous 1.14 (0.96e1.34) 4.4 (4.1e4.8) 3.6 (3.3e4.0) 38.4 (30.3e47.1) 9.9 (7.5e12.7) 0.73 (0.59e0.91)
No previous preeclampsia 0.78 (0.63e0.96) 1.5 (1.3e1.7) 1.3 (1.1e1.5) 13.5 (7.2e22.4) 7.2 (3.8e12.2) 0.69 (0.54e0.86)
Previous preeclampsia 6.66 (4.97e8.71) 50.3 (46.6e53.9) 45.8 (41.8e49.8) 83.7 (70.3e92.7) 11.1 (8.1e14.7) 2.19 (0.95e4.26)a Same as positive predictive value; b Same as 1 e negative predictive value.
O’Gorman et al. Competing risks model in screening for preeclampsia. Am J Obstet Gynecol 2016.
Origin
alResearch
OBSTETRICS
ajog.o
rg

ajog.org OBSTETRICS Original Research
from parous women with preeclampsiain a previous pregnancy and 26% fromparous women without a history ofpreeclampsia. In all groups, after com-bined screening, the risk of beingaffected, given a screen-positive result,was considerably increased; if the screenresult was negative, the risk was consid-erably reduced.
Strengths and limitationsThe strengths of this first-trimesterscreening study for preeclampsia are(1) examination of a large population ofpregnant women who attended forroutine care in a gestational age rangethat is used widely for the assessment ofrisk for chromosomal abnormalities, (2)the recording of data on maternal char-acteristics and medical history to iden-tify known risk factors that are associatedwith preeclampsia, (3) use of a specificmethod and appropriately trained doc-tors to measure uterine artery PI andMAP, (4) the use of automated machinesto provide accurate measurement within40 minutes of sampling of maternalserum concentration of metabolites thathave been shown to be altered in preg-nancies and to be associated withimpaired placentation, (5) expression ofthe values of the biomarkers as MoMsafter adjustment for factors that affectthe measurements, and (6) the use ofBayes theorem to combine the previousrisk from maternal factors with bio-markers to estimate patient-specific risksand the performance of screening forpreeclampsia delivery at different stagesof pregnancy.
A limitation of the study is that theperformance of screening by a modelthat was derived and tested with the useof the same dataset is overestimated. Wehave used cross validation to reduce thiseffect, but we acknowledge that thisapproach fails to capture the over-estimation of performance because ofmodel selection. Consequently, externalvalidation on independent data fromdifferent sources is required.
Comparison with previous studiesSeveral studies have documented thatdevelopment of preeclampsia is associ-ated with a first-trimester increase in
uterine artery PI andMAP and a decreasein serum PLGF and PAPP-A.7-10,22-24 Inprevious studies, we proposed a modelof screening for preeclampsia based onBayes theorem to combine the a prioririsk from maternal factors with bio-markers.8,9 In this study, we prospectivelyexamined a large population of pregnan-cies in which all 4 biomarkers weremeasured and conducted a 5-fold crossvalidation study to assess the performanceof that screening.
Clinical implications of the studyScreening and diagnosis of preeclampsiatraditionally is based on the demon-stration of elevated blood pressure andproteinuria during a routine clinical visitin the late second- or third-trimester ofpregnancy. In a proposed new pyramidof pregnancy care,25 an integrated clinicat 11-13 weeks gestation, in which bio-physical and biochemical markers arecombined with maternal factors, aims toidentify pregnancies that are at high riskof experiencing preeclampsia and,through pharmacologic intervention(with such medications as low-doseaspirin), to reduce the prevalence ofthese complications.3,4 In pregnancieswith impaired placentation, the use oflow-dose aspirin at >16 weeks gestationdoes not prevent the subsequent devel-opment of preeclampsia.3,4
Our finding that the performance offirst-trimester screening is better forpreterm-preeclampsia rather than term-preeclampsia is particularly importantbecause the incidence of adverse fetaland maternal short-term and long-termconsequences of preeclampsia are relatedinversely to the gestational age at onset ofthe disease26-31 and the prophylactic useof low-dose aspirin is effective in theprevention of preterm-preeclampsiarather than term-preeclampsia.4
There are various levels of complexityand implications in terms of generalapplicability and costs for the variouscomponents of the combined test,compared with screening by maternalfactors alone. Measurement of MAP canbe undertaken by health care assistantsafter minimal training, with the use ofinexpensive equipment, and takes a fewminutes to perform. Measurement of
serum PAPP-A and quality assurance forsuchmeasurement are already in place incenters that provide routine first-trimester combined screening forDown syndrome. Measurement ofserum PLGF can be undertaken on thesame sample and by the same machinesas for PAPP-A, but at an additional cost.Measurement of uterine artery PI can beundertaken within a few minutes by thesame sonographers andmachines as partof the current 11-13 week scan, which isused widely in screening for Down syn-drome; however, the sonographers willrequire specific training for this mea-surement and quality assurance of theirresults. Consequently, the choice of testfor screening ultimately will depend notonly on the basis of performance butalso on the feasibility of implementationand health economic considerations.In terms of performance, the DR ofpreterm-preeclampsia at FPR of 10% isapproximately 50% in screening bymaternal factors alone and 60%, 65%,70%, and 75% in screening by the mini-combined test, the biochemical test, thebiophysical test, and the triple combinedtest, respectively. n
References
1. World Health Organization. Make everymother and child count. Geneva: World HealthReport; 2005.2. Knight M, Kenyon S, Brocklehurst P,Neilson J, Shakespeare J, Kurinczuk JJ, eds. onbehalf of MBRRACEUK. Saving lives, improvingmothers’ care - lessons learned to informfuture maternity care from the UK and Irelandconfidential enquiries into maternal deathsand morbidity 2009-12. Oxford: National Peri-natal Epidemiology Unit, University of Oxford;2014.3. Bujold E, Roberge S, Lacasse Y, et al. Pre-vention of preeclampsia and intrauterine growthrestriction with aspirin started in early preg-nancy: a meta-analysis. Obstet Gynecol2010;116:402-14.4. Roberge S, Villa P, Nicolaides KH, et al. Earlyadministration of low dose aspirin for the pre-vention of preterm and term pre-eclampsia: asystematic review and meta-analysis. FetalDiagn Ther 2012;31:141-6.5. Koopmans CM, Bijlenga D, Groen H, et al.Induction of labour versus expectant monitoringfor gestational hypertension or mild pre-eclampsia after 36 weeks gestation (HYPITAT):a multicentre, open-label randomised controlledtrial. Lancet 2009;374:979-88.6. National Collaborating Centre for Women’sand Children’s Health (UK). Hypertension in

Original Research OBSTETRICS ajog.org
pregnancy: the management of hypertensivedisorders during pregnancy. London: RCOGPress; 2010.7. Wright D, Syngelaki A, Akolekar R, Poon LC,Nicolaides KH. Competing risks model inscreening for preeclampsia by maternal char-acteristics and medical history. Am J ObstetGynecol 2015;213:62.e1-10.8. Wright D, Akolekar R, Syngelaki A, Poon LC,Nicolaides KH. A competing risks model in earlyscreening for preeclampsia. Fetal Diagn Ther2012;32:171-8.9. Akolekar R, Syngelaki A, Poon L, Wright D,Nicolaides KH. Competing risks model in earlyscreening for preeclampsia by biophysical andbiochemical markers. Fetal Diagn Ther 2013;33:8-15.10. Plasencia W, Maiz N, Bonino S, Kaihura C,Nicolaides KH.Uterine artery Doppler at 11þ0 to13þ6 weeks in the prediction of pre-eclampsia.Ultrasound Obstet Gynecol 2007;30:742-9.11. Poon LC, Zymeri NA, Zamprakou A,Syngelaki A, Nicolaides KH. Protocol for mea-surement of mean arterial pressure at 11-13weeks’gestation. Fetal DiagnTher 2012;31:42-8.12. Robinson HP, Fleming JE. A critical evalua-tion of sonar crown rump length measurements.BJOG 1975;82:702-10.13. Brown MA, Lindheimer MD, de Swiet M, VanAssche A, Moutquin JM. The classification anddiagnosis of the hypertensive disorders of preg-nancy: statement from the international society forthe study of hypertension in pregnancy (ISSHP).Hypertens Pregnancy 2001;20:IX-XIV.14. Tayyar A, Guerra L, Wright A, Wright D,Nicolaides KH. Uterine artery pulsatility index inthe three trimesters of pregnancy: effects ofmaternal characteristics and medical history.Ultrasound Obstet Gynecol 2015;45:689-97.15.Wright A, Wright D, Ispas A, Poon LC,Nicolaides KH. Mean arterial pressure in thethree trimesters of pregnancy: effects ofmaternal characteristics and medical history.Ultrasound Obstet Gynecol 2015;45:698-706.16.Wright D, Silva M, Papadopoulos S,Wright A, Nicolaides KH. Serum pregnancy
associated plasma protein-A in the three tri-mesters of pregnancy: effects of maternalcharacteristics and medical history. UltrasoundObstet Gynecol 2015;46:42-50.17. Tsiakkas A, Duvdevani N, Wright A,Wright D, Nicolaides KH. Serum placentalgrowth factor in the three trimesters of preg-nancy: effects of maternal characteristics andmedical history. Ultrasound Obstet Gynecol2015;45:591-8.18. Geisser, Seymour. Predictive inference.New York: Chapman and Hall; 1993.19. R Development Core Team. R: a languageand environment for statistical computing.Vienna: R Foundation for Statistical Computing;2011.20. Therneau T. A package for survival analysisin S. R package version 2.37-7, 2014. Availableat: http://CRAN.R-project.org/package¼survival.Accessed: ����.21. Robin X, Turck N, Hainard A, et al. pROC: anopen-source package for R and Sþ to analyzeand compare ROC curves. BMC Bioinformatics2011;12:77-84.22. Poon LC, Kametas NA, Pandeva I,Valencia C, Nicolaides KH. Mean arterial pres-sure at 11þ0 to 13þ6 weeks in the predictionof preeclampsia. Hypertension 2008;51:1027-33.23. Akolekar R, Zaragoza E, Poon LC, Pepes S,Nicolaides KH. Maternal serum placental growthfactor at 11 þ 0 to 13 þ 6 weeks of gestation inthe prediction of pre-eclampsia. UltrasoundObstet Gynecol 2008;32:732-9.24. Poon LC, Maiz N, Valencia C, Plasencia W,Nicolaides KH. First-trimester maternal serumpregnancy-associated plasma protein-A andpre-eclampsia. Ultrasound Obstet Gynecol2009;33:23-33.25. Nicolaides KH. Turning the pyramid of pre-natal care. Fetal Diagn Ther 2011;29:183-96.26.Witlin GA, Saade GR, Mattar FM, Sibai BM.Predictors of neonatal outcome in women withsevere pre-eclampsia or eclampsia between 24and 33 weeks’ gestation. Am J Obstet Gynecol2000;182:607-11.
27. Bellamy L, Casas JP, Hingorani AD,Williams DJ. Pre-eclampsia and risk of cardio-vascular disease and cancer in later life: sys-tematic review and meta-analysis. BMJ2007;335:974.28. von Dadelszen P, Magee LA, Roberts JM.Subclassification of pre-eclampsia. HypertensPregnancy 2003;22:143-8.29. Moldenhauer JS, Stanek J, Warshak C,Khoury J, Sibai B. The frequency and severity ofplacental findings in women with pre-eclampsiaare gestational age dependent. Am J ObstetGynecol 2003;189:1173-7.30. Yu CK, Khouri O, Onwudiwe N,Spiliopoulos Y, Nicolaides KH. Fetal MedicineFoundation Second-Trimester Screening Group.Prediction of pre-eclampsia by uterine arteryDoppler imaging: relationship to gestational ageat delivery and small-for-gestational age. Ultra-sound Obstet Gynecol 2008;31:310-3.31. Poon LC, Volpe N, Muto B, Yu CK,Syngelaki A, Nicolaides KH. Second-trimesteruterine artery Doppler in the prediction of still-births. Fetal Diagn Ther 2013;33:28-35.
Author and article informationFrom Harris Birthright Research Centre for Fetal Medi-
cine, King’s College, London, UK (Drs O’Gorman, Akole-
kar, Poon, and Nicolaides and Mr Syngelaki); Institute of
Health Research, University of Exeter, Exeter, UK (Drs
D. Wright and A. Wright); Department of Fetal Medicine,
Medway Maritime Hospital, Gillingham, UK (Dr Akolekar).
Received April 21, 2015; revised Aug. 6, 2015;
accepted Aug. 12, 2015.
Supported by grants from the Fetal Medicine Foun-
dation (Charity No: 1037116) and by the European
Union 7th Framework Programme-FP7-HEALTH-2013-
INNOVATION-2 (ASPRE Project # 601852).
These bodies had no involvement in the study design;
in the collection, analysis and interpretation of data; in the
writing of the report; and in the decision to submit the
article for publication.
The authors report no conflict of interest.
Corresponding author: K.H. Nicolaides, MD. kypros@
fetalmedicine.com