Original citation - University of...
22
warwick.ac.uk/lib-publications Original citation: Miles, J. and Bloodworth, Alan G. (2015) Remote assessment of tsunami damage in Japan by means of Google Street View images. Southampton, UK: University of Southampton. Permanent WRAP URL: http://wrap.warwick.ac.uk/80780 Copyright and reuse: The Warwick Research Archive Portal (WRAP) makes this work by researchers of the University of Warwick available open access under the following conditions. Copyright © and all moral rights to the version of the paper presented here belong to the individual author(s) and/or other copyright owners. To the extent reasonable and practicable the material made available in WRAP has been checked for eligibility before being made available. Copies of full items can be used for personal research or study, educational, or not-for-profit purposes without prior permission or charge. Provided that the authors, title and full bibliographic details are credited, a hyperlink and/or URL is given for the original metadata page and the content is not changed in any way. A note on versions: The version presented here may differ from the published version or, version of record, if you wish to cite this item you are advised to consult the publisher’s version. Please see the ‘permanent WRAP URL’ above for details on accessing the published version and note that access may require a subscription. For more information, please contact the WRAP Team at: [email protected]
Transcript of Original citation - University of...
warwick.ac.uk/lib-publications
Original citation: Miles, J. and Bloodworth, Alan G. (2015) Remote assessment of tsunami damage in Japan by means of Google Street View images. Southampton, UK: University of Southampton. Permanent WRAP URL: http://wrap.warwick.ac.uk/80780 Copyright and reuse: The Warwick Research Archive Portal (WRAP) makes this work by researchers of the University of Warwick available open access under the following conditions. Copyright © and all moral rights to the version of the paper presented here belong to the individual author(s) and/or other copyright owners. To the extent reasonable and practicable the material made available in WRAP has been checked for eligibility before being made available. Copies of full items can be used for personal research or study, educational, or not-for-profit purposes without prior permission or charge. Provided that the authors, title and full bibliographic details are credited, a hyperlink and/or URL is given for the original metadata page and the content is not changed in any way. A note on versions: The version presented here may differ from the published version or, version of record, if you wish to cite this item you are advised to consult the publisher’s version. Please see the ‘permanent WRAP URL’ above for details on accessing the published version and note that access may require a subscription. For more information, please contact the WRAP Team at: [email protected]
1
Remote assessment of tsunami damage in Japan by means of
Google Street View images
Project Report
Jessica Miles and Alan G. Bloodworth
University of Southampton
Abstract
The devastating Great East Japan tsunami of 2011 highlighted the vulnerability of urban habitations
to such major disasters and the need to improve survivability. As has become the norm after such
events, field teams were sent to investigate and learn lessons to aid future design guidelines.
In addition, Google Street View cars were sent around inundated areas once roads were cleared and
the resulting images were displayed online allowing ready comparison with images taken before the
event. This report is the output from a project which examined this remote assessment tool to
determine its usefulness for engineers. It was found that much of what is observable in the field is
also visible in the online archive. Performance of structures of different types can be assessed both
quantitatively, as a function of distance from the shoreline, and also qualitatively for beneficial
features such as open ground floors. Advantageous features of urban design such as sheltering by
trees and other buildings, and siting of structures to serve as vertical evacuation centres could, also
be assessed.
Overall, although the online images cannot completely replace a field survey, they have the
potential to exploit untapped resource in researchers around the world collaborating with local
engineers to learn lessons and improve tsunami resistance of vulnerable coastal communities.
2
Introduction
Tsunamis can have devastating impact on inhabited coastal zones, causing inundation and
widespread destruction up to 5km inland depending on the land’s topography, as experienced in the
Great East Japan (Tohuko) event of March 2011. Because of the high tsunami wave speed in open
water, it is difficult to provide adequate warning to evacuate coastal areas. There is a need to
improve both the performance of individual structures (with an emphasis on survivability) and the
configuration of urban areas as a whole, to mitigate the wave impact.
The most recent tsunami design code for ordinary onshore structures is the FEMA P55 Coastal
Construction Manual (FEMA, 2005). Design methods may be developed through physical modelling
in a wave tank (e.g. Collins et al., 2012); however it is hard to reproduce the hydraulic conditions,
their impact on structures and the structural response all in one laboratory test, due to scaling
difficulties. Field investigations, as carried out for the Indian Ocean (2004), Chile (2010) and Tohoku
(2011) events (EEFIT, 2006, 2010 & 2011), have therefore been important to developing
understanding of tsunami engineering.
Such investigations are normally carried out soon after the event, with data collection on
performance of individual structures (related to their form, material, age and location),
measurements of inundation height, interviews with local residents, etc. Research into the 2004
Indian Ocean Tsunami was carried out by Tohoku University International Research Institute of
Disaster Science (IRIDeS) within the first month following the disaster (Kawata et al., 2005). To
witness the undisturbed debris field, field teams need to reach the area within the first two weeks,
however this early arrival may obstruct emergency relief operations.
In Tohoku (2011), the Ministry of Land, Infrastructure and Transportation of Japan (MLIT) carried out
a comprehensive survey of over 250,000 structures in seven provinces affected by the disaster
(Suppasri et al., 2013). The Earthquake Engineering Field Investigation Team (EEFIT) of the UK
returned two years later to examine the recovery and reconstruction process (EEFIT, 2013). Further
field studies are reported by EEFIT (2013, ps. 21, 28).
Advances in technology have made remote data collection possible as an alternative to field
investigations. After Chile (2010), GPS and high-resolution pre- and post-event satellite imagery
were used to collect data prior to the EEFIT field investigation, including inundation and debris
extents, changes in shoreline and even damage status of individual buildings, helping it to focus on
more heavily damaged areas.
3
For the first time, after Tohoku (2011), pre- and post-event imagery has been made available
together in one online portal via Google Street View (2011) (GSV), enabling web users to zoom in on
individual streets and buildings. Data on inundation height and damage to individual buildings could
potentially be obtained from such imagery whilst offering the following advantages over field
investigations:
• A more accurate overall view of damage caused by a disaster, rather than sampling at a
limited number of sites.
• Allowing communities to rebuild without unnecessary interference during relief operations,
except for the need to allow access for the GSV car.
• Permitting opportunity for reflection and for re-examination of the data, without the time
limitation of a field study.
The ability of remote GSV data to ascertain the age, structural form, materials and scale of damage
within individual buildings may be limited, making field investigations still necessary to conduct
interviews or examine buildings close at hand. This study aims to investigate what can be learnt from
the GSV Tohoku pre- and post-event images and to evaluate to what extent such a remote
assessment methodology could replace or augment a traditional field investigation. The focus will
be on two aspects – performance and design of individual structures, and understanding of how
building configuration and location relative to shoreline affects damage distribution. The latter
includes consideration of Vertical Evacuation Shelters – positioning and potential provision from
buildings constructed for another purpose. Technical conclusions of the study are compared with
those of the other major field-based studies, chiefly EEFIT (2011).
Background to the remote data collection
Google Street View cars were sent around major cities and coastal areas of Tohoku, photographing
streets over a six month period starting four months after the tsunami. Images were compiled with
those taken before the event to produce an accessible digital archive laid out to allow
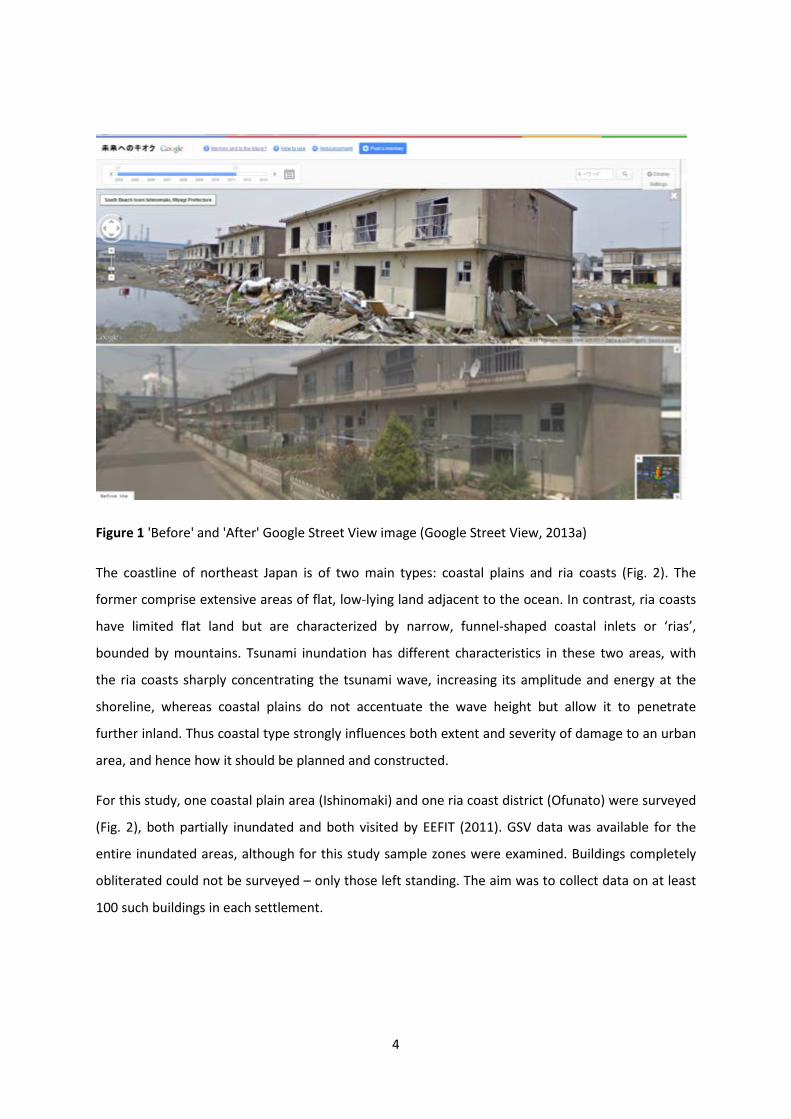
straightforward comparison of the ‘Before’ and ‘After’ situations at any location. Figure 1 shows a
typical screenshot.
4
Figure 1 'Before' and 'After' Google Street View image (Google Street View, 2013a)
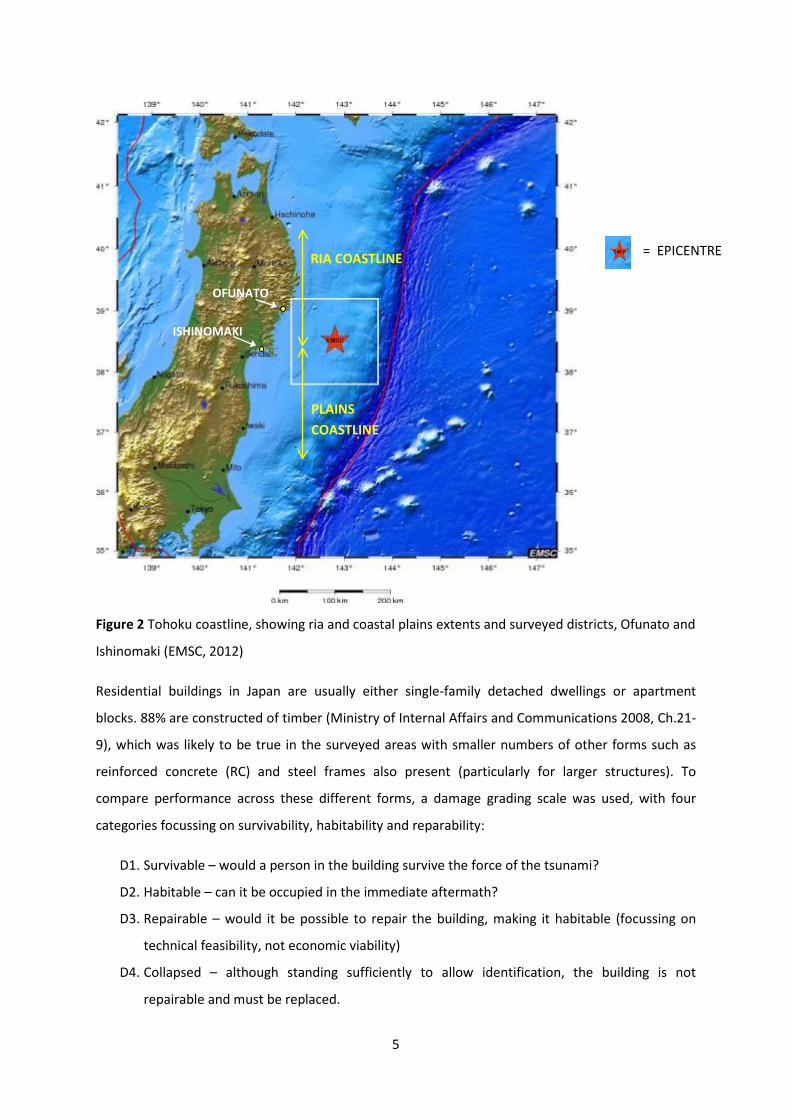
The coastline of northeast Japan is of two main types: coastal plains and ria coasts (Fig. 2). The
former comprise extensive areas of flat, low-lying land adjacent to the ocean. In contrast, ria coasts
have limited flat land but are characterized by narrow, funnel-shaped coastal inlets or ‘rias’,
bounded by mountains. Tsunami inundation has different characteristics in these two areas, with
the ria coasts sharply concentrating the tsunami wave, increasing its amplitude and energy at the
shoreline, whereas coastal plains do not accentuate the wave height but allow it to penetrate
further inland. Thus coastal type strongly influences both extent and severity of damage to an urban
area, and hence how it should be planned and constructed.
For this study, one coastal plain area (Ishinomaki) and one ria coast district (Ofunato) were surveyed
(Fig. 2), both partially inundated and both visited by EEFIT (2011). GSV data was available for the
entire inundated areas, although for this study sample zones were examined. Buildings completely
obliterated could not be surveyed – only those left standing. The aim was to collect data on at least
100 such buildings in each settlement.
5
Figure 2 Tohoku coastline, showing ria and coastal plains extents and surveyed districts, Ofunato and
Ishinomaki (EMSC, 2012)
Residential buildings in Japan are usually either single-family detached dwellings or apartment
blocks. 88% are constructed of timber (Ministry of Internal Affairs and Communications 2008, Ch.21-
9), which was likely to be true in the surveyed areas with smaller numbers of other forms such as
reinforced concrete (RC) and steel frames also present (particularly for larger structures). To
compare performance across these different forms, a damage grading scale was used, with four
categories focussing on survivability, habitability and reparability:
D1. Survivable – would a person in the building survive the force of the tsunami?
D2. Habitable – can it be occupied in the immediate aftermath?
D3. Repairable – would it be possible to repair the building, making it habitable (focussing on
technical feasibility, not economic viability)
D4. Collapsed – although standing sufficiently to allow identification, the building is not
repairable and must be replaced.
RIA COASTLINE
PLAINS COASTLINE
= EPICENTRE
OFUNATO
ISHINOMAKI
6
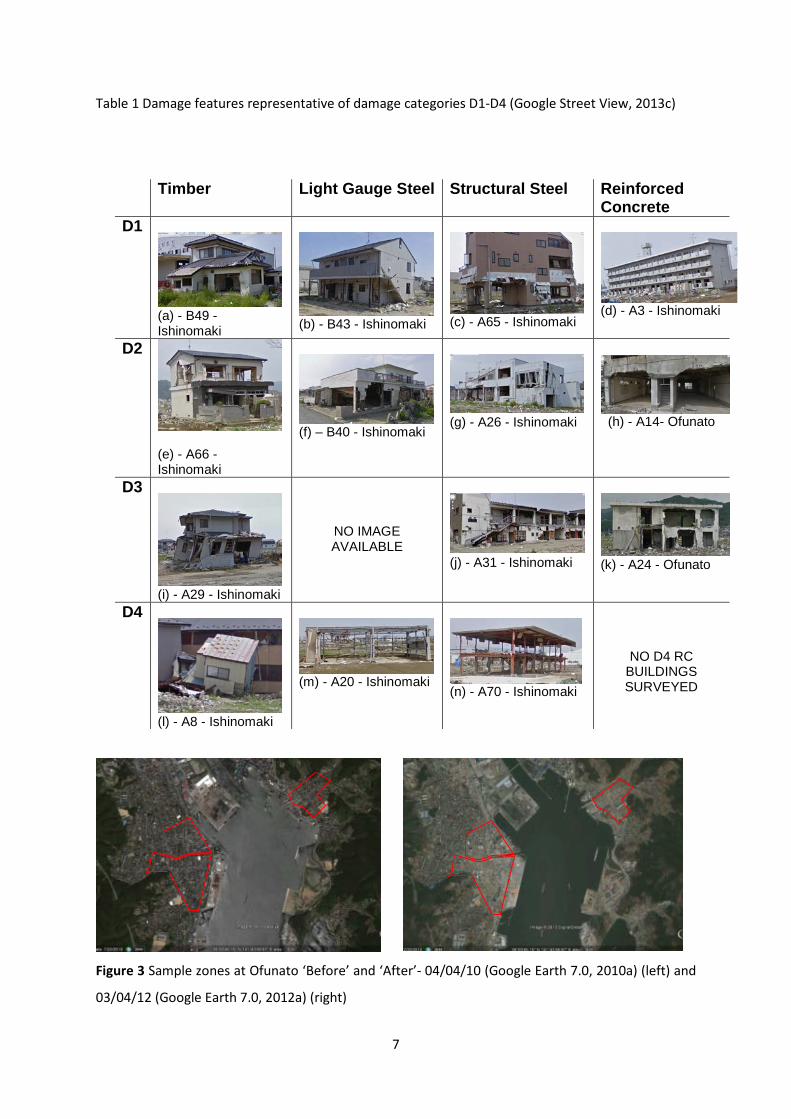
Examples of the damage categories for buildings of each of the main structural types encountered in
the study are shown in Table 1. The damage category is judged by viewing the building from as many
directions as possible in GSV. Each building is given a unique reference number and its co-ordinates
logged for later analysis. To understand its damage in the wider context, the following information
was also gathered:
• Distance from shore (m)
• Building usage, e.g. industrial, commercial, residential
• Building frame and cladding materials
• Location in relation to other buildings – to assess if effects of sheltering are evident
The total number of buildings present in each zone before the tsunami was estimated from the
‘Before’ GSV images, and hence the proportion left standing afterwards calculated. Both
quantitative and qualitative analyses were carried out on data from each zone, with quantitative
data presented in the form of stacked bar charts, examining the performance of structures of
different frame types at varying distances from the shoreline, and qualitative data presented as case
studies of building design and configuration that appearing to perform well relative to distance from
the shoreline.
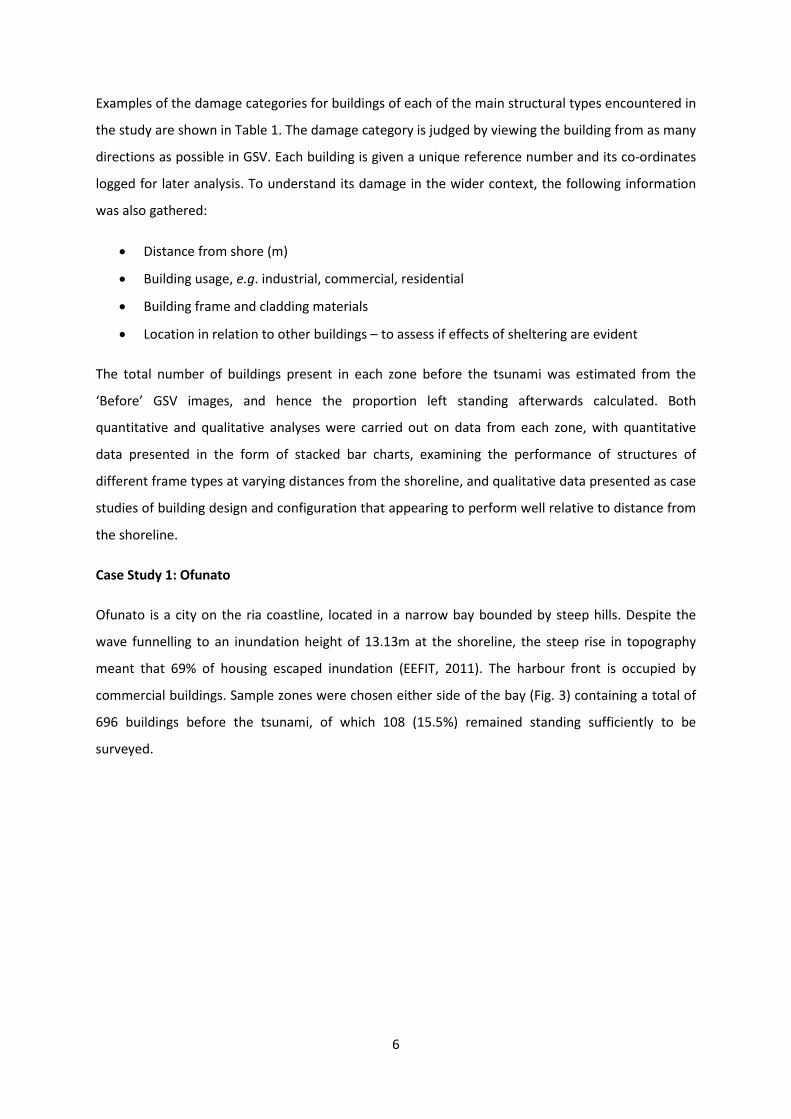
Case Study 1: Ofunato
Ofunato is a city on the ria coastline, located in a narrow bay bounded by steep hills. Despite the
wave funnelling to an inundation height of 13.13m at the shoreline, the steep rise in topography
meant that 69% of housing escaped inundation (EEFIT, 2011). The harbour front is occupied by
commercial buildings. Sample zones were chosen either side of the bay (Fig. 3) containing a total of
696 buildings before the tsunami, of which 108 (15.5%) remained standing sufficiently to be
surveyed.
7
Table 1 Damage features representative of damage categories D1-D4 (Google Street View, 2013c)
Figure 3 Sample zones at Ofunato ‘Before’ and ‘After’- 04/04/10 (Google Earth 7.0, 2010a) (left) and
03/04/12 (Google Earth 7.0, 2012a) (right)
Timber Light Gauge Steel Structural Steel Reinforced Concrete
D1
(a) - B49 - Ishinomaki
(b) - B43 - Ishinomaki
(c) - A65 - Ishinomaki
(d) - A3 - Ishinomaki
D2
(e) - A66 - Ishinomaki
(f) – B40 - Ishinomaki
(g) - A26 - Ishinomaki
(h) - A14- Ofunato
D3
(i) - A29 - Ishinomaki
NO IMAGE AVAILABLE
(j) - A31 - Ishinomaki
(k) - A24 - Ofunato
D4
(l) - A8 - Ishinomaki
(m) - A20 - Ishinomaki
(n) - A70 - Ishinomaki
NO D4 RC BUILDINGS SURVEYED
8
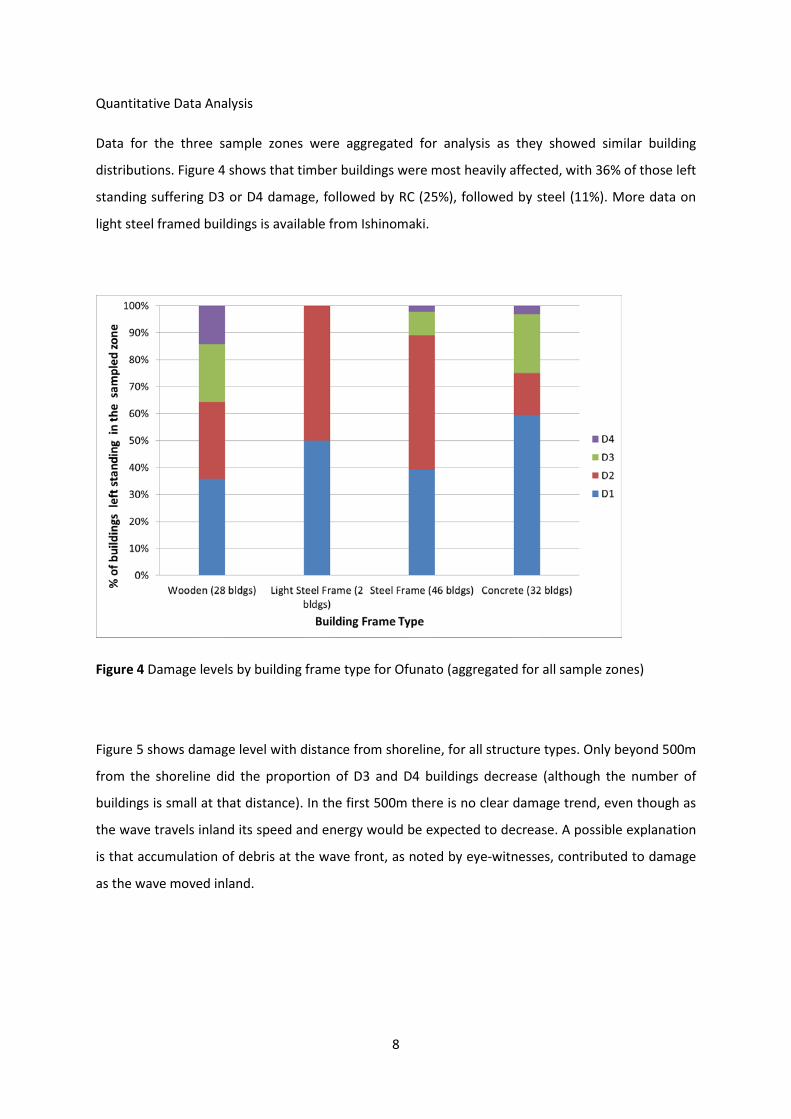
Quantitative Data Analysis
Data for the three sample zones were aggregated for analysis as they showed similar building
distributions. Figure 4 shows that timber buildings were most heavily affected, with 36% of those left
standing suffering D3 or D4 damage, followed by RC (25%), followed by steel (11%). More data on
light steel framed buildings is available from Ishinomaki.
Figure 4 Damage levels by building frame type for Ofunato (aggregated for all sample zones)
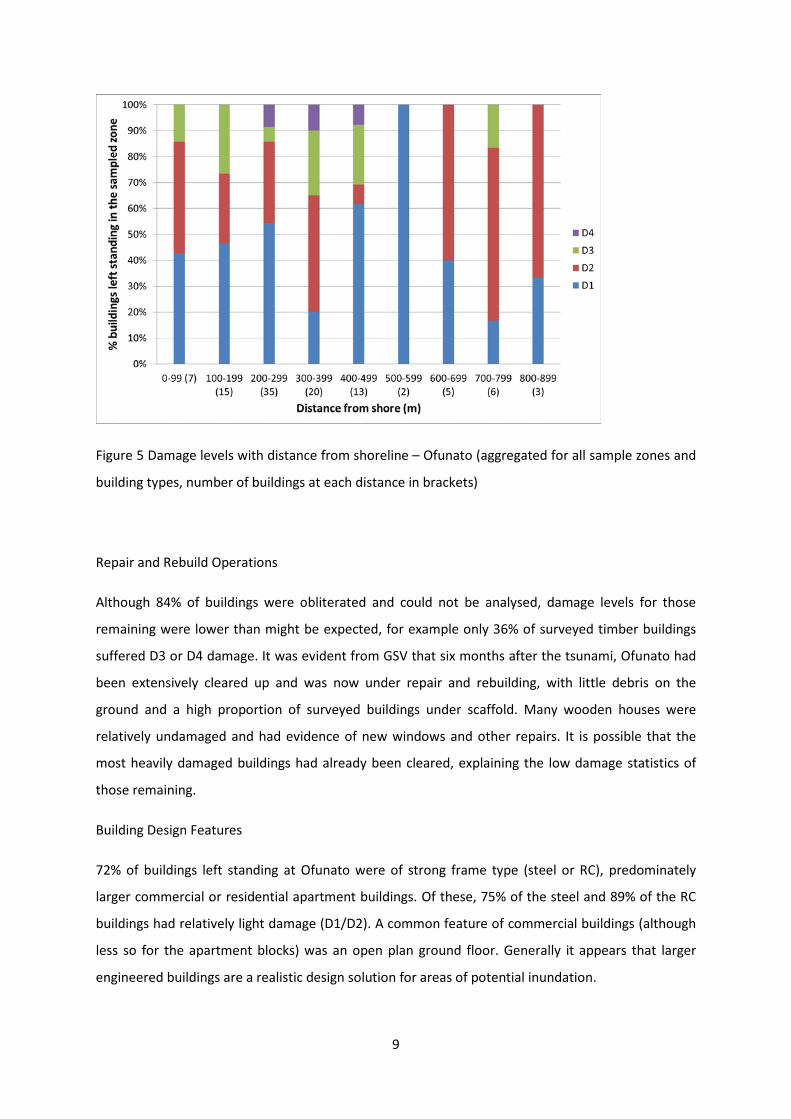
Figure 5 shows damage level with distance from shoreline, for all structure types. Only beyond 500m
from the shoreline did the proportion of D3 and D4 buildings decrease (although the number of
buildings is small at that distance). In the first 500m there is no clear damage trend, even though as
the wave travels inland its speed and energy would be expected to decrease. A possible explanation
is that accumulation of debris at the wave front, as noted by eye-witnesses, contributed to damage
as the wave moved inland.
9
Figure 5 Damage levels with distance from shoreline – Ofunato (aggregated for all sample zones and
building types, number of buildings at each distance in brackets)
Repair and Rebuild Operations
Although 84% of buildings were obliterated and could not be analysed, damage levels for those
remaining were lower than might be expected, for example only 36% of surveyed timber buildings
suffered D3 or D4 damage. It was evident from GSV that six months after the tsunami, Ofunato had
been extensively cleared up and was now under repair and rebuilding, with little debris on the
ground and a high proportion of surveyed buildings under scaffold. Many wooden houses were
relatively undamaged and had evidence of new windows and other repairs. It is possible that the
most heavily damaged buildings had already been cleared, explaining the low damage statistics of
those remaining.
Building Design Features
72% of buildings left standing at Ofunato were of strong frame type (steel or RC), predominately
larger commercial or residential apartment buildings. Of these, 75% of the steel and 89% of the RC
buildings had relatively light damage (D1/D2). A common feature of commercial buildings (although
less so for the apartment blocks) was an open plan ground floor. Generally it appears that larger
engineered buildings are a realistic design solution for areas of potential inundation.
10
Case Study 2: Ishinomaki
Ishinomaki is a port town on the coastal plains, with an estimated population of 117,233 (see
http://www.geonames.org/maps/cities.html). Most of the city’s commercial and industrial buildings
are located around the port, with residential areas generally further inland. 69% of the city’s
population was situated in the inundation zone (EEFIT, 2011).
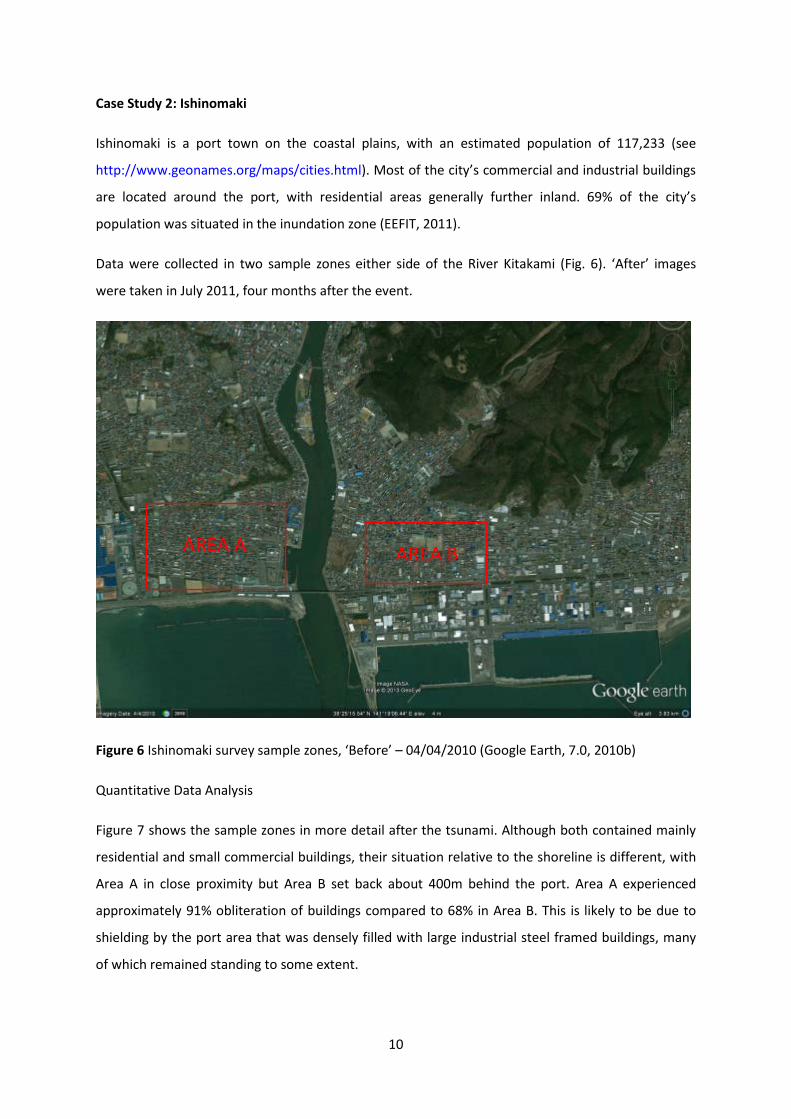
Data were collected in two sample zones either side of the River Kitakami (Fig. 6). ‘After’ images
were taken in July 2011, four months after the event.
Figure 6 Ishinomaki survey sample zones, ‘Before’ – 04/04/2010 (Google Earth, 7.0, 2010b)
Quantitative Data Analysis
Figure 7 shows the sample zones in more detail after the tsunami. Although both contained mainly
residential and small commercial buildings, their situation relative to the shoreline is different, with
Area A in close proximity but Area B set back about 400m behind the port. Area A experienced
approximately 91% obliteration of buildings compared to 68% in Area B. This is likely to be due to
shielding by the port area that was densely filled with large industrial steel framed buildings, many
of which remained standing to some extent.
AREA A AREA B
11
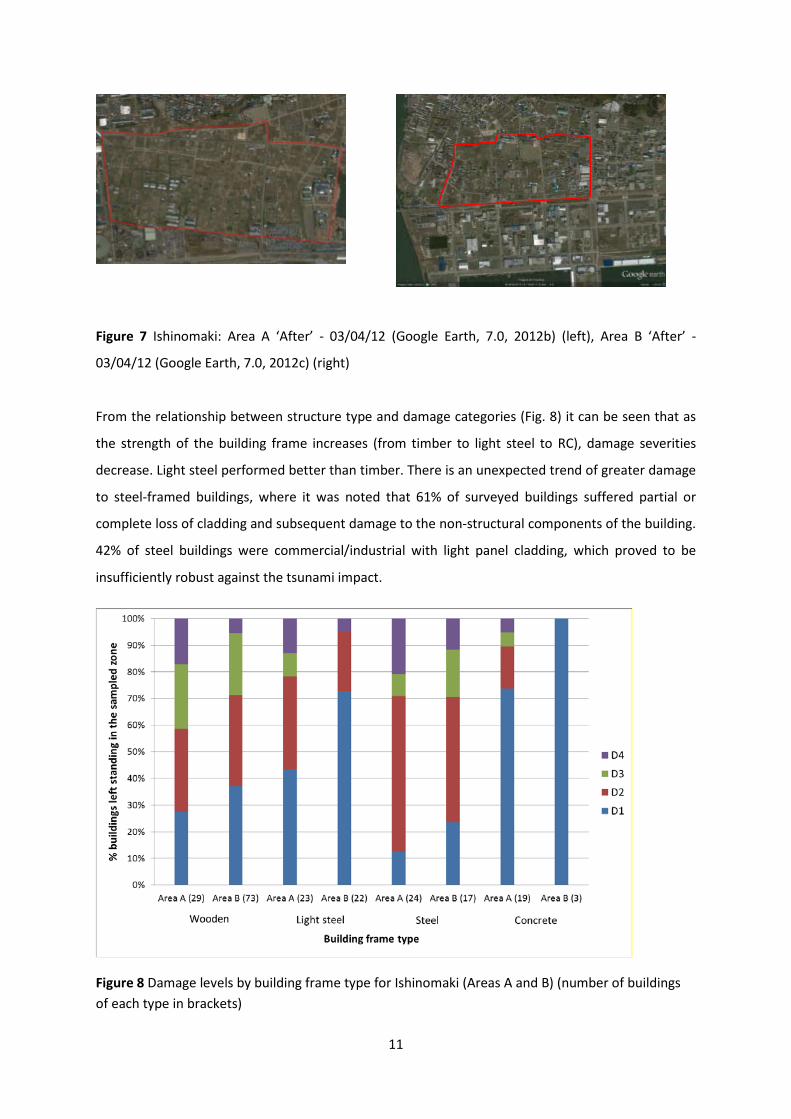
Figure 7 Ishinomaki: Area A ‘After’ - 03/04/12 (Google Earth, 7.0, 2012b) (left), Area B ‘After’ -
03/04/12 (Google Earth, 7.0, 2012c) (right)
From the relationship between structure type and damage categories (Fig. 8) it can be seen that as
the strength of the building frame increases (from timber to light steel to RC), damage severities
decrease. Light steel performed better than timber. There is an unexpected trend of greater damage
to steel-framed buildings, where it was noted that 61% of surveyed buildings suffered partial or
complete loss of cladding and subsequent damage to the non-structural components of the building.
42% of steel buildings were commercial/industrial with light panel cladding, which proved to be
insufficiently robust against the tsunami impact.
Figure 8 Damage levels by building frame type for Ishinomaki (Areas A and B) (number of buildings of each type in brackets)
12
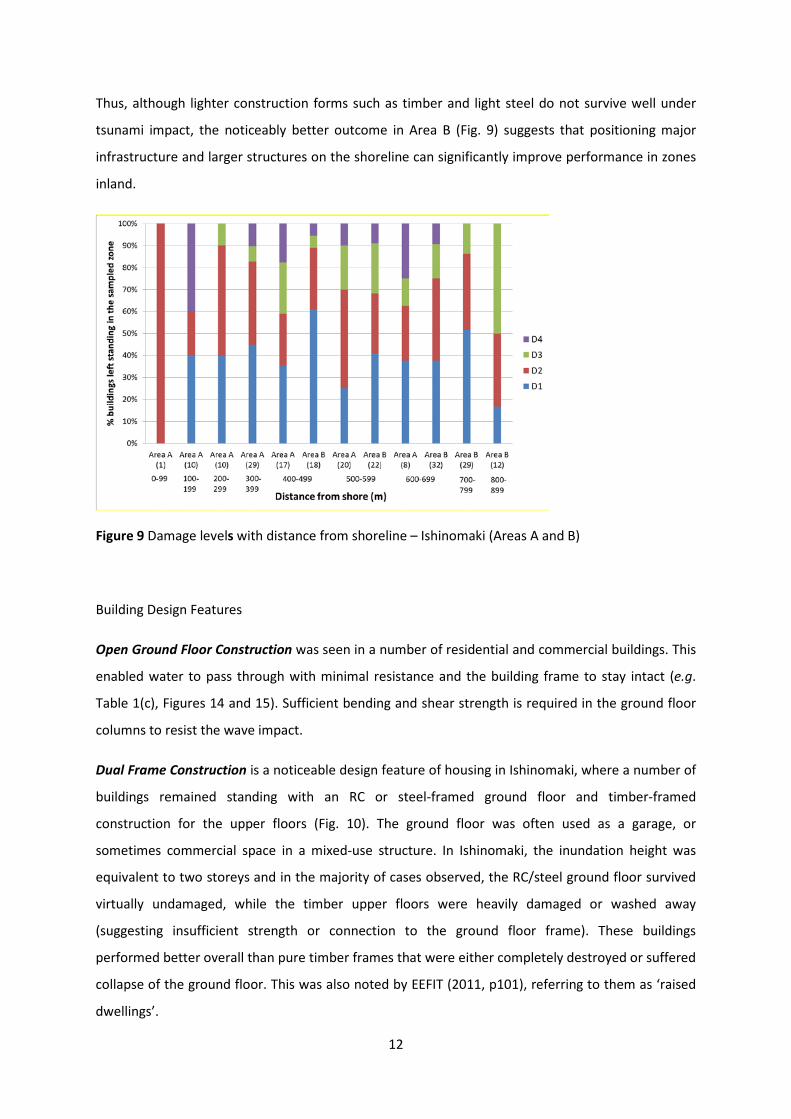
Thus, although lighter construction forms such as timber and light steel do not survive well under
tsunami impact, the noticeably better outcome in Area B (Fig. 9) suggests that positioning major
infrastructure and larger structures on the shoreline can significantly improve performance in zones
inland.
Figure 9 Damage levels with distance from shoreline – Ishinomaki (Areas A and B)
Building Design Features
Open Ground Floor Construction was seen in a number of residential and commercial buildings. This
enabled water to pass through with minimal resistance and the building frame to stay intact (e.g.
Table 1(c), Figures 14 and 15). Sufficient bending and shear strength is required in the ground floor
columns to resist the wave impact.
Dual Frame Construction is a noticeable design feature of housing in Ishinomaki, where a number of
buildings remained standing with an RC or steel-framed ground floor and timber-framed
construction for the upper floors (Fig. 10). The ground floor was often used as a garage, or
sometimes commercial space in a mixed-use structure. In Ishinomaki, the inundation height was
equivalent to two storeys and in the majority of cases observed, the RC/steel ground floor survived
virtually undamaged, while the timber upper floors were heavily damaged or washed away
(suggesting insufficient strength or connection to the ground floor frame). These buildings
performed better overall than pure timber frames that were either completely destroyed or suffered
collapse of the ground floor. This was also noted by EEFIT (2011, p101), referring to them as ‘raised
dwellings’.
13
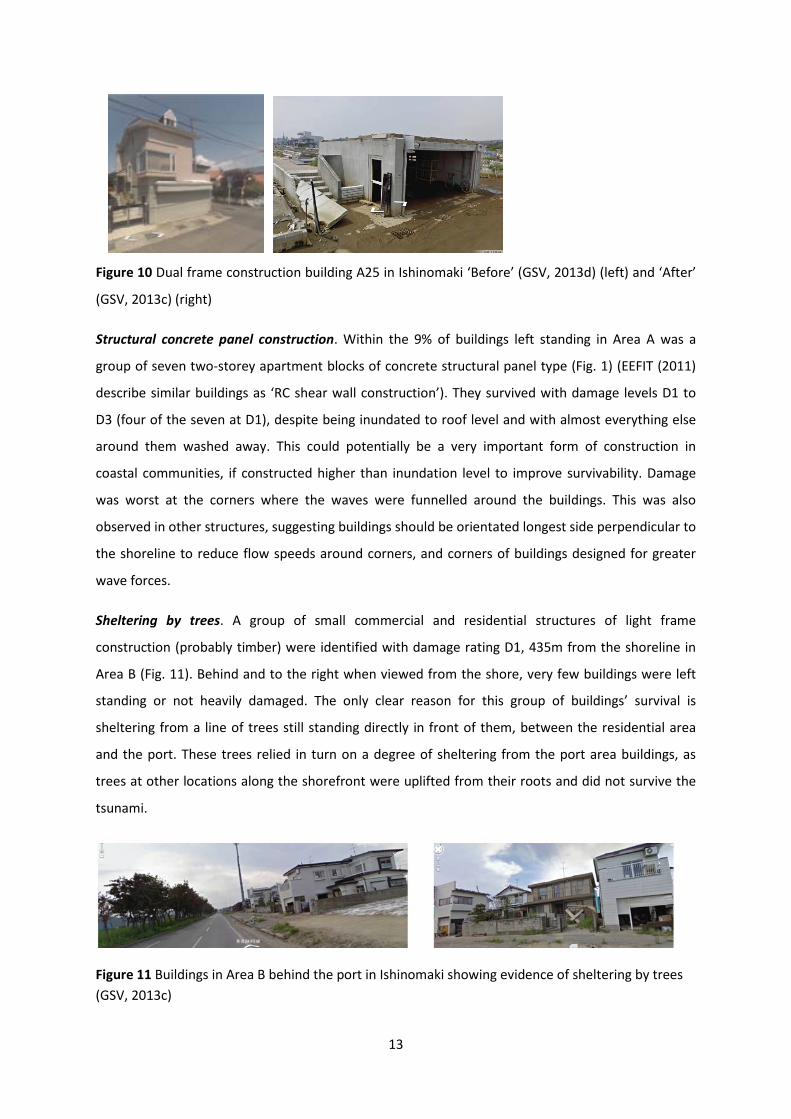
Figure 10 Dual frame construction building A25 in Ishinomaki ‘Before’ (GSV, 2013d) (left) and ‘After’
(GSV, 2013c) (right)
Structural concrete panel construction. Within the 9% of buildings left standing in Area A was a
group of seven two-storey apartment blocks of concrete structural panel type (Fig. 1) (EEFIT (2011)
describe similar buildings as ‘RC shear wall construction’). They survived with damage levels D1 to
D3 (four of the seven at D1), despite being inundated to roof level and with almost everything else
around them washed away. This could potentially be a very important form of construction in
coastal communities, if constructed higher than inundation level to improve survivability. Damage
was worst at the corners where the waves were funnelled around the buildings. This was also
observed in other structures, suggesting buildings should be orientated longest side perpendicular to
the shoreline to reduce flow speeds around corners, and corners of buildings designed for greater
wave forces.
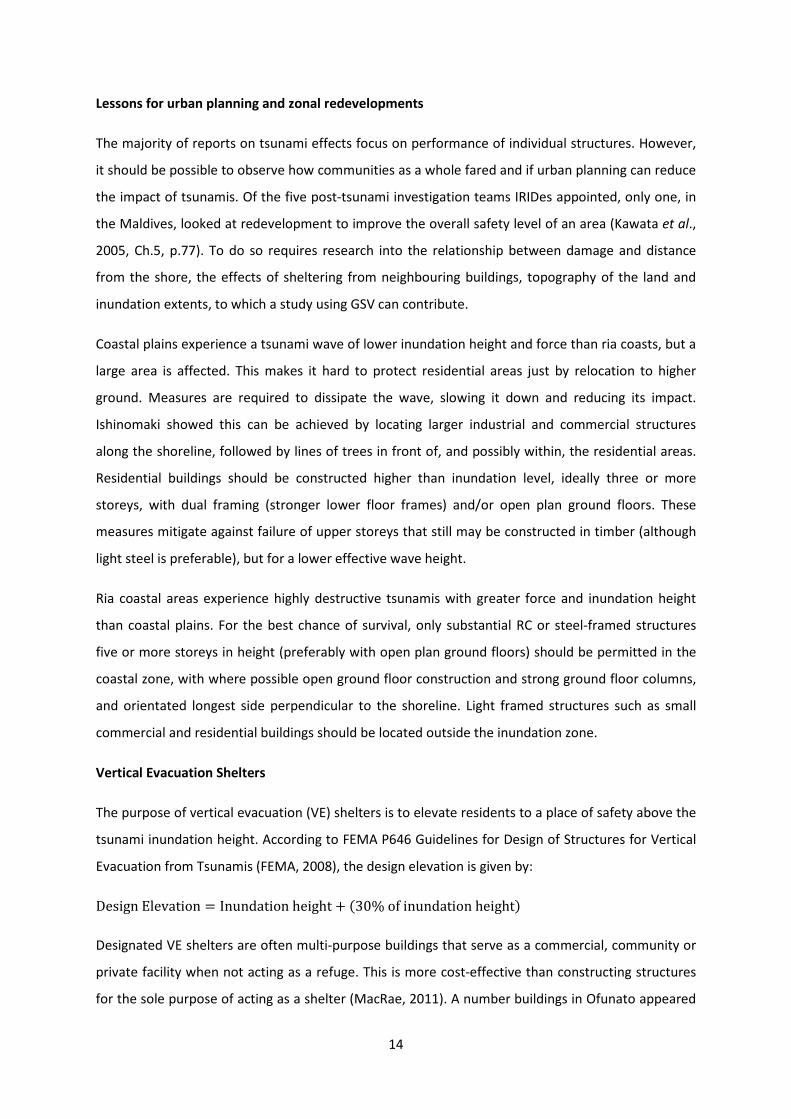
Sheltering by trees. A group of small commercial and residential structures of light frame
construction (probably timber) were identified with damage rating D1, 435m from the shoreline in
Area B (Fig. 11). Behind and to the right when viewed from the shore, very few buildings were left
standing or not heavily damaged. The only clear reason for this group of buildings’ survival is
sheltering from a line of trees still standing directly in front of them, between the residential area
and the port. These trees relied in turn on a degree of sheltering from the port area buildings, as
trees at other locations along the shorefront were uplifted from their roots and did not survive the
tsunami.
Figure 11 Buildings in Area B behind the port in Ishinomaki showing evidence of sheltering by trees (GSV, 2013c)
14
Lessons for urban planning and zonal redevelopments
The majority of reports on tsunami effects focus on performance of individual structures. However,
it should be possible to observe how communities as a whole fared and if urban planning can reduce
the impact of tsunamis. Of the five post-tsunami investigation teams IRIDes appointed, only one, in
the Maldives, looked at redevelopment to improve the overall safety level of an area (Kawata et al.,
2005, Ch.5, p.77). To do so requires research into the relationship between damage and distance
from the shore, the effects of sheltering from neighbouring buildings, topography of the land and
inundation extents, to which a study using GSV can contribute.
Coastal plains experience a tsunami wave of lower inundation height and force than ria coasts, but a
large area is affected. This makes it hard to protect residential areas just by relocation to higher
ground. Measures are required to dissipate the wave, slowing it down and reducing its impact.
Ishinomaki showed this can be achieved by locating larger industrial and commercial structures
along the shoreline, followed by lines of trees in front of, and possibly within, the residential areas.
Residential buildings should be constructed higher than inundation level, ideally three or more
storeys, with dual framing (stronger lower floor frames) and/or open plan ground floors. These
measures mitigate against failure of upper storeys that still may be constructed in timber (although
light steel is preferable), but for a lower effective wave height.
Ria coastal areas experience highly destructive tsunamis with greater force and inundation height
than coastal plains. For the best chance of survival, only substantial RC or steel-framed structures
five or more storeys in height (preferably with open plan ground floors) should be permitted in the
coastal zone, with where possible open ground floor construction and strong ground floor columns,
and orientated longest side perpendicular to the shoreline. Light framed structures such as small
commercial and residential buildings should be located outside the inundation zone.
Vertical Evacuation Shelters
The purpose of vertical evacuation (VE) shelters is to elevate residents to a place of safety above the
tsunami inundation height. According to FEMA P646 Guidelines for Design of Structures for Vertical
Evacuation from Tsunamis (FEMA, 2008), the design elevation is given by:
Design Elevation = Inundation height + (30% of inundation height)
Designated VE shelters are often multi-purpose buildings that serve as a commercial, community or
private facility when not acting as a refuge. This is more cost-effective than constructing structures
for the sole purpose of acting as a shelter (MacRae, 2011). A number buildings in Ofunato appeared
15
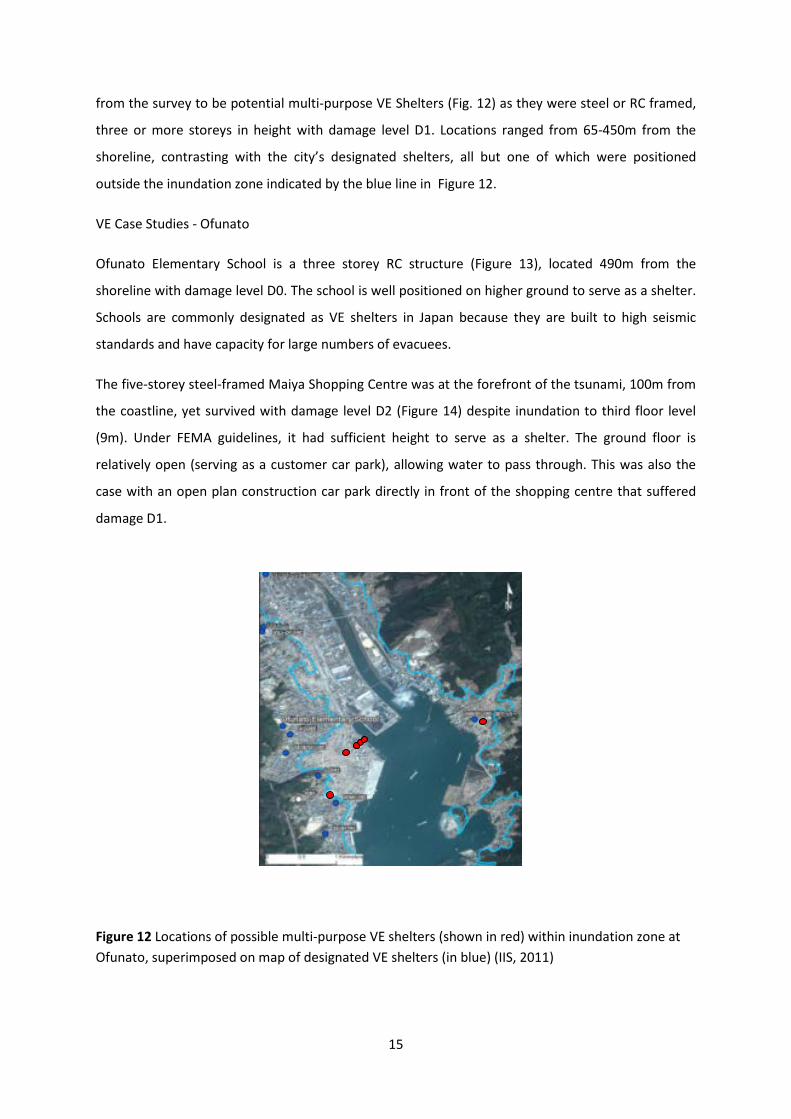
from the survey to be potential multi-purpose VE Shelters (Fig. 12) as they were steel or RC framed,
three or more storeys in height with damage level D1. Locations ranged from 65-450m from the
shoreline, contrasting with the city’s designated shelters, all but one of which were positioned
outside the inundation zone indicated by the blue line in Figure 12.
VE Case Studies - Ofunato
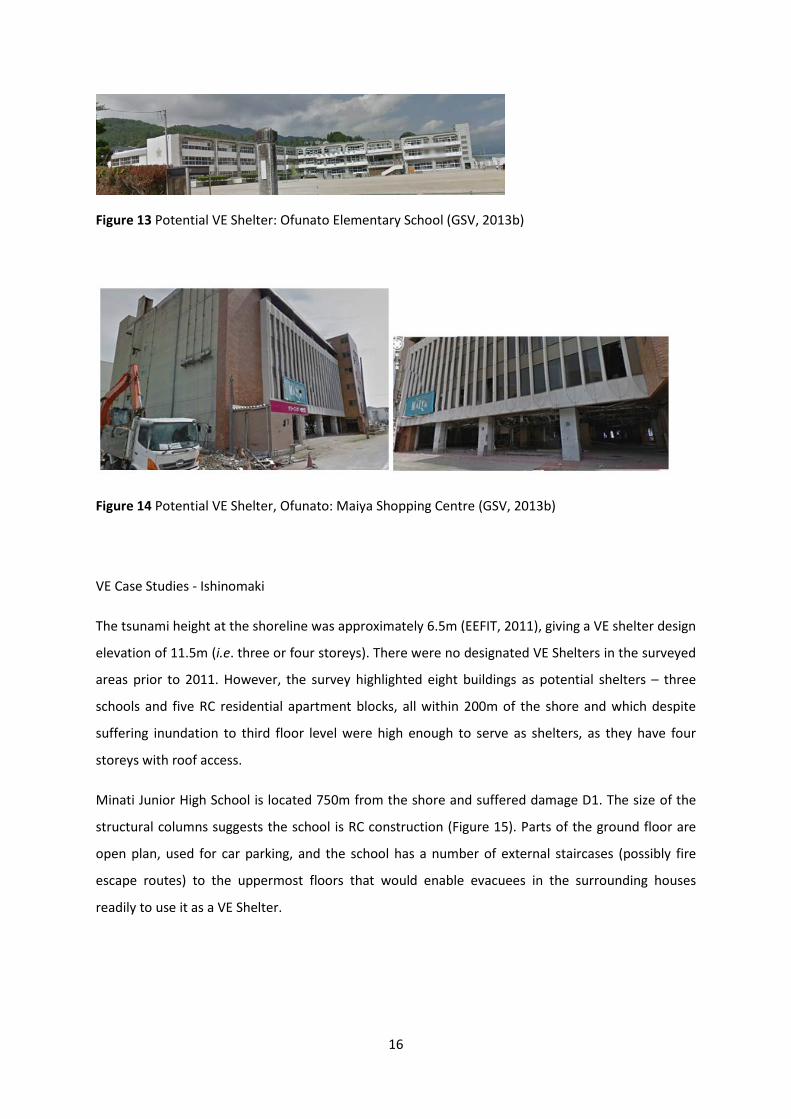
Ofunato Elementary School is a three storey RC structure (Figure 13), located 490m from the
shoreline with damage level D0. The school is well positioned on higher ground to serve as a shelter.
Schools are commonly designated as VE shelters in Japan because they are built to high seismic
standards and have capacity for large numbers of evacuees.
The five-storey steel-framed Maiya Shopping Centre was at the forefront of the tsunami, 100m from
the coastline, yet survived with damage level D2 (Figure 14) despite inundation to third floor level
(9m). Under FEMA guidelines, it had sufficient height to serve as a shelter. The ground floor is
relatively open (serving as a customer car park), allowing water to pass through. This was also the
case with an open plan construction car park directly in front of the shopping centre that suffered
damage D1.
Figure 12 Locations of possible multi-purpose VE shelters (shown in red) within inundation zone at Ofunato, superimposed on map of designated VE shelters (in blue) (IIS, 2011)
16
Figure 13 Potential VE Shelter: Ofunato Elementary School (GSV, 2013b)
Figure 14 Potential VE Shelter, Ofunato: Maiya Shopping Centre (GSV, 2013b)
VE Case Studies - Ishinomaki
The tsunami height at the shoreline was approximately 6.5m (EEFIT, 2011), giving a VE shelter design
elevation of 11.5m (i.e. three or four storeys). There were no designated VE Shelters in the surveyed
areas prior to 2011. However, the survey highlighted eight buildings as potential shelters – three
schools and five RC residential apartment blocks, all within 200m of the shore and which despite
suffering inundation to third floor level were high enough to serve as shelters, as they have four
storeys with roof access.
Minati Junior High School is located 750m from the shore and suffered damage D1. The size of the
structural columns suggests the school is RC construction (Figure 15). Parts of the ground floor are
open plan, used for car parking, and the school has a number of external staircases (possibly fire
escape routes) to the uppermost floors that would enable evacuees in the surrounding houses
readily to use it as a VE Shelter.
17
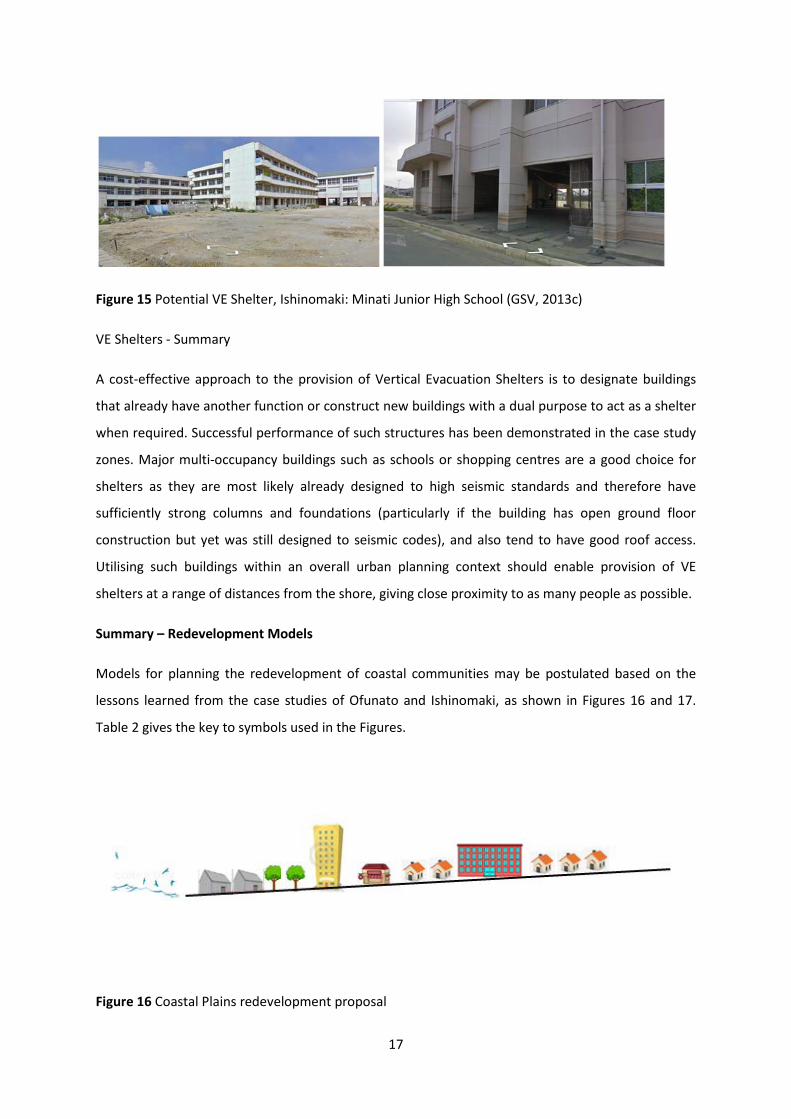
Figure 15 Potential VE Shelter, Ishinomaki: Minati Junior High School (GSV, 2013c)
VE Shelters - Summary
A cost-effective approach to the provision of Vertical Evacuation Shelters is to designate buildings
that already have another function or construct new buildings with a dual purpose to act as a shelter
when required. Successful performance of such structures has been demonstrated in the case study
zones. Major multi-occupancy buildings such as schools or shopping centres are a good choice for
shelters as they are most likely already designed to high seismic standards and therefore have
sufficiently strong columns and foundations (particularly if the building has open ground floor
construction but yet was still designed to seismic codes), and also tend to have good roof access.
Utilising such buildings within an overall urban planning context should enable provision of VE
shelters at a range of distances from the shore, giving close proximity to as many people as possible.
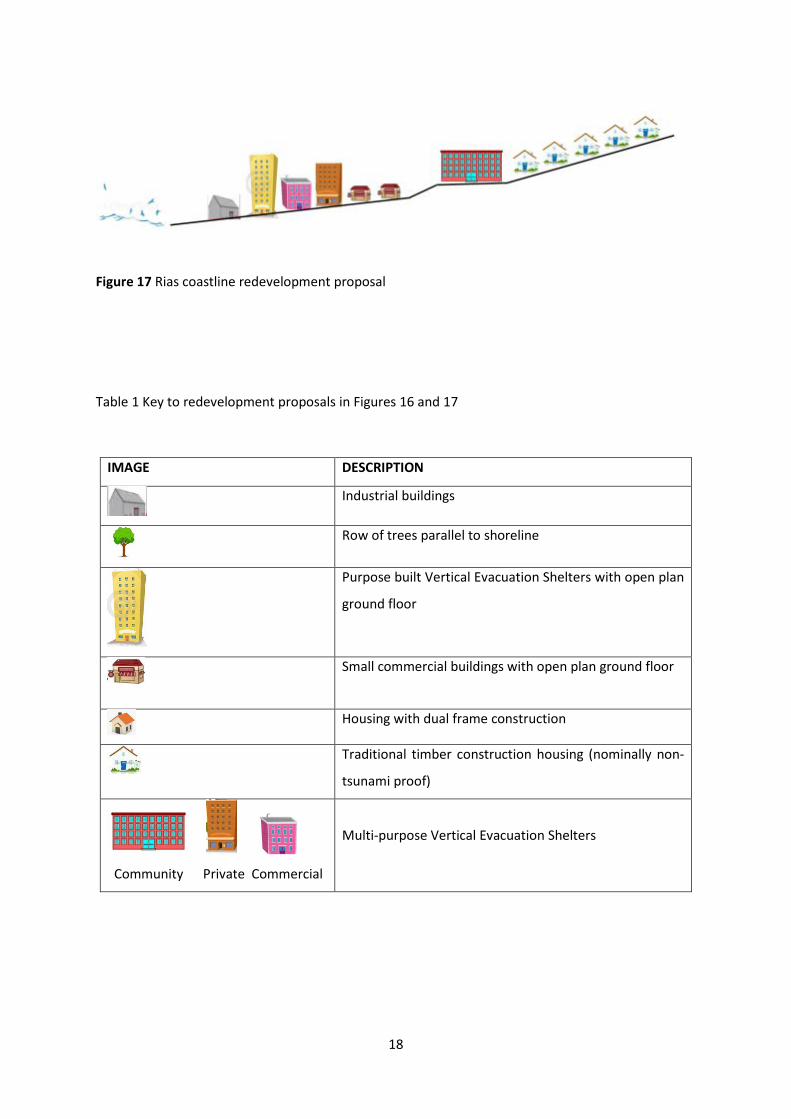
Summary – Redevelopment Models
Models for planning the redevelopment of coastal communities may be postulated based on the
lessons learned from the case studies of Ofunato and Ishinomaki, as shown in Figures 16 and 17.
Table 2 gives the key to symbols used in the Figures.
Figure 16 Coastal Plains redevelopment proposal
18
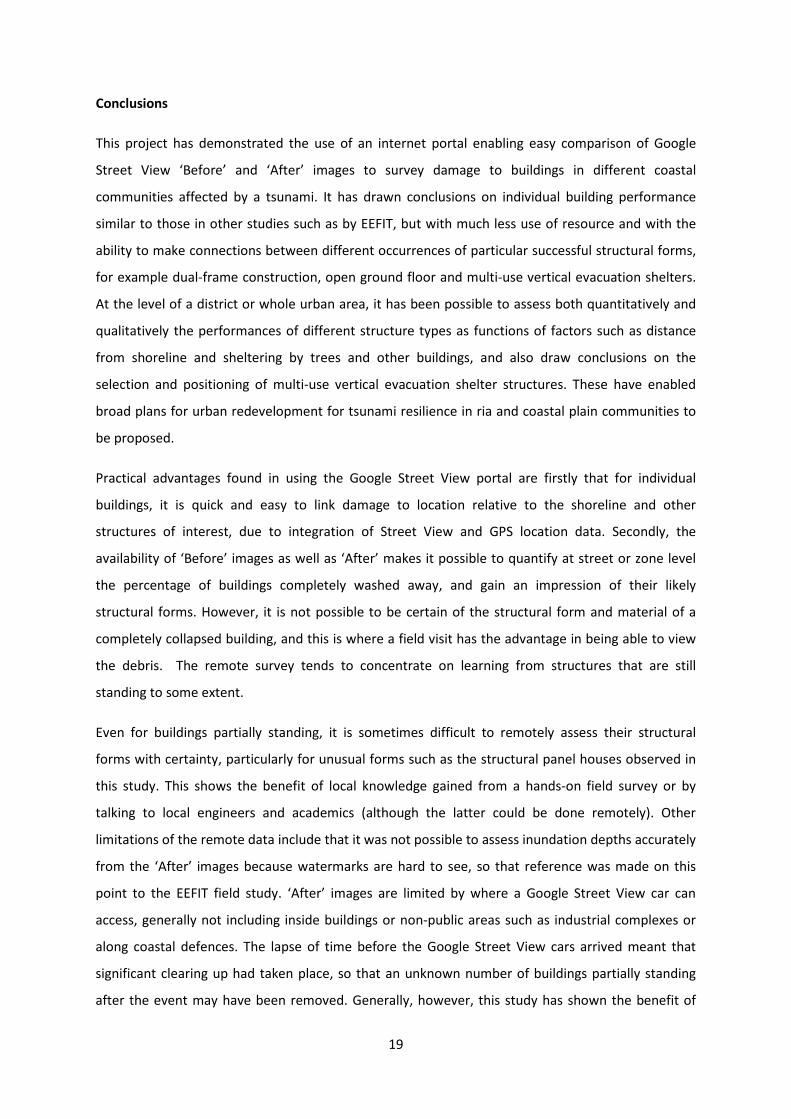
Figure 17 Rias coastline redevelopment proposal
Table 1 Key to redevelopment proposals in Figures 16 and 17
IMAGE DESCRIPTION
Industrial buildings
Row of trees parallel to shoreline
Purpose built Vertical Evacuation Shelters with open plan
ground floor
Small commercial buildings with open plan ground floor
Housing with dual frame construction
Traditional timber construction housing (nominally non-
tsunami proof)
Community Private Commercial
Multi-purpose Vertical Evacuation Shelters
19
Conclusions
This project has demonstrated the use of an internet portal enabling easy comparison of Google
Street View ‘Before’ and ‘After’ images to survey damage to buildings in different coastal
communities affected by a tsunami. It has drawn conclusions on individual building performance
similar to those in other studies such as by EEFIT, but with much less use of resource and with the
ability to make connections between different occurrences of particular successful structural forms,
for example dual-frame construction, open ground floor and multi-use vertical evacuation shelters.
At the level of a district or whole urban area, it has been possible to assess both quantitatively and
qualitatively the performances of different structure types as functions of factors such as distance
from shoreline and sheltering by trees and other buildings, and also draw conclusions on the
selection and positioning of multi-use vertical evacuation shelter structures. These have enabled
broad plans for urban redevelopment for tsunami resilience in ria and coastal plain communities to
be proposed.
Practical advantages found in using the Google Street View portal are firstly that for individual
buildings, it is quick and easy to link damage to location relative to the shoreline and other
structures of interest, due to integration of Street View and GPS location data. Secondly, the
availability of ‘Before’ images as well as ‘After’ makes it possible to quantify at street or zone level
the percentage of buildings completely washed away, and gain an impression of their likely
structural forms. However, it is not possible to be certain of the structural form and material of a
completely collapsed building, and this is where a field visit has the advantage in being able to view
the debris. The remote survey tends to concentrate on learning from structures that are still
standing to some extent.
Even for buildings partially standing, it is sometimes difficult to remotely assess their structural
forms with certainty, particularly for unusual forms such as the structural panel houses observed in
this study. This shows the benefit of local knowledge gained from a hands-on field survey or by
talking to local engineers and academics (although the latter could be done remotely). Other
limitations of the remote data include that it was not possible to assess inundation depths accurately
from the ‘After’ images because watermarks are hard to see, so that reference was made on this
point to the EEFIT field study. ‘After’ images are limited by where a Google Street View car can
access, generally not including inside buildings or non-public areas such as industrial complexes or
along coastal defences. The lapse of time before the Google Street View cars arrived meant that
significant clearing up had taken place, so that an unknown number of buildings partially standing
after the event may have been removed. Generally, however, this study has shown the benefit of
20
availability of readily comparable Google Street View images ‘Before’ and ‘After’ a major natural
disaster to enable researchers and engineers from around the world to share in researching its
damaging effects, in collaboration with local experts.
References
Collins, RV, Bloodworth, AG and Stagonas, D (2012) Performance-Based Assessment of Onshore
Structures due to Initial Tsunami Impact: A Preliminary Investigation. In Proceedings of
22nd International Offshore and Polar Engineering Conference (ISOPE-2012), Vol. 3. International
Society of Offshore and Polar Engineers, Cupertino, California, USA, pp. 173-177.
EEFIT (Earthquake Engineering Field Investigation Team) (2006) The Indian Ocean Tsunami of 26
December 2004: Mission Findings in Sri Lank and Thailand [pdf]. See
http://www.istructe.org/webtest/files/74/74b66946-020a-430d-a684-0f71ff0d2a23.pdf [Accessed
18 November 2012].
EEFIT (2010) The Maule, Chile Earthquake of 27 February 2010, A Field Report by EEFIT [pdf]. See
http://www.istructe.org/webtest/files/75/75e4cc0c-34d9-4f40-b797-c80f40370e1a.pdf [Accessed
18 November 2012].
EEFIT (2011) The Tohoku earthquake and Tsunami of 11th March 2011, A Field Report by EEFIT [pdf].
See http://www.istructe.org/webtest/files/1d/1d158684-b77b-4856-99f8-2522fa25533b.pdf
[Accessed 1 December 2012].
EEFIT (2013) Recovery two years after the 2011 Tōhoku earthquake and tsunami: a return mission
report by EEFIT. See http://www.istructe.org/webtest/files/23/23e209f3-bb39-42cc-a5e5-
844100afb938.pdf [Accessed 22 October 2014].
EMSC (European-Mediterranean Seismological Centre) (2012) Main Shock Epicenter Location [image
online]. See http://www.emsc-csem.org/Page/?id=196 [Accessed 25 February 2013].
FEMA (2005) Coastal Construction Manual, Edition 3. FEMA 55. Federal Emergency Management
Agency, Washington, D.C.
FEMA (2008) Guidelines for Design of Structures for Vertical Evacuation from Tsunamis. P646,
Federal Emergency Management Agency, Washington, D.C.
Google Earth 7.0 (2010a) Ofunato, 39°03'51.52" N 141°43'54.08" E. See
http://www.google.com/earth/index.htm [Accessed 25 February 2013].
Google Earth 7.0 (2010b) Ishinomaki, 38°25'01.87" N 141°18'58.88" E. See
http://www.google.com/earth/index.htm [Accessed 19 February 2013].
21
Google Earth 7.0 (2012a) Ofunato, 39°03'51.52" N 141°43'54.08" E. See
http://www.google.com/earth/index.htm [Accessed 25 February 2013].
Google Earth 7.0 (2012b) Ishinomaki, 38°25'06.54" N 141°18'16.85" E. See
http://www.google.com/earth/index.htm [Accessed 19 February 2013].
Google Earth 7.0 (2012c) Ishinomaki, 38°25'08.62" N 141°19'14.40" E. See
http://www.google.com/earth/index.htm [Accessed 19 February 2013].
Google Street View (2011) Memories of the Future [image online]. See
http://www.miraikioku.com/streetview/en [Accessed October 2012].
Google Street View (2013a) Image date: 2008 (bottom), 2011 (top) Ishinomaki [image online]. See
http://www.miraikioku.com/streetview/en/after [Accessed 1 March 2013].
Google Street View (2013b) Image date: 2011 Ofunato [image online]. See
http://www.miraikioku.com/streetview/en/after [Accessed 12 March 2013].
Google Street View (2013c) Image date: 2011 Ishinomaki [image online]. See
http://www.miraikioku.com/streetview/en/after [Accessed 21 February 2013].
Google Street View (2013d) Image date: 2008 Ishinomaki [image online]. See
http://www.miraikioku.com/streetview/en/after [Accessed 21 February 2013].
IIS (2011) as quoted in EEFIT (2011, p.170) Evacuation Centres in Ofunato, Miyagi Prefecture [image
online]. See http://www.istructe.org/webtest/files/1d/1d158684-b77b-4856-99f8-
2522fa25533b.pdf [Accessed 5 January 2013].
Kawata Y, Tsuji Y, Sugimoto Y et al. (2005) Comprehensive analysis of the damage and its impact on
coastal zones by the 2004 Indian Ocean tsunami disaster. Unpublished report, see:
http://www.tsunami.civil.tohoku.ac.jp/sumatra2004/report.html [Accessed November 2012].
Macrae M (2011) Tsunami Forces Debate over Vertical Evacuation. See
http://www.asme.org/kb/news---articles/articles/manufacturing---processing/tsunami-forces-
debate-over-vertical-evacuation [Accessed 13 April 2013].
Ministry Of Internal Affairs And Communications (2008) Chapter 21 Housing: 21-9 Buildings by use of
Building, Type of Building, Stories of Building and Construction Material (1968-2008). See
http://www.stat.go.jp/english/data/chouki/21.htm [Accessed 17 April 2013].
Suppasri A, Mas E, Charvet I et al. (2013) Building damage characteristics based on surveyed data
and fragility curves of the 2011 Great East Japan tsunami. Natural Hazards, 66: 319-341.