ORIGINAL ARTICLE Upregulation of the Mammalian Target...
12
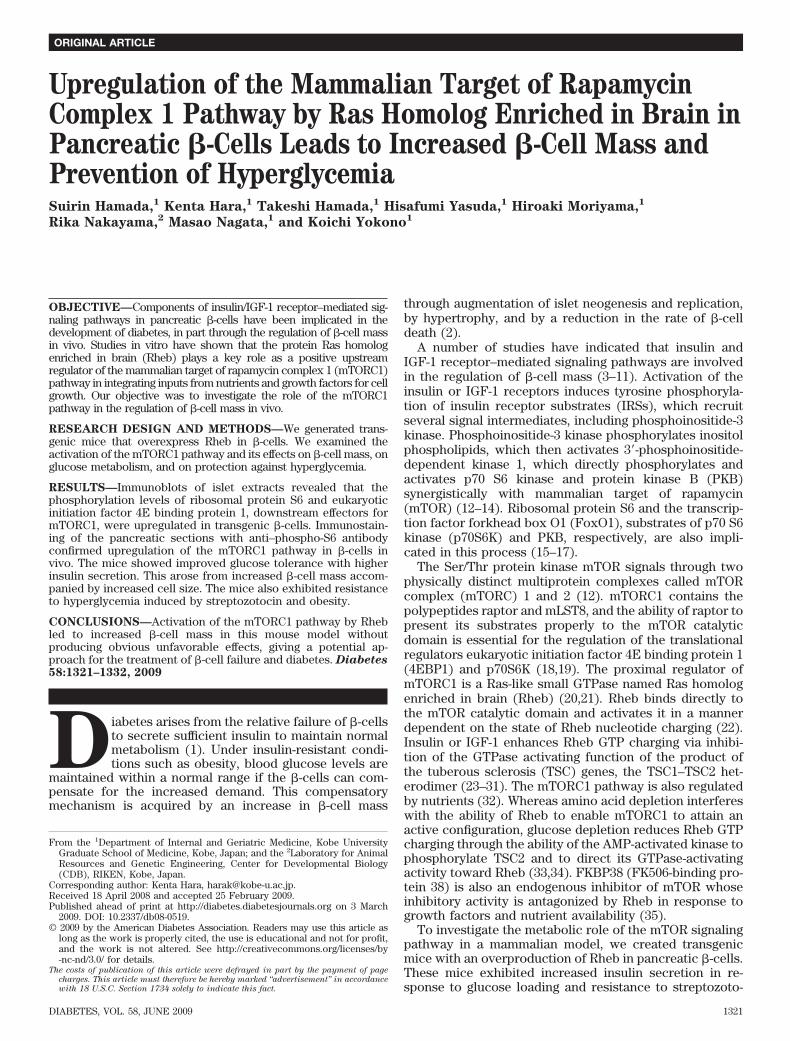
Upregulation of the Mammalian Target of Rapamycin Complex 1 Pathway by Ras Homolog Enriched in Brain in Pancreatic -Cells Leads to Increased -Cell Mass and Prevention of Hyperglycemia Suirin Hamada, 1 Kenta Hara, 1 Takeshi Hamada, 1 Hisafumi Yasuda, 1 Hiroaki Moriyama, 1 Rika Nakayama, 2 Masao Nagata, 1 and Koichi Yokono 1 OBJECTIVE—Components of insulin/IGF-1 receptor–mediated sig- naling pathways in pancreatic -cells have been implicated in the development of diabetes, in part through the regulation of -cell mass in vivo. Studies in vitro have shown that the protein Ras homolog enriched in brain (Rheb) plays a key role as a positive upstream regulator of the mammalian target of rapamycin complex 1 (mTORC1) pathway in integrating inputs from nutrients and growth factors for cell growth. Our objective was to investigate the role of the mTORC1 pathway in the regulation of -cell mass in vivo. RESEARCH DESIGN AND METHODS—We generated trans- genic mice that overexpress Rheb in -cells. We examined the activation of the mTORC1 pathway and its effects on -cell mass, on glucose metabolism, and on protection against hyperglycemia. RESULTS—Immunoblots of islet extracts revealed that the phosphorylation levels of ribosomal protein S6 and eukaryotic initiation factor 4E binding protein 1, downstream effectors for mTORC1, were upregulated in transgenic -cells. Immunostain- ing of the pancreatic sections with anti–phospho-S6 antibody confirmed upregulation of the mTORC1 pathway in -cells in vivo. The mice showed improved glucose tolerance with higher insulin secretion. This arose from increased -cell mass accom- panied by increased cell size. The mice also exhibited resistance to hyperglycemia induced by streptozotocin and obesity. CONCLUSIONS—Activation of the mTORC1 pathway by Rheb led to increased -cell mass in this mouse model without producing obvious unfavorable effects, giving a potential ap- proach for the treatment of -cell failure and diabetes. Diabetes 58:1321–1332, 2009 D iabetes arises from the relative failure of -cells to secrete sufficient insulin to maintain normal metabolism (1). Under insulin-resistant condi- tions such as obesity, blood glucose levels are maintained within a normal range if the -cells can com- pensate for the increased demand. This compensatory mechanism is acquired by an increase in -cell mass through augmentation of islet neogenesis and replication, by hypertrophy, and by a reduction in the rate of -cell death (2). A number of studies have indicated that insulin and IGF-1 receptor–mediated signaling pathways are involved in the regulation of -cell mass (3–11). Activation of the insulin or IGF-1 receptors induces tyrosine phosphoryla- tion of insulin receptor substrates (IRSs), which recruit several signal intermediates, including phosphoinositide-3 kinase. Phosphoinositide-3 kinase phosphorylates inositol phospholipids, which then activates 3-phosphoinositide- dependent kinase 1, which directly phosphorylates and activates p70 S6 kinase and protein kinase B (PKB) synergistically with mammalian target of rapamycin (mTOR) (12–14). Ribosomal protein S6 and the transcrip- tion factor forkhead box O1 (FoxO1), substrates of p70 S6 kinase (p70S6K) and PKB, respectively, are also impli- cated in this process (15–17). The Ser/Thr protein kinase mTOR signals through two physically distinct multiprotein complexes called mTOR complex (mTORC) 1 and 2 (12). mTORC1 contains the polypeptides raptor and mLST8, and the ability of raptor to present its substrates properly to the mTOR catalytic domain is essential for the regulation of the translational regulators eukaryotic initiation factor 4E binding protein 1 (4EBP1) and p70S6K (18,19). The proximal regulator of mTORC1 is a Ras-like small GTPase named Ras homolog enriched in brain (Rheb) (20,21). Rheb binds directly to the mTOR catalytic domain and activates it in a manner dependent on the state of Rheb nucleotide charging (22). Insulin or IGF-1 enhances Rheb GTP charging via inhibi- tion of the GTPase activating function of the product of the tuberous sclerosis (TSC) genes, the TSC1–TSC2 het- erodimer (23–31). The mTORC1 pathway is also regulated by nutrients (32). Whereas amino acid depletion interferes with the ability of Rheb to enable mTORC1 to attain an active configuration, glucose depletion reduces Rheb GTP charging through the ability of the AMP-activated kinase to phosphorylate TSC2 and to direct its GTPase-activating activity toward Rheb (33,34). FKBP38 (FK506-binding pro- tein 38) is also an endogenous inhibitor of mTOR whose inhibitory activity is antagonized by Rheb in response to growth factors and nutrient availability (35). To investigate the metabolic role of the mTOR signaling pathway in a mammalian model, we created transgenic mice with an overproduction of Rheb in pancreatic -cells. These mice exhibited increased insulin secretion in re- sponse to glucose loading and resistance to streptozoto- From the 1 Department of Internal and Geriatric Medicine, Kobe University Graduate School of Medicine, Kobe, Japan; and the 2 Laboratory for Animal Resources and Genetic Engineering, Center for Developmental Biology (CDB), RIKEN, Kobe, Japan. Corresponding author: Kenta Hara, [email protected]. Received 18 April 2008 and accepted 25 February 2009. Published ahead of print at http://diabetes.diabetesjournals.org on 3 March 2009. DOI: 10.2337/db08-0519. © 2009 by the American Diabetes Association. Readers may use this article as long as the work is properly cited, the use is educational and not for profit, and the work is not altered. See http://creativecommons.org/licenses/by -nc-nd/3.0/ for details. The costs of publication of this article were defrayed in part by the payment of page charges. This article must therefore be hereby marked “advertisement” in accordance with 18 U.S.C. Section 1734 solely to indicate this fact. ORIGINAL ARTICLE DIABETES, VOL. 58, JUNE 2009 1321
Transcript of ORIGINAL ARTICLE Upregulation of the Mammalian Target...
Upregulation of the Mammalian Target of RapamycinComplex 1 Pathway by Ras Homolog Enriched in Brain inPancreatic �-Cells Leads to Increased �-Cell Mass andPrevention of HyperglycemiaSuirin Hamada,
1Kenta Hara,
1Takeshi Hamada,
1Hisafumi Yasuda,
1Hiroaki Moriyama,
1
Rika Nakayama,2
Masao Nagata,1
and Koichi Yokono1
OBJECTIVE—Components of insulin/IGF-1 receptor–mediated sig-naling pathways in pancreatic �-cells have been implicated in thedevelopment of diabetes, in part through the regulation of �-cell massin vivo. Studies in vitro have shown that the protein Ras homologenriched in brain (Rheb) plays a key role as a positive upstreamregulator of the mammalian target of rapamycin complex 1 (mTORC1)pathway in integrating inputs from nutrients and growth factors for cellgrowth. Our objective was to investigate the role of the mTORC1pathway in the regulation of �-cell mass in vivo.
RESEARCH DESIGN AND METHODS—We generated trans-genic mice that overexpress Rheb in �-cells. We examined theactivation of the mTORC1 pathway and its effects on �-cell mass, onglucose metabolism, and on protection against hyperglycemia.
RESULTS—Immunoblots of islet extracts revealed that thephosphorylation levels of ribosomal protein S6 and eukaryoticinitiation factor 4E binding protein 1, downstream effectors formTORC1, were upregulated in transgenic �-cells. Immunostain-ing of the pancreatic sections with anti–phospho-S6 antibodyconfirmed upregulation of the mTORC1 pathway in �-cells invivo. The mice showed improved glucose tolerance with higherinsulin secretion. This arose from increased �-cell mass accom-panied by increased cell size. The mice also exhibited resistanceto hyperglycemia induced by streptozotocin and obesity.
CONCLUSIONS—Activation of the mTORC1 pathway by Rhebled to increased �-cell mass in this mouse model withoutproducing obvious unfavorable effects, giving a potential ap-proach for the treatment of �-cell failure and diabetes. Diabetes58:1321–1332, 2009
Diabetes arises from the relative failure of �-cellsto secrete sufficient insulin to maintain normalmetabolism (1). Under insulin-resistant condi-tions such as obesity, blood glucose levels are
maintained within a normal range if the �-cells can com-pensate for the increased demand. This compensatorymechanism is acquired by an increase in �-cell mass
through augmentation of islet neogenesis and replication,by hypertrophy, and by a reduction in the rate of �-celldeath (2).
A number of studies have indicated that insulin andIGF-1 receptor–mediated signaling pathways are involvedin the regulation of �-cell mass (3–11). Activation of theinsulin or IGF-1 receptors induces tyrosine phosphoryla-tion of insulin receptor substrates (IRSs), which recruitseveral signal intermediates, including phosphoinositide-3kinase. Phosphoinositide-3 kinase phosphorylates inositolphospholipids, which then activates 3�-phosphoinositide-dependent kinase 1, which directly phosphorylates andactivates p70 S6 kinase and protein kinase B (PKB)synergistically with mammalian target of rapamycin(mTOR) (12–14). Ribosomal protein S6 and the transcrip-tion factor forkhead box O1 (FoxO1), substrates of p70 S6kinase (p70S6K) and PKB, respectively, are also impli-cated in this process (15–17).
The Ser/Thr protein kinase mTOR signals through twophysically distinct multiprotein complexes called mTORcomplex (mTORC) 1 and 2 (12). mTORC1 contains thepolypeptides raptor and mLST8, and the ability of raptor topresent its substrates properly to the mTOR catalyticdomain is essential for the regulation of the translationalregulators eukaryotic initiation factor 4E binding protein 1(4EBP1) and p70S6K (18,19). The proximal regulator ofmTORC1 is a Ras-like small GTPase named Ras homologenriched in brain (Rheb) (20,21). Rheb binds directly tothe mTOR catalytic domain and activates it in a mannerdependent on the state of Rheb nucleotide charging (22).Insulin or IGF-1 enhances Rheb GTP charging via inhibi-tion of the GTPase activating function of the product ofthe tuberous sclerosis (TSC) genes, the TSC1–TSC2 het-erodimer (23–31). The mTORC1 pathway is also regulatedby nutrients (32). Whereas amino acid depletion interfereswith the ability of Rheb to enable mTORC1 to attain anactive configuration, glucose depletion reduces Rheb GTPcharging through the ability of the AMP-activated kinase tophosphorylate TSC2 and to direct its GTPase-activatingactivity toward Rheb (33,34). FKBP38 (FK506-binding pro-tein 38) is also an endogenous inhibitor of mTOR whoseinhibitory activity is antagonized by Rheb in response togrowth factors and nutrient availability (35).
To investigate the metabolic role of the mTOR signalingpathway in a mammalian model, we created transgenicmice with an overproduction of Rheb in pancreatic �-cells.These mice exhibited increased insulin secretion in re-sponse to glucose loading and resistance to streptozoto-
From the 1Department of Internal and Geriatric Medicine, Kobe UniversityGraduate School of Medicine, Kobe, Japan; and the 2Laboratory for AnimalResources and Genetic Engineering, Center for Developmental Biology(CDB), RIKEN, Kobe, Japan.
Corresponding author: Kenta Hara, [email protected] 18 April 2008 and accepted 25 February 2009.Published ahead of print at http://diabetes.diabetesjournals.org on 3 March
2009. DOI: 10.2337/db08-0519.© 2009 by the American Diabetes Association. Readers may use this article as
long as the work is properly cited, the use is educational and not for profit,and the work is not altered. See http://creativecommons.org/licenses/by-nc-nd/3.0/ for details.
The costs of publication of this article were defrayed in part by the payment of page
charges. This article must therefore be hereby marked “advertisement” in accordance
with 18 U.S.C. Section 1734 solely to indicate this fact.
ORIGINAL ARTICLE
DIABETES, VOL. 58, JUNE 2009 1321

cin- and obesity-induced hyperglycemia, which wereaccompanied by increased �-cell mass.
RESEARCH DESIGN AND METHODS
A wild-type human Rheb gene tagged with a FLAG sequence at the NH2-terminus was introduced downstream of the rat insulin promoter. Thetransgene was microinjected into pronuclei of C57BL/6N zygotes. Micecarrying the lethal yellow agouti (Ay) mutation were generated by breeding R3transgenic mice with KK-Ay strain mice. The obtained F1 littermates carryingthe Ay mutation with or without a FLAG-Rheb transgene on C57BL/6 and a KKhybrid background (designated Ay/Rheb and Ay) were analyzed. This studywas performed according to the guidelines of the animal ethics committee ofKobe University Graduate School of Medicine.Islet preparation and immunoblot analysis. Islets were isolated bycollagenase digestion followed by centrifugation over Histopaque medium(Sigma-Aldrich, St. Louis, MO). Cultured islets were extracted in buffer A(20 mmol/l Tris-HCl, pH 7.4, 120 mmol/l NaCl, 1 mmol/l EDTA, 5 mmol/lEGTA, 50 mmol/l �-glycerophosphate, 50 mmol/l NaF, 0.3% CHAPS, 1
mmol/l dithiothreitol, 4 �g/ml leupeptin, and 4 �g/ml aprotinin), and thesupernatants were analyzed by immunoblotting with the indicated antibod-ies. The following antibodies were purchased from Cell Signaling Technol-ogies (Beverly, MA): anti–phospho-S6 ribosomal protein (Ser235/236),anti–S6 ribosomal protein, anti–phospho-4EBP1 (Thr37/46), anti–phospho-4EBP1 (Thr70), anti–phospho-p70 S6 kinase (Thr389), anti-PKB, anti–phospho-PKB (Ser473), anti–phospho-p44/42 mitogen-activated protein(MAP) kinase (Thr202/Tyr204), and anti–p44/42 MAP kinase. Anti-IRS2antibody was purchased from Upstate (Temecula, CA). Anti-Rheb antibodywas kindly provided by N. Oshiro (Biosignal Research Center, KobeUniversity, Kobe, Japan).Glucose tolerance testing and insulin tolerance testing. Mice weredeprived of food for 16 h, and blood was collected from the tail vein after anoral injection (2 g/kg) or intraperitoneal injection (3 g/kg) of glucose. Forinsulin tolerance testing, mice fed ad libitum were injected with 0.75 units/kgbody wt of human regular insulin.Immunohistochemical and morphometric analysis of islets. Immuno-staining for insulin and glucagon was performed using guinea pig antibod-ies against insulin and rabbit antibodies against glucagon (Dako Japan,
C
D
BA
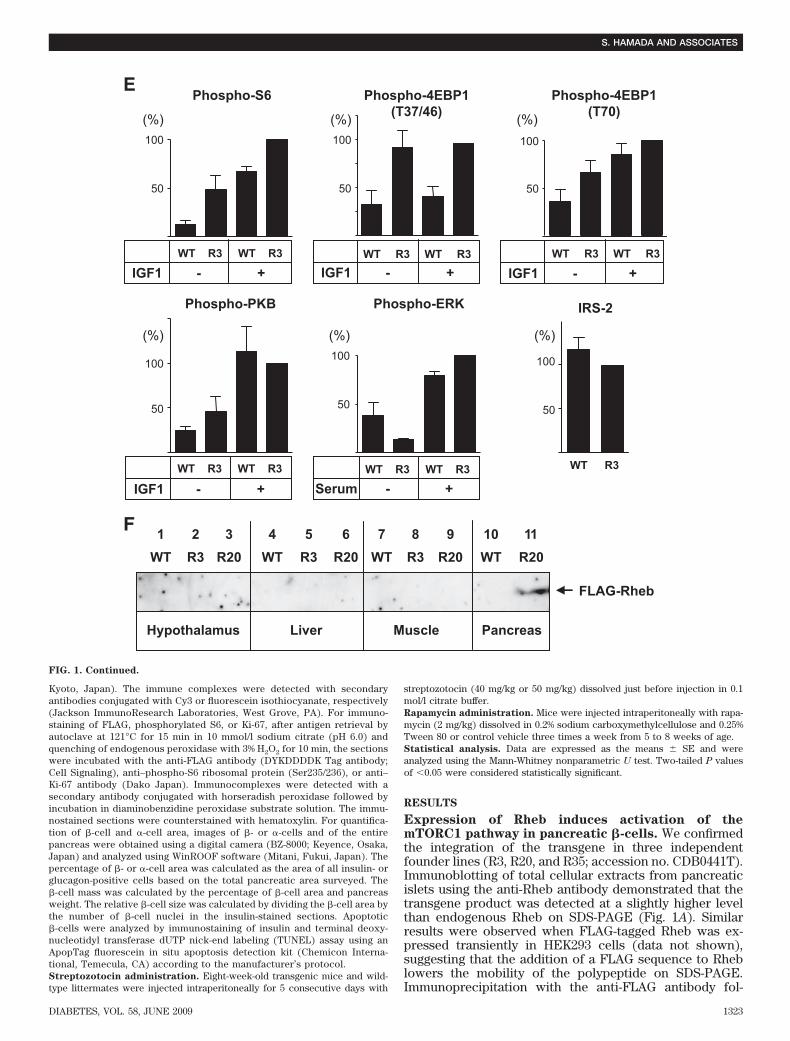
FIG. 1. Activation of the mTORC1 pathway by overexpression of FLAG-Rheb in pancreatic �-cells. Islets isolated from mice of each genotypewere incubated either in 50% RPMI medium without FCS (A, B, and D) or in RPMI medium (C), or they were stimulated with 100 nmol/lIGF-1 (B) or 15% FCS (D) as indicated. The same amounts of cellular extracts were analyzed by immunoblotting with the antibodies toRheb, phospho-S6 ribosomal protein (Ser235/236), S6 ribosomal protein, phospho-4EBP1 (Thr37/46 or Thr70), phospho-p70 S6 kinase(Thr389), p70 S6 kinase, phospho-PKB (Ser473), PKB, phospho-p44/42 MAP kinase (Thr202/Tyr204), p44/42 MAP kinase, or IRS2. Arepresentative experiment is shown. The bottom panel in A shows the same blot as the top panel, except that it was exposed longer to detectthe endogenous Rheb (end-Rheb). E: Relative quantification of phospho-S6 (Ser235/236), phospho-4EBP1 (T37/46 or T70), phospho-PKB(Ser473), phospho-p44/42 MAP kinase (Thr202/Tyr204), and IRS2. The immunoblots were scanned, and the optical density for R3 with IGF1or FCS stimulation (A, B, and D) or the optical density for R3 (C) was set to 100%. F: Immunoprecipitation with the anti-FLAG antibodywas performed using lysates of the hypothalamus, muscle, or liver isolated from mice of each genotype and analyzed by immunoblotting withthe same antibody. WT, wild type.
REGULATION OF PANCREATIC �-CELL BY mTORC1
1322 DIABETES, VOL. 58, JUNE 2009
Kyoto, Japan). The immune complexes were detected with secondaryantibodies conjugated with Cy3 or fluorescein isothiocyanate, respectively(Jackson ImmunoResearch Laboratories, West Grove, PA). For immuno-staining of FLAG, phosphorylated S6, or Ki-67, after antigen retrieval byautoclave at 121°C for 15 min in 10 mmol/l sodium citrate (pH 6.0) andquenching of endogenous peroxidase with 3% H2O2 for 10 min, the sectionswere incubated with the anti-FLAG antibody (DYKDDDDK Tag antibody;Cell Signaling), anti–phospho-S6 ribosomal protein (Ser235/236), or anti–Ki-67 antibody (Dako Japan). Immunocomplexes were detected with asecondary antibody conjugated with horseradish peroxidase followed byincubation in diaminobenzidine peroxidase substrate solution. The immu-nostained sections were counterstained with hematoxylin. For quantifica-tion of �-cell and �-cell area, images of �- or �-cells and of the entirepancreas were obtained using a digital camera (BZ-8000; Keyence, Osaka,Japan) and analyzed using WinROOF software (Mitani, Fukui, Japan). Thepercentage of �- or �-cell area was calculated as the area of all insulin- orglucagon-positive cells based on the total pancreatic area surveyed. The�-cell mass was calculated by the percentage of �-cell area and pancreasweight. The relative �-cell size was calculated by dividing the �-cell area bythe number of �-cell nuclei in the insulin-stained sections. Apoptotic�-cells were analyzed by immunostaining of insulin and terminal deoxy-nucleotidyl transferase dUTP nick-end labeling (TUNEL) assay using anApopTag fluorescein in situ apoptosis detection kit (Chemicon Interna-tional, Temecula, CA) according to the manufacturer’s protocol.Streptozotocin administration. Eight-week-old transgenic mice and wild-type littermates were injected intraperitoneally for 5 consecutive days with
streptozotocin (40 mg/kg or 50 mg/kg) dissolved just before injection in 0.1mol/l citrate buffer.Rapamycin administration. Mice were injected intraperitoneally with rapa-mycin (2 mg/kg) dissolved in 0.2% sodium carboxymethylcellulose and 0.25%Tween 80 or control vehicle three times a week from 5 to 8 weeks of age.Statistical analysis. Data are expressed as the means � SE and wereanalyzed using the Mann-Whitney nonparametric U test. Two-tailed P valuesof �0.05 were considered statistically significant.
RESULTS
Expression of Rheb induces activation of themTORC1 pathway in pancreatic �-cells. We confirmedthe integration of the transgene in three independentfounder lines (R3, R20, and R35; accession no. CDB0441T).Immunoblotting of total cellular extracts from pancreaticislets using the anti-Rheb antibody demonstrated that thetransgene product was detected at a slightly higher levelthan endogenous Rheb on SDS-PAGE (Fig. 1A). Similarresults were observed when FLAG-tagged Rheb was ex-pressed transiently in HEK293 cells (data not shown),suggesting that the addition of a FLAG sequence to Rheblowers the mobility of the polypeptide on SDS-PAGE.Immunoprecipitation with the anti-FLAG antibody fol-
Phospho-4EBP1(T37/46)
Phospho-4EBP1(T70)
WT R3
WT R3 WT R3
IGF1 - +
WT R3 WT R3
Serum - +
Phospho-S6
Phospho-PKB
WT R3 WT R3
IGF1 - +
Phospho-ERK
50
100
WT R3 WT R3IGF1 - +
WT R3 WT R3
IGF1 - +
(%)
50
100
(%)
50
100
(%)
50
100
(%)
50
100
(%)
50
100
(%)
IRS-2
E
F
FLAG-Rheb
1WT WT WT WTR3
Hypothalamus Liver Muscle Pancreas
R3 R3R20 R20 R20 R202 3 4 5 6 7 8 9 10 11
FIG. 1. Continued.
S. HAMADA AND ASSOCIATES
DIABETES, VOL. 58, JUNE 2009 1323
lowed by immunoblotting with the same antibody failed todetect the expression of FLAG-Rheb in the hypothalamus,muscle, or liver, indicating that the expression of FLAG-Rheb is specific to the pancreatic �-cells (Fig. 1F).
To confirm the effect of the overexpression of Rheb in
�-cells, we examined the phosphorylation of the down-stream effectors for mTORC1, ribosomal protein S6, and4EBP1. Because the mTORC1 pathway is regulated in anutrient-dependent manner, the ability of Rheb to activatethe mTORC1 pathway is most easily visualized in nutrient-
100200300400
Glu
cose
(mg/
dl)
30Time (min)
6000
500
0
200
400
600
Insu
lin (p
g/m
l)
30 600Time (min)
** *
0 15 30 600
25
50
75
100
Glu
cose
(%
of b
asal
)
Time (min)
6030150 120Time (min)
0
100
200
300
400
Glu
cose
(mg/
dl)
0
500
1000
1500
0 15 30Time (min)
Insu
lin (p
g/m
l)
*
*
**
**
0
500
1000
1500
0 15 300 15 30
R20
Time (min)
0
500
1000
1500
Time (min)
*
R3In
sulin
(pg/
ml)
*
0
100
200
300
400
60 120Time (min)
R20R3
6030150 30150120Time (min)
0
100
200
300
400
Glu
cose
(mg/
dl)
***
***
*
**
0
250
500
750
1000
1250
0
250
500
750
1000
1250
Insu
lin (p
g/m
l)
WT R3 WT R20
Glu
cose
(mg/
dl)
50
100
150
0
200
WT R3 WT R20
WT R3 WT R20
50
100
150
0
200
8W
50W
50
100
150
0
200
50
100
150
0
200
Glu
cose
(mg/
dl)
*
*
0 10 20 30 40 500
10
20
30
40
Bod
y W
eigh
t(g)
Age (weeks)
R20R3
10 20 30 40 50Age (weeks)
00
10
20
30
40A
C
D
F
H
B
E
G
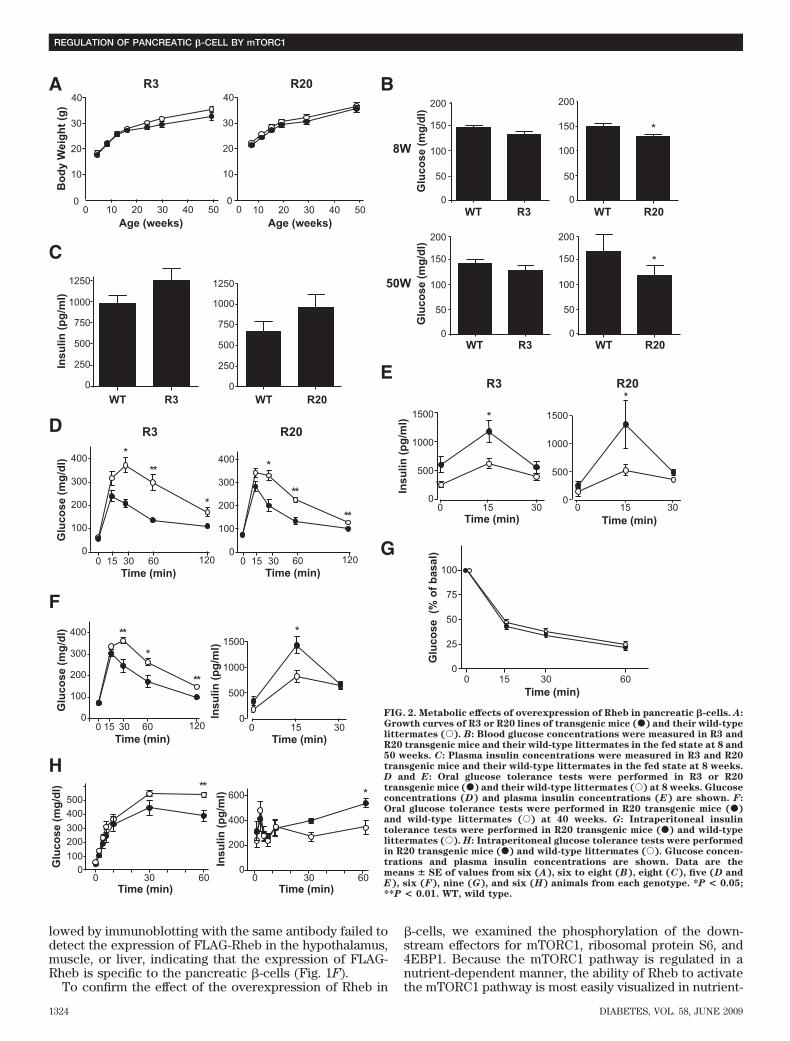
FIG. 2. Metabolic effects of overexpression of Rheb in pancreatic �-cells. A:Growth curves of R3 or R20 lines of transgenic mice (F) and their wild-typelittermates (E). B: Blood glucose concentrations were measured in R3 andR20 transgenic mice and their wild-type littermates in the fed state at 8 and50 weeks. C: Plasma insulin concentrations were measured in R3 and R20transgenic mice and their wild-type littermates in the fed state at 8 weeks.D and E: Oral glucose tolerance tests were performed in R3 or R20transgenic mice (F) and their wild-type littermates (E) at 8 weeks. Glucoseconcentrations (D) and plasma insulin concentrations (E) are shown. F:Oral glucose tolerance tests were performed in R20 transgenic mice (F)and wild-type littermates (E) at 40 weeks. G: Intraperitoneal insulintolerance tests were performed in R20 transgenic mice (F) and wild-typelittermates (E). H: Intraperitoneal glucose tolerance tests were performedin R20 transgenic mice (F) and wild-type littermates (E). Glucose concen-trations and plasma insulin concentrations are shown. Data are themeans � SE of values from six (A), six to eight (B), eight (C), five (D andE), six (F), nine (G), and six (H) animals from each genotype. *P < 0.05;**P < 0.01. WT, wild type.
REGULATION OF PANCREATIC �-CELL BY mTORC1
1324 DIABETES, VOL. 58, JUNE 2009
depleted conditions in vitro. Therefore, isolated isletswere incubated for 2 h in 50% RPMI medium that wasmade by mixing RPMI with Krebs-Ringer bicarbonatebuffer without FCS. Phosphorylation of S6 (Ser235/236)was clearly higher in islets prepared from transgenic micethan in those prepared from wild-type littermates (Fig.1A). The immunoreactivity of the anti–phospho-S6 anti-body appeared to parallel the abundance of FLAG-Rheb.The immunoreactivity of the anti–phospho-4EBP1 (Thr37/46) antibody increased in the islets prepared from trans-genic mice in the same manner. When islets werestimulated with IGF-1, the immunoreactivities of the anti–phospho-S6 and anti–phospho-4EBP1 (Thr37/46 andThr70) antibodies were increased in islets prepared fromwild-type littermates, but the extent of immunoreactivitywas still higher in islets from transgenic mice (Fig. 1B andE). The immunoreactivity of the anti–phospho-PKB(Ser473) was increased by IGF-1 stimulation in bothwild-type and transgenic islets; however, the stimulationwas greater in wild-type than in transgenic islets. Theamount of IRS2 appeared to be relatively reduced in thetransgenic islets compared with their wild-type littermates(Fig. 1C). This might be caused by a possible negativefeedback mechanism induced by the activated p70 S6kinase. Serum stimulation also induced phosphorylationof S6 and 4EBP1, but the stimulation was still greater intransgenic mice than in wild-type mice (Fig. 1D). Phos-phorylation of MAPKs also increased after serum stimula-tion, but the stimulation was similar in both wild-type andtransgenic islets. Subsequent studies were performed onanimals derived from founder lines R3 and R20.Improved glucose tolerance in transgenic mice. Therate of increase in body weight was not significantlydifferent between the R3 and R20 lines of transgenic miceand their wild-type littermates (Fig. 2A). Metabolic param-eters, including plasma triglycerides, free fatty acids, andleptin, were not significantly different between R3 trans-genic mice and wild-type littermates either (Table 1). Incontrast, R20 transgenic mice had significantly lowerblood glucose concentrations in the fed state at 8 and 50weeks compared with wild-type littermates (127.9 � 4.24vs. 145.6 � 5.35 mg/dl at 8 weeks and 128.7 � 6.16 vs.147.9 � 5.68 mg/dl at 50 weeks) (Fig. 2B). The plasmainsulin levels in R20 mice were 1.43-fold those of wild-typelittermates at 8 weeks (Fig. 2C). Although no significantdifferences in blood glucose concentrations were ob-served between R3 transgenic mice and wild-type litter-mates, the concentration tended to be lower in thetransgenic mice, and this tendency was maintained to 50weeks. Oral glucose tolerance testing at 8 weeks revealedthat both the R3 and R20 lines of transgenic mice hadimproved glucose tolerance compared with wild-type lit-termates (Fig. 2D). Although fasting blood glucose con-
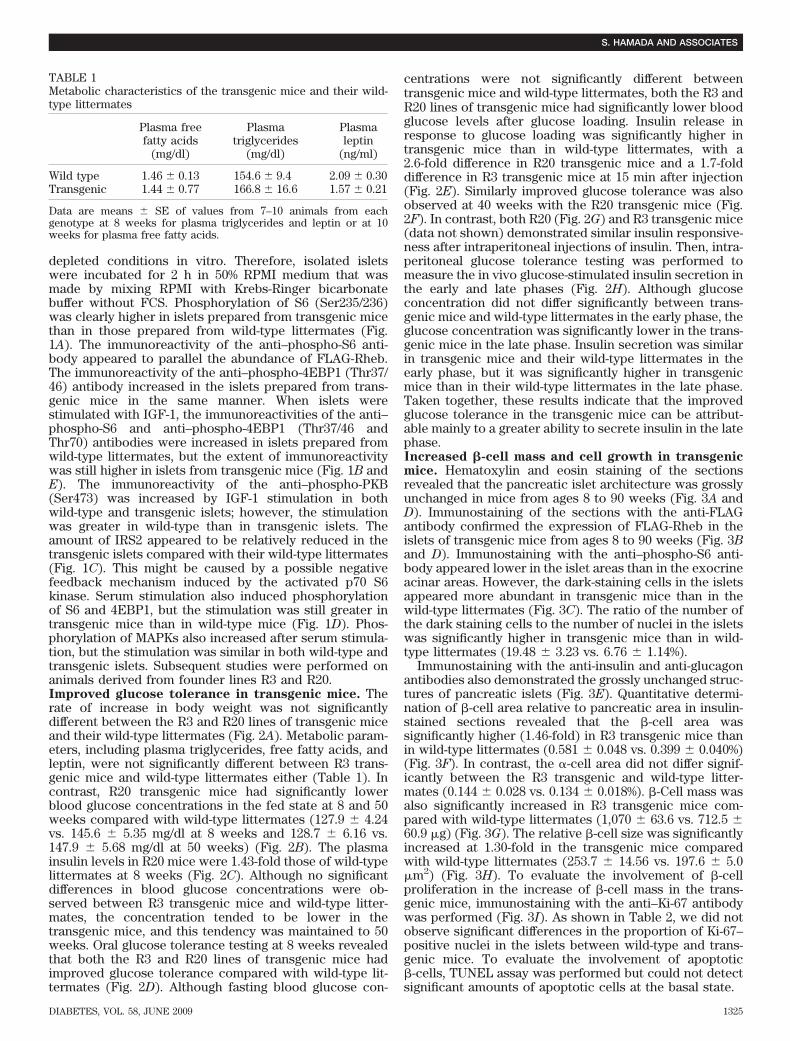
centrations were not significantly different betweentransgenic mice and wild-type littermates, both the R3 andR20 lines of transgenic mice had significantly lower bloodglucose levels after glucose loading. Insulin release inresponse to glucose loading was significantly higher intransgenic mice than in wild-type littermates, with a2.6-fold difference in R20 transgenic mice and a 1.7-folddifference in R3 transgenic mice at 15 min after injection(Fig. 2E). Similarly improved glucose tolerance was alsoobserved at 40 weeks with the R20 transgenic mice (Fig.2F). In contrast, both R20 (Fig. 2G) and R3 transgenic mice(data not shown) demonstrated similar insulin responsive-ness after intraperitoneal injections of insulin. Then, intra-peritoneal glucose tolerance testing was performed tomeasure the in vivo glucose-stimulated insulin secretion inthe early and late phases (Fig. 2H). Although glucoseconcentration did not differ significantly between trans-genic mice and wild-type littermates in the early phase, theglucose concentration was significantly lower in the trans-genic mice in the late phase. Insulin secretion was similarin transgenic mice and their wild-type littermates in theearly phase, but it was significantly higher in transgenicmice than in their wild-type littermates in the late phase.Taken together, these results indicate that the improvedglucose tolerance in the transgenic mice can be attribut-able mainly to a greater ability to secrete insulin in the latephase.�ncreased �-cell mass and cell growth in transgenicmice. Hematoxylin and eosin staining of the sectionsrevealed that the pancreatic islet architecture was grosslyunchanged in mice from ages 8 to 90 weeks (Fig. 3A andD). Immunostaining of the sections with the anti-FLAGantibody confirmed the expression of FLAG-Rheb in theislets of transgenic mice from ages 8 to 90 weeks (Fig. 3Band D). Immunostaining with the anti–phospho-S6 anti-body appeared lower in the islet areas than in the exocrineacinar areas. However, the dark-staining cells in the isletsappeared more abundant in transgenic mice than in thewild-type littermates (Fig. 3C). The ratio of the number ofthe dark staining cells to the number of nuclei in the isletswas significantly higher in transgenic mice than in wild-type littermates (19.48 � 3.23 vs. 6.76 � 1.14%).
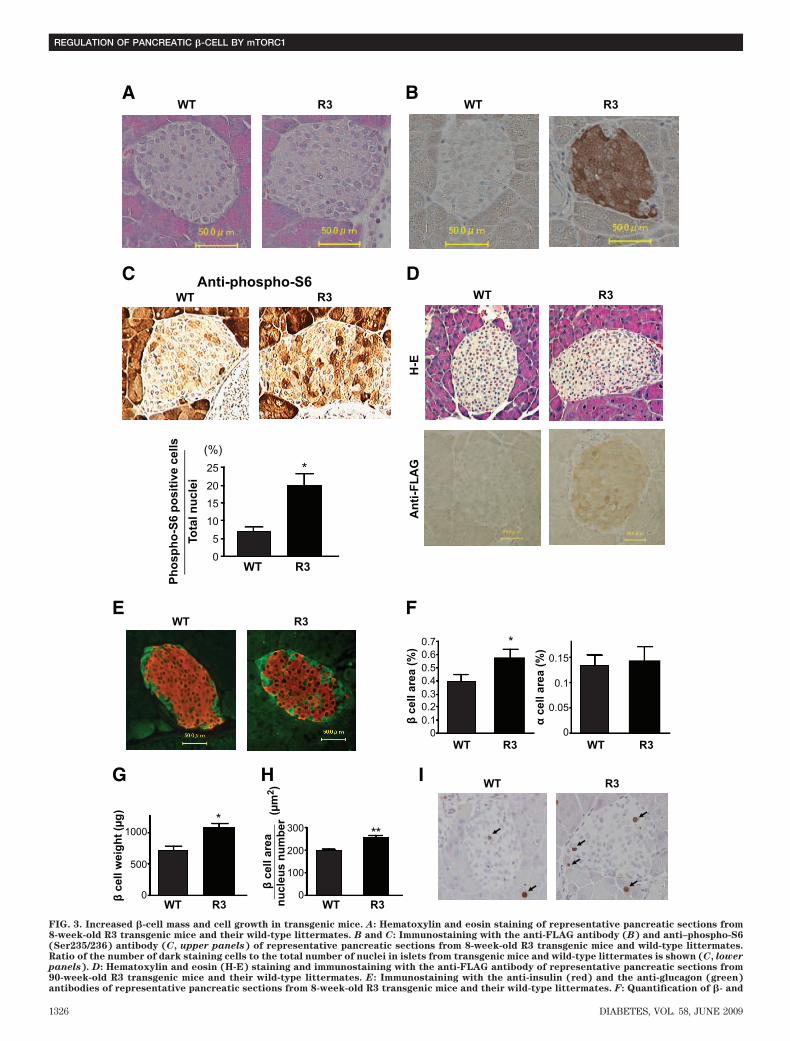
Immunostaining with the anti-insulin and anti-glucagonantibodies also demonstrated the grossly unchanged struc-tures of pancreatic islets (Fig. 3E). Quantitative determi-nation of �-cell area relative to pancreatic area in insulin-stained sections revealed that the �-cell area wassignificantly higher (1.46-fold) in R3 transgenic mice thanin wild-type littermates (0.581 � 0.048 vs. 0.399 � 0.040%)(Fig. 3F). In contrast, the �-cell area did not differ signif-icantly between the R3 transgenic and wild-type litter-mates (0.144 � 0.028 vs. 0.134 � 0.018%). �-Cell mass wasalso significantly increased in R3 transgenic mice com-pared with wild-type littermates (1,070 � 63.6 vs. 712.5 �60.9 �g) (Fig. 3G). The relative �-cell size was significantlyincreased at 1.30-fold in the transgenic mice comparedwith wild-type littermates (253.7 � 14.56 vs. 197.6 � 5.0�m2) (Fig. 3H). To evaluate the involvement of �-cellproliferation in the increase of �-cell mass in the trans-genic mice, immunostaining with the anti–Ki-67 antibodywas performed (Fig. 3I). As shown in Table 2, we did notobserve significant differences in the proportion of Ki-67–positive nuclei in the islets between wild-type and trans-genic mice. To evaluate the involvement of apoptotic�-cells, TUNEL assay was performed but could not detectsignificant amounts of apoptotic cells at the basal state.
TABLE 1Metabolic characteristics of the transgenic mice and their wild-type littermates
Plasma freefatty acids
(mg/dl)
Plasmatriglycerides
(mg/dl)
Plasmaleptin
(ng/ml)
Wild type 1.46 � 0.13 154.6 � 9.4 2.09 � 0.30Transgenic 1.44 � 0.77 166.8 � 16.6 1.57 � 0.21
Data are means � SE of values from 7–10 animals from eachgenotype at 8 weeks for plasma triglycerides and leptin or at 10weeks for plasma free fatty acids.
S. HAMADA AND ASSOCIATES
DIABETES, VOL. 58, JUNE 2009 1325
Ant
i-FLA
GH
-E
Anti-phospho-S6WT R3
*
0
5101520
25
Phos
pho-
S6 p
ositi
ve c
ells
WT R3
(%)
Tota
l nuc
lei
WT R3
WT R3
WT R3A B
C Dβ
cell
area
nucl
eus
num
ber
0
300
100
200**
(µm
2 )
WT R3 WT R3β ce
ll w
eigh
t (µg
)
0
1000
500
*
00.10.20.30.40.50.60.7
0
0.05
0.1
0.15
β ce
ll ar
ea (%
)
WT R3 WT R3
WT R3
α ce
ll ar
ea (%
)*WT R3
E
I
F
G H
FIG. 3. Increased �-cell mass and cell growth in transgenic mice. A: Hematoxylin and eosin staining of representative pancreatic sections from8-week-old R3 transgenic mice and their wild-type littermates. B and C: Immunostaining with the anti-FLAG antibody (B) and anti–phospho-S6(Ser235/236) antibody (C, upper panels) of representative pancreatic sections from 8-week-old R3 transgenic mice and wild-type littermates.Ratio of the number of dark staining cells to the total number of nuclei in islets from transgenic mice and wild-type littermates is shown (C, lower
panels). D: Hematoxylin and eosin (H-E) staining and immunostaining with the anti-FLAG antibody of representative pancreatic sections from90-week-old R3 transgenic mice and their wild-type littermates. E: Immunostaining with the anti-insulin (red) and the anti-glucagon (green)antibodies of representative pancreatic sections from 8-week-old R3 transgenic mice and their wild-type littermates. F: Quantification of �- and
REGULATION OF PANCREATIC �-CELL BY mTORC1
1326 DIABETES, VOL. 58, JUNE 2009
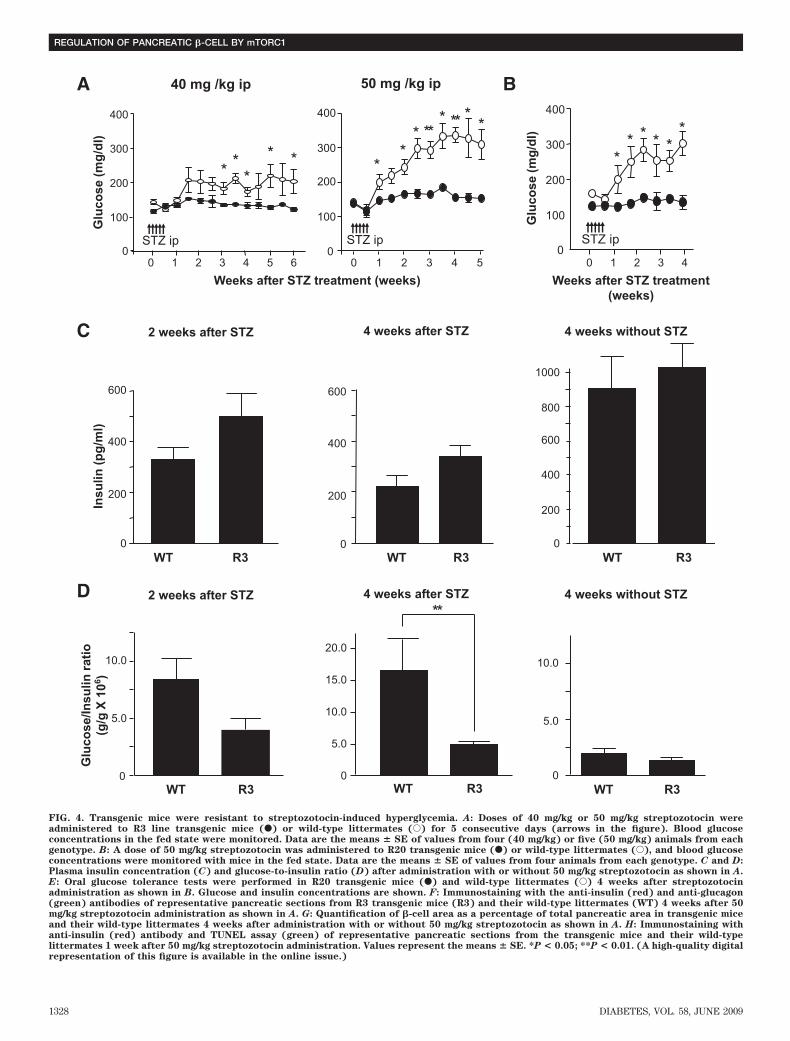
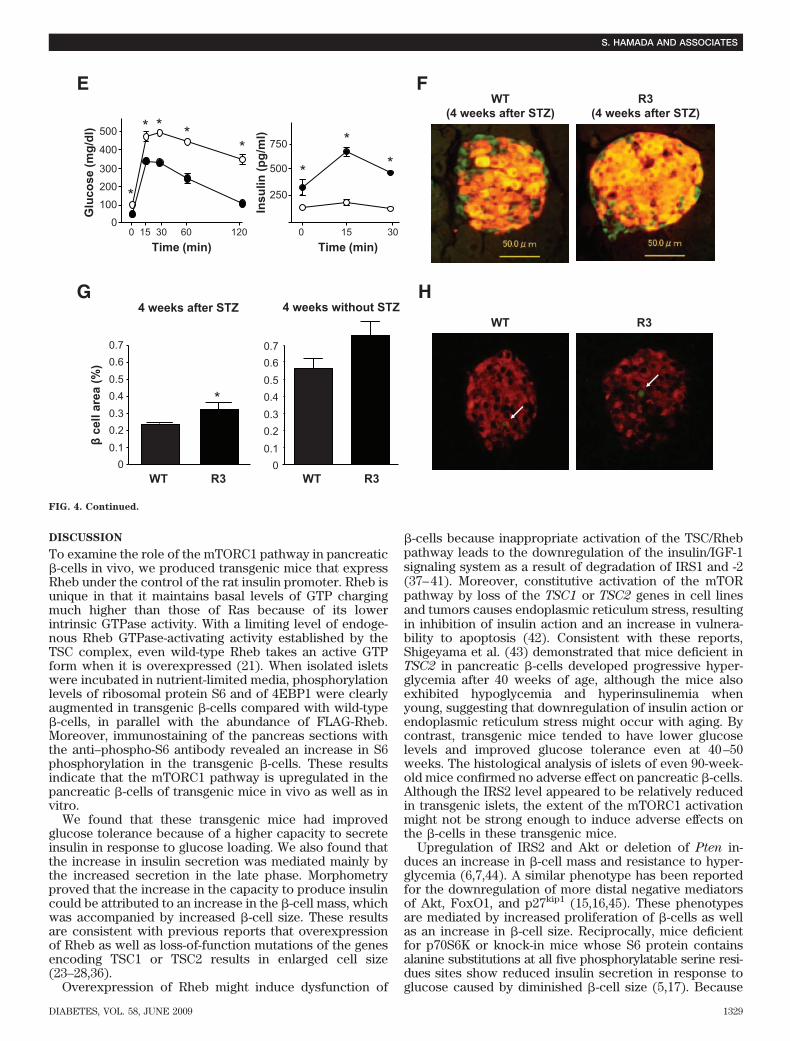
Prevention of streptozotocin- and obesity-inducedhyperglycemia in transgenic mice. To determinewhether Rheb overexpression in pancreatic �-cells pre-vented hyperglycemia in pathophysiological conditions,we used two models of experimentally induced diabetes:streptozotocin-induced and obesity-induced. First, R3 linetransgenic mice and wild-type littermates were subjectedto intraperitoneal injections of streptozotocin at 40 or 50mg/kg for 5 consecutive days. Monitoring of blood glucoselevels in the fed state revealed that wild-type littermateshad significant hyperglycemia by 1 or 3 weeks afterstarting injections at doses of 50 or 40 mg/kg, respectively.By contrast, R3 transgenic mice remained resistant tohyperglycemia (175.5 � 13.5 vs. 135.3 � 8.87 mg/dl at 40mg/kg, and 327.0 � 2.27 vs. 156.8 � 7.52 mg/dl at 50 mg/kg4 weeks after injection) (Fig. 4A). R20 line transgenic micealso exhibited the same resistance to hyperglycemia in-duced by streptozotocin as the R3 transgenic mice (Fig.4B). The insulin level of the wild-type and transgenic micedecreased to 25.3 and 33.4%, respectively, of the levels inthe nontreated wild-type and transgenic mice of the sameage (Fig. 4C). However, the glucose-to-insulin ratio dif-fered significantly between transgenic mice and theirwild-type littermates 4 weeks after injection (4.79 � 0.51 �106 wt/wt vs. 16.34 � 4.93 � 106 wt/wt) (Fig. 4D). Becausethe insulin sensitivity did not differ between wild-type andtransgenic mice, as described above, the significant differ-ence in the glucose-to-insulin ratios suggests that theamount of insulin secreted in response to blood glucoseconcentration differed between groups. Oral glucose tol-erance testing demonstrated clearly that transgenic micewere able to secrete more insulin than wild-type litter-mates in response to glucose loading (Fig. 4E), althoughthe maximum production of insulin was reduced even intransgenic mice when compared with the results shown inFig. 2E. Consistent with the decrease in the serum insulinlevels, immunohistological analysis demonstrated that�-cell areas were decreased in both transgenic mice andwild-type littermates compared with nontreated mice.However, the �-cell area was significantly higher in trans-genic mice than in wild-type littermates (0.340 � 0.025 vs.0.243 � 0.030%) (Fig. 4F and G). TUNEL staining of thepancreatic sections showed no significant difference in theextent of apoptosis in �-cells 1 week after administrationwith streptozotocin (Fig. 4H and Table 3).
Second, as a model of obesity-induced diabetes, wegenerated R3 transgenic mice with the lethal yellow agouti(Ay) mutation by breeding R3 transgenic mice with KK-Ay
mice. For analysis we used F1 offspring littermates carry-ing the Ay mutation with or without a FLAG-Rheb trans-gene on a C57BL/6 and KK mouse strain hybridbackground (designated Ay/Rheb and Ay, respectively).The rate of increase in body weight was not significantlydifferent between Ay/Rheb and Ay mice (35.5 � 0.94 vs.37.5 � 1.06 g at 10 weeks). Oral glucose tolerance testingrevealed that the Ay/Rheb mice had improved glucosetolerance (Fig. 5A). Although blood glucose concentra-tions in the fasting state were not significantly differentbetween Ay/Rheb and Ay mice, the Ay/Rheb mice hadsignificantly lower blood glucose levels at 60 and 120 minafter glucose loading. Thus, the glucose concentration inAy mice remained at 424 � 39.8 mg/dl at 60 min and363.4 � 47.9 mg/dl at 120 min, whereas that in Ay/Rhebmice was 210 � 46.6 mg/dl at 60 min and returned to116.2 � 17.91 mg/dl at 120 min. The improved glucosetolerance in Ay/Rheb mice was attributable to higherinsulin release, with a significant 2.2-fold level at 15 minand a 1.9-fold level at 30 min after glucose loading com-pared with Ay mice.Elimination of the effect of Rheb expression by theadministration with rapamycin. To examine whetherthe phenotypes observed above are dependent on themTORC1 pathway, mice were injected intraperitoneallywith mTORC1 inhibitor rapamycin from 5 to 8 weeks ofage, and glucose tolerance testing was performed at 8weeks (Fig. 5B). At 15, 30, 60, and 120 min after glucoseloading, blood glucose concentration was � 50 mg/dlhigher in rapamycin-treated mice than in untreated mice.Notably, glucose tolerance was similar in rapamycin-treated transgenic mice and in rapamycin-treated wild-type littermates. In addition, the improved insulinsecretion in transgenic mice was eliminated completely tothe level observed in their wild-type littermates. Immuno-blot analysis of the islets prepared from rapamycin- orvehicle-treated mice demonstrated that phosphorylationof S6 and 4EBP1 were reduced by rapamycin administra-tion in both transgenic mice and wild-type littermates,indicating that the effect of rapamycin was achieved bysuppression of mTORC1 activity (Fig. 5C).
�-cell area as a percentage of total pancreatic area in transgenic mice and their wild-type littermates. G: �-Cell mass was calculated by the �-cellarea and pancreas weight. H: The relative size of �-cells in the transgenic mice and their wild-type littermates was calculated. I: Immunostainingwith anti–Ki-67 antibody of representative pancreatic sections from 9-week-old R3 transgenic mice and their wild-type littermates. Data are themeans � SE of values from four (C), five (F), four (G), and five (H) animals from each genotype. *P < 0.05; **P < 0.01. WT, wild type. (Ahigh-quality digital representation of this figure is available in the online issue.)
TABLE 2Numbers of total and Ki-67–positive nuclei in islets
Countedislets per
animal
Countednuclei per
animalNuclei
per islet
Proportion ofKi-67–positive
nuclei perislet (%)
Wild type 68 6,297 � 664.5 93 � 7.6 1.10 � 0.08Transgenic 60 5,291 � 567.7 89 � 9.7 1.16 � 0.13
Data are means � SE of values from four animals from eachgenotype. Pancreatic sections were immunostained with the anti–Ki-67 antibody followed by counterstaining with hematoxylin asshown in Fig. 3I. Numbers of all nuclei and of Ki-67–positive nucleiin the islets of wild-type and transgenic mice were counted.
TABLE 3Numbers of insulin- and TUNEL-positive nuclei in islets
Countedislets per
animal
Countednuclei per
animalNuclei
per islet
Proportion ofTUNEL-positivenuclei per islet
(%)
Wild type 69 2,882 � 567.8 43 � 4.3 0.55 � 0.15Transgenic 65 3,233 � 495.5 46 � 4.0 0.42 � 0.11
Data are means � SE of values from five animals from eachgenotype. Pancreatic sections were double-stained with the anti-insulin antibody and TUNEL assay 1 week after 50 mg/kg streptozo-tocin administration as shown in Fig. 4H. Numbers of all nuclei andof TUNEL-positive nuclei in the insulin-positive cells of wild-type andtransgenic mice were counted.
S. HAMADA AND ASSOCIATES
DIABETES, VOL. 58, JUNE 2009 1327
Glu
cose
/Insu
linra
tio(g
/gX
106 )
0
5.0
10.0
0
5.0
10.0
15.0
20.0
**
0
5.0
10.0
2 weeks after STZ 4 weeks after STZ
Insu
lin (p
g/m
l)
600
400
200
0
600
400
200
0
600
400
200
0
1000
800
4 weeks without STZ
2 weeks after STZ 4 weeks after STZ 4 weeks without STZ
WT R3 WT R3 WT R3
WT R3 WT R3 WT R3
100
200
300
400
STZ ip0
Weeks after STZ treatment(weeks)
** * * *
*
Glu
cose
(mg/
dl)
B
0
100
200
300
400G
luco
se(m
g/dl
)
0
100
200
300
400
0 1 2 3 4 5 6 0 1 2 3 4 0 1 2 3 45Weeks after STZ treatment (weeks)
40 mg /kg ip 50 mg /kg ip
STZ ip
* ** * *
STZ ip
*
* ****
*
** *
A
C
D
FIG. 4. Transgenic mice were resistant to streptozotocin-induced hyperglycemia. A: Doses of 40 mg/kg or 50 mg/kg streptozotocin wereadministered to R3 line transgenic mice (F) or wild-type littermates (E) for 5 consecutive days (arrows in the figure). Blood glucoseconcentrations in the fed state were monitored. Data are the means � SE of values from four (40 mg/kg) or five (50 mg/kg) animals from eachgenotype. B: A dose of 50 mg/kg streptozotocin was administered to R20 transgenic mice (F) or wild-type littermates (E), and blood glucoseconcentrations were monitored with mice in the fed state. Data are the means � SE of values from four animals from each genotype. C and D:Plasma insulin concentration (C) and glucose-to-insulin ratio (D) after administration with or without 50 mg/kg streptozotocin as shown in A.E: Oral glucose tolerance tests were performed in R20 transgenic mice (F) and wild-type littermates (E) 4 weeks after streptozotocinadministration as shown in B. Glucose and insulin concentrations are shown. F: Immunostaining with the anti-insulin (red) and anti-glucagon(green) antibodies of representative pancreatic sections from R3 transgenic mice (R3) and their wild-type littermates (WT) 4 weeks after 50mg/kg streptozotocin administration as shown in A. G: Quantification of �-cell area as a percentage of total pancreatic area in transgenic miceand their wild-type littermates 4 weeks after administration with or without 50 mg/kg streptozotocin as shown in A. H: Immunostaining withanti-insulin (red) antibody and TUNEL assay (green) of representative pancreatic sections from the transgenic mice and their wild-typelittermates 1 week after 50 mg/kg streptozotocin administration. Values represent the means � SE. *P < 0.05; **P < 0.01. (A high-quality digitalrepresentation of this figure is available in the online issue.)
REGULATION OF PANCREATIC �-CELL BY mTORC1
1328 DIABETES, VOL. 58, JUNE 2009
DISCUSSION
To examine the role of the mTORC1 pathway in pancreatic�-cells in vivo, we produced transgenic mice that expressRheb under the control of the rat insulin promoter. Rheb isunique in that it maintains basal levels of GTP chargingmuch higher than those of Ras because of its lowerintrinsic GTPase activity. With a limiting level of endoge-nous Rheb GTPase-activating activity established by theTSC complex, even wild-type Rheb takes an active GTPform when it is overexpressed (21). When isolated isletswere incubated in nutrient-limited media, phosphorylationlevels of ribosomal protein S6 and of 4EBP1 were clearlyaugmented in transgenic �-cells compared with wild-type�-cells, in parallel with the abundance of FLAG-Rheb.Moreover, immunostaining of the pancreas sections withthe anti–phospho-S6 antibody revealed an increase in S6phosphorylation in the transgenic �-cells. These resultsindicate that the mTORC1 pathway is upregulated in thepancreatic �-cells of transgenic mice in vivo as well as invitro.
We found that these transgenic mice had improvedglucose tolerance because of a higher capacity to secreteinsulin in response to glucose loading. We also found thatthe increase in insulin secretion was mediated mainly bythe increased secretion in the late phase. Morphometryproved that the increase in the capacity to produce insulincould be attributed to an increase in the �-cell mass, whichwas accompanied by increased �-cell size. These resultsare consistent with previous reports that overexpressionof Rheb as well as loss-of-function mutations of the genesencoding TSC1 or TSC2 results in enlarged cell size(23–28,36).
Overexpression of Rheb might induce dysfunction of
�-cells because inappropriate activation of the TSC/Rhebpathway leads to the downregulation of the insulin/IGF-1signaling system as a result of degradation of IRS1 and -2(37–41). Moreover, constitutive activation of the mTORpathway by loss of the TSC1 or TSC2 genes in cell linesand tumors causes endoplasmic reticulum stress, resultingin inhibition of insulin action and an increase in vulnera-bility to apoptosis (42). Consistent with these reports,Shigeyama et al. (43) demonstrated that mice deficient inTSC2 in pancreatic �-cells developed progressive hyper-glycemia after 40 weeks of age, although the mice alsoexhibited hypoglycemia and hyperinsulinemia whenyoung, suggesting that downregulation of insulin action orendoplasmic reticulum stress might occur with aging. Bycontrast, transgenic mice tended to have lower glucoselevels and improved glucose tolerance even at 40–50weeks. The histological analysis of islets of even 90-week-old mice confirmed no adverse effect on pancreatic �-cells.Although the IRS2 level appeared to be relatively reducedin transgenic islets, the extent of the mTORC1 activationmight not be strong enough to induce adverse effects onthe �-cells in these transgenic mice.
Upregulation of IRS2 and Akt or deletion of Pten in-duces an increase in �-cell mass and resistance to hyper-glycemia (6,7,44). A similar phenotype has been reportedfor the downregulation of more distal negative mediatorsof Akt, FoxO1, and p27kip1 (15,16,45). These phenotypesare mediated by increased proliferation of �-cells as wellas an increase in �-cell size. Reciprocally, mice deficientfor p70S6K or knock-in mice whose S6 protein containsalanine substitutions at all five phosphorylatable serine resi-dues sites show reduced insulin secretion in response toglucose caused by diminished �-cell size (5,17). Because
WT R3
WT(4 weeks after STZ)
R3(4 weeks after STZ)β
cell
area
(%)
WT R3
*
00.10.20.30.40.50.60.7
WT R30
0.10.20.30.40.50.60.7
4 weeks after STZ 4 weeks without STZ
6030150 120Time (min)
0
100
200
300
400
Glu
cose
(mg/
dl) 500
250
500
750
0 15 30Time (min)
Insu
lin (p
g/m
l)
E F
G H
* **
*
**
**
FIG. 4. Continued.
S. HAMADA AND ASSOCIATES
DIABETES, VOL. 58, JUNE 2009 1329
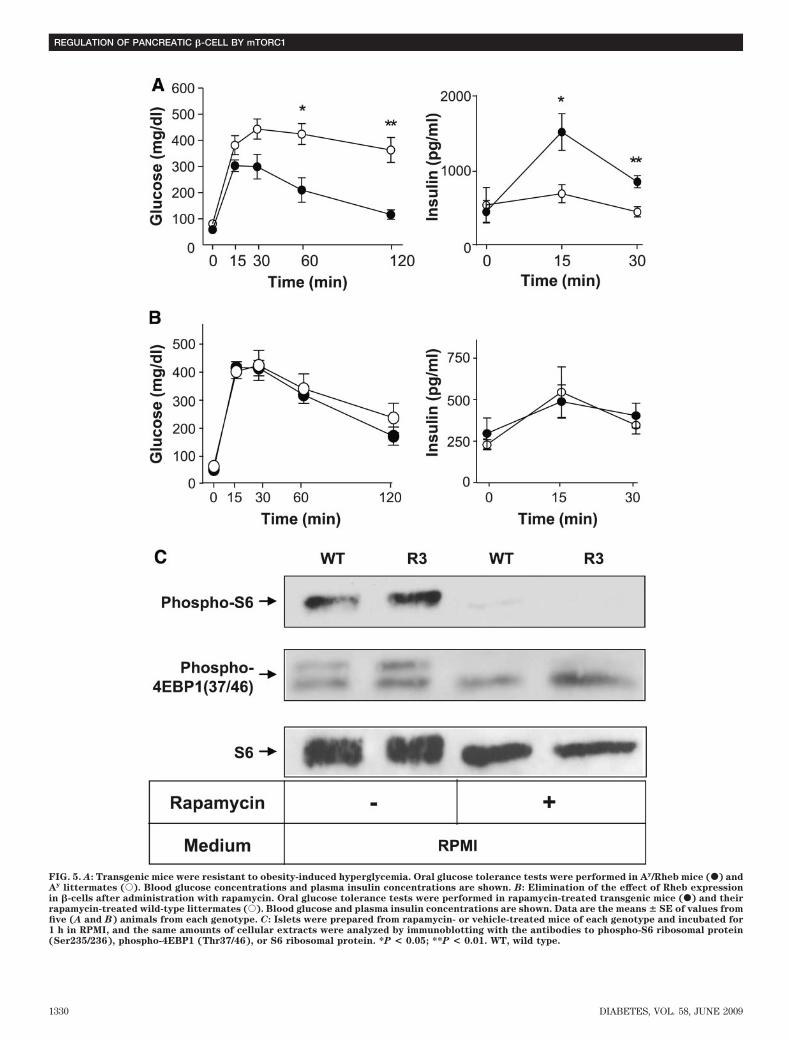
FIG. 5. A: Transgenic mice were resistant to obesity-induced hyperglycemia. Oral glucose tolerance tests were performed in Ay/Rheb mice (F) andAy littermates (E). Blood glucose concentrations and plasma insulin concentrations are shown. B: Elimination of the effect of Rheb expressionin �-cells after administration with rapamycin. Oral glucose tolerance tests were performed in rapamycin-treated transgenic mice (F) and theirrapamycin-treated wild-type littermates (E). Blood glucose and plasma insulin concentrations are shown. Data are the means � SE of values fromfive (A and B) animals from each genotype. C: Islets were prepared from rapamycin- or vehicle-treated mice of each genotype and incubated for1 h in RPMI, and the same amounts of cellular extracts were analyzed by immunoblotting with the antibodies to phospho-S6 ribosomal protein(Ser235/236), phospho-4EBP1 (Thr37/46), or S6 ribosomal protein. *P < 0.05; **P < 0.01. WT, wild type.
REGULATION OF PANCREATIC �-CELL BY mTORC1
1330 DIABETES, VOL. 58, JUNE 2009
Rheb has been reported to be required for both cell cycleprogression and cell growth in Drosophila (28), and be-cause mTORC1 is involved in cell proliferation in somemammalian cells such as cancer cells, it might be prema-ture to conclude only from Ki-67 staining that cell prolif-eration is not involved in our mouse model.
It should be noted that transgenic mice exhibited resis-tance to hyperglycemia induced by low-dose streptozoto-cin as well as by obesity. Although streptozotocinadministration induced a reduction of �-cell areas by�43–45% in both wild-type and transgenic mice, insulinsecretion in response to glucose loading was much higherin transgenic mice than in wild-type littermates. Thissuggests that the residual �-cell function in transgenicmice might be higher than that in wild-type littermates.
We cannot exclude completely the possibility that over-expression of Rheb might affect intracellular signals otherthan mTORC1 pathways. Rheb has been reported toinhibit the Raf-dependent MAPK pathway through theinteraction of the Ras-binding domain of BRaf or cRaf in arapamycin-insensitive manner (46–48). However, serumstimulation of MAPK phosphorylation did not appear todecrease in the transgenic islets compared with theirwild-type littermates. In addition, rapamycin administra-tion eliminated the improved insulin secretion in thetransgenic mice completely to the level observed in wild-type littermates. Given that MAPKs are not affected signif-icantly by rapamycin, these results suggest that therapamycin-sensitive mTORC1 pathway plays a crucial rolein this mouse model.
In conclusion, our findings highlight the importance ofthe role of the mTORC1 pathway in pancreatic �-cells.Activation of the mTORC1 pathway by Rheb led to anincrease in �-cell mass and protection from hyperglycemiainduced by �-cell injury and by insulin resistance. Furtherelucidation of the intracellular signaling mediated by Rhebin pancreatic �-cells might thus provide a basis for thedevelopment of new therapeutic strategies to improveinsulin secretion and thereby prevent the development ofdiabetes.
ACKNOWLEDGMENTS
This work was supported by a grant for the 21st CenturyCOE Program “Center of Excellence for Signal Transduc-tion Disease: Diabetes Mellitus as a Model” and researchgrants from the Ministry of Education, Culture, Sports,Science and Technology of Japan (to K.H.).
No potential conflicts of interest relevant to this articlewere reported.
Parts of this study were presented in abstract form atthe 68th American Diabetes Association Scientific Ses-sions, San Francisco, California, 6–10 June 2008.
We thank Domenico Accili for the generous gift of ratinsulin promoter plasmid and Noriko Oshiro for the gen-erous gift of anti-Rheb antibody and Rheb cDNA. We thankAtsumi Katsuta for her technical assistance. We are grate-ful to Ushio Kikkawa for helpful discussion and continu-ous support.
REFERENCES
1. Kasuga M. Insulin resistance and pancreatic �-cell failure. J Clin Invest2006;116:1756–1760
2. Rhodes CJ. Type 2 diabetes: a matter of �-cell life and death? Science2005;307:380–384
3. Withers DJ, Gutierrez JS, Towery H, Burks DJ, Ren JM, Previs S, Zhang Y,
Bernal D, Pons S, Shulman GI, Bonner-Weir S, White MF. Disruption ofIRS-2 causes type 2 diabetes in mice. Nature 1998;391:900–904
4. Kulkarni RN, Bruning JC, Winnay JN, Postic C, Magnuson MA, Kahn CR.Tissue-specific knockout of the insulin receptor in pancreatic �-cellscreates an insulin secretory defect similar to that in type 2 diabetes. Cell1999;96:329–339
5. Pende M, Kozma SC, Jaquet M, Oorschot V, Burcelin R, Le Marchand-Brustel Y, Klumperman J, Thorens B, Thomas G. Hypoinsulinaemia,glucose intolerance and diminished �-cell size in S6K1-deficient mice.Nature 2000;408:994–997
6. Tuttle RL, Gill NS, Pugh W, Lee JP, Koeberlein B, Furth EE, Polonsky KS,Naji A, Birnbaum MJ. Regulation of pancreatic �-cell growth and survivalby the serine/threonine protein kinase Akt1/PKB�. Nat Med 2001;7:1133–1137
7. Bernal-Mizrachi E, Wen W, Stahlhut S, Welling CM, Permutt MA. Islet �-cellexpression of constitutively active Akt1/PKB� induces striking hypertro-phy, hyperplasia, and hyperinsulinemia. J Clin Invest 2001;108:1631–1638
8. Hashimoto N, Kido Y, Uchida T, Matsuda T, Suzuki K, Inoue H, MatsumotoM, Ogawa W, Maeda S, Fujihara H, Ueta Y, Uchiyama Y, Akimoto K, OhnoS, Noda T, Kasuga M. PKC regulates glucose-induced insulin secretionthrough modulation of gene expression in pancreatic �-cells. J Clin Invest2005;115:138–145
9. Stiles BL, Kuralwalla-Martinez C, Guo W, Gregorian C, Wang Y, Tian J,Magnuson MA, Wu H. Selective deletion of Pten in pancreatic �-cells leadsto increased islet mass and resistance to STZ-induced diabetes. Mol CellBiol 2006;26:2772–2781
10. Hashimoto N, Kido Y, Uchida T, Asahara S, Shigeyama Y, Matsuda T,Takeda A, Tsuchihashi D, Nishizawa A, Ogawa W, Fujimoto Y, Okamura H,Arden KC, Herrera PL, Noda T, Kasuga M. Ablation of PDK1 in pancreatic�-cells induces diabetes as a result of loss of �-cell mass. Nat Genet2006;38:589–593
11. Ueki K, Okada T, Hu J, Liew CW, Assmann A, Dahlgren GM, Peters JL,Shackman JG, Zhang M, Artner I, Satin LS, Stein R, Holzenberger M,Kennedy RT, Kahn CR, Kulkarni RN. Total insulin and IGF-I resistance inpancreatic �-cells causes overt diabetes. Nat Genet 2006;38:583–588
12. Wullschleger S, Loewith R, Hall MN. TOR signaling in growth andmetabolism. Cell 2006;124:471–484
13. Sarbassov DD, Ali SM, Sabatini DM. Growing roles for the mTOR pathway.Curr Opin Cell Biol 2005;17:596–603
14. Isotani S, Hara K, Tokunaga C, Inoue H, Avruch J, Yonezawa K. Immuno-purified mammalian target of rapamycin phosphorylates and activates p70S6 kinase � in vitro. J Biol Chem 1999;274:34493–34498
15. Nakae J, Biggs WH III, Kitamura T, Cavenee WK, Wright CV, Arden KC,Accili D. Regulation of insulin action and pancreatic �-cell function bymutated alleles of the gene encoding forkhead transcription factor Foxo1.Nat Genet 2002;32:245–253
16. Kitamura T, Nakae J, Kitamura Y, Kido Y, Biggs WH III, Wright CV, WhiteMF, Arden KC, Accili D. The forkhead transcription factor Foxo1 linksinsulin signaling to Pdx1 regulation of pancreatic �-cell growth. J ClinInvest 2002;110:1839–1847
17. Ruvinsky I, Sharon N, Lerer T, Cohen H, Stolovich-Rain M, Nir T, Dor Y,Zisman P, Meyuhas O. Ribosomal protein S6 phosphorylation is a deter-minant of cell size and glucose homeostasis. Genes Dev 2005;19:2199–2211
18. Hara K, Maruki Y, Long X, Yoshino K, Oshiro N, Hidayat S, Tokunaga C,Avruch J, Yonezawa K. Raptor, a binding partner of target of rapamycin(TOR), mediates TOR action. Cell 2002;110:177–189
19. Kim DH, Sarbassov DD, Ali SM, Latek RR, Guntur KV, Erdjument-BromageH, Tempst P, Sabatini DM. GbetaL, a positive regulator of the rapamycin-sensitive pathway required for the nutrient-sensitive interaction betweenraptor and mTOR. Mol Cell 2003;11:895–904
20. Aspuria PJ, Tamanoi F. The Rheb family of GTP-binding proteins. CellSignal 2004;16:1105–1112
21. Avruch J, Hara K, Lin Y, Liu M, Long X, Ortiz-Vega S, Yonezawa K. Insulinand amino-acid regulation of mTOR signaling and kinase activity throughthe Rheb GTPase. Oncogene 2006;25:6361–6372
22. Long X, Lin Y, Ortiz-Vega S, Yonezawa K, Avruch J. Rheb binds andregulates the mTOR kinase. Curr Biol 2005;15:702–713
23. Tapon N, Ito N, Dickson BJ, Treisman JE, Hariharan IK. The Drosophila
tuberous sclerosis complex gene homologs restrict cell growth and cellproliferation. Cell 2001;105:345–355
24. Potter CJ, Huang H, Xu T. Drosophila Tsc1 functions with Tsc2 toantagonize insulin signaling in regulating cell growth, cell proliferation,and organ size. Cell 2001;105:357–368
25. Gao X, Pan D. TSC1 and TSC2 tumor suppressors antagonize insulinsignaling in cell growth. Genes Dev 2001;15:1383–1392
26. Stocker H, Radimerski T, Schindelholz B, Wittwer F, Belawat P, Daram P,
S. HAMADA AND ASSOCIATES
DIABETES, VOL. 58, JUNE 2009 1331
Breuer S, Thomas G, Hafen E. Rheb is an essential regulator of S6K incontrolling cell growth in Drosophila. Nat Cell Biol 2003;5:559–565
27. Saucedo LJ, Gao X, Chiarelli DA, Li L, Pan D, Edgar BA. Rheb promotescell growth as a component of the insulin/TOR signaling network. Nat CellBiol 2003;5:566–571
28. Patel PH, Thapar N, Guo L, Martinez M, Maris J, Gau CL, Lengyel JA,Tamanoi F. Drosophila Rheb GTPase is required for cell cycle progressionand cell growth. J Cell Sci 2003;116:3601–3610
29. Garami A, Zwartkruis FJT, Nobukuni T, Joaquin M, Roccio M, Stocker H,Kozma SC, Hafen E, Bos JL, Thomas G. Insulin activation of Rheb, amediator of mTOR/S6K/4E-BP signaling, is inhibited by TSC1 and 2. MolCell 2003;11:1457–1466
30. Tee AR, Manning BD, Roux PP, Cantley LC, Blenis J. Tuberous sclerosiscomplex gene products, Tuberin and Hamartin, control mTOR signaling byacting as a GTPase-activating protein complex toward Rheb. Curr Biol2003;13:1259–1268
31. Gao X, Zhang Y, Arrazola P, Hino O, Kobayashi T, Yeung RS, Ru B, Pan D.Tsc tumour suppressor proteins antagonize amino-acid-TOR signaling. NatCell Biol 2002;4:699–704
32. Hara K, Yonezawa K, Weng QP, Kozlowski MT, Belham C, Avruch J. Aminoacid sufficiency and mTOR regulate p70 S6 kinase and eIF-4E BP1 througha common effector mechanism. J Biol Chem 1998;273:14484–14494
33. Long X, Ortiz-Vega S, Lin Y, Avruch J. Rheb binding to mammalian targetof rapamycin (mTOR) is regulated by amino acid sufficiency. J Biol Chem2005;280:23433–23436
34. Inoki K, Zhu T, Guan KL. TSC2 mediates cellular energy response tocontrol cell growth and survival. Cell 2003;115:577–590
35. Bai X, Ma D, Liu A, Shen X, Wang QJ, Liu Y, Jiang Y. Rheb activates mTORby antagonizing its endogenous inhibitor, FKBP38. Science 2007;318:977–980
36. Fingar DC, Salama S, Tsou C, Harlow E, Blenis J. Mammalian cell size iscontrolled by mTOR and its downstream targets S6K1 and 4EBP1/eIF4E.Genes Dev 2002;16:1472–1487
37. Haruta T, Uno T, Kawahara J, Takano A, Egawa K, Sharma PM, Olefsky JM,Kobayashi M. A rapamycin-sensitive pathway down-regulates insulin sig-naling via phosphorylation and proteasomal degradation of insulin recep-tor substrate-1. Mol Endocrinol 2000;14:783–794
38. Rui L, Fisher TL, Thomas J, White MF. Regulation of insulin/insulin-likegrowth factor-1 signaling by proteasome-mediated degradation of insulinreceptor substrate-2. J Biol Chem 2001;276:40362–40367
39. Shah OJ, Wang Z, Hunter T. Inappropriate activation of the TSC/Rheb/mTOR/S6K cassette induces IRS1/2 depletion, insulin resistance, and cellsurvival deficiencies. Curr Biol 2004;14:1650–1656
40. Harrington LS, Findlay GM, Gray A, Tolkacheva T, Wigfield S, Rebholz H,Barnett J, Leslie NR, Cheng S, Shepherd PR, Gout I, Downes CP, Lamb RF.The TSC1–2 tumor suppressor controls insulin-PI3K signaling via regula-tion of IRS proteins. J Cell Biol 2004;166:213–223
41. Briaud I, Dickson LM, Lingohr MK, McCuaig JF, Lawrence JC, RhodesCJ. Insulin receptor substrate-2 proteasomal degradation mediated by amammalian target of rapamycin (mTOR)-induced negative feedback down-regulates protein kinase B-mediated signaling pathway in �-cells. J BiolChem 2005;280:2282–2293
42. Ozcan U, Ozcan L, Yilmaz E, Duvel K, Sahin M, Manning BD, HotamisligilGS. Loss of the tuberous sclerosis complex tumor suppressors triggers theunfolded protein response to regulate insulin signaling and apoptosis. MolCell 2008;29:541–551
43. Shigeyama Y, Kobayashi T, Kido Y, Hashimoto N, Asahara S, Matsuda T,Takeda A, Inoue T, Shibutani Y, Koyanagi M, Uchida T, Inoue M, Hino O,Kasuga M, Noda T: Biphasic response of pancreatic beta-cell mass toablation of tuberous sclerosis complex 2 in mice. Mol Cell Biol 2008;28:2971–2979
44. Hennige AM, Burks DJ, Ozcan U, Kulkarni RN, Ye J, Park S, Schubert M,Fisher TL, Dow MA, Leshan R, Zakaria M, Mossa-Basha M, White MF.Upregulation of insulin receptor substrate-2 in pancreatic �-cells preventsdiabetes. J Clin Invest 2003;112:1521–1532
45. Uchida T, Nakamura T, Hashimoto N, Matsuda T, Kotani K, Sakaue H, KidoY, Hayashi Y, Nakayama KI, White MF, Kasuga M. Deletion of Cdkn1b
ameliorates hyperglycemia by maintaining compensatory hyperinsulin-emia in diabetic mice. Nat Med 2005;11:175–182
46. Im E, von Lintig FC, Chen J, Zhuang S, Qui W, Chowdhury S, Worley PF,Boss GR, Pilz RB. Rheb is in a high activation state and inhibits B-Rafkinase in mammalian cells. Oncogene 2002;21:6356–6365
47. Karbowniczek M, Cash T, Cheung M, Robertson GP, Astrinidis A, HenskeEP. Regulation of B-Raf kinase activity by tuberin and Rheb is mammaliantarget of rapamycin (mTOR) independent. J Biol Chem 2004;279:29930–29937
48. Karbowniczek M, Robertson GP, Henske EP. Rheb inhibits C-Raf andB-Raf/C-Raf heterodimerization. J Biol Chem 2006;281:25447–25456
REGULATION OF PANCREATIC �-CELL BY mTORC1
1332 DIABETES, VOL. 58, JUNE 2009