Original Article Formulation and Evaluation of Solid Lipid ...
15
Indian Journal of Pharmaceutical Education and Research | Vol 54 | Issue 1 | Jan-Mar, 2020 31 Original Arcle www.ijper.org Formulation and Evaluation of Solid Lipid Nanoparticle Containing Silver Sulfadiazine for Second and Third Degree Burn Wounds and its Suitable Analytical Method Development and Validation Vinayak Shivamurthi Mastiholimath 1, *, Coutinho Tracy Whitney Valerie 1 , Vinodkumar Shrishailappa Mannur 1 , Panchaxari Mallappa Dandagi 2 , Anand Panchaxari Gadad 2 , Pukar Khanal 3 1 Department of Pharmaceutical Quality Assurance, KLE College of Pharmacy-Belagavi, KLE Academy of Higher Education and Research (KAHER) Belagavi, Karnataka, INDIA. 2 Department of Pharmaceutics, KLE College of Pharmacy-Belagavi, KLE Academy of Higher Education and Research (KAHER), Belagavi, Karnataka, INDIA. 3 Department of Pharmacology and Toxicology, KLE College of Pharmacy-Belagavi, KLE Academy of Higher Education and Research (KAHER), Belagavi, Karnataka, INDIA. ABSTRACT Aim: The main aim of this research work was to formulate, characterize and evaluate solid lipid nanoparticles containing Silver sulfadiazine. Materials and Methods: Solid lipid nanoparticles were prepared by hot homogenisation technique using Glycerol distearate, Tween 80 and Millipore water. These nanoparticles were then incorporated into a gel using Carbopol and trietnanolamine Optimised formulation was chosen according to its particle size, as it was for topical use. Various different evaluation parameters like viscosity, spreadability, drug content, pH were carried out. Results and Discussion: The in vitro drug release study was performed for 12hrs and the optimised formulation (F4) gave best results. Antimicrobial studies all four formulation carried out and F4 gave better results than the other formulations. The gel drug content was analysed by HPTLC. All the physical parameters were in acceptable limit of pharmacopoeial specifications. A simple, precise, accurate and high performance thin layer chromatographic method was developed for estimation of Silver Sulfadiazine (SSD) which was prepared as a dosage form. The separation was performed out on Merck HPTLC aluminium plates of silica gel G60 F 254 , (20 x 10cm) with 250µm thickness using n-propanol:25% ammonia (7:3v/v) as mobile phase the wavelength was found to 266nm the drug resolved satisfactorily with R f 0.451. The calibration plot gave good linear relationship with R 2 value of 0.9988 in the concentration range of 0.2 to 1.2µg/ml for SSD. Key words: Analytical method, Burn wounds, HPTLC, Silver sulfadiazine, Solid Lipid Nanoparticles. DOI: 10.5530/ijper.54.1.5 Correspondence: Dr. Vinodkumar Shrishaila Mastiholimath, Department of Pharma- ceutical Quality Assurance, KLE College of Pharmacy, KAHER, Belagavi-590010, Karnataka, INDIA. Phone: +91-0831-2471399 E-mail: mastiholimath@ rediffmail.com Submission Date: 21-05-2019; Revision Date: 04-09-2019; Accepted Date: 06-11-2019 INTRODUCTION Nanotechnology can be described as design characterisation, production and application of structures, devices and systems by controlling shape and its size at a nanometer scale. The colloidal particles should be within its range and the range should be within 10 to 1000nm and these particles are known as nanoparticles. Solid lipid nanoparticles consist of drug trapped inside a lipid core and a surfactant as the outer shell which ultimately makes it a better option for to polymeric systems with respect to low toxicity. 1-3 Silver Sulfadiazine Silver sulfadiazine is a drug which is a com- bination of silver and sulfadiazine. Silver
Transcript of Original Article Formulation and Evaluation of Solid Lipid ...

Indian Journal of Pharmaceutical Education and Research | Vol 54 | Issue 1 | Jan-Mar, 2020 31
Original Article
www.ijper.org
Formulation and Evaluation of Solid Lipid Nanoparticle Containing Silver Sulfadiazine for Second and Third Degree Burn Wounds and its Suitable Analytical Method Development and Validation
Vinayak Shivamurthi Mastiholimath1,*, Coutinho Tracy Whitney Valerie1, Vinodkumar Shrishailappa Mannur1, Panchaxari Mallappa Dandagi2, Anand Panchaxari Gadad2, Pukar Khanal3
1Department of Pharmaceutical Quality Assurance, KLE College of Pharmacy-Belagavi, KLE Academy of Higher Education and Research (KAHER) Belagavi, Karnataka, INDIA. 2Department of Pharmaceutics, KLE College of Pharmacy-Belagavi, KLE Academy of Higher Education and Research (KAHER), Belagavi, Karnataka, INDIA. 3Department of Pharmacology and Toxicology, KLE College of Pharmacy-Belagavi, KLE Academy of Higher Education and Research (KAHER), Belagavi, Karnataka, INDIA.
ABSTRACTAim: The main aim of this research work was to formulate, characterize and evaluate solid lipid nanoparticles containing Silver sulfadiazine. Materials and Methods: Solid lipid nanoparticles were prepared by hot homogenisation technique using Glycerol distearate, Tween 80 and Millipore water. These nanoparticles were then incorporated into a gel using Carbopol and trietnanolamine Optimised formulation was chosen according to its particle size, as it was for topical use. Various different evaluation parameters like viscosity, spreadability, drug content, pH were carried out. Results and Discussion: The in vitro drug release study was performed for 12hrs and the optimised formulation (F4) gave best results. Antimicrobial studies all four formulation carried out and F4 gave better results than the other formulations. The gel drug content was analysed by HPTLC. All the physical parameters were in acceptable limit of pharmacopoeial specifications. A simple, precise, accurate and high performance thin layer chromatographic method was developed for estimation of Silver Sulfadiazine (SSD) which was prepared as a dosage form. The separation was performed out on Merck HPTLC aluminium plates of silica gel G60 F254, (20 x 10cm) with 250µm thickness using n-propanol:25% ammonia (7:3v/v) as mobile phase the wavelength was found to 266nm the drug resolved satisfactorily with Rf 0.451. The calibration plot gave good linear relationship with R2 value of 0.9988 in the concentration range of 0.2 to 1.2µg/ml for SSD.Key words: Analytical method, Burn wounds, HPTLC, Silver sulfadiazine, Solid Lipid Nanoparticles.
DOI: 10.5530/ijper.54.1.5Correspondence:Dr. Vinodkumar Shrishaila Mastiholimath,Department of Pharma-ceutical Quality Assurance, KLE College of Pharmacy, KAHER, Belagavi-590010, Karnataka, INDIA.Phone: +91-0831-2471399E-mail: [email protected]
Submission Date: 21-05-2019;Revision Date: 04-09-2019;Accepted Date: 06-11-2019
INTRODUCTION
Nanotechnology can be described as design characterisation, production and application of structures, devices and systems by controlling shape and its size at a nanometer scale. The colloidal particles should be within its range and the range should be within 10 to 1000nm and these particles are known as nanoparticles. Solid
lipid nanoparticles consist of drug trapped inside a lipid core and a surfactant as the outer shell which ultimately makes it a better option for to polymeric systems with respect to low toxicity.1-3
Silver Sulfadiazine
Silver sulfadiazine is a drug which is a com-bination of silver and sulfadiazine. Silver

Mastiholimath, et al.: Silver Sulfadiazine for Second and Third Degree Burn Wounds
32 Indian Journal of Pharmaceutical Education and Research | Vol 54 | Issue 1 | Jan-Mar, 2020
sulfadiazine is a polymer in which each silver ion is tet-racordinated and they are enclosed by 3 different depro-tonated sulfa molecule and each individual molecule binds to 3 different silver ions.4
Burn injuries can occur in any age group at its common injury and it can be minor to major.5 there are various types of burn wounds such as second and third degree burns.
Antimicrobial
Silver sulfadiazine is a very good antibacterial agent and its approved by United States Food and Drug Adminis-tration. It has a great spectrum of activity against gram +ve and gram –ve bacteria. The silver ions which are present into the microbial DNA contribute to bacteri-cidal activity whereas sulfadiazine interferes with bacte-rial metabolic processes.6 SSD also works with its lethal effect towards the microbial infection while the wound is being healed.7 So accordingly after carrying out it was concluded that nanosized SSD can interact with micro-bial colonies to enhance the surface area which pro-motes the healing of the wound.5
Method Development and Validation by High Performance Liquid Chromatography
HPTLC is a process which is suitable for Qualitative and Quantitative analysis, it has also been reported that it gives better results for separation, qualitative and quantitative analysis for compounds like herbal etc. The chromatograms which are produced are very observable of the sample and its similarities and differences can be also noticeable using the images.8
Steps involved in HPTLC9
• Sample preparation• Selection of stationary phase• Layer prewashing• Selection and optimising if mobile phase• Sample application• Chromatogram development• Plate labelling• Derivatization• Documentation• Detection• Quantitation
MATERIALS AND METHODSSilver sulfadiazine was a gift sample from J P N Pharma Pvt. Ltd. Mumbai, India and Glycerol Distearate and Tween 80 was from Gattefosse, France and Hi Media
Laboratories Pvt. Ltd, Mumbai. The test microorganism used for the antimicrobial study was E. coli maintained on nutrient agar provided by Himedia Lab Ltd. Mumbai.
Preformulation StudyIdentificationDetermination of melting point
Melting point of silver sulfadiazine was found by using Thiele’s tube apparatus. The melting point of the sample is done to check the purity of the sample.
Solubility analysis
Solubility analysis was done to find out a suitable sol-vent to dissolve the drug and lipid and excipients which were used for formulation preparation.
FT-IR spectroscopy10
Solid samples: The IR spectral analysis of the pure drug silver sulfadiazine was carried out. In which the physical mixture of the drug along with excipients was analysed to get a spectra which was then compared with the reference standard infrared spectrum of silver sul-fadiazine.Liquid samples: The nanosuspension containing silver sulfadiazine solid lipid nanoparticle was centri-fuged at 12000rpm for 30 min and then the solid residue was collected and dried at 65°C. Further on this residue was mixed with KBr and was recorded on a Thermo Scientific FT-IR Spectrometer to 4000-400cm-1 at a resolution of 4cm-1.
Compatibility studies
Drug lipid interaction was carried out by IR spectros-copy. IR spectra of SSD along with its lipid glycerol distearate and with lipid glycerol distearate and gelling agent carbopol were studied within range of 4000 – 400 cm-1 at a resolution of 4 cm-1.
Determination of λmax of silver sulfadiazine in 0.05% ammonia solution
The 100mg of the accurately weighed drug was trans-ferred into a 100ml of volumetric flask. The drug was then dissolved using 0.05% ammonia solution and was made upto the mark to get a stock solution. From this stock solution aliquots were prepared to get a concen-tration of 100µg/ml and this solution was then scanned between 400-200nm using the blank solution as 0.05% ammonia solution. The spectrum of absorbance versus wavelength was recorded on UV-spectroscopy and analysed for absorbance maximum and the highest absorbance was noted.
Mastiholimath, et al.: Silver Sulfadiazine for Second and Third Degree Burn Wounds
Indian Journal of Pharmaceutical Education and Research | Vol 54 | Issue 1 | Jan-Mar, 2020 33
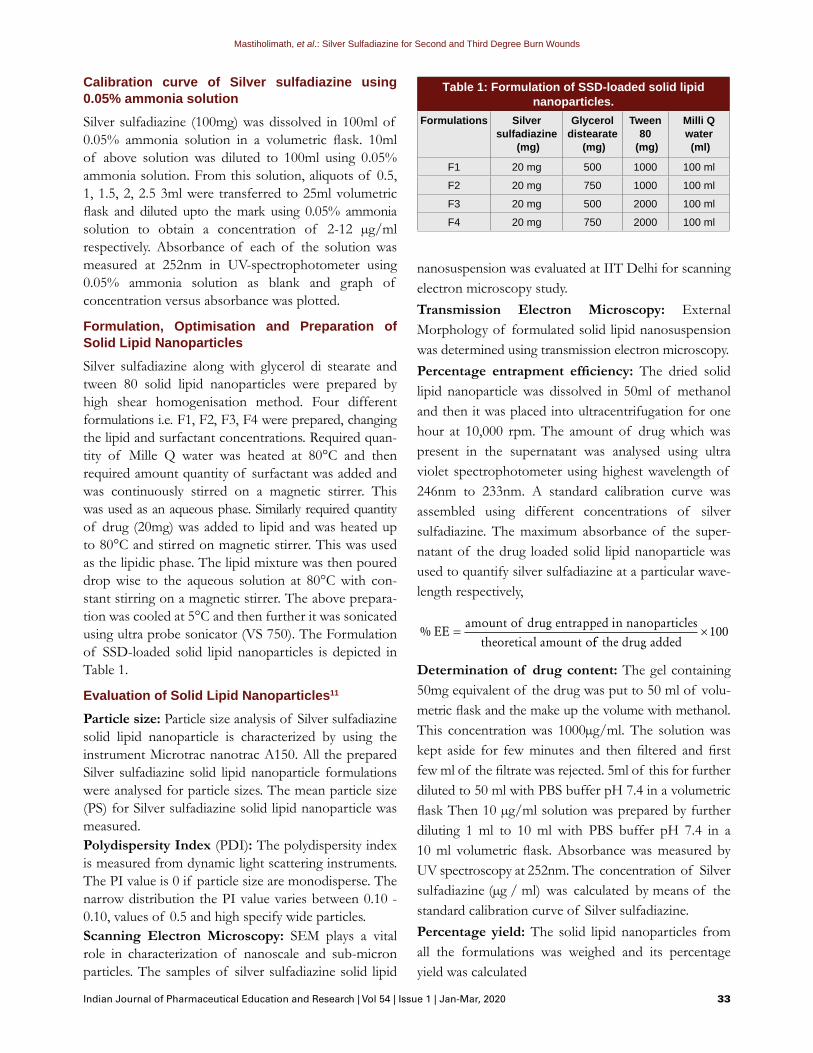
Calibration curve of Silver sulfadiazine using 0.05% ammonia solution
Silver sulfadiazine (100mg) was dissolved in 100ml of 0.05% ammonia solution in a volumetric flask. 10ml of above solution was diluted to 100ml using 0.05% ammonia solution. From this solution, aliquots of 0.5, 1, 1.5, 2, 2.5 3ml were transferred to 25ml volumetric flask and diluted upto the mark using 0.05% ammonia solution to obtain a concentration of 2-12 µg/ml respectively. Absorbance of each of the solution was measured at 252nm in UV-spectrophotometer using 0.05% ammonia solution as blank and graph of concentration versus absorbance was plotted.
Formulation, Optimisation and Preparation of Solid Lipid Nanoparticles
Silver sulfadiazine along with glycerol di stearate and tween 80 solid lipid nanoparticles were prepared by high shear homogenisation method. Four different formulations i.e. F1, F2, F3, F4 were prepared, changing the lipid and surfactant concentrations. Required quan-tity of Mille Q water was heated at 80°C and then required amount quantity of surfactant was added and was continuously stirred on a magnetic stirrer. This was used as an aqueous phase. Similarly required quantity of drug (20mg) was added to lipid and was heated up to 80°C and stirred on magnetic stirrer. This was used as the lipidic phase. The lipid mixture was then poured drop wise to the aqueous solution at 80°C with con-stant stirring on a magnetic stirrer. The above prepara-tion was cooled at 5°C and then further it was sonicated using ultra probe sonicator (VS 750). The Formulation of SSD-loaded solid lipid nanoparticles is depicted in Table 1.
Evaluation of Solid Lipid Nanoparticles11
Particle size: Particle size analysis of Silver sulfadiazine solid lipid nanoparticle is characterized by using the instrument Microtrac nanotrac A150. All the prepared Silver sulfadiazine solid lipid nanoparticle formulations were analysed for particle sizes. The mean particle size (PS) for Silver sulfadiazine solid lipid nanoparticle was measured.Polydispersity Index (PDI): The polydispersity index is measured from dynamic light scattering instruments. The PI value is 0 if particle size are monodisperse. The narrow distribution the PI value varies between 0.10 - 0.10, values of 0.5 and high specify wide particles.Scanning Electron Microscopy: SEM plays a vital role in characterization of nanoscale and sub-micron particles. The samples of silver sulfadiazine solid lipid
nanosuspension was evaluated at IIT Delhi for scanning electron microscopy study.Transmission Electron Microscopy: External Morphology of formulated solid lipid nanosuspension was determined using transmission electron microscopy.Percentage entrapment efficiency: The dried solid lipid nanoparticle was dissolved in 50ml of methanol and then it was placed into ultracentrifugation for one hour at 10,000 rpm. The amount of drug which was present in the supernatant was analysed using ultra violet spectrophotometer using highest wavelength of 246nm to 233nm. A standard calibration curve was assembled using different concentrations of silver sulfadiazine. The maximum absorbance of the super-natant of the drug loaded solid lipid nanoparticle was used to quantify silver sulfadiazine at a particular wave-length respectively,
% EE
amount of drug entrapped in nanoparticlestheoretical amount o
=ff the drug added
×100
Determination of drug content: The gel containing 50mg equivalent of the drug was put to 50 ml of volu-metric flask and the make up the volume with methanol. This concentration was 1000µg/ml. The solution was kept aside for few minutes and then filtered and first few ml of the filtrate was rejected. 5ml of this for further diluted to 50 ml with PBS buffer pH 7.4 in a volumetric flask Then 10 µg/ml solution was prepared by further diluting 1 ml to 10 ml with PBS buffer pH 7.4 in a 10 ml volumetric flask. Absorbance was measured by UV spectroscopy at 252nm. The concentration of Silver sulfadiazine (µg / ml) was calculated by means of the standard calibration curve of Silver sulfadiazine.Percentage yield: The solid lipid nanoparticles from all the formulations was weighed and its percentage yield was calculated
Table 1: Formulation of SSD-loaded solid lipid nanoparticles.
Formulations Silver sulfadiazine
(mg)
Glycerol distearate
(mg)
Tween 80
(mg)
Milli Q water (ml)
F1 20 mg 500 1000 100 ml
F2 20 mg 750 1000 100 ml
F3 20 mg 500 2000 100 ml
F4 20 mg 750 2000 100 ml

Mastiholimath, et al.: Silver Sulfadiazine for Second and Third Degree Burn Wounds
34 Indian Journal of Pharmaceutical Education and Research | Vol 54 | Issue 1 | Jan-Mar, 2020
Percentage yield
weight of solid liquid
nanoparticles obtainedWe
=iight of drug lipid and
excipients used
×100
In vitro drug release: Diffusion through dialysis mem-brane was done to evaluate the release of the drug. All the samples F1, F2, F3, F4 were evaluated in which SSD was present. Samples were placed in the dialysis bag and then they were immersed into a 50ml of beaker contain-ing phosphate-buffered saline (PBS:7.4). The dialysis bags were tied with thread at both of its ends and then were suspended into the buffer. The above solution was stirred with the help of magnetic stirrer at 50rpm. Ali-quots of 2ml dissolution medium were withdrawn at a series of various time intervals (0.5, 1, 2, 3, 4, 5, 6, 7, 8, 9, 10, 11 and 12 hr) and at the same time a fresh dissolu-tion medium was replaced. The aliquots were analysed at 252nm by UV- spectrophotometer.
Antibacterial studyDisk Diffusion test
Preparation of Nutrient Agar Media: 1.05g of Nutrient agar was dissolved in 50 ml of distilled water and was then heated so that the content dissolves and then it was autoclaved for 15 min at 121°C, After autoclaving it was allowed to cool but not solidify, later this content was poured into petriplates keeping it on sterile surface until it solidifies.Inoculation of Culture media for antimicrobial activity: A loop was dipped in E. coli culture and removed; this was carried out in aseptic area. Then agar plate was taken and the loop was touched in the middle of the plate and a spreader was used to spread the cul-ture, later the loop was sterilised and the plate was cov-eredIncubation of Plates and Minimum Inhibitory Concentration (MIC) count: 10mm discs were placed along with the formulation and these agar plates were then incubated at 35°C for 24 hr, later the zone of inhi-bition was measured
Preparation of a Gel
A gel containing silver sulfadiazine solid lipid nanopar-ticle was prepared using required amount of carbopol 934 which is a gelling agent. To the nanosuspension containing SLNs the required amount of glycerine was added which acts as a humectant. Carbopol was added to double distilled water to get hydrated for 4-5hrs. To this the SLNs equivalent to 0.02% silver sulfadiazine was added. Triethanol amine was added to the carbopol dispersion under stirring at 1200rpm. The gel was kept
overnight to remove the enclosed air. The gel was then evaluated for pH, physical appearance, spread ability drug content, viscosity and in vitro drug release studies. The Gel formulation is depicted in Table 2.
Evaluation of the Gel
1. Physical appearance: The gel which was prepared was examined for its colour, homogeneity and pres-ence of foreign particles.
2. pH: A digital pH meter was used to check out pH of the gel. 1 g of the gel was allowed to dis-perse in 25ml of distilled water and then the pH was determined.
3. Viscosity: The viscosity of the gel was examined by using Brookfield rheometer. It was recorded by using the disc spindle no.52 at an optimum speed of 1 rpm.
4. Drug content: Drug content of the gel was deter-mined by HPTLC analysis.
5. Spreadability: The spreadability of the gel was carried out by taking 2 slides of 10x10cm each. From which one slide is kept fixed at one position while the other slide is placed over this slide on which 5g of weight is placed. The slide was allowed to stand the same position for five min. The weight which is placed is removed and the time is noted to remove the top slide. Less time taken for the separation of the two slides, gave better spreadability of the gel.it is calculated by using the formula:
S = M.L/TWhere, M = weight tied to the upper slide L = length of the glass slide T = time taken to separate the slides1. In vitro drug release studies: Study was performed
in modified Franz diffusion cell using dialysis membrane-150. This dialysis membrane was soaked for 24 hr in a PBS pH7.4. Then the membrane was clamped within the donor and the receptor cell. 1 gm of this gel was uniformly spread on the dialysis membrane. 50 ml of PBS pH 7.4 was used as dis-solution medium which was added to the receptor cell. After setting off the assembly, the assembly
Table 2: Formulation of a gel containing SSD-SLNs.Ingredients Composition (%w/w)
Carbopol 934 1
SLN eq. to 0.02% SSD 1
Glycerin 10
Triethanolamine q.s
Distilled water q.s
Mastiholimath, et al.: Silver Sulfadiazine for Second and Third Degree Burn Wounds
Indian Journal of Pharmaceutical Education and Research | Vol 54 | Issue 1 | Jan-Mar, 2020 35
was placed on a magnetic stirrer and the solution was continuously stirred using magnetic bead, simultaneously its temperature at 37±0.5°C. 2 ml of sample was taken at a time interval of 0, 0.5, 1,2,3,4,5,6,7,8,9,10,11 and 12h of interval and at the same time it was replaced back by fresh PBS pH 7.4 (dilution medium). Dilutions were made of the sample and it was analysed by UV Spectrophotome-ter at 252nm and the cumulative % drug release was calculated. The graph of % cumulative drug release versus time was plotted.
HPTLC Method Development and Validation9
Selection of Wavelength detection
Solutions of silver sulfadiazine (10µg/ml) were prepared in methanol. The λmax was determined by scanning in the range 0f 400-200nm.The λmax of silver sulfadiazine was found to be 266 nm.Selection and optimization of mobile phasea) Mobile phase preparation The mobile phase containing n-propanol: 25%
ammonia in the ratio of 7:3v/v for preparation of elution.
b) Diluent preparation Methanol and ammonia 25% (1:9v/v) were used as
diluentc) Standard preparation Silver sulfadizine containing the stock solution of
1mg / ml was prepared in 10ml volumetric flask with 10mg of silver sulfadiazine dissolving it in 1 ml of 25% ammonia and then diluting to 9 ml with methanol. Further the concentration of the stock solution was 1 µg/ml which was prepared and was used for further analysis.
Application of developed method to pharmaceutical dosage form (assay of gel containing Silver sulfadiazine SLNs)Test preparation (Gel loaded with Silver sulfadiazine SLNs): 20g of the gel was weighed accurately and was extracted by using 9 ml n-hexane and 1 ml ammonia. This solution was then centrifuged for 1hr at 12000 rpm. 1ml supernatant was diluted to 2 ml with 25% ammonia for further analysis after filtering through Whatman filter paper (0.4 µm) to obtain 0.2 mg/ml of sample.12
Chromatographic conditions: Chromatographic analysis was carried out on HPTLC plates which were precoated with 0.25mm layer of chromatographic silica gel mixture (Silica GF 254) on aluminium sheets on which detection was carried out by TLC scanner set at a wavelength of 266nm.
Validation Parameters8
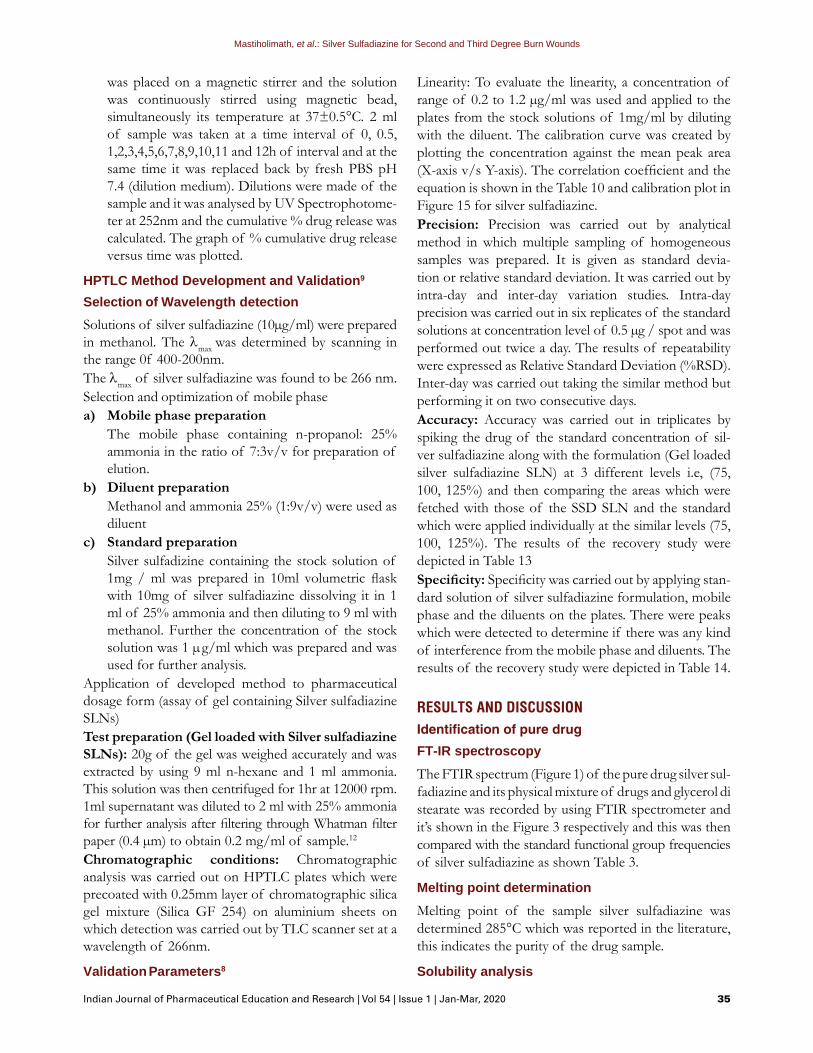
Linearity: To evaluate the linearity, a concentration of range of 0.2 to 1.2 µg/ml was used and applied to the plates from the stock solutions of 1mg/ml by diluting with the diluent. The calibration curve was created by plotting the concentration against the mean peak area (X-axis v/s Y-axis). The correlation coefficient and the equation is shown in the Table 10 and calibration plot in Figure 15 for silver sulfadiazine.Precision: Precision was carried out by analytical method in which multiple sampling of homogeneous samples was prepared. It is given as standard devia-tion or relative standard deviation. It was carried out by intra-day and inter-day variation studies. Intra-day precision was carried out in six replicates of the standard solutions at concentration level of 0.5 µg / spot and was performed out twice a day. The results of repeatability were expressed as Relative Standard Deviation (%RSD). Inter-day was carried out taking the similar method but performing it on two consecutive days.Accuracy: Accuracy was carried out in triplicates by spiking the drug of the standard concentration of sil-ver sulfadiazine along with the formulation (Gel loaded silver sulfadiazine SLN) at 3 different levels i.e, (75, 100, 125%) and then comparing the areas which were fetched with those of the SSD SLN and the standard which were applied individually at the similar levels (75, 100, 125%). The results of the recovery study were depicted in Table 13 Specificity: Specificity was carried out by applying stan-dard solution of silver sulfadiazine formulation, mobile phase and the diluents on the plates. There were peaks which were detected to determine if there was any kind of interference from the mobile phase and diluents. The results of the recovery study were depicted in Table 14.
RESULTS AND DISCUSSIONIdentification of pure drugFT-IR spectroscopy
The FTIR spectrum (Figure 1) of the pure drug silver sul-fadiazine and its physical mixture of drugs and glycerol di stearate was recorded by using FTIR spectrometer and it’s shown in the Figure 3 respectively and this was then compared with the standard functional group frequencies of silver sulfadiazine as shown Table 3.
Melting point determination
Melting point of the sample silver sulfadiazine was determined 285°C which was reported in the literature, this indicates the purity of the drug sample.
Solubility analysis

Mastiholimath, et al.: Silver Sulfadiazine for Second and Third Degree Burn Wounds
36 Indian Journal of Pharmaceutical Education and Research | Vol 54 | Issue 1 | Jan-Mar, 2020
Silver sulfadiazine if insoluble in distilled water, slightly soluble in acetone, practically insoluble in alcohol, chloroform, ether, freely soluble in 30% ammonia.
Compatibility studiesCompatibility by IR Spectrophotmetry
The interaction between the drug and the lipid, the IR (4000-400cm-1) spectroscopy was done. Similar peaks were noticed in the drug, lipid and carbpol mixture. The IR spectra of the drug and along with and lipid and carbopol is shown in Table 4 respectively. The spectrum of Silver sulfadiazine and the physical mixture of Silver sulfadiazine along with its excipients are listed below in Table 4. The results of the same are depicted in Figure 2-4.
Determination of λmax
The absorbance spectrum of pure drug i.e, Silver sul-fadiazine was scanned between 400 to 200nm on Ultra
Table 3: Frequencies and respective functional groups of pure Silver sulfadiazine.
Frequency (cm-1) Functional Group1016.49 S=O stretch
1259.52 C-O stretch
1661.07 C=C stretch
3263.56 N-H stretch
Figure 1: FTIR spectrum of Silver sulfadiazine.
Figure 2: IR Spectrum of physical mixture of SSD and glycerol distearate.
Figure 3: FTIR Spectrum of physical mixture of SSD, Carbopol and Glycerol distearate.
Figure 4: FTIR Spectrum of Silver sulfadiazine loaded SLNs.
Table 4: FTIR Spectral data of pure Silver sulfadiazine, the physical mixtures and the optimized formulation F4.
Functional group
Frequency SSD SSD+ Glycerol distearate
SSD + glycerol distearate +
Carbopol
Liquid sample
S=O stretch 1030-1070 1016.49 1014.56 1014.56 1020.54
C-O stretch 1200-1275 1259.52 1249.87 1249.87 1259.24
C=C stretch 1661-1662 1661.07 - 1660.71 1650.37
N-H stretch 2500-3300 3263.56 3257.77 3082.25 3263.56

Mastiholimath, et al.: Silver Sulfadiazine for Second and Third Degree Burn Wounds
Indian Journal of Pharmaceutical Education and Research | Vol 54 | Issue 1 | Jan-Mar, 2020 37
Violet-Visible Spectrophotometer with concentration of of 100 µg/ml in 0.05% ammonia solution. The max-imum absorption was obtained at 252 nm.
Standard calibration curve of Silver sulfadiazine
The absorbance of silver sulfadiazine standard solution which was ranging from 2-12µg/ml was measured at 252nm and accordingly standard calibration curve was plotted. The curve which was plotted was Linear in the range of 2-12µg/ ml. at λmax 252nm. The correlation coefficient was found to be 0.997. The calibration curve is depicted in Table 5 and Figure 5.
Evaluation of Formulated SSD-SLNS11
Particle size: Particle size and its shape is very impor-tant aspect when it comes to topical application as it has to penetrate through the skin. Particle size data of the formulations F1 - F4 were noted down in Table 5. The mean particle size of the formulated F1 to F4 formulations was different in the range from 50-200nm. PDI: The polydispersity index was found by taking into consideration the mean values for the formulation which were in various ranges of 0.232 to 0.642.Entrapment efficiency: The values of drug entrap-ment efficiency of formulated formulations are listed below in the Table 5. The entrapment efficiency of the
drug is greater wen the concentration of the lipid is large.The evaluation of the formulated SSD-SLNS is depicted in Table 6.TEM and SEM: The TEM study suggested that the particles had a round shaped structure and were in required range of 200 nm as shown in Figure 7.SEM study suggested that the particles were round in shape and there was no aggregations of particles were seen due to the presence of surfactant. As shown in Figure 6.
In vitro drug release
Evaluation of the Gel
pH, viscosity of gel, percentage drug content and Spreadability
Figure 5: Calibration curve for Silver sulfadiazine.
Figure 6: SEM image of optimized formulation F4.
Table 5: Standard calibration curve of Silver sulfadiazine.
Concentration (µg/ml) Absorbance0 0
2 0.089
4 0.181
6 0.293
8 0.396
10 0.481
12 0.556
Tabl
e 6:
%E
E, %
yiel
d, d
rug
cont
ent,
part
icle
siz
e an
d P
DI o
f F1
to F
4.Fo
rmul
atio
n%
En
trap
men
t Efficiency
%yi
eld
% D
rug
Con
tent
Part
icle
si
ze(n
m)
Poly
Dis
pers
ityIn
dex
F189
.75
81.5
591
.30
174.
40.
312
F288
.60
83.6
090
.65
201.
80.
2672
F389
.02
87.2
693
.50
133.
30.
232
F490
.02
90.5
094
.26
68.3
00.
642

Mastiholimath, et al.: Silver Sulfadiazine for Second and Third Degree Burn Wounds
38 Indian Journal of Pharmaceutical Education and Research | Vol 54 | Issue 1 | Jan-Mar, 2020
The pH of all the FG4 gel formulation was found to be of 6.8 that suit the skin pH indicating the skin compat-ibility. The viscosity of the FG4 gel was found to be 10843 cps. The percentage drug content of optimized FG4 gel was found to be 98.7% which stated that drug was uniformly distributed in the gel. The spread ability of the gel was determined within 3.53 to 4.21 gm.cm/s. The results are depicted in Table 7, Figure 8 and 9 rep-resents the in vitro drug release of SSD-SLNs.
In vitro drug releaseAntimicrobial studies
The antimicrobial activity of the prepared gel SSD-SLNs was determined against E. coli using disk diffusion method shown in Figure 10. The mean diameter of inhibition of FG1 to FG4 are shown in the Table 8.
Analytical Method Development and ValidationSelection and optimization of mobile phase
The selection of the mobile phase is very important in the development phase of chromatographic method for a specific elution, resolution, spot definition, symmetrical peak shape and Rf reproducibility of the analyses. So the primary trials which were carried out were by using solvents like chloroform, methanol, ammonia 25%, glacial acetic acid, distilled water, n-pro-
ponal. The method detected that resolution of the drug was good but the Rf value was reproducible. After this accordingly the mobile phase was chosen as the final mobile phase was N-propanol: 25% ammonia in the ratio of (7:3v/v) as this mobile phase showed better reproducibility. The results are depicted in Table 9.
Thus the optimised mobile phase used for the separation was N-propanol: 25% ammonia in the ratio of (7:3v/v)
Track I to VI: Silver sulfadiazineTrack VII and IX: Formulation (Gel containing SSD-SLNs)
Application of the developed formulation to a pharmaceutical dosage form (Assay of gel containing SSD-SLNs)
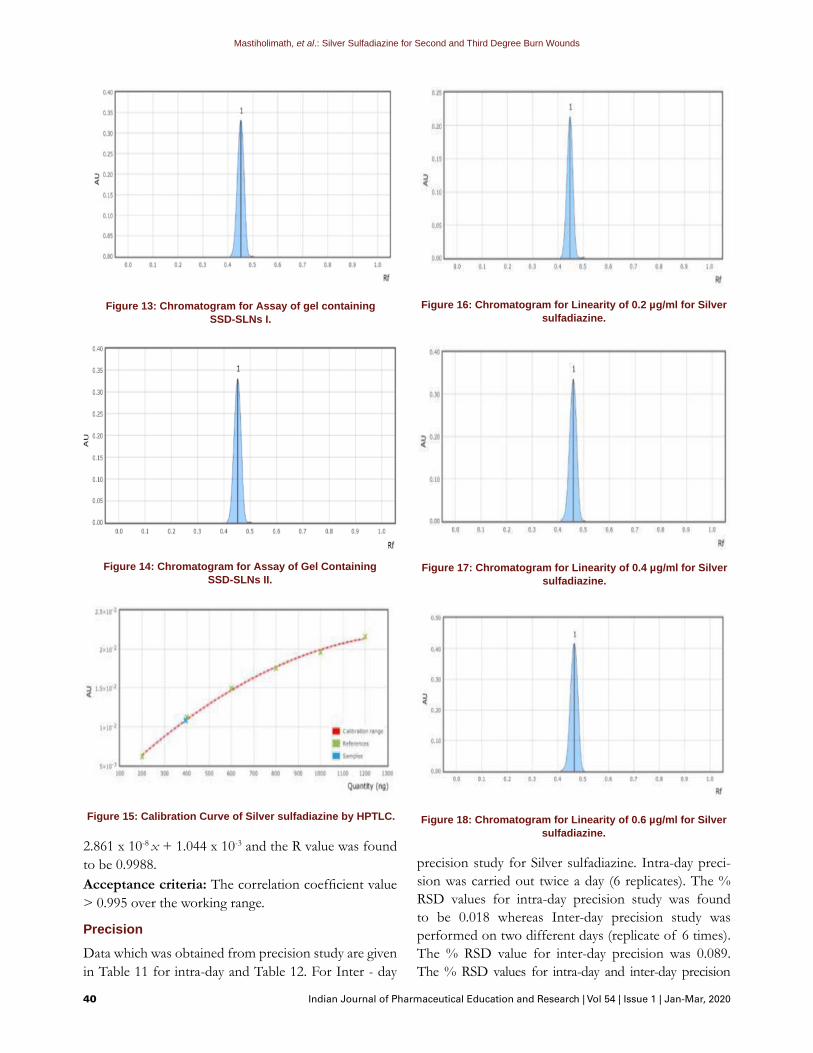
The dug content of the Gel containing silver sulfadia-zine was found to be 98.7%. Figure 12 represents the chromatogram of method development of Silver sul-fadiazine.
Validation Parameters
Linearity: Calibration graphs were plotted using peak areas of standard drug v/s. concentration of standard drug solutions. Linear regression data revealed a good relationship over a concentration range of 0.2µg to 1.2µg/ml with an equation of Y= -9.727 x 10-15 x2 +
Figure 7: TEM image of optimized formulation F4.
Figure 8: In vitro drug release of SSD-SLNs.
Table 7: Physical appearance, pH, viscosity and spreadability of the formulated gel.
Formulation Physical Appearance
pH Viscosity (cPs)
Spreadability(gm.cm/s)
FG1 White in colour, smooth texture
6.63 11254 3.84
FG2 White in colour, smooth texture
6.77 12049 3.53
FG3 White in colour, smooth texture
6.75 10265 4.08
FG4 White in colour, smooth texture
6.8 10843 4.21
Table 8: Zone inhibition of the gel SSD-SLNs formulation against E. coli.
Formulation MIC (Zone of Inhibition) mmF1 6.4
F2 6.9
F3 7.3
F4 7.8
Mastiholimath, et al.: Silver Sulfadiazine for Second and Third Degree Burn Wounds
Indian Journal of Pharmaceutical Education and Research | Vol 54 | Issue 1 | Jan-Mar, 2020 39
Figure 9: In vitro drug release of formulated gel containing SSD-SLNs.
Figure 10: Antimicrobial activity of gel containing SSD-SLNs.
Figure 11: Optimised formulation F4.
Figure 12: Chromatogram of method development of Silver sulfadiazine.
Table 9: Optimized Chromatographic condition for HPTLC analysis.
Parameters Chromatographic ConditionsDevelopment chamber CAMAG Twin Trough Chamber
Stationary phase Silica gel G 60 F-254 precoated on aluminum sheet
Mobile phase N-propanol:25%ammonia (7:3v/v)
Chamber saturation 20 min
Sample applicator CAMAG AUTOMATIC TLC SAMPLER 4
Band 8mm
Scanning speed 20mm/s
Development distance 80% of plate
Drying of plate Room temperature
Densitometric scanner CAMAG TLC SCANNER 4
Lamp Deuterium
Wavelength 266 nm
Table 10: Assay of Gel containing SSD-SLNs.Drug Theoretical
concentration (µg/spot)
Observed concentration
(µg/spot)*
% Assay
Silver sulfadiazine
200 197.4 98.7%
*average of two determinations
Table 11: Calibration data for Linearity Silver sulfadiazine by HPTLC.
Sr no.
Concentration Peak Area
1 0.2µg/ml 0.00616
2 0.4µg/ml 0.01121
3 0.6µg/ml 0.01493
4 0.8µg/ml 0.01753
5 1.0µg/ml 0.01958
6 1.2µg/ml 0.02161
Concentration range 0.2-1.2 µg/ml
Correlation coefficient
0.9988
Equation Y= -9.727 x 10-15 x2 + 2.861 x 10⁻⁸ x + 1.044 x 10⁻³
Mastiholimath, et al.: Silver Sulfadiazine for Second and Third Degree Burn Wounds
40 Indian Journal of Pharmaceutical Education and Research | Vol 54 | Issue 1 | Jan-Mar, 2020
Figure 13: Chromatogram for Assay of gel containing SSD-SLNs I.
Figure 14: Chromatogram for Assay of Gel Containing SSD-SLNs II.
Figure 15: Calibration Curve of Silver sulfadiazine by HPTLC.
Figure 16: Chromatogram for Linearity of 0.2 µg/ml for Silver sulfadiazine.
Figure 17: Chromatogram for Linearity of 0.4 µg/ml for Silver sulfadiazine.
Figure 18: Chromatogram for Linearity of 0.6 µg/ml for Silver sulfadiazine.
2.861 x 10⁻⁸ x + 1.044 x 10⁻³ and the R value was found to be 0.9988.Acceptance criteria: The correlation coefficient value > 0.995 over the working range.
Precision
Data which was obtained from precision study are given in Table 11 for intra-day and Table 12. For Inter - day
precision study for Silver sulfadiazine. Intra-day preci-sion was carried out twice a day (6 replicates). The % RSD values for intra-day precision study was found to be 0.018 whereas Inter-day precision study was performed on two different days (replicate of 6 times). The % RSD value for inter-day precision was 0.089. The % RSD values for intra-day and inter-day precision

Mastiholimath, et al.: Silver Sulfadiazine for Second and Third Degree Burn Wounds
Indian Journal of Pharmaceutical Education and Research | Vol 54 | Issue 1 | Jan-Mar, 2020 41
Silver sulfadiazine with the formulation (gel containing SSD-SLN) at 3 different levels (75%, 100% and 125%) with the area obtained by spot application of the formulation and pure drugs. The % recovery of 75%, 100% and 125% is found to be 87.86%, 85.91% and 97.21% respectively. The mean recovery for Silver sulfadiazine was 90.33%. The % recovery was between the acceptance limits therefore the method was estimated as accurate.Data for accuracy is depicted in Table 14. Figure 22 rep-resents the chromatogram for reproducibility of 0.5 µg/ml of Silver sulfadiazine (Intra Day). Similarly, Figure 23 and 24 represents Figure 23: Chromatogram for repro-
Figure 19: Chromatogram for Linearity µg/ml for Silver sulfadiazine.
Figure 20: Chromatogram for Linearity of 0.8 of 1.0 µg/ml for Silver sulfadiazine.
Figure 21: Chromatogram for Linearity of 1.2 µg/ml for Silver sulfadiazine.
Figure 22: Chromatogram for reproducibility of 0.5 µg/ml of Silver sulfadiazine (Intra Day).
Table 13: Inter-day Precision data for Silver sulfadiazine.
Sr.No. Concentration Mean peak area(n=6)
%RSD
1. 0.5µg/ml 0.01291 0.0119
2. 0.5µg/ml 0.01469 0.0116
Average 0.01380
%RSD 0.089
were found, Silver sulfadiazine which confirmed that the method was precise. The results are depicted in Table 12 and 13. Similarly, Figure 13-21 represents the chromatogram of assay of gel containing SSD-SLNs for their linearity in different concentrations.
Inter Day
Accuracy
Accuracy of silver sulfadiazine was done in triplicates by comparing the areas of spiking the pure drug of
Table 12: Intra-day Precision data for Silver sulfadiazine.
Sr.No. Concentration Mean peak area(n=6)
%RSD
1. 0.5µg/ml 0.01255 0.011
2. 0.5µg/ml 0.01291 0.0119
Average 0.01273
%RSD 0.018

Mastiholimath, et al.: Silver Sulfadiazine for Second and Third Degree Burn Wounds
42 Indian Journal of Pharmaceutical Education and Research | Vol 54 | Issue 1 | Jan-Mar, 2020
Figure 23: Chromatogram for reproducibility of 0.5µg/ml of Silver sulfadiazine (Day 1).
Figure 24: Chromatogram for reproducibility of 0.5µg/ml of Silver sulfadiazine (Day 2).
Figure 25: Chromatogram for Specificity of Silver sulfadia-zine.
Figure 27: Chromatogram for Specificity of Mobile Phase.
Figure 28: Chromatogram for Specificity of Diluent.
ducibility of 0.5µg/ml of Silver sulfadiazine (Day 1 and 2).
Specificity
Specificity was carried out by application of standards, formulation, mobile phase and diluent.The Rf value of Silver sulfadiazine was found to be 0.398. The Rf value of Silver sulfadiazine was found to be 0.396 which was similar to that of the standards further the mobile phase and diluents did not show any peaks at the Rf of the standards confirming the method is spe-cific. Figure 25 represents Chromatogram for Specific-ity of Silver sulfadiazine. Similrly, Figure 26, Figure 27 and Figure 28 represents the Chromatogram for formu-
Table 14: Data for Accuracy.Level AUC for formulation
and standard applied on different spots*
AUC for formulation
and standard applied on same spot*
% recovery
75% 0.0086144553 0.0075688 87.86
100% 0.0103674218 0.0089067 85.91
125% 0.010773473 0.0104739 97.21
Acceptance criteria: % recovery should be within the range of 85-115%.*corresponds to the average of three determents
Figure 26: Chromatogram for formulation of Silver sulfadiazine.

Mastiholimath, et al.: Silver Sulfadiazine for Second and Third Degree Burn Wounds
Indian Journal of Pharmaceutical Education and Research | Vol 54 | Issue 1 | Jan-Mar, 2020 43
lated of Silver sulfadiazine, Specificity of Mobile Phase and Specificity of Diluent respectively.
CONCLUSIONIn the present study of silver sulfadiazine solid lipid nanoparticle was successfully prepared by high shear homogenization method and it was further evaluated for its particle size, polydispersity index, shape and surface morphology, transmission electron microscopy, percentage entrapment efficiency, percentage yield, in vitro release study, method development and validation.
Formulation study
1. Melting point of silver sulfadiazine was carried out using “thiele’s tube” apparatus.
2. The IR study was carried out using combinations of drug and excipients and finally was concluded that the drug and the polymer were compatible.
3. The particle size decreased with increase in the surfactant concentration. The particle size of the formulated solid lipid nanosuspension was found to be in the range of 50-200nm with surfactant concentration as 1-2%. F4 formulation showed better particle size with 68.30nm at surfactant concentration of 2000.
4. The solid lipid nanoparticles then were subjected to SEM studies and the particle size was found to spherical in shape with polydispersity index range of F1 to F4 formulation was 0.232 to 0.642.
5. Drug entrapment efficiency was determined to be 96.98% for silver sulfadiazine for F4 formulation. It was observed that entrapment efficiency increases with increase in lipid concentration.
6. Maximum percentage yield was found to be 90.5%. 7. SSD SLN gel release was dependent upon the size
of the solid lipid nanoparticle and the concentration of the lipid. The lowest was F3 formulation (79.97) and highest was F4 formulation (88.64)
8. Antimicrobial study data gave good inhibition prop-erty for F4 formulation
Analytical Study
1. In the present study the mobile phase which was used was n-propanol: 25% ammonia in the ratio of (7:3v/v) and the chromatographic conditions were optimised.
2. Validation parameters i.e Linearity, Precision, Accu-racy, Specificity and Assay was carried out.
3. Linearity was found over a concentration range of 0.2 to 1.2µg/ ml with an equation Y= -9.727 x 10-15
x2 + 2.861 x 10⁻⁸ x + 1.044 x 10⁻³ and R value as 0.9988 for Silver sulfadiazine.
4. Intra-day and Inter-day precision was estimated to be < 5.0% for Silver sulfadiazine which confirmed that the method was precise.
5. The mean recovery for Silver sulfadiazine was found to be 90.33%. The % recovery was within the acceptance limit of 85-115% hence the method was found to be accurate.
6. The Rf value of Silver sulfadiazine from the formulation was found to be similar from that of the standards and the mobile phase and diluent didn’t show any peaks at the Rf of the standards conforming the result was specific.
It was concluded that the developed HPTLC method is simple, quick, accurate, precise, economical and specific for the qualitative and quantitative estimation of Silver sulfadiazine with good resolution and high sensi-tivity.
ACKNOWLEDGEMENTThe authors would like to sincerely thank the Principal, KLE College of Pharmacy, Belagavi, J P N Pharma Pvt. Ltd, Mumbai for providing Silver sulfadiazine API as a gift sample. And would like to thank Anchrom Enter-prises, Mumbai for carrying out HPTLC analysis of the formulation.
CONFLICT OF INTERESTThe authors declare no conflicts of interest.
ABBREVIATIONS SSD: Silver sulfadiazine; +ve: Positive; -ve: Negative; %EE: percentage Entrapment Efficiency; TEM: Trans-mission electron microscopy; SEM: Scanning electron microscopy; SLN: Solid Lipid Nanoparticles.
REFERENCES1. Saxena R, Sharma P. Antibacterial and antifungal evaluation of some
chalcogen bearing ligands, their transition and non-transition metal complexes. Indian J Pharma Biol Res. 2016;4(2):27-31.
2. Mukherjee S, Ray S, Thakur R. Solid lipid nanoparticles: A modern formulation approach in drug delivery system. Indian Journal of Pharmaceutical Sciences. 2009;71(4):349.
3. Kusam SR, Wook KK, Kyun CH. Preparation and characterization of solid lipid nanoparticles loaded with doxorubicin. Eur J Pharm Sci. 2009;37(3-4):508-13. Available from: https://www.google.com/search? q=preparation +and +characterization+of+solid+lipid+nanoparticles+ loaded+ with+ doxorubicin& oq=preparation+and+characterisation+of+solid+lipid+ &aqs=chrome.1.69i57j0l5.22451j0j8&sourceid=chrome&ie=UTF-8
4. Sandri G, et al. Wound dressings based on silver sulfadiazine solid lipid nanoparticles for tissue repairing. Eur J Pharm Biopharm. 2013;84(1):84-90. http://dx.doi.org/10.1016/j.ejpb.2012.11.022

Mastiholimath, et al.: Silver Sulfadiazine for Second and Third Degree Burn Wounds
44 Indian Journal of Pharmaceutical Education and Research | Vol 54 | Issue 1 | Jan-Mar, 2020
PICTORIAL ABSTRACT
SUMMARY
• “Silver sulfadiazine” is a sulfaderivative which is basically used for second and third degree burn wounds
• “Silver sulfadiazine” “solid lipid nanoparticle” was prepared by hot homogenisation technique. These nanoparticles were then incorporated into a gel. Four batches were prepared and labelled as F1, F2, F3, F4 by varying the concentration of surfactant and lipid accordingly.
• Preformulation studies revealed that the drug “silver sulfadiazine” along with its excipients was com-patible without any change or alteration in the chemical nature of the drug.
• “Silver sulfadiazine SLN” was characterized for its particle size, polydispersity index, scanning elec-tron microscopy, transmission electron microscopy, entrapment efficiency, percentage yield, antimi-crobial studies, in vitro drug release.
• Compatibility studies (FTIR) revealed that there was no chemical interference between the “SSD” and the surfactant.
• Practical yield was found to be highest in SSD - SLNs F4. Particle size of drug loaded “solid lipid nanoparticles” revealed that all the formulations are in nano range. Entrapment efficiency was increased with increasing in lipid concentration. Formulation F4 showed highest %EE and F1 showed lowest % yield.
• “In vitro” drug release studies showed the “solid lipid nanoparticle” had good release of drug• Antimicrobial study showed that the Formulation F4 had good inhibition property.
5. Venkataraman M, Nagarsenker M. Silver Sulfadiazine Nanosystems for Burn Therapy. AAPS Pharm Sci Tech. 2012;14(1):254-64.
6. Barkat M, Harshita, Ahmad I, Ali R, Singh S, Pottoo F, et al. Nanosuspension-Based Aloe vera Gel of Silver Sulfadiazine with Improved Wound Healing Activity. AAPS Pharm Sci Tech. 2017;18(8):3274-85.
7. Razavi S, Partoazar A, Takzaree N, Fasihi-Ramandi M, Bahador A, Darvishi M. Silver sulfadiazine nanoethogel for burn healing: Characterization and investigation of its in vivo effects. Nanomedicine. 2018;13(11):1319-31.
8. Chandra AD, Kant PD. High Performance Thin Layer Chromatography (HPTLC): A Modern Analytical tool for Biological Analysis. Sciencepub.net. 2010. Available from: http://www.sciencepub.net/nature/ns0810/09_3136ns0810_58_61.pdf
9. Srivastava MM. High-Performance Thin Layer Chromatography (HPTLC).
Springer-Verlag Berlin Heidelberg. 2011. doi.1007/978-3-642-14025-9_2
10. Yu SH, Mi FL, Wu YB, Peng CK, Shyu SS, Huang RN. Antibacterial activity of
chitosan–alginate sponges incorporating silver sulfadiazine: Effect of ladder-
loop transition of interpolyelectrolyte complex and ionic crosslinking on the
antibiotic release. Journal of Applied Polymer Science. 2005;98(2):538-49.
11. Souto EB, Wissing SA, Barbosa CM, Müller RH. Evaluation of the physical
stability of SLN and NLC before and after incorporation into hydrogel
formulations. European Journal of Pharmaceutics and Biopharmaceutics.
2004;58(1):83-90.

Mastiholimath, et al.: Silver Sulfadiazine for Second and Third Degree Burn Wounds
Indian Journal of Pharmaceutical Education and Research | Vol 54 | Issue 1 | Jan-Mar, 2020 45
Cite this article: Mastiholimath VS, Valerie CTW, Mannur VS, Dandagi PM, Gadad AP, Khanal P. Formulation and Evaluation of Solid Lipid Nanoparticle Containing Silver Sulfadiazine for Second and Third Degree Burn Wounds and its Suitable Analytical Method Development and Validation. Indian J of Pharmaceutical Education and Research. 2020;54(1):31-45.
Anand Panchakshari Gadad: is Professor and Head in Department of Pharmaceutics, KLE College of Pharmacy, Belagavi, KLE Academy of Higher Education and Research (KAHER), Belagavi-590010.
Pukar Khanal, has been awarded with two times gold medal for his academic performance; currently working as Ph.D Research Scholar at KLE Academy of Higher Education and Research, Belagavi. His area of interest covers gene set enrichment analysis of lead molecule modulated pathway identification, protein-protein network interaction, in silico molecular docking, protein modeling and utilizing Danio rerio as a preliminary animal model. Further, he interests to utilize regression models for the evaluation of PKPD profiles and data correlation with wet lab protocols.
Panchaxari Mallappa Dandagi, is Professor in Department of Pharmaceutics at KLE College of Pharmacy, Belagavi, KLE Academy of Higher Education and Research (KAHER), Belagavi-590010.
Vinod Kumar Shrishailappa Mannur, is Professor and Head in Department of Quality Assurance at KLE College of Pharmacy, Belagavi, KLE Academy of Higher Education and Research (KAHER), Belagavi-590010.
About Authors
Coutinho Tracy Whitney Valerie, is a M. Pharm second year student in Department of Quality Assurance at KLE College of Pharmacy, Belagavi, KLE Academy of Higher Education and Research (KAHER), Belagavi-590010.
Vinayak Shivamurthi Mastiholimath, is Professor in Department of Quality Assurance at KLE College of Pharmacy, Belagavi, KLE Academy of Higher Education and Research (KAHER), Belagavi-590010.


![Solid Lipid Nanoparticles: A Modern Formulation Approach ...Nanostructured lipid carriers (NLC): NLC were introduced to overcome the potential difficulties with SLNs[7-9]. The goal](https://static.fdocuments.in/doc/165x107/5ed4ad27d18c7b5d8f4ba776/solid-lipid-nanoparticles-a-modern-formulation-approach-nanostructured-lipid.jpg)