Original article Biomarkers of liver injury for hepatitis ...
15
©2010 International Medical Press 1359-6535 (print) 2040-2058 (online) 617 Antiviral Therapy 2010 15: 617–631 (doi: 10.3851/IMP1570) Background: Liver biopsy and virological end points are standard references for assessing the effect of viral hep- atitis treatments. We aimed to review evidence-based published data of biomarkers that have been validated as non-invasive alternatives to biopsy as end points for HBV and HCV infection trials. Methods: Studies were included if there were at least two repeated estimates of fibrosis per patient using biomarkers with at least two studies and a control group. Meta-analysis of the percentage of fibrosis pro- gression per year (pFPy) was performed. Results: Two biomarkers were included, FibroTest® and liver stiffness measurement (LSM; FibroScan®). A total of 1,413 patients with chronic hepatitis C (11 populations) and 772 with chronic hepatitis B (6 populations) were analysed. In a comparison of HCV patients with controls, the FibroTest® pFPy was -18% (95% confidence interval [CI] -23– -14; P<0.001) in treated patients and the LSM pFPy was -15% (95% CI -28– -1; P=0.01), both with differences according to virological responses. In HBV patients, there was a significant decrease of the pFPy only in patients with baseline advanced fibrosis (mean difference -5% [95% CI -10– -0.1]; P=0.02). In patients with advanced fibrosis, stratified by virological response, there were similar differences between pFPy estimated either using FibroTest® or biopsy, both in HCV and HBV infections. Repeated LSM in HBV patients had an early variability related to necroinflammatory activity. Conclusions: In patients with chronic hepatitis C and B, the treatment effect on fibrosis progression rate was similarly estimated using FibroTest® or biopsy. The same concordance was observed for FibroScan® but with a possible overestimation of the fibrosis regression during the first weeks of treatment. Infection with HCV or HBV is a major cause of chronic liver disease, affecting 500 million people worldwide [1–4]. The adverse effects of chronic hepa- titis C and B on the liver is mainly because of fibrosis progression, which could result in cirrhosis, liver fail- ure, hepatocellular carcinoma, liver transplantation and death [5]. The goal of therapy is to prevent complications and death from chronic viral hepatitis [2,4]. Because of the slow evolution of chronic hepatitis over sev- eral decades, it has been difficult to demonstrate that therapy prevents complications of liver disease. Accordingly, treatment responses are defined by sur- rogate biological parameters rather than by clinical end points [2,4]. Short-term outcomes can be measured biochemically (normalization of serum alanine aminotransferase [ALT] levels), virologically (absence of HCV RNA or HBV DNA from serum by a sensitive PCR-based assay) and histologically (using liver biopsy with a scoring system, that is, ≥2 points improvement in the necroinflammatory Ishak score or 1 point in the Metavir score with no worsening of fibrosis score). Histological and virological end points are accepted by health authorities as short-term outcomes and have been used for approval of new drugs both for hepatitis C [6,7] and B [8–10]. Because of the limitations of liver biopsy (mainly sampling error and risk), several non-invasive biomar- kers have recently been validated as alternatives for fibrosis staging, with diagnostic and prognostic val- ues that are similar to those of biopsy [11,12]. These biomarkers are now widely used in countries where they are available [13]. Original article Biomarkers of liver injury for hepatitis clinical trials: a meta-analysis of longitudinal studies Thierry Poynard 1,2 *, Yen Ngo 2 , Mona Munteanu 2 , Dominique Thabut 1 , Julien Massard 1 , Joseph Moussalli 1 , Anne Varaud 1 , Yves Benhamou 1 , Vlad Ratziu 1 1 Service d’Hépato-Gastroentérologie, Groupe Hospitalier Pitié-Salpêtrière AP-HP, University Pierre and Marie Curie Liver Center, Paris, France 2 Biopredictive, Paris, France *Corresponding author e-mail: [email protected] Introduction
Transcript of Original article Biomarkers of liver injury for hepatitis ...
©2010 International Medical Press 1359-6535 (print) 2040-2058 (online) 617
Antiviral Therapy 2010 15:617–631 (doi: 10.3851/IMP1570)
Background: Liver biopsy and virological end points are standard references for assessing the effect of viral hep-atitis treatments. We aimed to review evidence-based published data of biomarkers that have been validated as non-invasive alternatives to biopsy as end points for HBV and HCV infection trials.Methods: Studies were included if there were at least two repeated estimates of fibrosis per patient using biomarkers with at least two studies and a control group. Meta-analysis of the percentage of fibrosis pro-gression per year (pFPy) was performed.Results: Two biomarkers were included, FibroTest® and liver stiffness measurement (LSM; FibroScan®). A total of 1,413 patients with chronic hepatitis C (11 populations) and 772 with chronic hepatitis B (6 populations) were analysed. In a comparison of HCV patients with controls, the FibroTest® pFPy was -18% (95% confidence interval
[CI] -23– -14; P<0.001) in treated patients and the LSM pFPy was -15% (95% CI -28– -1; P=0.01), both with differences according to virological responses. In HBV patients, there was a significant decrease of the pFPy only in patients with baseline advanced fibrosis (mean difference -5% [95% CI -10– -0.1]; P=0.02). In patients with advanced fibrosis, stratified by virological response, there were similar differences between pFPy estimated either using FibroTest® or biopsy, both in HCV and HBV infections. Repeated LSM in HBV patients had an early variability related to necroinflammatory activity.Conclusions: In patients with chronic hepatitis C and B, the treatment effect on fibrosis progression rate was similarly estimated using FibroTest® or biopsy. The same concordance was observed for FibroScan® but with a possible overestimation of the fibrosis regression during the first weeks of treatment.
Infection with HCV or HBV is a major cause of chronic liver disease, affecting 500 million people worldwide [1–4]. The adverse effects of chronic hepa-titis C and B on the liver is mainly because of fibrosis progression, which could result in cirrhosis, liver fail-ure, hepatocellular carcinoma, liver transplantation and death [5].
The goal of therapy is to prevent complications and death from chronic viral hepatitis [2,4]. Because of the slow evolution of chronic hepatitis over sev-eral decades, it has been difficult to demonstrate that therapy prevents complications of liver disease. Accordingly, treatment responses are defined by sur-rogate biological parameters rather than by clinical end points [2,4].
Short-term outcomes can be measured biochemically (normalization of serum alanine aminotransferase
[ALT] levels), virologically (absence of HCV RNA or HBV DNA from serum by a sensitive PCR-based assay) and histologically (using liver biopsy with a scoring system, that is, ≥2 points improvement in the necroinflammatory Ishak score or 1 point in the Metavir score with no worsening of fibrosis score). Histological and virological end points are accepted by health authorities as short-term outcomes and have been used for approval of new drugs both for hepatitis C [6,7] and B [8–10].
Because of the limitations of liver biopsy (mainly sampling error and risk), several non-invasive biomar-kers have recently been validated as alternatives for fibrosis staging, with diagnostic and prognostic val-ues that are similar to those of biopsy [11,12]. These biomarkers are now widely used in countries where they are available [13].
Original article
Biomarkers of liver injury for hepatitis clinical trials: a meta-analysis of longitudinal studies
Thierry Poynard1,2*, Yen Ngo2, Mona Munteanu2, Dominique Thabut1, Julien Massard1, Joseph Moussalli1, Anne Varaud1, Yves Benhamou1, Vlad Ratziu1
1Service d’Hépato-Gastroentérologie, Groupe Hospitalier Pitié-Salpêtrière AP-HP, University Pierre and Marie Curie Liver Center, Paris, France2Biopredictive, Paris, France
*Corresponding author e-mail: [email protected]
Introduction
AVT-09-RV-1390_Poynard.indd 617 25/6/10 11:17:44

©2010 International Medical Press618
T Poynard et al.
Very few guidelines have thus far introduced these non-invasive biomarkers as alternatives to biopsy, as end points for clinical trials or as part of routine treatment [14]. In 2006 in France, FibroTest® and FibroScan® were validated and recommended by the health authorities as first-line diagnostic procedures for fibrosis or cirrhosis in adults with chronic hepati-tis C without previous treatment [15,16]. The Euro-pean Medicines Agency has introduced the possibility of using biomarkers in the guidelines ‘On the clinical evaluation of direct acting antiviral agents intended for treatment of chronic hepatitis C’ [17], only for the following inclusion criteria: the main role of a histol-ogy assessment is to exclude patients with advanced fibrosis and to enable stratification by degree of fibrosis. For this purpose a liver biopsy of adequate quality within 12 months prior to study entry may be employed. If non-invasive methods are used as an alternative to liver biopsy this should be justified by the applicant [17].
The aim of this study was to review the evidence-based published data of these biomarkers as alternatives to liver biopsy in HBV and HCV trials.
Methods
Inclusion and exclusion criteriaStudies were included if they fulfilled the following criteria: assessment of a fibrosis biomarker previously validated versus biopsy, at least two published stud-ies, paired assessment before and after treatment and at least one control population with paired assess-ment in the absence of antiviral treatment.
Search strategyThe literature was reviewed using Medline with the following tags: ‘paired liver biomarkers’, ‘biomark-ers liver injury HBV’, ‘biomarkers liver injury HCV’, ‘liver fibrosis biomarkers HCV’, ‘liver fibrosis biomar-kers HBV’, ‘liver trials stiffness’ and ‘liver trials fibro-sis biomarkers’. References of previously published reviews, meta-analyses and guidelines were also used [11,12,14–16,18–26].
Fibrosis progression estimatesTo standardize the fibrosis progression estimates between biomarkers, the criterion used was the percentage of fibrosis progression per year (pFPy). The definition of pFPy was the ratio of the difference between the second and the first assessment divided by the first assessment, standardized for 1 year between two assessments. For example, for a patient with a first FibroTest® of 0.60 and a second Fibro-Test® of 0.30 2 years later, the pFPy was (0.30-0.60= -0.30)/0.60=-0.50 for 2 years, that is, -25% per year.
Similarly, in FibroScan® trials, for a patient with a first liver stiffness measurement (LSM) of 12 kPa and a second measurement 2 years later of 6 kPa, the pFPy was equal to ([6–12]/12)/2=-25%.
The overall effect of treatment on biomarkers was assessed using a meta-analysis of the difference between the pFPy in treated versus control patients. To demonstrate the accuracy of the biomarkers, the effect on these biomarkers was assessed separately in patients with and without virological response. A few studies in patients with chronic hepatitis C did not provide details between relapsers and non-respond-ers; therefore, the main analysis focused on sustained virological responders (SVR) versus non- responders after exclusion of relapsers. A sensitivity analysis was also performed after inclusion of relapsers. When no control group was available in a study, the mean pFPy of the larger biomarker control group was used.
Because patients were seen decades after the infection, baseline fibrosis stage has been demonstrated as the major predictive factor of fibrosis progression both in chronic hepatitis C and B [11,12,14,24,27]. When avail-able, the pFPy was calculated separately in patients with and without baseline advanced fibrosis. Advanced fibro-sis was defined as bridging fibrosis or cirrhosis (Metavir fibrosis score of ≥2).
We also assessed the transition rate between stages defined as fibrosis stages using Metavir scoring system and the previously defined cutoffs for FibroTest® and LSM. If FibroTest®–ActiTest® or LSM were to be used as end points in clinical trials, the following change would be considered as a response: 0.20 for Fibro-Test® (equivalent to one Metavir stage) or 0.25 for ActiTest® (equivalent to one Metavir grade). LSM dis-tribution according to fibrosis stage is less continuous than FibroTest® with no clear cutoff between F0 and F1 and an exponential increase among F4 between 20 and 75 kPa; between 5 and 25 kPa, a 20% change could be considered as a response and 4 kPa could be equivalent to one Metavir stage.
Sensitivity analysesFor HBV studies, we used another ‘response’ definition to take into account the specificity of each drug. For lamivudine, which is more powerful than adefovir but has mutations at 2 years, we defined response as the absence of mutations; for adefovir, which has a less rapid effectiveness on viral load but induces less muta-tions at 1 year, we defined response as a decrease of 3 log10 IU/ml versus baseline viral load.
Because of the risk of bias from populations without control groups, a sensitivity analysis was performed using only studies with their own controls. In patients with HBV, the disease spectrum was heterogeneous, as patients could include those with spontaneous
AVT-09-RV-1390_Poynard.indd 618 25/6/10 11:17:44

Biomarkers for hepatitis trials
Antiviral Therapy 15.4 619
clearance of HBV surface antigen. A sensitivity anal-ysis was performed after exclusion of controls with spontaneous improvement.
Virological response was defined in HCV patients using the standard definition of responders (sustained virological response, a negative HCV RNA status by PCR at the end of the treatment and after the end of follow-up, non-response and relapse, if available). In patients with chronic hepatitis B, virological response was defined as the absence of detectable HBV DNA at the end of the follow-up.
Meta-analysisTo compare the use of biomarkers as alternatives to biopsy as end points in trials assessing the anti-fibrotic effect of treatment, the pFPy estimated using biomar-kers was compared using a meta-analysis, with the hypothesis of a null difference in patients with baseline advanced fibrosis who had both paired estimates.
Necroinflammatory activity grade has been observed to be a factor of variability associated with LSM measurements. To estimate the specificity of a given fibrosis biomarker independent of activity
Figure 1. Identification and inclusion of longitudinal studies
PubMed tags: 1,037 publications (18 August 2009)Liver biomarkers paired (125), liver trials stiffness (14), liver trials fibrosis biomarkers (24)
HCV liver injury biomarkers (90), HCV liver fibrosis biomarkers (474)HBV liver injury biomarkers (46), HBV liver fibrosis biomarkers (244)
727 HCV publications 453 HBV publications
718 Not included,not paired,
no controls oracute hepatitis
449 Not included,not paired,
no controls oracute hepatitis
8 Publications included 4 Publications included
11 Populations3 Not treated
8 Treated
6 Populations3 Not treated
3 Treated
6 FibroTest® only3 FibroScan® only
2 FibroTest® and FibroScan®
3 FibroTest®
3 FibroScan®
AVT-09-RV-1390_Poynard.indd 619 25/6/10 11:17:45

T Poynard et al.
©2010 International Medical Press620
grade, the effect of a successful antiviral treatment on a validated biomarker of necroinflammatory grade was compared with the effect on a fibrosis biomar-ker according to serial measurements. The population included patients with advanced baseline fibrosis, virological response and available repeated biomar-kers during treatment. The absence of concordance between repeated simultaneous grade and stage esti-mates was considered a marker of specificity for the fibrosis biomarker.
Data used in modelling were individual data when available, or those extracted from publications using means and standard deviations. When these data were not present or were unclear, the authors were contacted.
Statistical analysesThe pFPy were expressed as means and standard deviations and compared using Student’s t-test, Mann– Whitney U test and meta-analyses. Meta-analysis used a random effect model with Cochran’s Q heterogeneity
Paired Patient Time between Patients with pairedStudy Biomarker Randomized biopsy (n) treatment status Treatment samples (years) biomarkers (n) Reference
HCV – – – – – – 1,413 Control – – – – – – 336
Ngo et al., FibroTest® No No Naive No 260 weeks 13 [29]2006 (5)Vergniol et al., FibroTest®, No No Naive No 48 weeks 304 [30]2009 FibroScan® (0.92)Ogawa et al., FibroScan® No No Naive No 96 weeks 19 [31]2009 (1.84)
Treated – – – – – 1,077 Poynard et al., FibroTest® Yes Yes (134) Naive IFN high dose 72 weeks 134 [32]2002 versus standard (1.38)Poynard et al., FibroTest® Yes Yes (352) Naive PEG-IFN/ribavirin 72 weeks 352 [33]2003 versus standard (1.38)d’Arondel et al., FibroTest® No No Naive PEG-IFN/ribavirin 60 weeks 96 [34]2006 (1.2)Ngo et al., FibroTest® No No Naive PEG-IFN/ribavirin 5 years 59 [29]2006 (5)Patel et al., FibroTest® Yes No Naive Alb-interferon/ 72 weeks 84 [35]2009 ribavirin (1.38)Halfon et al., FibroTest® No Yes (114) Naive, HIV PEG-IFN/ribavirin 72 weeks 114 [36]2009 infection versus standard (1.38)Vergniol et al., FibroTest®, No No Naive PEG-IFN/ribavirin 72 weeks 112 [30]2009 FibroScan® (1.38)Ogawa et al., FibroScan® No No Naive PEG-IFN/ribavirin 96 weeks 126 [31]2009 (1.84)
HBV – – – – – – 772 Control – – – – – – 195
Poynard et al., FibroTest® Yes Yes (152) Active Placebo 48 weeks 152 [38]2009 (0.92)Oliveri et al., FibroScan® No No Inactive carrier No 19.9 months 30 [40]2008 (1.67)Oliveri et al., FibroScan® No No Naive, ALT flare No 19.9 months 13 [40]2008 (1.67)
Treated – – – – – – 577 Poynard et al., FibroTest® No No Active Lamivudine 24 months 258 [39]2005 (2)Poynard et al., FibroTest® Yes Yes (288) Active Adefovir 48 weeks 288 [38]2009 (0.92)Oliveri et al., FibroScan® No No Active Miscellaneous 19.9 months 31 [40]2008 treatments (1.67)
Table 1. Characteristics of included populations and studies with paired fibrosis biomarkers in chronic hepatitis C
Alb, albumin; ALT, alanine aminotransferase; PEG-IFN, pegylated interferon.
AVT-09-RV-1390_Poynard.indd 620 25/6/10 11:17:45

Biomarkers for hepatitis trials
Antiviral Therapy 15.4 621
Table 2. Effect of HCV treatment on repeated FibroTest® and FibroScan® according to virological response
Values are presented as mean (±sd) unless otherwise indicated. aExpressed as FibroTest® units (range 0.00–1.00). bNo details available between relapsers or non-responders. cPatients with detectable HCV RNA at 12 weeks were considered non-responders and not treated for 48 weeks.
Virological responseStudy Characteristic Responder Relapser Non-responder Control Reference
FibroTest® Poynard et al., 2002 Patients, n 17 56 92 0 [32] Baselinea 0.33 (0.25) 0.36 (0.23) 0.41 (0.29) – End of follow-upa 0.18 (0.25) 0.32 (0.23) 0.44 (0.29) – Differencea -0.15 (0.13) -0.04 0.03 – Difference, % -45 (0.26) -11 (0.24) 7 (0.30) – Percentage per year -33 (0.19) -8 (0.17) 5 (0.22) – Poynard et al., 2003 Patients, n 184 42 126 0 [33] Baselinea 0.39 (0.25) 0.49 (0.21) 0.59 (0.24) – End of follow-upa 0.28 (0.20) 0.45 (0.17) 0.55 (0.24) – Differencea -0.11 (0.13) -0.04 (0.15) -0.04 (0.13) – Difference, % -26 (0.28) -5 (0.45) -6 (0.32) – Percentage per year -19 (0.20) -4 (0.32) -4 (0.23) – d’Arondel et al., 2006 Patients, n 70 7 19 0 [34] Baselinea 0.36 (0.24) 0.48 (0.50) 0.41 (0.30) – End of follow-upa 0.31 (0.24) 0.42 (0.52) 0.41 (0.30) – Differencea -0.05 (0.25) -0.06 (0.51) 0.00 (0.30) – Difference, % -14 (0.25) -13 (0.51) 0 – Percentage per year -12 (0.21) -11 (0.43) 0 – Ngo et al., 2006 Patients, n 23 – 36bc 13 [29] Baselinea 0.76 (0.10) – 0.76 (0.12) 0.80 (0.10) End of follow-upa 0.60 (0.28) – 0.73 (0.18) 0.77 (0.13) Differencea -0.16 (0.05) – -0.03 (0.06) -0.03 Difference, % -21 (2.6) – -4 (3.0) -4 (2.1) Percentage per year -4 (0.02) – -0.8 (0.02)2 -0.8 Patel et al., 2009 Patients, n 47 – 48bc 0 [35] Baselinea 0.33 (0.24) – 0.54 (0.20) – End of follow-upa 0.26 (0.24) – 0.56 (0.20) – Differencea -0.07 (0.12) – 0.02 (0.10) – Difference, % -20 (0.24) – 2.9 (0.20) – Percentage per year -14 (0.17) – 2 (0.14) – Halfon et al., 2009 Patients, n 29 – 85bc 0 [36] Baselinea 0.49 (0.27) – 0.59 (0.28) – End of follow-upa 0.38 (0.25) – 0.59 (0.28) – Differencea -0.11 (0.13) – 0 (0.14) – Difference, % -22 (0.27) – 0 (0.28) – Percentage per year -16 (0.20) – 0 (0.20) – Vergniol et al., 2009 Patients, n 70 15 27 304 [30] Baselinea 0.49 (0.27) 0.47 (0.25) 0.53 (0.28) 0.30 (0.23) End of follow-upa 0.40 (0.25) 0.46 (0.24) 0.56 (0.26) 0.33 (0.26) Differencea -0.09 (0.13) -0.01 (0.12) 0.03 (0.13) 0.03 (0.13) Difference, % -18 (0.27) -2 (0.25) 6 (0.28) 10 (0.23) Percentage per year -13 (0.20) -2 (0.18) 7 (0.20) 11 (0.17) FibroScan® Vergniol et al., 2009 Patients, n 70 15 27 304 [30] Baseline, kPa 10.7 (9.6) 12.2 (7.8) 9.6 (7.2) 6.6 (5.0) End of follow-up, kPa 7.3 (8.4) 9.1 (6.6) 9.0 (8.1) 6.8 (5.0) Difference, kPa -3.4 (5.0) -3.1 (3.9) -0.6 (3.6) 0.2 (2.5) Difference, % -32 (9.6) -25 (7.8) -6 (7.2) 3 (5.0) Percentage per year -23 (7.0) -18 (5.7) -4 (5.2) 2 (3.6) Ogawa et al., 2009 Patients, n 57 – 69 19 [31] Baseline, kPa 10.3 (4.8) – 10.0 (5.5) 7.6 (3.9) End of follow-up, kPa 5.4 (4.8) – 11.4 (5.5) 10.6 (3.9) Difference, kPa -4.9 (2.4) – 1.4 (2.7) 3 (1.9) Difference, % -48 (4.8) – 14 (5.5) 39 (3.9) Percentage per year -26 (2.6) – 8 (3.0) 21 (2.1)
AVT-09-RV-1390_Poynard.indd 621 25/6/10 11:17:45

T Poynard et al.
©2010 International Medical Press622
NRd’Arondel et al., 2006
Poynard et al., 2003Poynard et al., 2002
Poynard et al., 2009 NR
AF
Poynard et al., 2005 NR
Poynard et al., 2005 R
Poynard et al., 2009 R
Ave
NAF
Poynard et al., 2005 NR
Poynard et al., 2009 NR
Poynard et al., 2009 R
Poynard et al., 2005 R
Ave
Total
Vergniol et al., 2009Ave
SVR
d’Arondel et al., 2006
Patel et al., 2009Ngo et al., 2006Halfon et al., 2009
Poynard et al., 2002Poynard et al., 2003Vergniol et al., 2009
Poynard et al., 2005
Poynard et al., 2009
Ave
Ave
Total
-60.0
-25.00 -15.00 -5.00 5.00 15.00 -60.00 -40.00 -20.00Mean difference
0.00 20.00
-40.0Mean difference
Mean difference
-20.0 0.00 20.0
Stu
dy
Stu
dy
Stu
dy
NR
Vergniol et al., 2009
Ogawa et al., 2009
Ave
RE
Vergniol et al., 2009
Ave
SVR
Ogawa et al., 2009
Vergniol et al., 2009
Ave
Total
-80.0 -60.0 -40.0
Mean difference
-20.0 0.0 20.0
Stu
dy
A B
DC
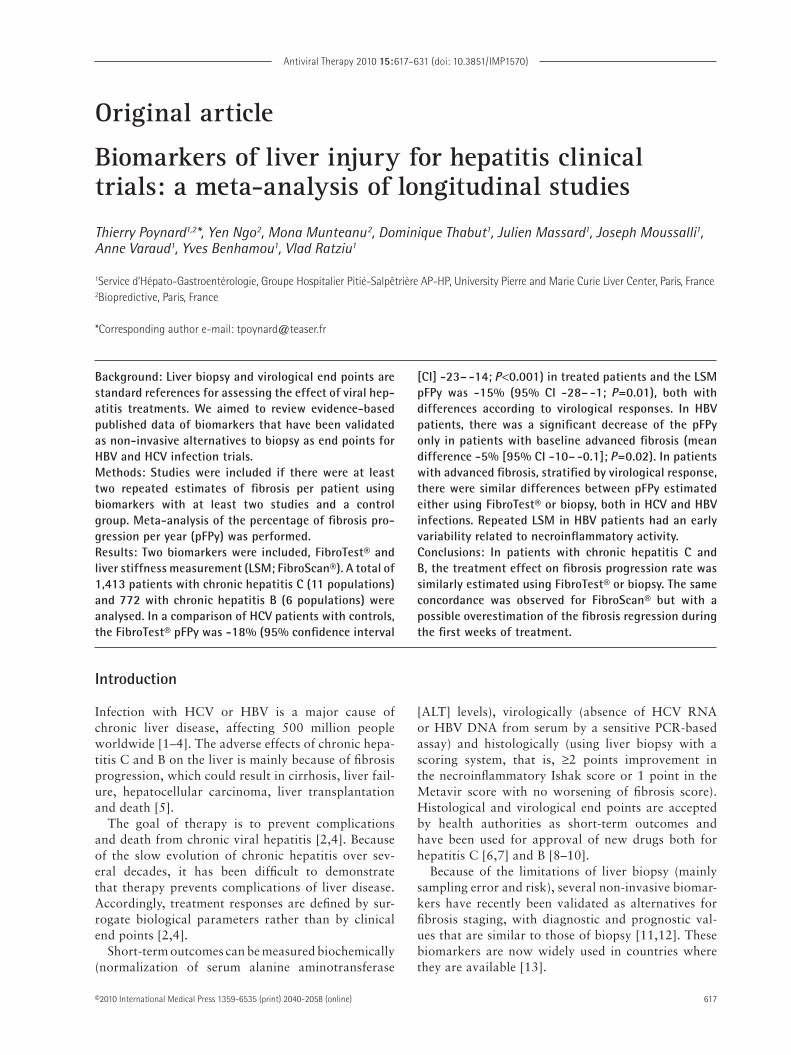
Figure 2. Treatment effect on fibrosis progression rate per year as estimated by repeated FibroTest® or FibroScan® in HCV and HBV trials
Data from [29–36,38,39]. The horizontal lines indicate the 95% confidence interval for the mean difference between treated and non-treated patients. The vertical lines indicate the equivalence line (0% difference). Negative differences indicate regression of fibrosis and are plotted at the left of the vertical line. When the horizontal line crosses the vertical line, there is no significant difference. Panels represent (A) FibroTest® progression rate percentage in HCV trials, (B) meta-analysis of FibroScan® in HCV trials, (C) FibroTest® progression rate percentages in HBV trials and (D) FibroTest® progression rate percentage in HBV trials, stratified by baseline fibrosis stage. AF, advanced fibrosis at baseline; Ave, average mean for the combined group of studies; NAF, non-advanced fibrosis at baseline; NR, non-responders; R, responders; RE, relapsers; SVR, sustained virological responders.
AVT-09-RV-1390_Poynard.indd 622 25/6/10 11:17:46

Biomarkers for hepatitis trials
Antiviral Therapy 15.4 623
test (Q) and Number Cruncher Statistical Systems statistical software (Kaysville, UT, USA) [28].
Results
Characteristics of studies and patients includedFrom a total of 1,037 publications, two biomarkers satisfied the inclusion criteria: FibroTest® and LSM (FibroScan®; Figure 1).
A total of 1,413 patients with chronic hepati-tis C (11 populations in 8 published studies) were analysed [29–36]. The main characteristics are given in Table 1. FibroTest® was analysed in nine popula-tions and FibroScan® in four; in two populations, one treated and one control, both biomarkers were assessed simultaneously [30].
A total of 772 patients with chronic hepatitis B (six populations in four published studies) were ana-lysed [36–39]. The main characteristics are given in Table 1. FibroTest® and FibroScan® were each ana-lysed in three populations.
Effect of HCV treatment on fibrosis biomarkers according to virological responseThe effect of HCV treatment on biomarkers accord-ing to virological response is detailed per population study in Table 2 and Figure 2A for FibroTest® and in Figure 2B for FibroScan®. Three studies included control groups with a total of 336 patients. The meta-analysis could not be stratified according to baseline fibrosis stage as no details were given for the main control group [30].
Table 4. Effect of HBV treatment on repeated FibroTest®, stratified per treatment, baseline advanced fibrosis and virological response
Treated advanced fibrosis Placebo advanced fibrosisStudy Characteristic Response Non-response Response Non-response Reference
FibroTest®Poynard et al., Patients, n 63 60 0 66 [38]2009 Baselinea 0.71 (0.12) 0.65 (0.11) – 0.67 (0.14) End of follow-upa 0.60 (0.17) 0.57 (0.21) – 0.60 (0.19) Differencea -0.11 (0.14) -0.08 (0.19) – -0.07 (0.15) Difference, % -15 (0.22) -13 (0.30) – -11 (0.23) Percentage per year -16 (0.22) -13 (0.31) – -12 (0.23) Poynard et al., Patients, n 45 46 0 0 [39]2005 Baselinea 0.71(0.15) 0.74 (0.13) – – End of follow-upa 0.50 (0.21) 0.54 (0.21) – – Differencea -0.21 (0.09) -0.20 (0.05) – – Difference, % -32 (0.18) -26 (0.10) – – Percentage per year -16 (0.09) -13 (0.05) – –
Values presented are mean (±sd) unless otherwise indicated. aExpressed as FibroTest® units (range 0.00–1.00).
Table 3. Effect of HBV treatment on repeated FibroTest®, stratified per treatment and baseline advanced fibrosis
Treated Controls Advanced Non-advanced Advanced Non-advanced Study Characteristic All fibrosis fibrosis All fibrosis fibrosis Reference
FibroTest®Poynard et al., Patients, n 189 97 92 0 0 0 [39]2005 Baselinea 0.51 (0.30) 0.73 (0.20) 0.26 (0.20) – – – End of follow-upa 0.37 (0.30) 0.52 (0.20) 0.21 (0.20) – – – Differencea -0.14 (0.15) -0.21 (0.10) -0.05 (0.20) – – – Difference, % -27 (0.30) -29 (0.20) -19 (0.20) – – – Percentage per year -14 (0.15) -15 (0.10) -10 (0.20) – – – Poynard et al., Patients, n 280 123 157 150 66 84 [38]2009 Baselinea 0.45 (0.24) 0.68 (0.12) 0.27 (0.11) 0.45 (0.24) 0.67 (0.14) 0.27 (0.11) End of follow-upa 0.40 (0.23) 0.59 (0.19) 0.26 (0.14) 0.42 (0.23) 0.60 (0.19) 0.28 (0.15) Differencea -0.05 (0.63) -0.10 (0.17) -0.01 (0.12) -0.02 (0.13) -0.07 (0.15) 0.01 (0.05) Difference, % -9.3 (0.63) -14 (0.26) -5 (0.80) -6.2 (0.77) -11 (0.23) 2 (0.90) Percentage per year -9.4 (0.65) -14 (0.27) -5.3 (0.80) -5.6 (0.81) -12 (0.17) 2 (0.90)
Values presented are mean (±sd) unless otherwise indicated. aExpressed as FibroTest® units (range 0.00–1.00).
AVT-09-RV-1390_Poynard.indd 623 25/6/10 11:17:46

T Poynard et al.
©2010 International Medical Press624
The meta-analysis of the treatment effect versus control assessed with FibroTest® is given in Figure 2A. In compari-son with controls, the mean pFPy was -18% (95% confi-dence interval [CI] -23– -14; P<0.001) in treated patients. There was a lower progression rate in SVR (-27% [95% CI -32– -22]) versus non-responders (-10% [95% CI -13– -7]; P=0.01]). Significant differences were also observed ver-sus relapsers (Additional file 1). All these FibroTest® pro-gression rates in treated patients were significantly lower than in control groups. In the sensitivity analysis, when only populations with their own controls were included [29,30], the results were similar for the mean decrease in pFPy: -21% (95% CI -30– -11; P<0.001) for SVR and -9% (95% CI -16– -1; P=0.02) for non-responders.
The meta-analysis of the treatment effect versus con-trol assessed with FibroScan® is given in Figure 2B. The mean progression rate was reduced by 15% (95% CI -28– -1) in comparison with controls (P=0.01). There was a lower progression rate in SVRs (-26% [95% CI -29– -23]) versus non-responders (0% [95% CI -12–12]; P=0.01). The two populations had their own controls.
Effect of HBV treatment on fibrosis biomarkers according to virological responseThe effect of HBV treatment on biomarkers according to baseline fibrosis stage and to virological response is detailed per population study in Tables 3, 4 and 5. Similar results were observed when non-response was
defined according to 3 log10 IU/ml viral load decrease versus baseline or absence of lamivudine mutation (Additional File 2). No meta-analysis was possible for FibroScan® as there were no control patients with active chronic hepatitis B. The non-treated patients were inac-tive carriers or patients with flares [40].
The meta-analysis of HBV treatment effect versus control assessed with FibroTest® is given in Figure 2C. In comparison with controls, the mean progression rate per year in treated patients was -6% (95% CI -16–3; P=0.33; without heterogeneity P=0.62).
The meta-analysis could be stratified according to baseline fibrosis score and virological response in all the studies. There was a significant decrease of the pFPy only in patients with baseline advanced fibrosis (mean difference -5% [95% CI -10– -0.1]; P=0.02; without heterogeneity Q=1.7 P=0.64; Figure 2D).
When only populations with their own controls were included [38], the results were similar to the overall population, with a significant decrease in the pFPy in patients with advanced baseline fibrosis, -19% (95% CI -30– -11; P<0.001) for responders and -9% for non-responders (95% CI -16– -1; P=0.02).
Concordance between fibrosis index and fibrosis stage variationsThere was significant concordance between FibroTest® and histological fibrosis stage variations in all included
Table 5. Effect of HBV treatment on repeated FibroTest® and FibroScan®, stratified per treatment, baseline advanced fibrosis and virological response
Treated non-advanced fibrosis Placebo non-advanced fibrosis Study Characteristic Response Non-response Response Non-response Reference
FibroTest®Poynard et al., Patients, n 61 96 0 84 [38]2009 Baselinea 0.28 (0.12) 0.26 (0.10) – 0.27 (0.11) End of follow-upa 0.27 (0.16) 0.25 (0.13) – 0.28 (0.15) Differencea -0.01 (0.15) -0.01 (0.11) – 0.01 (0.11) Difference, % -7 (0.90) -4 (0.64) – 2 (0.80) Percentage per year -4 (0.12) -4 (0.65) – 2 (0.80) Poynard et al., Patients, n 37 52 0 0 [39]2005 Baselinea 0.27 (0.13) 0.27 (0.12) – – End of follow-upa 0.22 (0.17) 0.20 (0.21) – – Differencea -0.05 (0.08) -0.07 (0.10) – – Difference, % -8 (0.16) -25 (0.21) – – Percentage per year -4 (0.08) -13 (0.10) – – FibroScan® Oliveri et al., Patients, n 31 0 0 13 [40]2008 Baseline, kPa 13.4 (9.7) – – 8.9 (8) End of follow-up, kPa 12.7 (9.7) – – 18.7 (8) Difference, kPa -0.7 (0.2) – – 9.8 (8) Difference, % -5 (5) – – 210 (50) Percentage per year -5 (5) – – 126 (25)
Values presented are mean (±sd) unless otherwise indicated. aExpressed as FibroTest® units (range 0.00–1.00).
AVT-09-RV-1390_Poynard.indd 624 25/6/10 11:17:46

Biomarkers for hepatitis trials
Antiviral Therapy 15.4 625
Table 6. Concordance between fibrosis scores as estimated using repeated FibroTest® and biopsy
Values presented are mean (±sd) unless otherwise indicated. aExpressed as FibroTest® units (range 0.00–1.00) unless otherwise indicated. bFibrosis scoring system was Knodell for Poynard et al., 2002 [32] and Metavir for the other trials.
Virological response Responder Non-responder without relapserStudy Characteristic FibroTest®a Biopsyb FibroTest®a Biopsyb Reference
HCV Poynard , et al. Patients, n 14 14 74 74 [32]2002 Baseline 0.30 (0.21) 0.86 (0.77) 0.41 (0.25) 1.62 (1.20) End of follow-up 0.18 (0.15) 0.64 (0.84) 0.44 (0.26) 1.71 (1.31) Difference -0.12 (0.14) -0.21 (0.89) 0.09 (0.12) 0.09 (0.97) Difference, % -14 (0.83) -17 (0.89) 16 (0.51) 9 (0.84) Percentage per year -10 (0.60) -18 (0.56) 12 (0.37) 7 (0.61) Improved/stable/ 5/9/0 (36/64/0) 4/9/1 (29/64/7) 13/53/8 (18/72/11) 4/63/7 (5/85/10) worsened, % Poynard et al., Patients, n 181 181 124 124 [33]2003 Baseline 0.56 (0.24) 1.55 (0.90) 0.72 (0.21) 1.82 (1.05) End of follow-up 0.44 (0.23) 1.24 (0.78) 0.69 (0.21) 1.81 (1.06) Difference -0.12 (0.12) -0.31 (0.87) -0.03 (0.11) -0.02 (0.91) Difference, % -35 (0.43) -10 (0.53) -7 (0.35) 0 (0.62) Percentage per year -25 (0.32) -14 (0.39) -7 (0.39) 0 (0.45) Improved/stable/ 40/141/0 (22/78/0) 58/106/17 (32/59/9) 10/111/3 (8/90/2) 29/66/29 (24/52/24) worsened, % HCV advanced fibrosis Poynard et al., Patients, n 6 6 43 43 [32]2002 Baseline 0.56 (0.08) 1 (0) 0.44 (0.18) 2.82 (0.60) End of follow-up 0.29 (0.13) 0.67 (0.58) 0.48 (0.15) 2.73 (0.90) Difference -0.27 (0.14) -0.21 (0.89) 0.02 (0.17) -0.09 (0.70) Difference, % -48 (0.25) -33 (0.77) 3 (0.27) 15 (0.88) Percentage per year -35 (0.40) -24 (0.56) 2 (0.20) 11 (0.63) Improved/stable/ 4/2/0 (67/33/0) 1/5/0 (17/83/0) 4/36/3 (9/84/7) 6/32/5 (14/74/12) worsened, % Poynard et al., Patients, n 107 107 105 105 [33]2003 Baseline 0.74 (0.14) 1.78 (0.98) 0.81 (0.13) 1.90 (1.04) End of follow-up 0.58 (0.17) 1.41 (0.86) 0.78 (0.15) 1.91 (1.09) Difference -0.16 (0.13) -0.36 (1.06) -0.04 (0.10) 0.01 (0.97) Difference, % -30 (0.27) -20 (0.53) -13 (0.64) 0 (0.60) Percentage per year -22 (0.20) -15 (0.46) -6 (0.63) 0 (0.43) Improved/stable/ 37/70/0 (35/65/0) 41/50/16 (38/47/15) 10/95/0 (10/90/0) 25/53/27 (24/50/26) worsened, % HBV advanced fibrosis Poynard et al., Patients, n 63 63 60 60 [38]2009; treated Baseline 0.71 (0.12) 2.03 (1.09) 0.65 (0.11) 1.88 (1.06) End of follow-up 0.60 (0.17) 1.67 (1.08) 0.57 (0.21) 1.77 (1.03) Difference -0.11 (0.14) -0.36 (0.68) -0.12 (0.15) -0.12 (0.68) Difference, % -15 (0.22) -15 (0.27) -13 (0.30) 0 (0.43) Percentage per year -16 (0.22) -16 (0.28) -13 (0.31) 0 (0.41) Improved/stable/ 16/46/1 (25/73/2) 21/40/2 (33/64/3) 13/44/3 (22/73/5) 13/40/7 (22/67/11) worsened, % Poynard et al., Patients, n 0 0 66 66 [38]2009; not treated Baseline – – 0.67 (0.14) 2.20 (1.18) End of follow-up – – 0.60 (0.19) 2.23 (0.20) Difference – – -0.07 (0.15) 0.03 (0.66) Difference, % – – -11 (0.23) 0 (0.40) Percentage per year – – -12 (0.23) 0 (0.43) Improved/stable/ – – 12/52/2 (18/79/3) 6/50/10 (9/76/15) worsened, %
AVT-09-RV-1390_Poynard.indd 625 25/6/10 11:17:46
T Poynard et al.
©2010 International Medical Press626
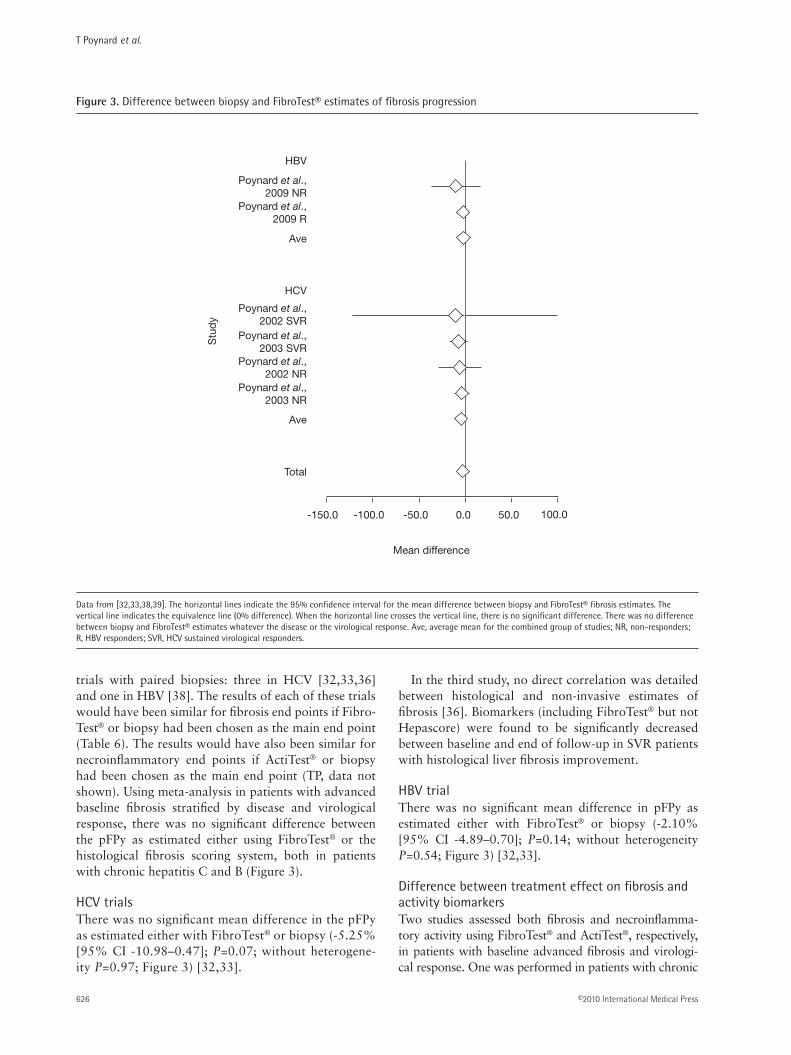
trials with paired biopsies: three in HCV [32,33,36] and one in HBV [38]. The results of each of these trials would have been similar for fibrosis end points if Fibro-Test® or biopsy had been chosen as the main end point (Table 6). The results would have also been similar for necroinflammatory end points if ActiTest® or biopsy had been chosen as the main end point (TP, data not shown). Using meta-analysis in patients with advanced baseline fibrosis stratified by disease and virological response, there was no significant difference between the pFPy as estimated either using FibroTest® or the histological fibrosis scoring system, both in patients with chronic hepatitis C and B (Figure 3).
HCV trialsThere was no significant mean difference in the pFPy as estimated either with FibroTest® or biopsy (-5.25% [95% CI -10.98–0.47]; P=0.07; without heterogene-ity P=0.97; Figure 3) [32,33].
In the third study, no direct correlation was detailed between histological and non-invasive estimates of fibrosis [36]. Biomarkers (including FibroTest® but not Hepascore) were found to be significantly decreased between baseline and end of follow-up in SVR patients with histological liver fibrosis improvement.
HBV trialThere was no significant mean difference in pFPy as estimated either with FibroTest® or biopsy (-2.10% [95% CI -4.89–0.70]; P=0.14; without heterogeneity P=0.54; Figure 3) [32,33].
Difference between treatment effect on fibrosis and activity biomarkersTwo studies assessed both fibrosis and necroinflamma-tory activity using FibroTest® and ActiTest®, respectively, in patients with baseline advanced fibrosis and virologi-cal response. One was performed in patients with chronic
HBV
Poynard et al.,2009 NR
Poynard et al.,2009 R
Ave
HCV
Poynard et al.,2003 SVR
Poynard et al.,2002 SVR
Poynard et al.,2002 NR
Poynard et al.,2003 NR
Ave
Total
-150.0 -100.0 -50.0 0.0 50.0 100.0
Stu
dy
Mean difference
Data from [32,33,38,39]. The horizontal lines indicate the 95% confidence interval for the mean difference between biopsy and FibroTest® fibrosis estimates. The vertical line indicates the equivalence line (0% difference). When the horizontal line crosses the vertical line, there is no significant difference. There was no difference between biopsy and FibroTest® estimates whatever the disease or the virological response. Ave, average mean for the combined group of studies; NR, non-responders; R, HBV responders; SVR, HCV sustained virological responders.
Figure 3. Difference between biopsy and FibroTest® estimates of fibrosis progression
AVT-09-RV-1390_Poynard.indd 626 25/6/10 11:17:46

Biomarkers for hepatitis trials
Antiviral Therapy 15.4 627
hepatitis C [34] and one in patients with hepatitis B [39] (Table 7). In both studies, there was a significant and rapid decrease in activity and a delayed effect on fibrosis biomar-kers. The decrease in fibrosis biomarkers was not simul-taneous with the decrease in activity biomarkers, occur-ring later and at a significantly lower magnitude (Table 6). Similarly, FibroTest® decreased between baseline and end of follow-up in SVR patients in the study of coinfected HCV–HIV patients, regardless of the necroinflammatory activity decrease between paired biopsies [36].
For FibroScan®, 13 untreated HBV-infected patients with transaminases flares in one included study had repeated LSM and ALT assays, which is a classical marker of necroinflammatory activity [40]. During flares, LSM values increased from 1.2- to 4.4-fold compared with baseline values (mean variation 2.1- ±1.0-fold), with the mean LSM value during flares being 20.7 ±12.3 kPa (range 8.6–42). LSM variations paralleled the dynamic profiles of ALT.
Discussion
This meta-analysis identified two biomarkers (Fibro-Test® and FibroScan®), which were used in hepatitis tri-als with at least one control group to assess the effect of antiviral treatment on fibrosis progression.
The evidence-based data suggest that these two biomarkers could be used as non-invasive alternatives to biopsy for estimating the effect of HCV or HBV treatments on fibrosis stage. FibroTest® and LSM were significantly reduced in virological responders compared with baseline values and compared with virological non-responders. When paired biopsies were available, the same effect was observed with these biomarkers and biopsy, both in responders and non-responders.
This meta-analysis has several weaknesses. The main weakness is the relatively limited number of studies and patients, with most studies published by the same group. However, these data, with repeated measurements, confirm the accuracy of these biomar-kers, which have already been extensively validated, including independent validations, in baseline studies versus biopsy [11–16,18,19,21,23]. Another expected weakness is the absence of ideal controls. In treatment- naive patients with advanced fibrosis, follow-up with-out treatment is unethical. In patients with chronic hepatitis C there were no randomized controls on pla-cebo; however, there was no significant heterogeneity among controls and among treatment effects despite less severe disease in controls. The change in liver his-tology has been expressed as the difference between
Time, weeksStudy Characteristic Patients, n Baseline 12 24 48 Reference
HCV d’Arondel FibroTest®a 20 0.67 (0.14) 0.61 (0.15) 0.64 (0.15) 0.58 (0.15) [34]et al., 2006 Difference – -0.06 -0.03 -0.09 versus baselinea Difference, % – -9 -4 -13 Percentage per year – -36 -4 -6 ActiTest®b 20 0.75 (0.18) 0.21 (0.20) 0.23 (0.20) 0.15 (0.09) Difference – -0.54 -0.52 -0.60 versus baselineb Difference, % – -72 -69 -80 Percentage per year – -288 -69 -40 HBV Poynard FibroTest®a 82 0.73 (0.18) NA 0.60 (0.25) 0.62 (0.15) [39]et al., 2005 Difference – – -0.13 -0.11 versus baselinea
Difference, % – – -18 -15 Percentage per year – – -18 -7 ActiTest®b 82 0.58 (0.25) NA 0.06 (0.07) 0.11 (0.16) Difference – – -0.52 -0.48 versus baselineb Difference, % – – -90 -83 Percentage per year – – -90 -42
Values presented are mean (±sd) unless otherwise indicated. aExpressed as FibroTest® units (range 0.00–1.00). bExpressed as ActiTest® units (range 0.00–1.00). NA, not applicable.
Table 7. Dynamic of fibrosis and activity biomarkers during treatment in virological responders with advanced baseline fibrosis
AVT-09-RV-1390_Poynard.indd 627 25/6/10 11:17:47

T Poynard et al.
©2010 International Medical Press628
fibrosis scores. There is no perfect histological esti-mate of fibrosis progression. Metavir is a semiquanti-tative estimate of fibrosis area and a semiquantitative estimate of mortality and morbidity widely used in modelling [27,41–43]. In chronic hepatitis B trials, as observed for repeated biopsy reviews [24], the hetero-geneity of controls was a major cause of variability in the results. The natural history of chronic hepatitis B is very heterogeneous, with a higher prevalence of spontaneous virological improvement than in patients with chronic hepatitis C, resulting in regression of fibrosis in control groups.
Comparison between FibroTest® and FibroScan®Only one study directly compared repeated meas-urements of fibrosis by FibroTest® or FibroScan® in both treated and non-treated patients with chronic hepatitis C [30]. Expressed as the pFPy, the effect in SVR was higher as assessed by LSM (-23%) than by FibroTest® (-13%), this was also observed in indi-rect comparisons (Table 2). It is possible that a pro-portion of the decrease of the pFPy is related to the concomitant effect on necroinflammatory activity. LSM is highly sensitive to necroinflammatory activity [40,44], both in chronic hepatitis C and B; therefore, to prevent overestimation by LSM of the antifibrotic effect of antiviral treatments, it is mandatory to con-sider the simultaneous effect of treatment on activity. One method is to compare the dynamics of a specific activity biomarker with the dynamics of LSM during and after treatment, as performed for FibroTest® and ActiTest® [34,38] (Table 6). Histological fibrosis vari-ations are less rapid than necroinflammatory features and a very rapid decrease in a fibrosis marker suggests a lack of specificity.
One possible weakness of FibroTest® in patients treated with ribavirin is the risk of false-positives caused by haemolysis, which interferes with two com-ponents of the panel: total bilirubin and haptoglobin. However, among patients with rapid haemolysis (defined as a decrease of ≥3 g/l), there was no sig-nificant difference compared with patients without haemolysis for the FibroTest® values during and after treatment by standard doses of ribavirin and pegylated interferon [34].
Comparison with other fibrosis biomarkersA total of 14 validated biomarkers (with at least two published validations) were identified between 1991 and 2008 [11,12]. Of them, nine were not patented: PGA index, AP index, Bonacini index, Pohl score, Forn’s index, APRI index, MP3 index, FIB4 and FibroIndex; five were patented: FibroTest®, Fibro-Spect II, ELF, FibroMeter and Hepascore. Only Fibro-Test® had had at least two studies and a control group
with repeated measurements for inclusion in a meta-analysis.
In the present meta-analysis, one trial observed that repeated FibroTest® assessments had better concord-ance with virological response than the APRI index [35]. Concerning ‘baseline studies’, meta-analyses have observed higher accuracy for the diagnosis of advanced fibrosis and prognostic value of FibroTest® versus the APRI index in patients with chronic hepa-titis C [29,45]. In patients with chronic hepatitis B, FibroTest® also had a higher prognostic value than the APRI [37]. A major weakness of fibrosis biomark-ers that include transaminases in their panels (such as APRI, FIB4 or Fibro Meter) is overestimation of the antifibrotic effect of treatment because of the decrease of activity compared with biomarkers with-out transaminases. Studies using the APRI as a surro-gate marker of disease severity should take this lack of specificity into account [45,46].
Isolated serum fibrosis markers have a lower accuracy for the diagnosis of fibrosis than panels [11,14–16,32,47]. Serum levels of YKL-40, a tis-sue inhibitor of matrix metalloproteinase-1, amino-terminal peptide of type III procollagen (PIIINP) and hyaluronic acid were determined during the lead-in treatment phase of patients enrolled in the Hepatitis C Antiviral Long-term Treatment against Cirrhosis (HALT-C) trial. A statistically significant reduction in levels of these markers was observed at week 72 compared with baseline in the 81 patients with a sus-tained virological response, but not in the 72 patients with breakthrough or relapse. Use of these markers as alternatives to biopsy in trials was difficult because during treatment with standard pegylated interferon and ribavirin, YKL-40 levels were unchanged in full responders and significant increases were observed in serum PIIINP and hyaluronic acid levels compared with baseline, both in virological responders and non-responders at weeks 24 and 48 [48].
Are these evidence-based data sufficient for replacing biopsy with biomarkers in hepatitis trials?The aim of the present meta-analysis was to iden-tify which biomarker demonstrated its accuracy for assessing liver fibrosis progression during and after antiviral treatment compared with liver biopsy esti-mates using repeated assessments.
We did not seek to identify biomarkers with this study that were similar to biopsy for two rec-ommended properties: exclusion of patients with advanced fibrosis from participation in early clinical trials and for the stratification of treatment effect, as fibrosis stage is an independent prognostic factor of virological response (in hepatitis C) [17]. From pub-lished data, we believe that these two properties have
AVT-09-RV-1390_Poynard.indd 628 25/6/10 11:17:47

Biomarkers for hepatitis trials
Antiviral Therapy 15.4 629
already been demonstrated. For the first property, both FibroTest® and FibroScan® have demonstrated their high negative predictive values for advanced fibrosis in chronic hepatitis C and FibroTest® in chronic hepa-titis B [11,12,19,21,23], including prognostic stud-ies [29,37]. For the second property, there are also prospective data demonstrating that FibroTest® in chronic hepatitis C has the same value as histological fibrosis staging for the prediction of sustained viro-logical response, independent of genotype and base-line viral load, in treatment-naive patients [34] and in previous non-responder patients [49].
Can these results improve the design of maintenance therapy trials in chronic hepatitis C?In patients without sustained virological response to HCV treatment, there is controversy about the ben-efit of maintenance therapy [50,51]. This controversy could, in part, be related to a lack of power of pub-lished negative trials using liver biopsy as the end point. From the present overview in paired studies the mean effect of treatment (full dose of interferon or combination of interferon and ribavirin in treatment-naive patients) on the fibrosis progression rate in viro-logical non-responders was 10% per year compared with controls. The HALT-C study used small doses of interferon alone in previous non-responder patients. The results of this study show that, as anticipated in the power calculations, maintenance therapy cannot halve the progression rate. The present meta-analysis suggests that these power calculations might have been unrealistic; the aim was to reduce the fibrosis progression per year by 50% (6% in controls versus 3% in treated patients). Assuming that small doses of interferon have the same antifibrotic effect as full-dose combination therapy (10% reduction per year in the present meta-analysis), the number of included patients should have multiplied fivefold. Therefore, only a large study including at least 2,500 patients per group for 4 years using biomarkers and clinical end points could demonstrate the efficacy of maintenance therapy on fibrosis progression and related clinical end points. A 10% reduction of fibrosis progression rate can be clinically significant and cost-effective as the mortality related to infection with HCV is still increasing.
Conclusions
The most validated non-invasive markers of liver fibrosis, FibroTest® and FibroScan®, have reached a sufficient level of performance to be considered alternatives to liver biopsy in clinical trials. Previous transversal studies have demonstrated their accuracies for the inclusion of patients with chronic hepatitis C
and B and for stratification of analysis according to advanced fibrosis.
The present meta-analysis of longitudinal studies with repeated published data in patients with chronic hepatitis C and B, has demonstrated that the treatment effect on fibrosis progression rate was similarly esti-mated using FibroTest® or biopsy. The same concord-ance was observed according to virological response for FibroScan®, but with a possible overestimation of the fibrosis regression during the first weeks of treat-ment in virological responders because of the effect of necrosis and inflammation on LSMs.
Further studies must estimate the performance of biomarkers as end points in maintenance therapy tri-als and as prognostic factors of virological responses.
Disclosure statement
TP is the inventor and has a capital interest in Biopredictive (Paris, France), the company marketing FibroTest®. MM and YN are employees of Biopredic-tive. The patents belong to the public organization Assistance Publique Hôpitaux de Paris. This study was supported by a grant from the Association pour la Recherche sur les Maladies Virales et Hépatiques (ARMHV). ARMHV was not involved in the study design, data collection, data analysis or data interpreta-tion. All other authors declare no competing interests.
Additional files
Additional file 1: Supplementary Table 1 showing the concordance between fibrosis scores as estimated using repeated FibroTest® and biopsy can be found at http://www.intmedpress.com/uploads/documents/AVT-09-RV-1390_Poynard_Add_File1.pdf
Additional file 2: Supplementary Table 2 showing the effect of HBV treatment on repeated FibroTest® and FibroScan® using different definitions of virological response can be found at http://www.intmedpress.com/uploads/documents/AVT-09-RV-1390_Poynard_Add_File2.pdf
References1. Lavanchy D. The global burden of hepatitis C. Liver Int
2009; 29 Suppl 1:74–81.
2. Poynard T, Yuen MF, Ratziu V, et al. Viral hepatitis C. Lancet 2003; 362:2095–2100.
3. Lavanchy D. Worldwide epidemiology of HBV infection, disease burden, and vaccine prevention. J Clin Virol 2005; 34 Suppl 1:S1–S3.
4. Lai CL, Ratziu V, Yuen MF, Poynard T. Viral hepatitis B. Lancet 2003; 362:2089–2094.
5. Schuppan D, Afdhal NH. Liver cirrhosis. Lancet 2008; 371:838–851.
AVT-09-RV-1390_Poynard.indd 629 25/6/10 11:17:47

T Poynard et al.
©2010 International Medical Press630
6. Manns MP, McHutchison JG, Gordon SC, et al. Peginterferon alfa-2b plus ribavirin compared with interferon alfa-2b plus ribavirin for initial treatment of chronic hepatitis C: a randomised trial. Lancet 2001; 358:958–965.
7. Fried MW, Shiffman ML, Reddy KR, et al. Peginterferon alfa-2a plus ribavirin for chronic hepatitis C virus infection. N Engl J Med 2002; 347:975–982.
8. Lai CL, Shouval D, Lok AS, et al. Entecavir versus lamivudine for patients with HBeAg-negative chronic hepatitis B. N Engl J Med 2006; 354:1011–1020.
9. Chang TT, Gish RG, de Man R, et al. A comparison of entecavir and lamivudine for HBeAg-positive chronic hepatitis B. N Engl J Med 2006; 354:1001–1010.
10. Marcellin P, Heathcote EJ, Buti M, et al. Tenofovir disoproxil fumarate versus adefovir dipivoxil for chronic hepatitis B. N Engl J Med 2008; 359:2442–2455.
11. Manning DS, Afdhal NH. Diagnosis and quantitation of fibrosis. Gastroenterology 2008; 134:1670–1681.
12. Poynard T, Morra R, Ingiliz P, et al. Biomarkers of liver fibrosis. Adv Clin Chem 2008; 46:131–152.
13. Castera L, Denis J, Babany G, Roudot-Thoraval F. Evolving practices of non-invasive markers of liver fibrosis in patients with chronic hepatitis C in France: time for new guidelines? J Hepatol 2007; 46:528–529.
14. McHutchison J, Poynard T, Afdhal N, International Fibrosis Group Meeting Participants. Fibrosis as an end point for clinical trials in liver disease: a report of the international fibrosis group. Clin Gastroenterol Hepatol 2006; 4:1214–1220.
15. La Haute Autorité de Santé (HAS; France). The HAS recommendations for the management of the chronic hepatitis C using non-invasive biomarkers. (Updated December 2008. Accessed June 2010.) Available from http://www.has-sante.fr/portail/plugins/ModuleXitiKLEE/types/FileDocument/doXiti.jsp?id=c_783807
16. Fontaine H, Petitprez K, Roudot-Thoraval F, et al. Guidelines for the diagnosis of uncomplicated cirrhosis. Gastroenterol Clin Biol 2007; 31:504–509.
17. European Medicines Agency. Guideline on the clinical evaluation of direct acting antiviral agents intended for treatment of chronic hepatitis C. (Updated May 2008. Accessed June 2010.) Available from www.ema.europa.eu/pdfs/human/ewp/617203en.pdf
18. Poynard T, Morra R, Halfon P, et al. Meta-analyses of FibroTest diagnostic value in chronic liver disease. BMC Gastroenterol 2007; 7:40.
19. Halfon P, Munteanu M, Poynard T. FibroTest-ActiTest as a non-invasive marker of liver fibrosis. Gastroenterol Clin Biol 2008; 32:22–38.
20. Shaheen AA, Myers RP. Diagnostic accuracy of the aspartate aminotransferase-to-platelet ratio index for the prediction of hepatitis C-related fibrosis: a systematic review. Hepatology 2007; 46:912–921.
21. Shaheen AA, Wan AF, Myers RP. FibroTest and FibroScan for the prediction of hepatitis C-related fibrosis: a systematic review of diagnostic test accuracy. Am J Gastroenterol 2007; 102:2589–2600.
22. Poynard T, Muntenau M, Morra R, et al. Methodological aspects for the interpretation of liver fibrosis non-invasive biomarkers: a 2008 update. Gastroenterol Clin Biol 2008; 32:8–21.
23. Friedrich-Rust M, Ong MF, Martens S, et al. Performance of transient elastography for the staging of liver fibrosis: a meta-analysis. Gastroenterology 2008; 134:960–974.
24. Poynard T, Massard J, Rudler M, et al. Impact of interferon-alpha treatment on liver fibrosis in patients with chronic hepatitis B: an overview of published trials. Gastroenterol Clin Biol 2009; 33:916–922.
25. Ghany MG, Strader DB, Thomas DL, Seeff LB, American Association for the Study of Liver Diseases. Diagnosis, management, and treatment of hepatitis C: an update. Hepatology 2009; 49:1335–1374.
26. Tong MJ, Hsien C, Hsu L, Sun HE, Blatt LM. Treatment recommendations for chronic hepatitis B: an evaluation of current guidelines based on a natural history study in the United States. Hepatology 2008; 48:1070–1078.
27. Poynard T, Mathurin P, Lai CL, et al. A comparison of fibrosis progression in chronic liver diseases. J Hepatol 2003; 38:257–265.
28. Hintze JL. NCSS 2007 User Guide. Kaysville: Number Cruncher Statistical Systems software NCSS 2007; pp. 200.
29. Ngo Y, Munteanu M, Messous D, et al. A prospective analysis of the prognostic value of biomarkers (FibroTest) in patients with chronic hepatitis C. Clin Chem 2006; 52:1887–1896.
30. Vergniol J, Foucher J, Castéra L, et al. Changes of non-invasive markers and FibroScan values during HCV treatment. J Viral Hepat 2009; 16:132–140.
31. Ogawa E, Furusyo N, Toyoda K, Takeoka H, Maeda S, Hayashi J. The longitudinal quantitative assessment by transient elastography of chronic hepatitis C patients treated with pegylated interferon alpha-2b and ribavirin. Antiviral Res 2009; 83:127–134.
32. Poynard T, Imbert-Bismut F, Ratziu V, et al. Biochemical markers of liver fibrosis in patients infected by hepatitis C virus: longitudinal validation in a randomized trial. J Viral Hepat 2002; 9:128–133.
33. Poynard T, McHutchison J, Manns M, Myers RP, Albrecht J. Biochemical surrogate markers of liver fibrosis and activity in a randomized trial of peginterferon alfa-2b and ribavirin. Hepatology 2003; 38:481–492.
34. d’Arondel C, Munteanu M, Moussalli J, et al. A prospective assessment of an ‘a la carte’ regimen of PEG-interferon alpha2b and ribavirin combination in patients with chronic hepatitis C using biochemical markers. J Viral Hepat 2006; 13:182–189.
35. Patel K, Benhamou Y, Yoshida EM, et al. An independent and prospective comparison of two commercial fibrosis marker panels (HCV FibroSURE and FIBROSpect II) during albinterferon alfa-2b combination therapy for chronic hepatitis C. J Viral Hepat 2009; 16:178–186.
36. Halfon P, Carrat F, Bédossa P, et al. Effect of antiviral treatment on serum markers of liver fibrosis in HIV-hepatitis C virus-coinfected patients: the Fibrovic 2 Study – ANRS HC02. Antivir Ther 2009; 14:211–219.
37. Ngo Y, Benhamou Y, Thibault V, et al. An accurate definition of the status of inactive hepatitis B virus carrier by a combination of biomarkers (FibroTest-ActiTest) and viral load. PLoS ONE 2008; 3:e2573.
38. Poynard T, Ngo Y, Marcellin P, et al. Impact of adefovir dipivoxil on liver fibrosis and activity assessed with biochemical markers (FibroTest-ActiTest) in patients infected by hepatitis B virus. J Viral Hepat 2009; 16:203–213.
39. Poynard T, Zoulim F, Ratziu V, et al. Longitudinal assessment of histology surrogate markers (FibroTest-ActiTest) during lamivudine therapy in patients with chronic hepatitis B infection. Am J Gastroenterol 2005; 100:1970–1980.
40. Oliveri F, Coco B, Ciccorossi P, et al. Liver stiffness in the hepatitis B virus carrier: a non-invasive marker of liver disease influenced by the pattern of transaminases. World J Gastroenterol 2008; 14:6154–6162.
41. Poynard T, Bedossa P, Opolon P. Natural history of liver fibrosis progression in patients with chronic hepatitis C. Lancet 1997; 349:825–832.
42. Thein HH, Yi Q, Dore GJ, Krahn MD. Estimation of stage-specific fibrosis progression rates in chronic hepatitis C virus infection: a meta-analysis and meta-regression. Hepatology 2008; 48:418–431.
43. Davis GL, Alter MJ, El-Serag H, Poynard T, Jennings LW. Aging of the hepatitis C virus (HCV)-infected persons in the United States: a multiple cohort model of HCV prevalence and disease progression. Gastroenterology 2010; 138:513–521.
AVT-09-RV-1390_Poynard.indd 630 25/6/10 11:17:47

Biomarkers for hepatitis trials
Antiviral Therapy 15.4 631
44. Vispo E, Barreiro P, Del Valle J, et al. Overestimation of liver fibrosis staging using transient elastography in patients with chronic hepatitis C and significant liver inflammation. Antivir Ther 2009; 14:187–193.
45. Morra R, Lebray P, Ingiliz P, et al. FibroTest has better diagnostic and prognostic values than the aspartate aminotransferase-to-platelet ratio index in patients with chronic hepatitis C. Hepatology 2008; 47:353–354.
46. Al-Mohri H, Murphy T, Lu Y, Lalonde RG, Klein MB. Evaluating liver fibrosis progression and the impact of antiretroviral therapy in HIV and hepatitis C coinfection using a noninvasive marker. J Acquir Immune Defic Syndr 2007; 44:463–469.
47. Gebo KA, Herlong HF, Torbenson MS, et al. Role of liver biopsy in management of chronic hepatitis C: a systematic review. Hepatology 2002; 36:S161–S172.
48. Fontana RJ, Bonkovsky HL, Naishadham D, et al. Serum fibrosis marker levels decrease after successful antiviral treatment in chronic hepatitis C patients with advanced fibrosis. Clin Gastroenterol Hepatol 2009; 7:219–226.
49. Poynard T, Schiff ER, Terg R, et al. FibroTest (Ft) baseline value is an independent predictor of early (EVR) and sustained virological response (SVR) in non-responders patients re-treated with pegylated interferon alfa-2B (PEG-2B) and ribavirin in EPIC3. J Hepatol 2009; 50 Suppl 1:S156.
50. Di Bisceglie AM, Shiffman ML, Everson GT, et al. Prolonged therapy of advanced chronic hepatitis C with low-dose peginterferon. N Engl J Med 2008; 359:2429–2441.
51. Poynard T, Ratziu V. Prolonged therapy for hepatitis C with low-dose peginterferon. N Engl J Med 2009; 360:1152. Author reply 1152–1153.
Accepted for publication 16 December 2009
AVT-09-RV-1390_Poynard.indd 631 25/6/10 11:17:47