Origin of stray grain formation in single-crystal ... · PDF fileOrigin of stray grain...
14
Origin of stray grain formation in single-crystal superalloy weld pools from heat transfer and fluid flow modeling T.D. Anderson a , J.N. DuPont a, * , T. DebRoy b a Department of Materials Science and Engineering, Lehigh University, Bethlehem, PA 18015, USA b Department of Materials Science and Engineering, The Pennsylvania State University, University Park, PA 16802, USA Received 28 May 2009; received in revised form 21 September 2009; accepted 26 October 2009 Available online 5 December 2009 Abstract Stray grain formation in laser and electron beam welds on single-crystal alloy CMSX-4 was investigated through heat transfer and fluid flow simulations. The results were combined with a single-crystal growth model and stray grain calculations to investigate the influ- ence of welding parameters on stray grain formation. Stray grain contents were also experimentally measured on laser and electron beam welds prepared over a wide range of parameters. The experimental and simulation results each demonstrate that stray grain content ini- tially increases and then decreases with increasing travel speed. Increases in beam power produce an increase in the stray grain content. The results also demonstrate that restriction of growth along h100i directions decreases the magnitude of the temperature gradient and increases the growth rate along the dendrite growth direction (relative to the solidification interface normal). This effect promotes stray grain formation in the pool by increasing the extent of constitutional supercooling. Ó 2009 Acta Materialia Inc. Published by Elsevier Ltd. All rights reserved. Keywords: Single crystal; Weld repair; Constitutional supercooling; Stray grain formation 1. Introduction The efficiency of a gas turbine engine is reliant on the ability of the engine to operate at high temperatures. Nickel-base superalloys have long been employed by the aerospace and energy industries in this application for their superior strength and fracture resistance at elevated tem- peratures. The excellent high-temperature mechanical properties are the result of precipitation of the ordered c 0 phase, and the effects of creep deformation have been reduced through the use of a monocrystalline structure [1]. While these single-crystal (SX) casting techniques impart superior performance, the process itself is very expensive. A typical SX gas turbine blade can cost as much as $30,000 to manufacture [2]. While the overall benefits justify the initial cost, several failure mechanisms can adversely affect the lifetime of a blade in service. Mechan- ical surface wear, erosion of the blade tip, thermal fatigue cracking and hot corrosion [3] can lead to reduced perfor- mance, and will eventually require removal of the blade from service. In addition, crystalline imperfections result- ing from the casting process can also disqualify the blade from service. Currently, techniques for repairing a failed or miscast SX component are not always reproducible, so the blades are often discarded. An effective method for repairing a damage or miscast blade could result in signif- icant cost savings in the gas turbine industry. Much research has focused on the use of a weld repair method for this purpose. The primary challenge to successful weld repairs is the maintenance of the SX microstructure in the repair area. When solidifying weld metal grows epitaxially from the SX substrate, the crystallographic orientation of the base and weld metals will be continuous, and growth will occur along one of the “easy” crystal directions (for cubic met- als). However, certain conditions may arise in the weld pool that promote the nucleation and growth of equiaxed 1359-6454/$36.00 Ó 2009 Acta Materialia Inc. Published by Elsevier Ltd. All rights reserved. doi:10.1016/j.actamat.2009.10.051 * Corresponding author. Tel.: +1 610 758 3942; fax: +1 610 758 4244. E-mail address: [email protected] (J.N. DuPont). www.elsevier.com/locate/actamat Available online at www.sciencedirect.com Acta Materialia 58 (2010) 1441–1454
Transcript of Origin of stray grain formation in single-crystal ... · PDF fileOrigin of stray grain...

Available online at www.sciencedirect.com
www.elsevier.com/locate/actamat
Acta Materialia 58 (2010) 1441–1454
Origin of stray grain formation in single-crystal superalloy weldpools from heat transfer and fluid flow modeling
T.D. Anderson a, J.N. DuPont a,*, T. DebRoy b
a Department of Materials Science and Engineering, Lehigh University, Bethlehem, PA 18015, USAb Department of Materials Science and Engineering, The Pennsylvania State University, University Park, PA 16802, USA
Received 28 May 2009; received in revised form 21 September 2009; accepted 26 October 2009Available online 5 December 2009
Abstract
Stray grain formation in laser and electron beam welds on single-crystal alloy CMSX-4 was investigated through heat transfer andfluid flow simulations. The results were combined with a single-crystal growth model and stray grain calculations to investigate the influ-ence of welding parameters on stray grain formation. Stray grain contents were also experimentally measured on laser and electron beamwelds prepared over a wide range of parameters. The experimental and simulation results each demonstrate that stray grain content ini-tially increases and then decreases with increasing travel speed. Increases in beam power produce an increase in the stray grain content.The results also demonstrate that restriction of growth along h1 0 0i directions decreases the magnitude of the temperature gradient andincreases the growth rate along the dendrite growth direction (relative to the solidification interface normal). This effect promotes straygrain formation in the pool by increasing the extent of constitutional supercooling.� 2009 Acta Materialia Inc. Published by Elsevier Ltd. All rights reserved.
Keywords: Single crystal; Weld repair; Constitutional supercooling; Stray grain formation
1. Introduction
The efficiency of a gas turbine engine is reliant on theability of the engine to operate at high temperatures.Nickel-base superalloys have long been employed by theaerospace and energy industries in this application for theirsuperior strength and fracture resistance at elevated tem-peratures. The excellent high-temperature mechanicalproperties are the result of precipitation of the ordered c0
phase, and the effects of creep deformation have beenreduced through the use of a monocrystalline structure[1]. While these single-crystal (SX) casting techniquesimpart superior performance, the process itself is veryexpensive. A typical SX gas turbine blade can cost as muchas $30,000 to manufacture [2]. While the overall benefitsjustify the initial cost, several failure mechanisms canadversely affect the lifetime of a blade in service. Mechan-
1359-6454/$36.00 � 2009 Acta Materialia Inc. Published by Elsevier Ltd. All
doi:10.1016/j.actamat.2009.10.051
* Corresponding author. Tel.: +1 610 758 3942; fax: +1 610 758 4244.E-mail address: [email protected] (J.N. DuPont).
ical surface wear, erosion of the blade tip, thermal fatiguecracking and hot corrosion [3] can lead to reduced perfor-mance, and will eventually require removal of the bladefrom service. In addition, crystalline imperfections result-ing from the casting process can also disqualify the bladefrom service. Currently, techniques for repairing a failedor miscast SX component are not always reproducible, sothe blades are often discarded. An effective method forrepairing a damage or miscast blade could result in signif-icant cost savings in the gas turbine industry. Muchresearch has focused on the use of a weld repair methodfor this purpose. The primary challenge to successful weldrepairs is the maintenance of the SX microstructure in therepair area.
When solidifying weld metal grows epitaxially from theSX substrate, the crystallographic orientation of the baseand weld metals will be continuous, and growth will occuralong one of the “easy” crystal directions (for cubic met-als). However, certain conditions may arise in the weldpool that promote the nucleation and growth of equiaxed
rights reserved.

Fig. 1. Gaumann’s models of the CET boundary for superalloy CMSX-4as a function of solidification parameters G and V: (a) KGT-based model
1442 T.D. Anderson et al. / Acta Materialia 58 (2010) 1441–1454
grains in the liquid which will have a crystallographic ori-entation independent from the substrate. Much researchhas been devoted towards understanding this columnar-to-equiaxed transition (CET). Initially described by Hunt[4] for casting processes, the CET is caused by excessiveconstitutional supercooling (CS). The amount of CS is usu-ally defined by the value G/V (where G = thermal gradientand V = solidification velocity), wherein a lower G/V leadsto more CS. When the amount of liquid undercooling sur-passes the required undercooling for nucleation (DTN), itbecomes possible for equiaxed grains to nucleate aheadof the columnar dendrites. Because the crystallographicorientation of these equiaxed grains strays from that ofthe base metal, these equiaxed crystals are often termed“stray” grains (SGs). Unlike casting, a wide range of G
and V will be present across the solidifying front in a weldpool. In addition, the restriction on epitaxial growth direc-tions imparted by the SX substrate further alters the distri-bution of G and V. The relevant values parallel to thedendrite axes, Ghkl and Vhkl, are accurately described bythe geometric model developed by Rappaz et al. [5–7].The model asserts that the growth rate will be a functionof the heat source travel speed Vb and the weld pool shapeaccording to the equation:
jV hklj ¼ jV bjcos hcos w
ð1Þ
where h is the angle between the normal to the solidifica-tion interface and welding velocity and w is the angle be-tween the normal to the solidification interface and thegrowth direction. The h1 0 0i vector which is locally opera-tive is that which is mostly closely aligned with the solidifi-cation interface normal vector. The orientation of the heatsource motion with respect to the substrate surface orienta-tion is thus a strong factor in the final crystal configurationin the weld zone. The shape of the weld pool, however, hasbeen shown to be independent of orientation for cubic crys-tals [6], since heat conduction is isotropic. Hunt’s model ofthe CET in casting processes also described the importanceof the alloy composition, particularly its effect on nucle-ation processes. The nucleation undercooling DTN wasmentioned previously, but composition will also controlthe nucleation density No. A higher No introduces more eli-gible sites for SGs to nucleate and grow.
Gaumann et al. [8] extended Hunt’s model to a widerrange of solidification conditions by incorporating themwithin the Kurz–Giovanola–Trivedi (KGT) model forrapid solidification. That work developed models whichenabled prediction of the type of solidification (SX vs.polycrystalline, PX) as a function of G and V. A moredirect continuation of Hunt’s work was produced later,wherein his equations were further developed and appliedfor the case of welding processes [9], giving:
Gn
V¼ a
ffiffiffiffiffiffiffiffiffiffiffiffiffiffiffiffiffiffiffiffiffiffi�4pN o
3 ln½1� /�3
s� 1
nþ 1
( )n
ð2Þ
where a and n are material constants and No is the nucleidensity. The two models are shown relative to one anotherin Fig. 1. Hunt’s model assumes that liquid undercoolingwill be negligible under the high-G conditions present dur-ing laser welding. To approximate the conditions of theCET, it is assumed that / values below 0.0066 have a neg-ligible effect on SX growth so that the CET does not occurbelow this value. The nucleation density was approximatedusing SG measurements from a series of laser weld trials.Since the right-hand side of the equations consists entirelyof constants, a CET will occur when:
G3:4
V< 2:7� 1024 ðK3:4=m4:4 sÞ ð3Þ
It is important to note that G and V are a strong func-tion of position within the melt pool. Gaumann proposedusing a depth-weighted average of Gn/V to characterize asingle weld pool. The difficulty in comparing this modelwith experimental welds lies in the wide range of G andV present along the solidification interface.
Vitek [10] avoided this simplification by using the modelto directly calculate / along all points of a simulated weldpool. The pool shapes and temperature gradients were cal-culated using the Rosenthal equation [11], and the output-ted pool shape and temperature fields were used todetermine the local values of /. The area-weighted averageof / was then used to characterize the SG formationbehavior for a single set of welding conditions. The resultsof that work illustrated the effects of a wide range of pro-cessing parameters (beam power, travel speed, substratecrystal orientation) which accurately described the limitedexperimental results available.
Yoshihiro et al. [12] recently investigated the microstruc-ture of welds on Alloy CMSX-4 prepared over a wide rangeof powers and travel speeds using both the laser and gastungsten arc (GTA) heat sources. They identified three typesof morphologies: single crystals with directional dendritesthat only grow in the [0 0 1] direction from the bottom ofthe weld, single crystals with disoriented dendrites, and welds
for directional solidification and (b) original Hunt-based model.
T.D. Anderson et al. / Acta Materialia 58 (2010) 1441–1454 1443
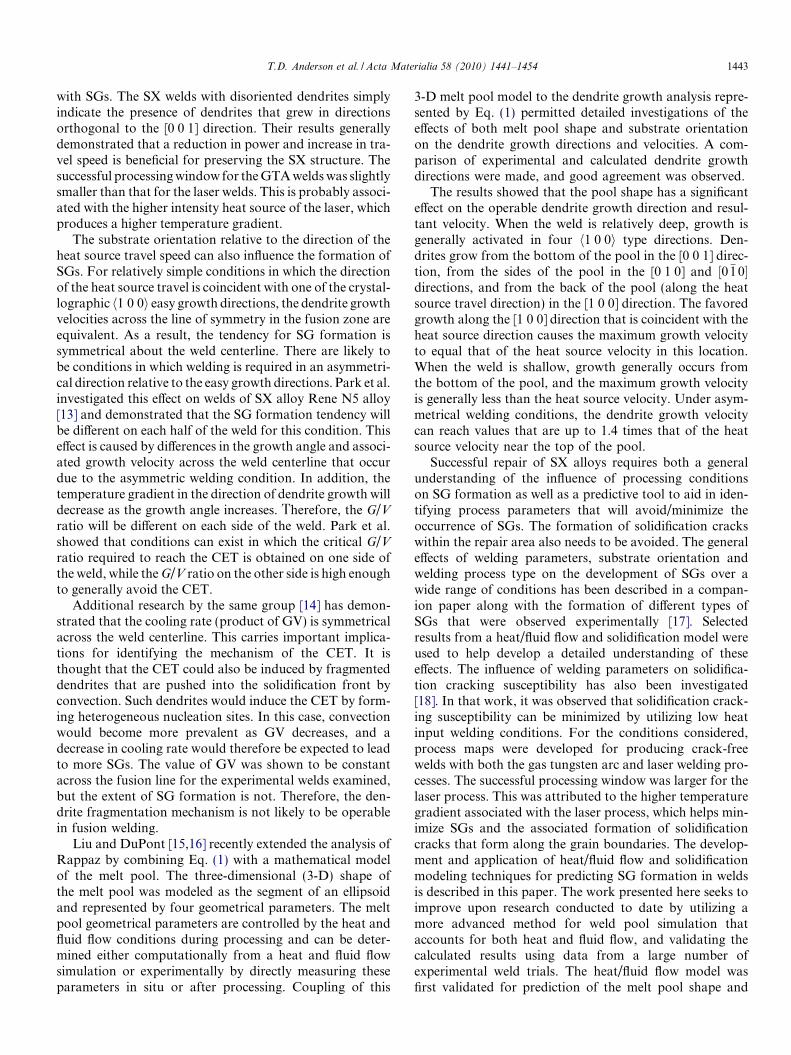
with SGs. The SX welds with disoriented dendrites simplyindicate the presence of dendrites that grew in directionsorthogonal to the [0 0 1] direction. Their results generallydemonstrated that a reduction in power and increase in tra-vel speed is beneficial for preserving the SX structure. Thesuccessful processing window for the GTA welds was slightlysmaller than that for the laser welds. This is probably associ-ated with the higher intensity heat source of the laser, whichproduces a higher temperature gradient.
The substrate orientation relative to the direction of theheat source travel speed can also influence the formation ofSGs. For relatively simple conditions in which the directionof the heat source travel is coincident with one of the crystal-lographic h1 0 0i easy growth directions, the dendrite growthvelocities across the line of symmetry in the fusion zone areequivalent. As a result, the tendency for SG formation issymmetrical about the weld centerline. There are likely tobe conditions in which welding is required in an asymmetri-cal direction relative to the easy growth directions. Park et al.investigated this effect on welds of SX alloy Rene N5 alloy[13] and demonstrated that the SG formation tendency willbe different on each half of the weld for this condition. Thiseffect is caused by differences in the growth angle and associ-ated growth velocity across the weld centerline that occurdue to the asymmetric welding condition. In addition, thetemperature gradient in the direction of dendrite growth willdecrease as the growth angle increases. Nherefore, the G/Vratio will be different on each side of the weld. Park et al.showed that conditions can exist in which the critical G/Vratio required to reach the CET is obtained on one side ofthe weld, while the G/V ratio on the other side is high enoughto generally avoid the CET.
Additional research by the same group [14] has demon-strated that the cooling rate (product of GV) is symmetricalacross the weld centerline. This carries important implica-tions for identifying the mechanism of the CET. It isthought that the CET could also be induced by fragmenteddendrites that are pushed into the solidification front byconvection. Such dendrites would induce the CET by form-ing heterogeneous nucleation sites. In this case, convectionwould become more prevalent as GV decreases, and adecrease in cooling rate would therefore be expected to leadto more SGs. The value of GV was shown to be constantacross the fusion line for the experimental welds examined,but the extent of SG formation is not. Therefore, the den-drite fragmentation mechanism is not likely to be operablein fusion welding.
Liu and DuPont [15,16] recently extended the analysis ofRappaz by combining Eq. (1) with a mathematical modelof the melt pool. The three-dimensional (3-D) shape ofthe melt pool was modeled as the segment of an ellipsoidand represented by four geometrical parameters. The meltpool geometrical parameters are controlled by the heat andfluid flow conditions during processing and can be deter-mined either computationally from a heat and fluid flowsimulation or experimentally by directly measuring theseparameters in situ or after processing. Coupling of this
3-D melt pool model to the dendrite growth analysis repre-sented by Eq. (1) permitted detailed investigations of theeffects of both melt pool shape and substrate orientationon the dendrite growth directions and velocities. A com-parison of experimental and calculated dendrite growthdirections were made, and good agreement was observed.
The results showed that the pool shape has a significanteffect on the operable dendrite growth direction and resul-tant velocity. When the weld is relatively deep, growth isgenerally activated in four h1 0 0i type directions. Den-drites grow from the bottom of the pool in the [0 0 1] direc-tion, from the sides of the pool in the [0 1 0] and ½0�10�directions, and from the back of the pool (along the heatsource travel direction) in the [1 0 0] direction. The favoredgrowth along the [1 0 0] direction that is coincident with theheat source direction causes the maximum growth velocityto equal that of the heat source velocity in this location.When the weld is shallow, growth generally occurs fromthe bottom of the pool, and the maximum growth velocityis generally less than the heat source velocity. Under asym-metrical welding conditions, the dendrite growth velocitycan reach values that are up to 1.4 times that of the heatsource velocity near the top of the pool.
Successful repair of SX alloys requires both a generalunderstanding of the influence of processing conditionson SG formation as well as a predictive tool to aid in iden-tifying process parameters that will avoid/minimize theoccurrence of SGs. The formation of solidification crackswithin the repair area also needs to be avoided. The generaleffects of welding parameters, substrate orientation andwelding process type on the development of SGs over awide range of conditions has been described in a compan-ion paper along with the formation of different types ofSGs that were observed experimentally [17]. Selectedresults from a heat/fluid flow and solidification model wereused to help develop a detailed understanding of theseeffects. The influence of welding parameters on solidifica-tion cracking susceptibility has also been investigated[18]. In that work, it was observed that solidification crack-ing susceptibility can be minimized by utilizing low heatinput welding conditions. For the conditions considered,process maps were developed for producing crack-freewelds with both the gas tungsten arc and laser welding pro-cesses. The successful processing window was larger for thelaser process. This was attributed to the higher temperaturegradient associated with the laser process, which helps min-imize SGs and the associated formation of solidificationcracks that form along the grain boundaries. The develop-ment and application of heat/fluid flow and solidificationmodeling techniques for predicting SG formation in weldsis described in this paper. The work presented here seeks toimprove upon research conducted to date by utilizing amore advanced method for weld pool simulation thataccounts for both heat and fluid flow, and validating thecalculated results using data from a large number ofexperimental weld trials. The heat/fluid flow model wasfirst validated for prediction of the melt pool shape and

1444 T.D. Anderson et al. / Acta Materialia 58 (2010) 1441–1454
variation in temperature gradient around the melt pool.The heat/fluid flow results are then integrated into a solid-ification model for determining the active growth directionsas well as the temperature gradient and solidification veloc-ity along the dendrite growth direction as an aid to predict-ing conditions that lead to the formation of SGs.
2. Procedure
2.1. Modeling
Weld pool simulations were carried out using the heattransfer and fluid flow code developed by DebRoy et al.[19,20]. Temperature and fluid velocity fields are calculatedusing fundamental equations of conservation of mass,momentum and energy with appropriate boundary condi-tions. Being a 3-D finite-difference code, the calculationsrequire the design of a mesh upon which they are per-formed. A unique mesh was designed for each set of weld-ing parameters in order to obtain good resolution ofvariables within the simulated melt pool. Using theassumption that weld pools are symmetric about their cen-terline, only one-half of the melt pool was simulated. Theentirety of the mesh occupied dimensions of3.3 � 0.5 � 0.6 cm, although the mesh was refined in thelocality of the melt pool. While the boundary faces of themesh were fixed at room temperature (298 K), the large sizeof the mesh ensures that temperature gradients surround-ing the melt pool are accurate. More details on the model-ing approach and procedure are provided in Appendix A.
The material properties used to simulate weld pools ofthe Ni-base superalloy CMSX-4 are listed in Table 1. Sev-eral of these properties are taken directly from values pro-duced in literature [21–23], while others were inputted asrepresentative of Ni-base alloys. Two of these values werealtered in order to produce calculated weld pool sizes andshapes that matched those observed from experimentalwelds. The effective thermal conductivity of liquid, foundpreviously to be 0.0785 cal cm�1 s�1 K�1 near the liquidus
Table 1CMSX-4 material properties used in finite-difference calculations.
Material property Units
Density of liquid 7.74 g cm�3
Effective viscosity of liquid 3.0 g cm�1 s�1
Solidus temperature 1620 KLiquidus temperature 1660 KEnthalpy of solid at melting point 47.8 cal g�1
Enthalpy of liquid at melting point 60 cal g�1
Specific heat of solid 0.195 cal g�1 K�1
Specific heat of liquid 0.167 cal g�1 K�1
Thermal conductivity of solid 0.068 cal cm�1 s�1 K�1
Effective thermal conductivity of liquid 0.2 cal cm�1 s�1 K�1
Coefficient of thermal expansion 1.00 � 10�4 K�1
Emissivity of the material 0dc/dT of pure material �1.37 dynes cm�1 K�1
Concentration of surface active species 0 wt.%Surface excess at saturation 1.30 � 10�9 mole cm�2
Enthalpy of segregation �3.97 � 104 cal mole�1
temperature [22], was increased to 0.2 cal cm�1 s�1 K�1.This modification can be justified, since temperatures inthe weld pool can far exceed the liquidus temperature.
The processing parameters used to simulate both thelaser and electron beam (EB) welds were similar. The beamradius was set to 0.75 mm, and the power distribution factorwas set as 3.0. However, the differences in absorptivity fromeach type of beam are accounted for by setting the beamabsorption coefficient to 0.6 for laser-beam welding and1.0 for the EB weld simulations. Laser-beams with powersof 240, 360 and 500 W were simulated moving at travelspeeds of 1, 6, 24 and 47 mm s�1. Weld pools were also cal-culated under an EB power of 120, 180, 250, 500, 1000 and1500 W moving at travel speeds of 1, 6, 24, 47, 75 and95 mm s�1. The radius and power distribution factors foreach type of beam were held constant. The accuracy ofthe model was checked by comparing the computed andexperimentally measured weld pool dimensions. No inputparameter optimization was made directly to seek the agree-ment. However, the effective thermal conductivity and theeffective viscosity values were guided by the previousresearch. In short, the previous correlations between thedimensionless heat input and effective viscosity and thermalconductivity developed in previous research were used [24].
The resulting data sets from the heat transfer and fluidflow calculations were used to map the microstructuraldevelopment of across the entire solidification interface.A FORTRAN program was developed in order to calcu-late the local temperature gradient (G) and solidificationvelocity (V). The G values were calculated directly fromthe temperature data, and the solidification velocity wascalculated using the geometric model developed by Rappazet al. These calculations require knowledge of the weldpool shape, which was determined using the simulated tem-perature data. The shape determination was accomplishedby utilizing the assumption that the vector with the maxi-mum G will coincide with the normal to the solidificationinterface. The program carries out the following steps:
(1) the liquidus temperature is located between individ-ual grid spacings via linear interpolation;
(2) temperature gradients in the liquid adjacent to thislocation are calculated along the three axes of themesh, giving the quantities Gx, Gy and Gz;
(3) the temperature gradient normal to the solid–liquidinterface is calculated, using the expression
Gsl ¼ffiffiffiffiffiffiffiffiffiffiffiffiffiffiffiffiffiffiffiffiffiffiffiffiffiffiffiffiG2
x þ G2y þ G2
z
q;
(4) the critical angles that describe the orientation of thelocal solid–liquid interface (hx, hy, hz) are calculatedusing the relationship hi ¼ cos�1 ðGi=GslÞ, wherei = x, y, z;
(5) the growth rate of the solid–liquid interface is calcu-lated via V sl ¼ S cos h, where S = heat source travelspeed;
(6) the w angles between the normal vector and the pos-sible dendrite growth directions are calculated;

T.D. Anderson et al. / Acta Materialia 58 (2010) 1441–1454 1445
(7) the magnitude of these angles are used to determinewhich h1 0 0i growth variant will be operative at thatlocation;
(8) the temperature gradient parallel to the dendritegrowth direction, Ghkl, is calculated using the equa-tion Ghkl ¼ Gsl= cos w;
(9) the dendrite growth velocity, Vhkl, is calculated usingthe equation V hkl ¼ S cos h= cos w.
2.2. Experimental
Modeling efforts were validated using a series of experi-mental weld trials on CMSX-4 substrates. The composition
Table 2Composition of CMSX-4 (all values in wt.%).
CMSX-4
Ni BalC 0.002Cr 6.36Co 9.68Mo 0.63W 6.34Ta 6.52Ti 1Al 5.62B 0Zr 0Hf 0.1Re 2.87
Fig. 2. Comparison of experimental and calculated weld pools for the 500 W–1substrate surface where the laser was shuttered.
of the substrate is listed in Table 2. The surface upon whichall welds were conducted was parallel to the (0 0 1) crystalplane. Welds were conducted along the [1 0 0], [1 2 0] and[1 1 0] directions. Laser welds were produced using a750 W Nd:YAG laser operating at processing parametersequivalent to those used in weld pool simulations. EBwelds were performed using a defocused beam and the pro-cessing parameters listed above. Weld cross-sections wereprepared metallographically in order to measure thedimensions of the weld pool and the SX growth regionsfor comparison with the weld pool simulations and SXgrowth predictions. The SG area fraction was also mea-sured for each weld condition via orientation imagingmicroscopy (OIM). Three weld cross-sections were mea-sured to determine an average SG fraction, defined as theSG area (measured from OIM) divided by the fusion zonearea (measured via optical microscopy).
3. Results
The accuracy of the weld pool simulations using the heattransfer and fluid flow code was judged based on its abilityto replicate the experimental welds conducted on the SXsubstrates. Comparisons between actual and calculatedweld pools were carried out by comparing two criteria:the pool dimensions (length, width and depth) and the poolshape. Fig. 2a shows a cross-sectional view of a simulatedweld pool superimposed over the weld fusion zone pro-duced by a laser pass performed with equivalent welding
mm s�1 laser-weld condition, viewed (a) in cross-section and (b) along the

Fig. 4. Distribution of the h1 0 0i dendrite growth variants along thesolid–liquid interface of the simulated [1 0 0]–250 W–1.5 mm s�1 EB weldpool.
1446 T.D. Anderson et al. / Acta Materialia 58 (2010) 1441–1454
parameters (500 W, 1 mm s�1), while Fig. 2b displays atop-down view of the simulation in comparison to the weldsurface that solidified moments after the laser was shut-tered. Fig. 3 plots the calculated weld pool dimensions(length, depth and width) as a function of their experimen-tally measured counterparts for all laser-beam (Fig. 3a) andEB weld parameters (Fig. 3b) studied. Good agreement isshown for the laser-beam welds and for the EB welds pre-pared at powers at and below 500 W, but large deviationsare present for the EB welds made at powers P1000 W.
Although the weld pool dimensions can easily be com-pared through direct measurement, assessment of the actualshape of the solid–liquid interface requires a more detailedanalysis of the weld microstructures and simulations. Thedendrite growth regions observed in a SX weld zone are adirect function of the weld pool shape. In light of this rela-tionship, the dimensions of the crystal growth regions wereused to parameterize the pool shape. The geometric modeldeveloped to describe the microstructural development ofa SX weld was used to predict Ghkl and Vhkl (temperaturegradient and solidification velocity parallel to the local den-drite growth direction) across the entire solidification inter-face. In order to do this, it is necessary to predict whichh1 0 0i growth variant will be active by comparing the wangles between the h1 0 0i variants and the normal vector(the active growth variant will be that which possesses thesmallest angle w). Fig. 4 illustrates the distribution of thesegrowth regions for the simulated [1 0 0]–250 W–1.5 mm s�1
EB weld. The three possible growth directions are indicatedby color and are plotted across the entire solidificationinterface. Only half of the weld pool is shown, since symme-try is predicted across the weld centerline for this substrateorientation. The surface and centerline of the simulatedmelt pool are labeled in Fig. 4 as points of reference. Forthis example, the [1 0 0] dendrites grow parallel to the weld-ing velocity at the weld crown, [0 0 1] dendrites grow verti-cally from the weld root, and [0 1 0] dendrites growperpendicularly from the fusion line.
Fig. 3. Comparison of the experimental and calculated weld pool dimensions fbeam welds and (b) the depth and width of EB welds.
In order to validate these dendrite growth calculations,comparison was made between the predicted dendritegrowth directions and the dendrite growth regions observedin the experimental weld structures. A direct comparison isgiven in Fig. 5, which superimposes the calculated dendritegrowth direction predictions upon the corresponding mea-sured growth directions (determined by OIM) for the[1 0 0]–240 W–1.5 mm s�1 laser weld microstructure. Goodagreement is shown in the span of each zone. Measurementswere taken from multiple laser weld structures conducted inthe (0 0 1)||[1 0 0] orientation to verify that the weld poolshape was properly simulated over a wide range of weldingconditions. Since the size of each dendrite growth zone islimited by the neighboring zones, the width and depth ofthe [1 0 0] zone was used to describe the weld pool shape.These values were measured from the low travel speed(1 and 6 mm s�1) laser-beam welds, which contained signif-
4
3.5
3
Cal
cula
ted
Dim
ensi
on (m
m)
2.5
2
1.5
1
0.5
00 0.5 1 1.5 2 2.5 3 3.5 4
Measured Dimension (mm)
EBW
120 D 120 W
180 D 180 W
250 D 250 W
500 D 500 W
(b)
or all sets of welding parameters: (a) the length, depth and width of laser-

Fig. 5. The experimental and predicted dendrite growth regions for the [1 0 0]–240 W–1 mm s�1 laser-weld condition.
Table 3Calculations for Ghkl and Vhkl for the [1 0 0]||(0 0 1) crystal orientation.
Condition Vhkl Ghkl
[1 0 0] wx < wy, wz Vsl/cos wx (=S) Gx
[0 1 0] wy < wx, wz Vsl/cos wy Gy
[0 0 1] wz < wx, wy Vsl/cos wz Gz
T.D. Anderson et al. / Acta Materialia 58 (2010) 1441–1454 1447
icant [1 0 0] dendrite zones. The equivalent dimensions ofthe calculated [1 0 0] growth region, as predicted by the geo-metric model, were also collected. The width and depth ofthe experimental and calculated [1 0 0] zones are comparedin Fig. 6a and b, respectively, for several laser powers at tra-vel speeds of 1 and 6 mm s�1. Good agreement is shown forboth parameters over all conditions.
The geometric model developed to describe the micro-structural development of a SX weld was used to predictGhkl and Vhkl across the entire solidification interface. Asa majority of the experimental SX welds conducted in thisstudy were of the [1 0 0]||(0 0 1) orientation, the calculatedGhkl and Vhkl fields presented herein will utilize the sameweld/substrate orientation relationship. The equations forcalculating Ghkl and Vhkl for this orientation values arepresented in Table 3. The ramifications of SX growth onthe distribution of G and V across the entire solidificationinterface for the [1 0 0]–250 W–1.5 mm s�1 simulated EBweld are illustrated in Figs. 7 and 8, respectively. The datais presented across the same three-dimensional representa-tion of the weld pool as shown in Fig. 4. The distributionof Gsl and Ghkl are compared in Fig. 7a and b. The samerelationships are shown for solidification velocity inFig. 8. The growth rate of the solidification interface Vsl
is described in Fig. 8a, while the dendrite tip velocity forthe case of SX growth is described in Fig. 8b. (Note that
Fig. 6. Comparison of the experimental and calculated dimension
the color scales evolve from low values in red to high val-ues in blue.)
4. Discussion
4.1. Heat transfer and fluid flow
As shown in Fig. 3, the heat transfer and fluid flow cal-culations accurately capture the weld pool dimensions forthe laser and EB welds for powers up to 500 W. Many ofthe welds were observed to exhibit wide and shallow pools,which is attributed largely due to the flow of liquid fromunder the heat source outward to the edge of the pool. Thisflow direction is caused by a negative gradient in surfacetension with temperature (dc/dT), confirmed experimen-tally as �1.37 dynes cm�1 K�1 in Ref. [15]. Significantdeviation between calculated and experimental dimensionswere observed for EB welds made at powers of 1000 and1500 W. The experimental EB weld depths were signifi-
s of the [1 0 0] dendrite growth zone: (a) width and (b) depth.
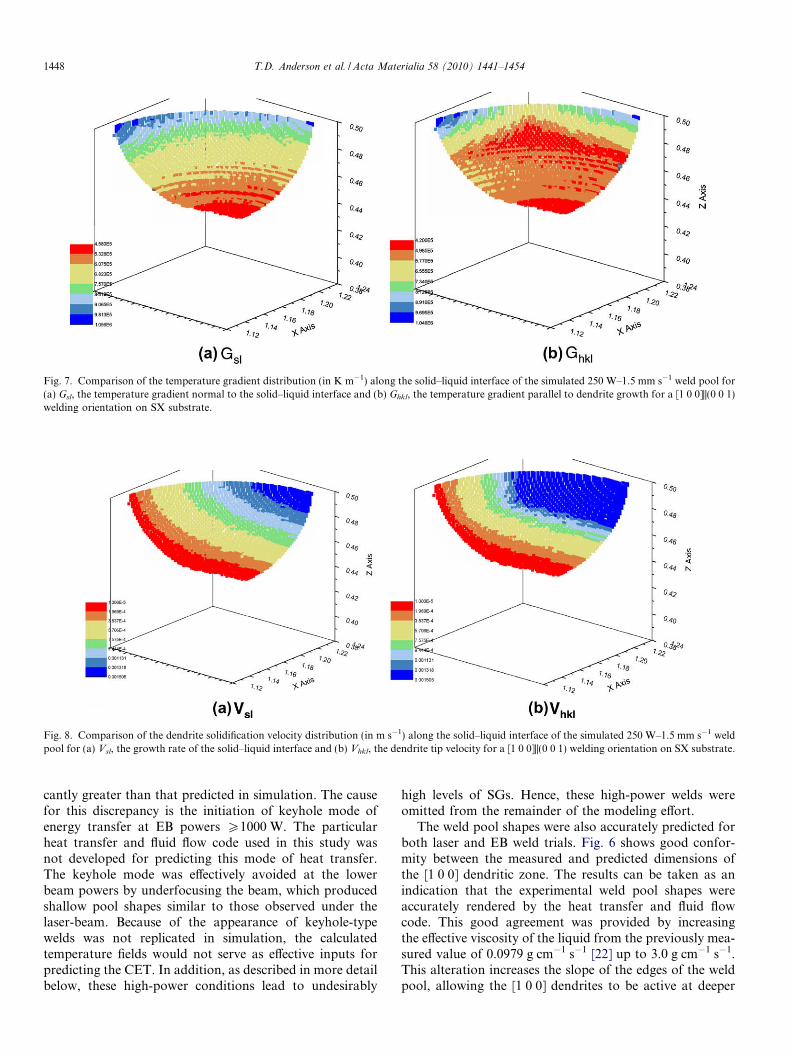
Fig. 7. Comparison of the temperature gradient distribution (in K m�1) along the solid–liquid interface of the simulated 250 W–1.5 mm s�1 weld pool for(a) Gsl, the temperature gradient normal to the solid–liquid interface and (b) Ghkl, the temperature gradient parallel to dendrite growth for a [1 0 0]||(0 0 1)welding orientation on SX substrate.
Fig. 8. Comparison of the dendrite solidification velocity distribution (in m s�1) along the solid–liquid interface of the simulated 250 W–1.5 mm s�1 weldpool for (a) Vsl, the growth rate of the solid–liquid interface and (b) Vhkl, the dendrite tip velocity for a [1 0 0]||(0 0 1) welding orientation on SX substrate.
1448 T.D. Anderson et al. / Acta Materialia 58 (2010) 1441–1454
cantly greater than that predicted in simulation. The causefor this discrepancy is the initiation of keyhole mode ofenergy transfer at EB powers P1000 W. The particularheat transfer and fluid flow code used in this study wasnot developed for predicting this mode of heat transfer.The keyhole mode was effectively avoided at the lowerbeam powers by underfocusing the beam, which producedshallow pool shapes similar to those observed under thelaser-beam. Because of the appearance of keyhole-typewelds was not replicated in simulation, the calculatedtemperature fields would not serve as effective inputs forpredicting the CET. In addition, as described in more detailbelow, these high-power conditions lead to undesirably
high levels of SGs. Hence, these high-power welds wereomitted from the remainder of the modeling effort.
The weld pool shapes were also accurately predicted forboth laser and EB weld trials. Fig. 6 shows good confor-mity between the measured and predicted dimensions ofthe [1 0 0] dendritic zone. The results can be taken as anindication that the experimental weld pool shapes wereaccurately rendered by the heat transfer and fluid flowcode. This good agreement was provided by increasingthe effective viscosity of the liquid from the previously mea-sured value of 0.0979 g cm�1 s�1 [22] up to 3.0 g cm�1 s�1.This alteration increases the slope of the edges of the weldpool, allowing the [1 0 0] dendrites to be active at deeper

T.D. Anderson et al. / Acta Materialia 58 (2010) 1441–1454 1449
pool depths. Since the thermal properties of a Ni-basesuperalloy are isotropic at the scale of fusion welding [7],the assumption is made that the pool shapes for welds con-ducted along the [1 1 0] and [1 2 0] crystal directions wereequivalent.
4.2. Single-crystal development
The case of SX growth significantly alters the magni-tudes and distributions of Ghkl and Vhkl across the solid–liquid interface due to the restrictions of dendrite growthalong the h1 0 0i crystal directions. The map of Gsl shownin Fig. 7a indicates that heat flow was greatest at the sur-face of the weld pool (in blue) and lowest at the weld root(in red). This distribution is consistent with higher convec-tive heat transfer near the surface than near the weld root.The effects of fluid flow within the liquid have clearlyimpacted the temperature fields within the pool. In thiscase, the convergence of fluid currents from the pool sur-face to the weld root induce higher temperatures in theliquid in this location, causing the relatively low tempera-ture gradients at the weld root. In addition, the applicationof SX weld development restrictions causes this region oflow G to expand further along the solid–liquid interface.Solidification in this region occurs vertically along the[0 0 1] crystal direction. By comparing the data fromFig. 7b with the dendrite growth directions in Fig. 4, it isshown that the low Ghkl (in red) spans the entire [0 0 1] zoneright up to the junctions with the [1 0 0] and [0 1 0] growthregions. This decrease in G up to the dendrite junctions iscaused by the steady increase in the w angle. Because thedendrite growth direction deviates from the solid–liquidinterface normal, the direction of maximum heat flowdirection will not coincide with the dendritic axis. Thiseffect causes Ghkl 6 Gsl. The effect is most pronounced atthe dendrite growth junctions, where w is greatest. More-over, the position of low Ghkl (in red) in the middle of
Fig. 9. Comparison of the magnitudes of the solidification parameters alongconditions: (a) temperature gradient and (b) solidification velocity.
the pool corresponds to the point at which all three growthregions converge. The importance of the dendrite growthjunctions is illustrated in Fig. 9a, which plots the magni-tudes of Gsl and Ghkl as a function of depth along the weldcenterline. Ghkl is always less than Gsl, and Ghkl reaches aminimum precisely at the location where the [0 0 1] and[1 0 0] dendrites meet.
The calculated growth rates in Fig. 8 show that SXgrowth mechanics also affect the distribution of solidifica-tion velocity. The growth rate of the solid–liquid interfaceVsl increases monotonically from the weld root to the weldcrown. This is caused by the curvature of the interface;regions in which the angle h is lower grow at a faster rate.SX growth does not counteract this trend, but it will affectthe magnitudes of the dendrite tip velocities throughout theweld pool. For the [1 0 0]||(0 0 1) orientation, all dendritesin the [1 0 0] zone solidify at the same rate, equal to the tra-vel speed. This is a result of the dendrites being parallel tothe travel speed, and hence h = w. The constant Vhkl in the[1 0 0] zone is also shown in Fig. 9b, which plots Vhkl andVsl as a function of weld pool depth along the weld center-line. This plot also illustrates that Vhkl P Vsl along theentire solid–liquid interface. Because SX growth restrictsthe dendrite growth directions to the h1 0 0i variants, therange of G and V which will determine the degree of con-stitutional supercooling (CS) along any point of thesolid–liquid interface will be altered. Fig. 9 shows thatGhkl 6 Gsl and Vhkl P Vsl. The degree of CS is modified,and Ghkl/Vhkl� Gsl/Vsl. Thus, the nucleation of equiaxedgrains in the liquid is actually promoted by SX develop-ment characteristics.
4.3. Stray grain formation
The calculated local Ghkl and Vhkl data serve as indica-tors of the tendency to form SGs at any point along thesolidifying solid–liquid interface. By collecting all of the
the weld centerline under polycrystalline and SX [1 0 0]||(0 0 1) growth

1450 T.D. Anderson et al. / Acta Materialia 58 (2010) 1441–1454
solidification parameter data from the entire solid–liquidinterface, predictions can be made about the fraction ofSGs that nucleate in the weld pool. The procedure usedin this research followed that of Vitek [10]. Eq. (2) wasrearranged to give the SG fraction / as a function of G
and V:
/ ¼ 1� exp�4pNo
3
1
ðnþ 1ÞðGn=aV Þ1=n
!38<:
9=;
¼ �2:356� 1019 V
G3:4
� �3=3:4
ð4Þ
The simplified equation on the right assumes the samematerial constants used by Vitek: a = 1.25 � 106
Kn m�1 s�1, n = 3.4, No = 2 � 1014 m�3. / was calculatedalong each point of the solid–liquid interface using the cal-culated Ghkl and Vhkl as inputs. As an example, two / mapsare presented in Fig. 10. The 250 W–95 mm s�1 map(Fig. 10a) represents a low heat input condition, and the500 W–6 mm s�1 map (Fig. 10b) signifies a weld with highheat input. The range of / shown in each map indicates theoverall SG formation characteristics for each condition.The low heat input generates a wide range of /, which onlyreaches unity at the weld crown. Conversely, a majority ofthe solid–liquid interface has / = 1 under a high heatinput. Thus, low-power/high-travel-speed conditions areuseful for helping to avoid SG formation and preserveSX solidification. Such generalizations about the effectsof welding parameters on SG formation can be expandedby calculating the SG volume fraction for the entire weldpool.
The overall SG formation behavior for the full weld canbe expressed by determining the area-weighted average /across the entire solid–liquid interface:
U ¼P
iAi/iPiAi
ð5Þ
Fig. 10. The predicted SG volume fraction parameter f along the solid–liquid in[1 0 0]–500 W–6 mm s�1 conditions.
where A and / are the area of a solid–liquid interface andSG area fraction for a particular location i. Since U takesinto account the entire solidification front, it is more indic-ative of SG formation than G/V, which varies throughoutthe weld pool. This value was calculated for each of the la-ser and EB welding conditions. The data is presented as afunction of welding parameters in Fig. 11.
The 1000 and 1500 W EB data are omitted, as thoseweld pool simulations did not accurately represent theexperimental welds. The results show the significant effectsthat welding parameters will have on SG formation. The Udata in Fig. 11 illustrates the negative effect that beampower will have on SG formation. The heightened beampower lowers G throughout the weld pool and promotesthe nucleation of equiaxed grains. The effect of travel speedis more complex. For powers 6250 W, SG formation isgenerally observed to reach a maximum at an intermediatetravel speeds. When P is high (P500 W EB), SG formationalways decreases as the travel speed increases. The transi-tion in behavior has been observed in other work [10]and can be explained based on the relative increases in tem-perature gradient and growth rate with changes in travelspeed. When the travel speed is low, initial increases inthe speed will cause an increase in the growth rate with onlyminor changes in the temperature gradient. As a result,G/V generally decreases, and the amount of SGs will there-fore increase. Further increases in the travel speed willinduce larger increases in the temperature gradient, and,according to Eqs. (3) and (4), G has a larger effect on SGformation than V. Thus, SG formation will subsequentlydecrease with further increases in the travel speed. Vitekperformed a theoretical analysis [10] of the effects of solid-ification parameters on /. Yis results were similar to thosepresented here in which decreases in power and increases intravel speed were generally beneficial. His results also dem-onstrated a transition in behavior for the same alloy at asimilar travel speed of �14 mm s�1.
terface of simulated weld pools for the (a) [100]–250 W–95 mm s�1 and (b)

Fig. 11. The effect of welding parameters on the predicted SG volume fraction within simulated (a) laser-beam and (b) EB weld pools for the [1 0 0]||(0 0 1)substrate orientation.
T.D. Anderson et al. / Acta Materialia 58 (2010) 1441–1454 1451
Fig. 12 shows the experimental measurements of SG frac-tion as a function of welding parameters. The experimentaldata shows similarities to the SG predictions made fromweld pool simulations. The effect of increasing power isshown in the EB weld data in Fig. 12b. The 1000 and1500 W data contained greater SG fractions at every travelspeed. Both sets of experimental data reveal a maximum SGfraction at an intermediate travel speed of �6 mm s�1.Although the magnitudes of the predicted SG fractionsare not accurate, the general effects of power and travelspeed on SG formation are captured by the model.
4.4. Parameter optimization
The calculated SG contents shown in Fig. 11 were pro-duced with the material constants and nuclei density deter-mined by Gaumann et al. [9]. In that work, the materialconstants a and n were chosen in order to make the result-ing CET boundary closely match previous calculationsconducted using rapid solidification models. The nucleidensity No was determined by fitting experimental SG data
Fig. 12. The effect of welding parameters on SG volume fraction within the exsubstrate orientation.
to the calculated solidification conditions in the weld pool.The solidification conditions for the weld pool were repre-sented using an average value of Gn/V (calculated using theRosenthal solution for conduction only) for six sets ofwelding parameters. Assuming that the values of G andV determined here are more accurate due to the moreadvanced heat/fluid flow model used, and considering thata wide range of experimental conditions have been investi-gated, an opportunity exists to potentially improve theaccuracy of the values of a, n and No. In order to optimizethese values, a parameter d was defined which describes theoverall deviation between the experimental and calculatedSG fractions:
d ¼X
i
ðUexp � UcalcÞ2 ð6Þ
If the calculated SG fraction perfectly matched theexperimental SG content for all welding conditions,d = 0. When using the constants defined by Gaumann,d = 3.74. The parameter optimization procedure was car-ried out in the following manner:
perimental (a) laser-beam and (b) EB weld structures for the [1 0 0]||(0 0 1)
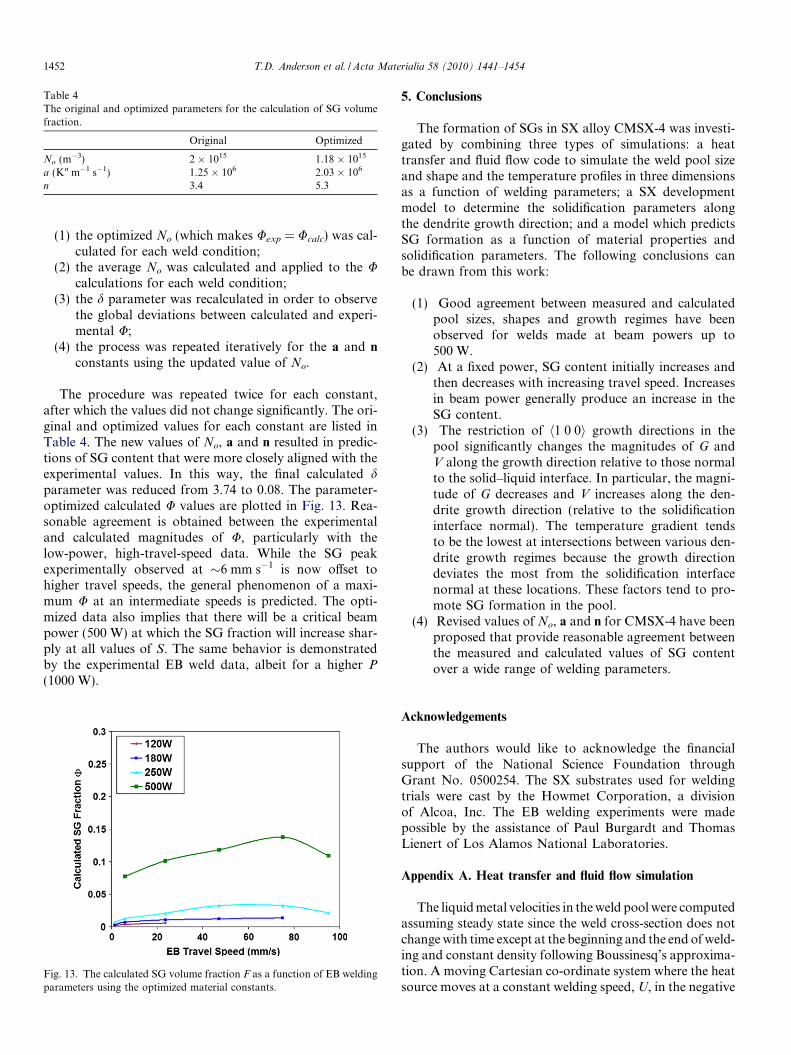
Table 4The original and optimized parameters for the calculation of SG volumefraction.
Original Optimized
No (m�3) 2 � 1015 1.18 � 1015
a (Kn m�1 s�1) 1.25 � 106 2.03 � 106
n 3.4 5.3
1452 T.D. Anderson et al. / Acta Materialia 58 (2010) 1441–1454
(1) the optimized No (which makes Uexp = Ucalc) was cal-culated for each weld condition;
(2) the average No was calculated and applied to the Ucalculations for each weld condition;
(3) the d parameter was recalculated in order to observethe global deviations between calculated and experi-mental U;
(4) the process was repeated iteratively for the a and n
constants using the updated value of No.
The procedure was repeated twice for each constant,after which the values did not change significantly. The ori-ginal and optimized values for each constant are listed inTable 4. The new values of No, a and n resulted in predic-tions of SG content that were more closely aligned with theexperimental values. In this way, the final calculated dparameter was reduced from 3.74 to 0.08. The parameter-optimized calculated U values are plotted in Fig. 13. Rea-sonable agreement is obtained between the experimentaland calculated magnitudes of U, particularly with thelow-power, high-travel-speed data. While the SG peakexperimentally observed at �6 mm s�1 is now offset tohigher travel speeds, the general phenomenon of a maxi-mum U at an intermediate speeds is predicted. The opti-mized data also implies that there will be a critical beampower (500 W) at which the SG fraction will increase shar-ply at all values of S. The same behavior is demonstratedby the experimental EB weld data, albeit for a higher P
(1000 W).
Fig. 13. The calculated SG volume fraction F as a function of EB weldingparameters using the optimized material constants.
5. Conclusions
The formation of SGs in SX alloy CMSX-4 was investi-gated by combining three types of simulations: a heattransfer and fluid flow code to simulate the weld pool sizeand shape and the temperature profiles in three dimensionsas a function of welding parameters; a SX developmentmodel to determine the solidification parameters alongthe dendrite growth direction; and a model which predictsSG formation as a function of material properties andsolidification parameters. The following conclusions canbe drawn from this work:
(1) Good agreement between measured and calculatedpool sizes, shapes and growth regimes have beenobserved for welds made at beam powers up to500 W.
(2) At a fixed power, SG content initially increases andthen decreases with increasing travel speed. Increasesin beam power generally produce an increase in theSG content.
(3) The restriction of h1 0 0i growth directions in thepool significantly changes the magnitudes of G andV along the growth direction relative to those normalto the solid–liquid interface. In particular, the magni-tude of G decreases and V increases along the den-drite growth direction (relative to the solidificationinterface normal). The temperature gradient tendsto be the lowest at intersections between various den-drite growth regimes because the growth directiondeviates the most from the solidification interfacenormal at these locations. These factors tend to pro-mote SG formation in the pool.
(4) Revised values of No, a and n for CMSX-4 have beenproposed that provide reasonable agreement betweenthe measured and calculated values of SG contentover a wide range of welding parameters.
Acknowledgements
The authors would like to acknowledge the financialsupport of the National Science Foundation throughGrant No. 0500254. The SX substrates used for weldingtrials were cast by the Howmet Corporation, a divisionof Alcoa, Inc. The EB welding experiments were madepossible by the assistance of Paul Burgardt and ThomasLienert of Los Alamos National Laboratories.
Appendix A. Heat transfer and fluid flow simulation
The liquid metal velocities in the weld pool were computedassuming steady state since the weld cross-section does notchange with time except at the beginning and the end of weld-ing and constant density following Boussinesq’s approxima-tion. A moving Cartesian co-ordinate system where the heatsource moves at a constant welding speed, U, in the negative

T.D. Anderson et al. / Acta Materialia 58 (2010) 1441–1454 1453
x-direction, was adapted. Under these conditions, themomentum conservation equations can be written as [25]:
q@ðuiujÞ@xi
¼ @
@xil@uj
@xi
� �� qU
@uj
@x1
� @p@xjþ qgjbðT � T rÞ þ Sj
ðA1Þwhere q is the density, xi is the distance along the i = 1, 2and 3 (same as x, y and z) directions, u is the velocity inthe direction of its subscript, l is the effective viscosity, p
is local pressure minus the hydrostatic pressure, gj is thegravitational acceleration, b is the coefficient of volumeexpansion, T is temperature, Tr is the reference tempera-ture and Sj is the source term given as:
Sj ¼ �cmð1� fLÞ2
f 3L
!uj þ
@
@xil@ui
@xj
� �ðA2Þ
where fL is the liquid fraction, cm is a constant that takesinto account mushy zone morphology. The first term onthe right-hand side represents the frictional dissipation inthe mushy zone according to the Carman–Kozeny equa-tion for flow through a porous media [26]. The value ofthe effective viscosity in Eq. (A1) is a property of the spe-cific welding system which is much higher than that ofthe molecular viscosity of the metal. The higher value al-lows accurate modeling of the high rates of transport ofmomentum in systems with strong fluctuating velocitiesin small weld pools [27]. The pressure field was obtainedby solving the following continuity equation simulta-neously with the momentum equation:
@ðquiÞ@xi
¼ 0 ðA3Þ
The enthalpy H is represented by a sum of sensible heath and latent heat content DH, i.e., H ¼ hþ DH , whereh ¼
RCpdT , Cp is the specific heat, DH ¼ fLL, L is the
latent heat of fusion and the liquid fraction, fL, in themushy zone is assumed to vary linearly with temperature.
The steady state transport of heat in the weld workpiececan be expressed by the following modified energyequation:
q@ðuihÞ@xi
¼ @
@xi
kCp
@h@xi
� �� q
@ðuiDHÞ@xi
� qU@h@x1
� qU@ðDHÞ@x1
ðA4Þwhere k is the thermal conductivity. In the liquid region,the value of the thermal conductivity in Eq. (A4) is takenas the effective thermal conductivity which is a propertyof the specific welding system and is much higher thanthe thermal conductivity of the liquid. The higher valueallows accurate modeling of the high rates of transport ofheat in systems with strong fluctuating velocities in theweld pool [27]. Since the weld is symmetrical about theweld center line only half of the workpiece is consideredand gradients of all variables are taken as zero. At thetop surface the velocity boundary conditions for the hori-zontal components of velocity, u and v, are obtained by
Marangoni boundary conditions given by Eqs. (A5a) and(A5b). Furthermore since there is no normal velocity onthe weld pool surface, the vertical component of velocity,w is zero as indicated in Eq. (A6).
l@u@z¼ fL
dcdT
@T@x
ðA5aÞ
l@v@z¼ fL
dcdT
@T@y
ðA5bÞ
w ¼ 0 ðA5cÞ
where dc/dT is the temperature coefficient of surface ten-sion. The heat flux at the top surface is given as:
k@T@z¼ dQg
pr2b
exp � dðx2 þ y2Þr2
b
� �� re T 4 � T 4
a
� �� hcðT � T aÞ
ðA6Þwhere rb is the arc radius, d is the arc power distributionfactor, Q is the total power, g is the absorptivity, r is theStefan–Boltzmann constant, hc is the heat transfer coeffi-cient, and Ta is the ambient temperature. The first termon the right-hand side is the heat input from the Gaussianheat source. The second and third terms represent the heatloss by radiation and convection, respectively. At all othersurfaces, temperatures are set at ambient temperature andall velocities are set to zero.
The governing equations were discretized in the follow-ing form using a control volume method involving non-uniform fixed grids and solved numerically [25]:
aP/P ¼X
nb
ðanb/nbÞ þ SUDV ðA7Þ
where / is a general variable such as velocity or enthalpy, a
is the coefficient of the variable, the subscript P represents agiven grid point, the subscript nb indicates the neighbors ofthe given grid point P, and DV is the control volume. Thecoefficient aP is defined as:
aP ¼X
nb
anb � SPDV ðA8Þ
The terms SU and SP are used in the source term linear-ization as:
S ¼ SU þ SP/P ðA9ÞThe system of equations expressed by Eq. (A8) were
solved by a Gaussian elimination technique known as tridi-agonal matrix algorithm (TDMA) [25]. Scalar grid pointswere located at the center of each control volume, whereasthe velocity components were staggered with respect to sca-lar locations to achieve improved stability and rapid con-vergence of numerical calculations. The discretizedequations were solved using SIMPLE algorithm [25]. usingconstant thermophysical properties and typically112 � 62 � 77 grids to make the calculations tractableand accurate.
Two convergence criteria were used, i.e., residuals andheat balance. The residuals for velocities and enthalpy weredefined as:

1454 T.D. Anderson et al. / Acta Materialia 58 (2010) 1441–1454
R ¼
Pdomain
Pnbðanb/nbÞþSU DV
aP� /P
��������P
domainj/P jðA10Þ
Converged solution was assumed when the residual, R,for each variable were very small, typically 10�4. In addi-tion, the following overall heat balance had to be satisfied:
h ¼ net heat input
total heat out
�������� ðA11Þ
Convergence was assumed when R 6 10�4 and0:99 6 h 6 1:01. More strict convergence criteria do notchange the final results but increase computational time.
References
[1] Harris K, Erickson GL, Sikkenga SL, Brentnall WD, AurrecoecheaJM, Kubarych KG. Development of the rhenium containing super-alloys CMSX-4 and CM-186LC for single crystal blade anddirectionally solidified vane applications in advanced turbine engines.Superalloys 1992:297–306.
[2] Webber J. Power industry experiences surge in welding research.Weld J 2003;82:40–3.
[3] Gallardo J, Rodriguez J, Herrera E. Wear 2002;252:264–8.[4] Hunt J. Mater Sci Eng 1984;65:75–83.[5] Rappaz M, David SA, Vitek JM, Boatner LA. Metall Mater Trans A
1989;20:1125–38.[6] David SA, Vitek JM, Rappaz M, Boatner LA. Metall Mater Trans A
1990;21:1753–66.[7] Rappaz M, David SA, Vitek JM, Boatner LA. Metall Mater Trans A
1990;21:1767–82.[8] Gaumann M, Trivedi R, Kurz W. Mater Sci Eng A 1997;226–
228:763–9.
[9] Gaumann M, Bezencon C, Canalis P, Kurz W. Acta Mater2001;49:1051–62.
[10] Vitek JM. Acta Mater 2005;53:53–67.[11] Rosenthal D. Trans ASME 1946;68:849–66.[12] Yoshihiro F, Saida K, Nishimoto K. Mater Sci Forum
2006;512(5):313–8.[13] Park JW, Babu SS, Vitek JM, Kenik EA, David SA. J Appl Phys
2003;94(6):4203–9.[14] Park JW, Vitek JM, Babu SS, David SA. Sci Technol Weld Join
2004;9(6):472–82.[15] Liu W, DuPont JN. Acta Mater 2004;52:4833–47.[16] Liu W, DuPont JN. Acta Mater 2005;53(5):1545–58.[17] Anderson TD, DuPont JN, DebRoy T. Metall Mater Trans A,
accepted for publication.[18] Anderson TD, DuPont JN. Stray grain formation and solidification
cracking susceptibility of single crystal Ni-base superalloy CMSX-4.Weld J, accepted for publication.
[19] Mundra K, DebRoy T, Kelkar K. Numer Heat Transfer, Part AApplications 1996;29(2):115–29.
[20] Zhang W, Kim CL, DebRoy T. J Appl Phys 2004;95:5210–9.[21] Li Z, Mills K, McLean M, Mukai K. Metall Mater Trans B
2005;36:247–54.[22] Aune R. Thermophysical properties of IN738LC, MM247LC and
CMSX-4 in the liquid and high temperature solid phase. Superalloys718, 625, 706 and Derivatives, ASM International, Materials Park,Ohio; 2005. p. 467–76.
[23] Hayashi M, Jakobsson A, Tanaka T, Seetharaman S. High TempHigh Press 2004;35–36:441–5.
[24] De A, DebRoy T. J Appl Phys 2004;95(9):5230–9.[25] Patankar SV. Numerical heat transfer and fluid flow. New
York: Hemisphere Publishing Corporation; 1982.[26] Brent AD, Voller VR, Reid KJ. Numer Heat Transfer
1988;13:297–318.[27] DebRoy T, Majumdar AK. J Metals 1981;33(11):42–7.