
Origin of additional capacities in metal oxide lithium-ion ... · 1 Supplementary Information On...
22
Yan-Yan Hu 1 , Zigeng Liu 1 , Kyung-Wan Nam 2 , Olaf J. Borkiewicz 3 , Jun Cheng 1 , Xiao Hua 1 , Matthew Dunstan 1 , Xiqian Yu 2 , Kamila M. Wiaderek 3 , Lin-Shu Du 4 , Karena W. Chapman 3 , Peter J. Chupas 3 , Xiao-Qing Yang 2 , Clare P. Grey 1,4* 1 Department of Chemistry, University of Cambridge, Cambridge CB2 1EW, UK 2 Chemistry Department, Brookhaven National Laboratory, NY 11973, USA 3 X-ray Science Division, Argonne National Laboratory, IL 60439, USA 4 Department of Chemistry, Stony Brook University, NY 11794, USA Table of Contents 1. Electrochemistry and in situ Xray powder diffraction/total scattering and absorption spectroscopy .............................................................................................. 2 1.1 Electrochemistry ............................................................................................................ 2 1.2 In situ Xray total scattering and PDF analysis ................................................................ 2 1.3 In situ XAS Measurements ............................................................................................. 4 1.4 The nature of the intermediate Li x RuO 2 phase................................................................ 5 1.5 Further experimental and processing details .................................................................. 6 2. NMR experiments ................................................................................................... 6 2.1 Spectral assignment ....................................................................................................... 7 2.1.1 1 H, 19 F 6,7 Li CrossPolarization (CP) vs. 6,7 Li Direct Polarization (DP) NMR .................... 7 2.1.2 Separating LiH/LiOH from MeOLi with 1 H 7 Li Crosspolarization ................................... 7 2.1.3 1 H 7 Li 2D heteronuclear correlation experiments to separate LiH/MeOLi from LiOH... 9 2.1.4 The use of 17 O NMR to separate Li 2 O from LiOH ......................................................... 10 2.3 Investigation of a LiOH/Li cell ....................................................................................... 13 2.4 Spatial proximity between phases................................................................................ 15 2.4.1 Direct measurement of spatial phase distributionTwodimensional exchange NMR 15 2.4.2 Indirect probe of spatial phase distribution: 6 Li T 1 relaxation time measurements .... 16 2.5 The Effect of Cell Relaxation on the Capacity and Chemical Species Observed .............. 17 2.6 NMR Experimental Details ........................................................................................... 18 3. First Principles Calculations .................................................................................... 19 3.1 Results and discussions ................................................................................................ 19 3.2 Calculation details ........................................................................................................ 20 References ................................................................................................................. 21 Origin of additional capacities in metal oxide lithium-ion battery electrodes SUPPLEMENTARY INFORMATION DOI: 10.1038/NMAT3784 NATURE MATERIALS | www.nature.com/naturematerials 1 © 2013 Macmillan Publishers Limited. All rights reserved.
Transcript of Origin of additional capacities in metal oxide lithium-ion ... · 1 Supplementary Information On...
1
Supplementary Information On the Cause of the Additional Capacities Seen in Metal Oxide Lithium-Ion Battery
Electrodes
Yan-Yan Hu1, Zigeng Liu1, Kyung-Wan Nam2, Olaf J. Borkiewicz3, Jun Cheng1, Xiao Hua1, Matthew Dunstan1, Xiqian Yu2, Kamila M. Wiaderek3, Lin-Shu Du4, Karena W. Chapman3, Peter J. Chupas3, Xiao-Qing Yang2, Clare P. Grey1,4* 1Department of Chemistry, University of Cambridge, Cambridge CB2 1EW, UK 2Chemistry Department, Brookhaven National Laboratory, NY 11973, USA 3X-ray Science Division, Argonne National Laboratory, IL 60439, USA 4Department of Chemistry, Stony Brook University, NY 11794, USA Table of Contents
1. Electrochemistry and in situ X-‐ray powder diffraction/total scattering and absorption spectroscopy .............................................................................................. 2
1.1 Electrochemistry ............................................................................................................ 2 1.2 In situ X-‐ray total scattering and PDF analysis ................................................................ 2 1.3 In situ XAS Measurements ............................................................................................. 4 1.4 The nature of the intermediate LixRuO2 phase ................................................................ 5 1.5 Further experimental and processing details .................................................................. 6
2. NMR experiments ................................................................................................... 6 2.1 Spectral assignment ....................................................................................................... 7
2.1.1 1H, 19F -‐6,7Li Cross-‐Polarization (CP) vs. 6,7Li Direct Polarization (DP) NMR .................... 7 2.1.2 Separating LiH/LiOH from MeOLi with 1H-‐7Li Cross-‐polarization ................................... 7 2.1.3 1H-‐7Li 2D heteronuclear correlation experiments to separate LiH/MeOLi from LiOH ... 9 2.1.4 The use of 17O NMR to separate Li2O from LiOH ......................................................... 10
2.3 Investigation of a LiOH/Li cell ....................................................................................... 13 2.4 Spatial proximity between phases ................................................................................ 15
2.4.1 Direct measurement of spatial phase distribution-‐Two-‐dimensional exchange NMR 15 2.4.2 Indirect probe of spatial phase distribution: 6Li T1 relaxation time measurements .... 16
2.5 The Effect of Cell Relaxation on the Capacity and Chemical Species Observed .............. 17 2.6 NMR Experimental Details ........................................................................................... 18
3. First Principles Calculations .................................................................................... 19 3.1 Results and discussions ................................................................................................ 19 3.2 Calculation details ........................................................................................................ 20
References ................................................................................................................. 21
Origin of additional capacities in metal oxide lithium-ion battery electrodes
SUPPLEMENTARY INFORMATIONDOI: 10.1038/NMAT3784
NATURE MATERIALS | www.nature.com/naturematerials 1
© 2013 Macmillan Publishers Limited. All rights reserved.

2
1. Electrochemistry and in situ X-ray powder diffraction/total scattering and absorption spectroscopy 1.1 Electrochemistry
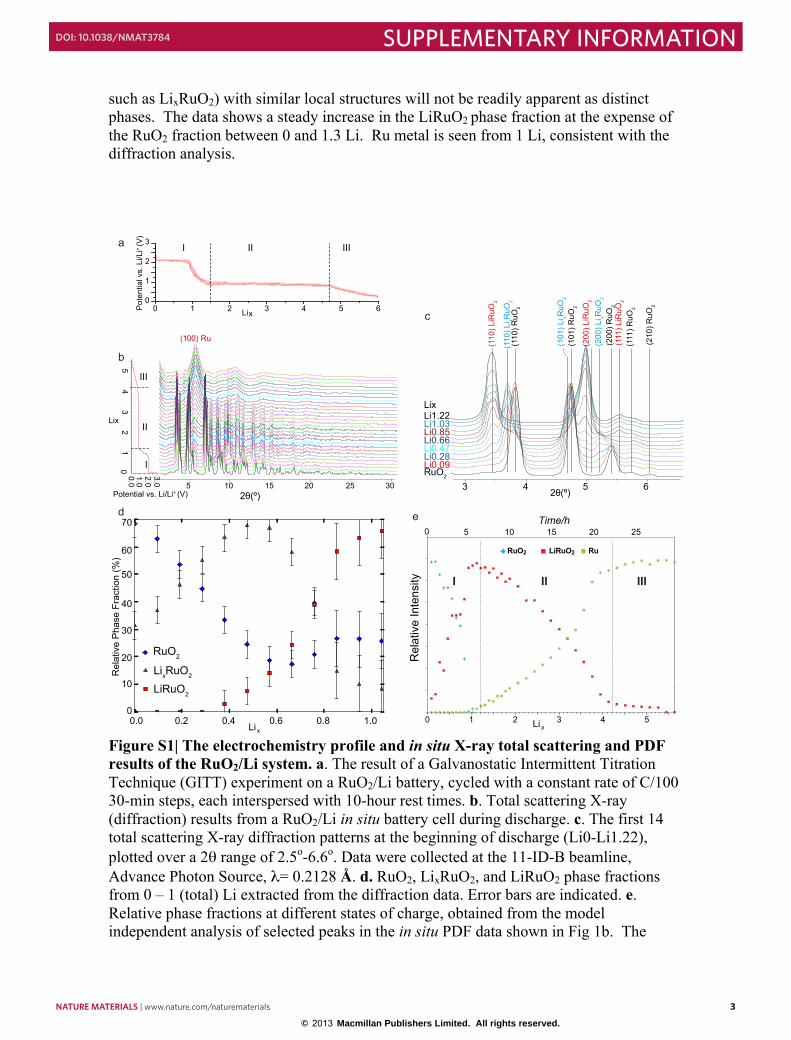
Galvanostatic Intermittent Titration Technique (GITT) experiments on the RuO2/Li cell (Fig. S1a) were performed that indicate that after insertion of 0.04 Li, a process with a flat voltage profile is observed with an equilibrium voltage of 2.16 V, until a total of 0.76 Li is consumed. This is followed by a sloping-voltage region between 0.76 and 1.3 Li, consistent with prior studies. 1 The conversion reaction from LiRuO2 to Li2O and Ru occurs at a voltage between 1-0.9 V, which is followed by a gradual decrease in voltage until the end of discharge. 1.2 In situ X-ray total scattering and PDF analysis
In situ X-ray total scattering (diffraction, XRD) data suitable for PDF analysis were collected on the RuO2/Li battery system during discharge (Fig. S1b). These data were optimized to span a wide Q-range, as required for quantitative PDFs with high real-space resolution and, accordingly, the Q-resolution of the diffraction data is moderate. The transformation of RuO2 to LiRuO2 is clearly observed between 0 and 1.3 Li, which is followed by the growth of a broader series of reflections from the Ru nanoparticles. Careful inspection of the data revealed the formation of the intermediate phase LixRuO2, (see Fig. S1c) between 0.3 – 0.8 Li. No noticeable changes are seen at the end of the discharge (between 4 and 5.6 Li).
Detailed analysis of the XRD data was performed between 0 and 1 Li to quantify
the relative abundance of the RuO2, LixRuO2 and LiRuO2 phases. Refinements of the data, modeling only these three phases (tetragonal RuO2, tetragonal LixRuO2 and orthorhombic LiRuO2) showed the coexistence of RuO2 and LixRuO2 at the early stages, with a maximum abundance of LixRuO2 at x = 0.47 – 0.57 (see Fig. S1d). The LiRuO2 fraction grows after approximately 0.28 Li. All three phases are evident between 0.28 – 0.76 Li. LixRuO2 and RuO2 coexist at 0.76 Li and beyond this only a minor amount of residual RuO2. Beyond 1 Li, growth of metallic Ru reflections, which overlap with the LixRuO2/RuO2 reflections, limits the reliability of the LixRuO2/RuO2 phase fraction determination.
A model independent analysis of the intensity of selected Ru-Ru and Ru-O peaks in the in-situ PDF data (Fig. 1b) derived from the total scattering data in Figure S1b attributed to either a RuO2, LiRuO2 or Ru-like phase was performed to quantify the phase composition at different states of charge of the RuO2/Li cell (Fig. S1e). Only peaks with minimal overlap with other correlations were selected for the analysis, thus only data from the very low r part of the PDF (below 4.7 Å) were used. The evolution of 2 peaks was monitored for each phase. Due to the scattering power of the various atoms involved, and the short range over which the data was analyzed, the approach is principally sensitive to the evolution of the local Ru structure. Only phases with distinct local structures can be reliably distinguished in this way. Phases (i.e. a reaction intermediate
3
such as LixRuO2) with similar local structures will not be readily apparent as distinct phases. The data shows a steady increase in the LiRuO2 phase fraction at the expense of the RuO2 fraction between 0 and 1.3 Li. Ru metal is seen from 1 Li, consistent with the diffraction analysis.
Figure S1| The electrochemistry profile and in situ X-ray total scattering and PDF results of the RuO2/Li system. a. The result of a Galvanostatic Intermittent Titration Technique (GITT) experiment on a RuO2/Li battery, cycled with a constant rate of C/100 30-min steps, each interspersed with 10-hour rest times. b. Total scattering X-ray (diffraction) results from a RuO2/Li in situ battery cell during discharge. c. The first 14 total scattering X-ray diffraction patterns at the beginning of discharge (Li0-Li1.22), plotted over a 2θ range of 2.5o-6.6o. Data were collected at the 11-ID-B beamline, Advance Photon Source, λ= 0.2128 Å. d. RuO2, LixRuO2, and LiRuO2 phase fractions from 0 – 1 (total) Li extracted from the diffraction data. Error bars are indicated. e. Relative phase fractions at different states of charge, obtained from the model independent analysis of selected peaks in the in situ PDF data shown in Fig 1b. The
(11
0)
LiR
uO
2
(100) Ru
(11
0)
Li xR
uO
2
(11
0)
Ru
O2
(20
0)
LiR
uO
2
(10
1)
Li xR
uO
2
(10
1)
Ru
O2
(20
0)
Ru
O2
(111
) R
uO
2
(21
0)
Ru
O2
(20
0)
Li xR
uO
2
(111
) L
iRu
O2
a
b
c
de
Li0.09
3.0
2.0
1.0
0.0
54
32
1
0
0 1 2 3 4 5 6Lix
Lix
0
1
2
3
Po
ten
tia
l vs.
Li/L
i+ (V
)
5 10 15 20 25 30 52θ(º)2θ(º)
643
RuO2
Li0.28Li0.47Li0.66Li0.85Li1.03Li1.22
Lix
I
I
II
III
II III
RuO2 LiRuO2 Ru
Re
lative
In
ten
sity
I II III
543210
2520151050
Time/h
LixLix
RuO2
LiRuO2
LixRuO2
0.20.0
0
10
20
30
40
50
60
70
Rela
tive P
hase F
raction (
%)
0.4 0.6 0.8 1.0
Potential vs. Li/Li+ (V)
2 NATURE MATERIALS | www.nature.com/naturematerials
SUPPLEMENTARY INFORMATION DOI: 10.1038/NMAT3784
© 2013 Macmillan Publishers Limited. All rights reserved.
2
1. Electrochemistry and in situ X-ray powder diffraction/total scattering and absorption spectroscopy 1.1 Electrochemistry
Galvanostatic Intermittent Titration Technique (GITT) experiments on the RuO2/Li cell (Fig. S1a) were performed that indicate that after insertion of 0.04 Li, a process with a flat voltage profile is observed with an equilibrium voltage of 2.16 V, until a total of 0.76 Li is consumed. This is followed by a sloping-voltage region between 0.76 and 1.3 Li, consistent with prior studies. 1 The conversion reaction from LiRuO2 to Li2O and Ru occurs at a voltage between 1-0.9 V, which is followed by a gradual decrease in voltage until the end of discharge. 1.2 In situ X-ray total scattering and PDF analysis
In situ X-ray total scattering (diffraction, XRD) data suitable for PDF analysis were collected on the RuO2/Li battery system during discharge (Fig. S1b). These data were optimized to span a wide Q-range, as required for quantitative PDFs with high real-space resolution and, accordingly, the Q-resolution of the diffraction data is moderate. The transformation of RuO2 to LiRuO2 is clearly observed between 0 and 1.3 Li, which is followed by the growth of a broader series of reflections from the Ru nanoparticles. Careful inspection of the data revealed the formation of the intermediate phase LixRuO2, (see Fig. S1c) between 0.3 – 0.8 Li. No noticeable changes are seen at the end of the discharge (between 4 and 5.6 Li).
Detailed analysis of the XRD data was performed between 0 and 1 Li to quantify
the relative abundance of the RuO2, LixRuO2 and LiRuO2 phases. Refinements of the data, modeling only these three phases (tetragonal RuO2, tetragonal LixRuO2 and orthorhombic LiRuO2) showed the coexistence of RuO2 and LixRuO2 at the early stages, with a maximum abundance of LixRuO2 at x = 0.47 – 0.57 (see Fig. S1d). The LiRuO2 fraction grows after approximately 0.28 Li. All three phases are evident between 0.28 – 0.76 Li. LixRuO2 and RuO2 coexist at 0.76 Li and beyond this only a minor amount of residual RuO2. Beyond 1 Li, growth of metallic Ru reflections, which overlap with the LixRuO2/RuO2 reflections, limits the reliability of the LixRuO2/RuO2 phase fraction determination.
A model independent analysis of the intensity of selected Ru-Ru and Ru-O peaks in the in-situ PDF data (Fig. 1b) derived from the total scattering data in Figure S1b attributed to either a RuO2, LiRuO2 or Ru-like phase was performed to quantify the phase composition at different states of charge of the RuO2/Li cell (Fig. S1e). Only peaks with minimal overlap with other correlations were selected for the analysis, thus only data from the very low r part of the PDF (below 4.7 Å) were used. The evolution of 2 peaks was monitored for each phase. Due to the scattering power of the various atoms involved, and the short range over which the data was analyzed, the approach is principally sensitive to the evolution of the local Ru structure. Only phases with distinct local structures can be reliably distinguished in this way. Phases (i.e. a reaction intermediate
3
such as LixRuO2) with similar local structures will not be readily apparent as distinct phases. The data shows a steady increase in the LiRuO2 phase fraction at the expense of the RuO2 fraction between 0 and 1.3 Li. Ru metal is seen from 1 Li, consistent with the diffraction analysis.
Figure S1| The electrochemistry profile and in situ X-ray total scattering and PDF results of the RuO2/Li system. a. The result of a Galvanostatic Intermittent Titration Technique (GITT) experiment on a RuO2/Li battery, cycled with a constant rate of C/100 30-min steps, each interspersed with 10-hour rest times. b. Total scattering X-ray (diffraction) results from a RuO2/Li in situ battery cell during discharge. c. The first 14 total scattering X-ray diffraction patterns at the beginning of discharge (Li0-Li1.22), plotted over a 2θ range of 2.5o-6.6o. Data were collected at the 11-ID-B beamline, Advance Photon Source, λ= 0.2128 Å. d. RuO2, LixRuO2, and LiRuO2 phase fractions from 0 – 1 (total) Li extracted from the diffraction data. Error bars are indicated. e. Relative phase fractions at different states of charge, obtained from the model independent analysis of selected peaks in the in situ PDF data shown in Fig 1b. The
(11
0)
LiR
uO
2
(100) Ru
(11
0)
Li xR
uO
2
(11
0)
Ru
O2
(20
0)
LiR
uO
2
(10
1)
Li xR
uO
2
(10
1)
Ru
O2
(20
0)
Ru
O2
(111
) R
uO
2
(21
0)
Ru
O2
(20
0)
Li xR
uO
2
(111
) L
iRu
O2
a
b
c
de
Li0.09
3.0
2.0
1.0
0.0
54
32
1
0
0 1 2 3 4 5 6Lix
Lix
0
1
2
3
Po
ten
tia
l vs.
Li/L
i+ (V
)
5 10 15 20 25 30 52θ(º)2θ(º)
643
RuO2
Li0.28Li0.47Li0.66Li0.85Li1.03Li1.22
Lix
I
I
II
III
II III
RuO2 LiRuO2 Ru
Re
lative
In
ten
sity
I II III
543210
2520151050
Time/h
LixLix
RuO2
LiRuO2
LixRuO2
0.20.0
0
10
20
30
40
50
60
70
Rela
tive P
hase F
raction (
%)
0.4 0.6 0.8 1.0
Potential vs. Li/Li+ (V)
NATURE MATERIALS | www.nature.com/naturematerials 3
SUPPLEMENTARY INFORMATIONDOI: 10.1038/NMAT3784
© 2013 Macmillan Publishers Limited. All rights reserved.
4
relative phase fractions have been normalized to the maximum intensity of each component.
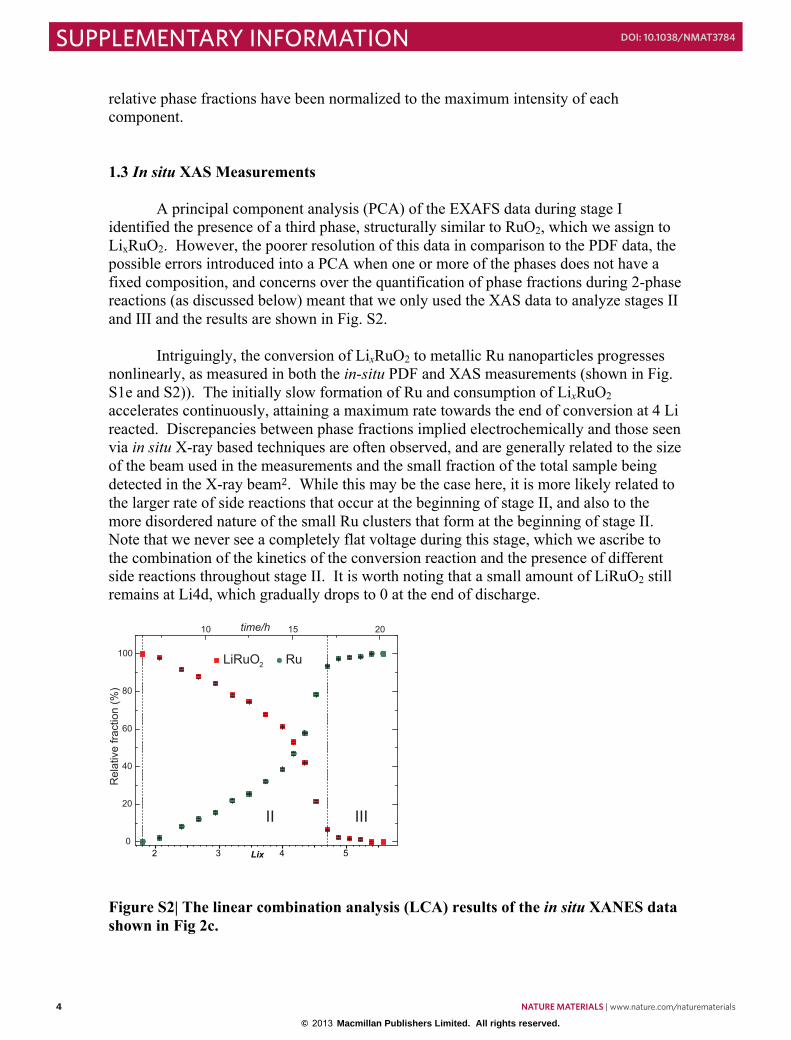
1.3 In situ XAS Measurements A principal component analysis (PCA) of the EXAFS data during stage I identified the presence of a third phase, structurally similar to RuO2, which we assign to LixRuO2. However, the poorer resolution of this data in comparison to the PDF data, the possible errors introduced into a PCA when one or more of the phases does not have a fixed composition, and concerns over the quantification of phase fractions during 2-phase reactions (as discussed below) meant that we only used the XAS data to analyze stages II and III and the results are shown in Fig. S2.
Intriguingly, the conversion of LixRuO2 to metallic Ru nanoparticles progresses
nonlinearly, as measured in both the in-situ PDF and XAS measurements (shown in Fig. S1e and S2)). The initially slow formation of Ru and consumption of LixRuO2 accelerates continuously, attaining a maximum rate towards the end of conversion at 4 Li reacted. Discrepancies between phase fractions implied electrochemically and those seen via in situ X-ray based techniques are often observed, and are generally related to the size of the beam used in the measurements and the small fraction of the total sample being detected in the X-ray beam2. While this may be the case here, it is more likely related to the larger rate of side reactions that occur at the beginning of stage II, and also to the more disordered nature of the small Ru clusters that form at the beginning of stage II. Note that we never see a completely flat voltage during this stage, which we ascribe to the combination of the kinetics of the conversion reaction and the presence of different side reactions throughout stage II. It is worth noting that a small amount of LiRuO2 still remains at Li4d, which gradually drops to 0 at the end of discharge.
Figure S2| The linear combination analysis (LCA) results of the in situ XANES data shown in Fig 2c.
10 15 20
0
20
40
60
80
100
III
LiRuO2
Ru
Rela
tive fra
ction (
%)
time/h
II
5432 Lix
5
1.4 The nature of the intermediate LixRuO2 phase
The electrochemical (GITT), in situ XRD, XAS, and NMR data all indicate that the transformation from RuO2 to LiRuO2 upon Li insertion occurs via an intermediate phase LixRuO2. For example, the solid-state 17O NMR spectra in Fig. 3 reveal an O local environment (the broad resonance at 820 ppm in the spectrum of Li0.5d) that is different from that of either RuO2 or LiRuO2, suggesting an intermediate phase LixRuO2. This phase is clearly seen by diffraction (Fig. S1c).
Earlier work has suggested that the value of x in LixRuO2 is sample dependent, but its value has not been definitively established.3 Unfortunately, an accurate value of x is not readily extracted from the in situ XRD data for a number of reasons. First, our NMR results suggest that SEI formation is occurring even during the higher (2.1 V) voltage process meaning that it is difficult to directly correlate the amount of Li insertion (measured electrochemically) with the value of x. (This also explains why 1.3 Li ions are consumed during the reaction of RuO2 to form LiRuO2.) Second, work by Baudrin and coworkers for 5 – 7 nm RuO2 particles has shown that this phase coexists with LiRuO2 and RuO2 from 0.44 Li to 0.57 Li insertion, and with LiRuO2 only between 0.57 Li to 0.83 Li based on a total of 1.2 Li insertion/reaction during the 2.1 – 1.5 V region. 3 This three-phase coexistence is confirmed in the current work, three-phase coexistence being observed in the total scattering data after 0.28 Li insertion (Fig. S1c). The three-phase coexistence means that it is very difficult to determine the value of x unless very careful phase quantification is performed. Recent in situ XRD studies of the LiFePO4 to FePO4 highlight the challenge in determining phase fractions in situ since the volume sampled by the X-ray beam is generally much smaller than the total sample volume. 2 In two-phase reactions in particular, there is no driving force for equilibration across the electrode and small differences in cell pressure or interactions with the X-ray beam (for example) can result in distributions in reaction state. This has two implications: i. phase quantification may not be possible unless the whole sample is analyzed or the reaction proceeds uniformly over the electrode; ii. incomplete sampling of the electrode may explain some of the differences in phase evolution observed between our in situ XRD/PDF and XAS results and those of Baudrin and coworkers3 and between our own data sets when using different cell designs.
Assuming that the phase fractions probed by the total scattering experiment
(where the reaction is believed to proceed uniformly across the electrode due to uniform application of cell pressure and minimal interaction with the high energy X-ray beam) are indeed representative of the electrochemical reaction and ignoring errors in Li content due to SEI formation, the relative phase fractions of the three phases between 0 and 0.7 Li suggest that the composition of LixRuO2 is approximately 0.5 Li. However, the consumption of 0.3 Li to form the SEI indicates that its composition may be as low as 0.2 Li.
4 NATURE MATERIALS | www.nature.com/naturematerials
SUPPLEMENTARY INFORMATION DOI: 10.1038/NMAT3784
© 2013 Macmillan Publishers Limited. All rights reserved.
4
relative phase fractions have been normalized to the maximum intensity of each component.
1.3 In situ XAS Measurements A principal component analysis (PCA) of the EXAFS data during stage I identified the presence of a third phase, structurally similar to RuO2, which we assign to LixRuO2. However, the poorer resolution of this data in comparison to the PDF data, the possible errors introduced into a PCA when one or more of the phases does not have a fixed composition, and concerns over the quantification of phase fractions during 2-phase reactions (as discussed below) meant that we only used the XAS data to analyze stages II and III and the results are shown in Fig. S2.
Intriguingly, the conversion of LixRuO2 to metallic Ru nanoparticles progresses
nonlinearly, as measured in both the in-situ PDF and XAS measurements (shown in Fig. S1e and S2)). The initially slow formation of Ru and consumption of LixRuO2 accelerates continuously, attaining a maximum rate towards the end of conversion at 4 Li reacted. Discrepancies between phase fractions implied electrochemically and those seen via in situ X-ray based techniques are often observed, and are generally related to the size of the beam used in the measurements and the small fraction of the total sample being detected in the X-ray beam2. While this may be the case here, it is more likely related to the larger rate of side reactions that occur at the beginning of stage II, and also to the more disordered nature of the small Ru clusters that form at the beginning of stage II. Note that we never see a completely flat voltage during this stage, which we ascribe to the combination of the kinetics of the conversion reaction and the presence of different side reactions throughout stage II. It is worth noting that a small amount of LiRuO2 still remains at Li4d, which gradually drops to 0 at the end of discharge.
Figure S2| The linear combination analysis (LCA) results of the in situ XANES data shown in Fig 2c.
10 15 20
0
20
40
60
80
100
III
LiRuO2
Ru
Rela
tive fra
ction (
%)
time/h
II
5432 Lix
5
1.4 The nature of the intermediate LixRuO2 phase
The electrochemical (GITT), in situ XRD, XAS, and NMR data all indicate that the transformation from RuO2 to LiRuO2 upon Li insertion occurs via an intermediate phase LixRuO2. For example, the solid-state 17O NMR spectra in Fig. 3 reveal an O local environment (the broad resonance at 820 ppm in the spectrum of Li0.5d) that is different from that of either RuO2 or LiRuO2, suggesting an intermediate phase LixRuO2. This phase is clearly seen by diffraction (Fig. S1c).
Earlier work has suggested that the value of x in LixRuO2 is sample dependent, but its value has not been definitively established.3 Unfortunately, an accurate value of x is not readily extracted from the in situ XRD data for a number of reasons. First, our NMR results suggest that SEI formation is occurring even during the higher (2.1 V) voltage process meaning that it is difficult to directly correlate the amount of Li insertion (measured electrochemically) with the value of x. (This also explains why 1.3 Li ions are consumed during the reaction of RuO2 to form LiRuO2.) Second, work by Baudrin and coworkers for 5 – 7 nm RuO2 particles has shown that this phase coexists with LiRuO2 and RuO2 from 0.44 Li to 0.57 Li insertion, and with LiRuO2 only between 0.57 Li to 0.83 Li based on a total of 1.2 Li insertion/reaction during the 2.1 – 1.5 V region. 3 This three-phase coexistence is confirmed in the current work, three-phase coexistence being observed in the total scattering data after 0.28 Li insertion (Fig. S1c). The three-phase coexistence means that it is very difficult to determine the value of x unless very careful phase quantification is performed. Recent in situ XRD studies of the LiFePO4 to FePO4 highlight the challenge in determining phase fractions in situ since the volume sampled by the X-ray beam is generally much smaller than the total sample volume. 2 In two-phase reactions in particular, there is no driving force for equilibration across the electrode and small differences in cell pressure or interactions with the X-ray beam (for example) can result in distributions in reaction state. This has two implications: i. phase quantification may not be possible unless the whole sample is analyzed or the reaction proceeds uniformly over the electrode; ii. incomplete sampling of the electrode may explain some of the differences in phase evolution observed between our in situ XRD/PDF and XAS results and those of Baudrin and coworkers3 and between our own data sets when using different cell designs.
Assuming that the phase fractions probed by the total scattering experiment
(where the reaction is believed to proceed uniformly across the electrode due to uniform application of cell pressure and minimal interaction with the high energy X-ray beam) are indeed representative of the electrochemical reaction and ignoring errors in Li content due to SEI formation, the relative phase fractions of the three phases between 0 and 0.7 Li suggest that the composition of LixRuO2 is approximately 0.5 Li. However, the consumption of 0.3 Li to form the SEI indicates that its composition may be as low as 0.2 Li.
NATURE MATERIALS | www.nature.com/naturematerials 5
SUPPLEMENTARY INFORMATIONDOI: 10.1038/NMAT3784
© 2013 Macmillan Publishers Limited. All rights reserved.
6
The GITT results suggest that very different processes are occurring beyond 0.76 Li. The change in voltage profile is tentatively ascribed to the end of the RuO2-LixRuO2 (and three phase) equilibrium and the onset of the equilibrium between the LixRuO2 and LiRuO2 phases only. Between 0 and 0.76 Li, we suggest that the voltage is defined by the RuO2 – LixRuO2 equilibrium. While further reaction of the LixRuO2 must occur to form LiRuO2, but this will occur via the disproportionation of LixRuO2 to form RuO2 and LiRuO2, and this will not determine (i.e., control) the measured voltage. The RuO2 –> LiRuO2 and LixRuO2 –> LiRuO2 lithiation processes involve much larger changes in cell volume than the RuO2-LixRuO2 process (and a change in space group) and should be kinetically more difficult, explaining the formation of the metastable LixRuO2 phase (or buffer phase, the term coined by Ohzuku et al. 1). The work of Baudrin and coworkers3 suggests that LiRuO2 can tolerate a degree of solid solution, which may account for some of the slope observed in the voltage curve ascribed to the LixRuO2 – LiRuO2 process beyond 0.76 Li. The onset of the LiOH reaction (involving RuO2.yH2O) may also be important since the process is no longer a simple two phase-reaction and can thus occur with a varying potential. Further calculations are in progress to understand the thermodynamics of these processes in greater detail. 1.5 Further experimental and processing details The experimental details for the in situ total scattering and XAS data can be found in the “methods” section of the main text.
The XAS data shown in the main text were processed using the Athena and Artemis programs. 5 The extracted EXAFS signal, χ(k), was weighted by k2 to emphasize the high-energy oscillations and then Fourier-transformed in a k-range from 3.8 ~ 15.6 Å-1 using a Hanning termination window to obtain the magnitude plots of the EXAFS spectra in a R-space (Å). The filtered Fourier transforms of EXAFS spectra in the R range from 1.1 to 3.7 Å were then fitted using theoretical scattering paths generated with the FEFF 6.0 ab initio simulation code 5 and rutile RuO2 and orthorhombic LiRuO2 crystallographic information. The amplitude reduction factor, S0
2, was determined to be 0.85 from the preliminary fitting sessions. The bond distance (r), inner shell potential shift (ΔE), and Debye-Waller factor (i.e., mean square disorder) (σ2) for each path were refined during fitting while the coordination numbers were fixed to a crystallographic value.
All the in situ acquisitions were carried out while the electric current was on. The
change in Li fraction in the electrode during each operando acquisition is negligible, i.e., 0.005 Li (0.09% of total Li input) for the PDF analysis and 0.093 Li (1.7% of total Li input) for the X-ray absorption measurement. Note: the total Li input/consumption over the whole discharge range was 5.6 Li. 2. NMR experiments
NMR spectra are presented below, in addition to those in the main text, in support of the spectral assignments and to help in the quantification. Further evidence is provided to confirm the feasibility of the proposed reaction, LiOH + 2Li = LiH + Li2O, that accounting for a major part of the additional capacity.
7
2.1 Spectral assignment Various one-dimensional (1D) and two-dimensional (2D) NMR heteronuclear correlation NMR experiments were carried out to obtain high-resolution NMR spectra and probe the connectivity at the atomic level; these experiments help substantiate the spectral assignments presented in the main text. 2.1.1 1H, 19F -6,7Li Cross-Polarization (CP) vs. 6,7Li Direct Polarization (DP) NMR
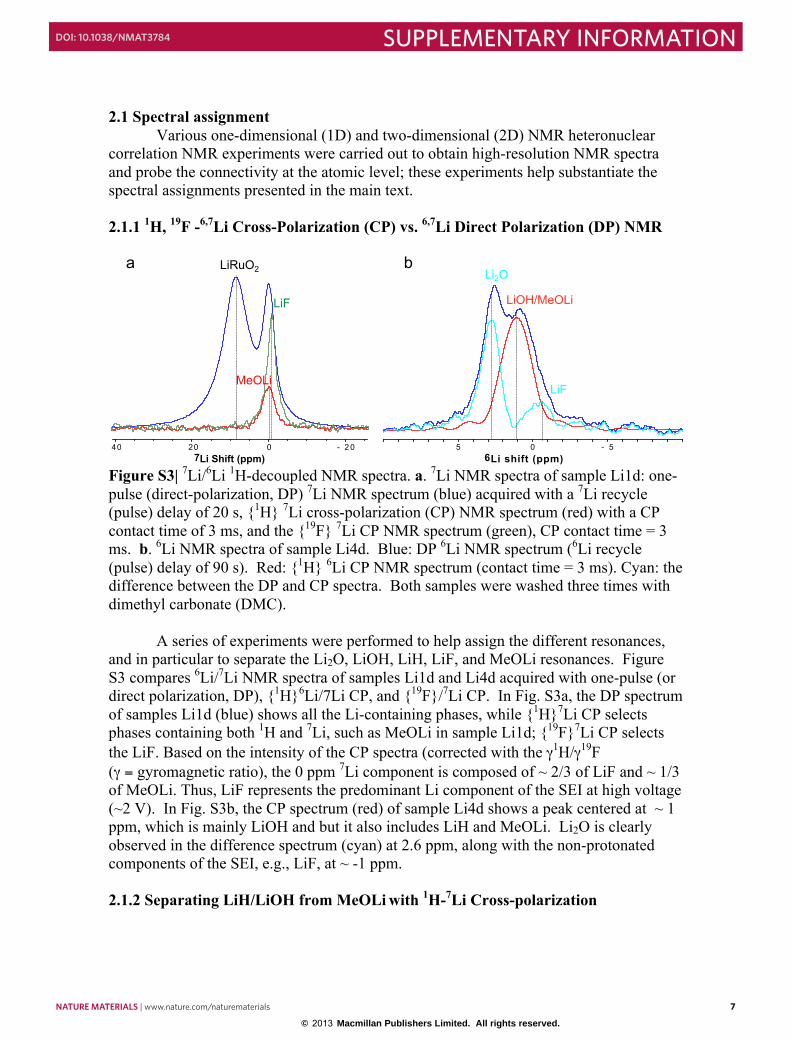
Figure S3| 7Li/6Li 1H-decoupled NMR spectra. a. 7Li NMR spectra of sample Li1d: one-pulse (direct-polarization, DP) 7Li NMR spectrum (blue) acquired with a 7Li recycle (pulse) delay of 20 s, {1H} 7Li cross-polarization (CP) NMR spectrum (red) with a CP contact time of 3 ms, and the {19F} 7Li CP NMR spectrum (green), CP contact time = 3 ms. b. 6Li NMR spectra of sample Li4d. Blue: DP 6Li NMR spectrum (6Li recycle (pulse) delay of 90 s). Red: {1H} 6Li CP NMR spectrum (contact time = 3 ms). Cyan: the difference between the DP and CP spectra. Both samples were washed three times with dimethyl carbonate (DMC).
A series of experiments were performed to help assign the different resonances, and in particular to separate the Li2O, LiOH, LiH, LiF, and MeOLi resonances. Figure S3 compares 6Li/7Li NMR spectra of samples Li1d and Li4d acquired with one-pulse (or direct polarization, DP), {1H}6Li/7Li CP, and {19F}/7Li CP. In Fig. S3a, the DP spectrum of samples Li1d (blue) shows all the Li-containing phases, while {1H}7Li CP selects phases containing both 1H and 7Li, such as MeOLi in sample Li1d; {19F}7Li CP selects the LiF. Based on the intensity of the CP spectra (corrected with the γ1H/γ19F (γ = gyromagnetic ratio), the 0 ppm 7Li component is composed of ~ 2/3 of LiF and ~ 1/3 of MeOLi. Thus, LiF represents the predominant Li component of the SEI at high voltage (~2 V). In Fig. S3b, the CP spectrum (red) of sample Li4d shows a peak centered at ~ 1 ppm, which is mainly LiOH and but it also includes LiH and MeOLi. Li2O is clearly observed in the difference spectrum (cyan) at 2.6 ppm, along with the non-protonated components of the SEI, e.g., LiF, at ~ -1 ppm. 2.1.2 Separating LiH/LiOH from MeOLi with 1H-7Li Cross-polarization
5 0 - 5 6Li shift (ppm)
LiOH/MeOLi
LiF
Li2O
40 20 0 - 2 0
LiRuO2
LiF
MeOLi
7Li Shift (ppm)
a b
6 NATURE MATERIALS | www.nature.com/naturematerials
SUPPLEMENTARY INFORMATION DOI: 10.1038/NMAT3784
© 2013 Macmillan Publishers Limited. All rights reserved.
6
The GITT results suggest that very different processes are occurring beyond 0.76 Li. The change in voltage profile is tentatively ascribed to the end of the RuO2-LixRuO2 (and three phase) equilibrium and the onset of the equilibrium between the LixRuO2 and LiRuO2 phases only. Between 0 and 0.76 Li, we suggest that the voltage is defined by the RuO2 – LixRuO2 equilibrium. While further reaction of the LixRuO2 must occur to form LiRuO2, but this will occur via the disproportionation of LixRuO2 to form RuO2 and LiRuO2, and this will not determine (i.e., control) the measured voltage. The RuO2 –> LiRuO2 and LixRuO2 –> LiRuO2 lithiation processes involve much larger changes in cell volume than the RuO2-LixRuO2 process (and a change in space group) and should be kinetically more difficult, explaining the formation of the metastable LixRuO2 phase (or buffer phase, the term coined by Ohzuku et al. 1). The work of Baudrin and coworkers3 suggests that LiRuO2 can tolerate a degree of solid solution, which may account for some of the slope observed in the voltage curve ascribed to the LixRuO2 – LiRuO2 process beyond 0.76 Li. The onset of the LiOH reaction (involving RuO2.yH2O) may also be important since the process is no longer a simple two phase-reaction and can thus occur with a varying potential. Further calculations are in progress to understand the thermodynamics of these processes in greater detail. 1.5 Further experimental and processing details The experimental details for the in situ total scattering and XAS data can be found in the “methods” section of the main text.
The XAS data shown in the main text were processed using the Athena and Artemis programs. 5 The extracted EXAFS signal, χ(k), was weighted by k2 to emphasize the high-energy oscillations and then Fourier-transformed in a k-range from 3.8 ~ 15.6 Å-1 using a Hanning termination window to obtain the magnitude plots of the EXAFS spectra in a R-space (Å). The filtered Fourier transforms of EXAFS spectra in the R range from 1.1 to 3.7 Å were then fitted using theoretical scattering paths generated with the FEFF 6.0 ab initio simulation code 5 and rutile RuO2 and orthorhombic LiRuO2 crystallographic information. The amplitude reduction factor, S0
2, was determined to be 0.85 from the preliminary fitting sessions. The bond distance (r), inner shell potential shift (ΔE), and Debye-Waller factor (i.e., mean square disorder) (σ2) for each path were refined during fitting while the coordination numbers were fixed to a crystallographic value.
All the in situ acquisitions were carried out while the electric current was on. The
change in Li fraction in the electrode during each operando acquisition is negligible, i.e., 0.005 Li (0.09% of total Li input) for the PDF analysis and 0.093 Li (1.7% of total Li input) for the X-ray absorption measurement. Note: the total Li input/consumption over the whole discharge range was 5.6 Li. 2. NMR experiments
NMR spectra are presented below, in addition to those in the main text, in support of the spectral assignments and to help in the quantification. Further evidence is provided to confirm the feasibility of the proposed reaction, LiOH + 2Li = LiH + Li2O, that accounting for a major part of the additional capacity.
7
2.1 Spectral assignment Various one-dimensional (1D) and two-dimensional (2D) NMR heteronuclear correlation NMR experiments were carried out to obtain high-resolution NMR spectra and probe the connectivity at the atomic level; these experiments help substantiate the spectral assignments presented in the main text. 2.1.1 1H, 19F -6,7Li Cross-Polarization (CP) vs. 6,7Li Direct Polarization (DP) NMR
Figure S3| 7Li/6Li 1H-decoupled NMR spectra. a. 7Li NMR spectra of sample Li1d: one-pulse (direct-polarization, DP) 7Li NMR spectrum (blue) acquired with a 7Li recycle (pulse) delay of 20 s, {1H} 7Li cross-polarization (CP) NMR spectrum (red) with a CP contact time of 3 ms, and the {19F} 7Li CP NMR spectrum (green), CP contact time = 3 ms. b. 6Li NMR spectra of sample Li4d. Blue: DP 6Li NMR spectrum (6Li recycle (pulse) delay of 90 s). Red: {1H} 6Li CP NMR spectrum (contact time = 3 ms). Cyan: the difference between the DP and CP spectra. Both samples were washed three times with dimethyl carbonate (DMC).
A series of experiments were performed to help assign the different resonances, and in particular to separate the Li2O, LiOH, LiH, LiF, and MeOLi resonances. Figure S3 compares 6Li/7Li NMR spectra of samples Li1d and Li4d acquired with one-pulse (or direct polarization, DP), {1H}6Li/7Li CP, and {19F}/7Li CP. In Fig. S3a, the DP spectrum of samples Li1d (blue) shows all the Li-containing phases, while {1H}7Li CP selects phases containing both 1H and 7Li, such as MeOLi in sample Li1d; {19F}7Li CP selects the LiF. Based on the intensity of the CP spectra (corrected with the γ1H/γ19F (γ = gyromagnetic ratio), the 0 ppm 7Li component is composed of ~ 2/3 of LiF and ~ 1/3 of MeOLi. Thus, LiF represents the predominant Li component of the SEI at high voltage (~2 V). In Fig. S3b, the CP spectrum (red) of sample Li4d shows a peak centered at ~ 1 ppm, which is mainly LiOH and but it also includes LiH and MeOLi. Li2O is clearly observed in the difference spectrum (cyan) at 2.6 ppm, along with the non-protonated components of the SEI, e.g., LiF, at ~ -1 ppm. 2.1.2 Separating LiH/LiOH from MeOLi with 1H-7Li Cross-polarization
5 0 - 5 6Li shift (ppm)
LiOH/MeOLi
LiF
Li2O
40 20 0 - 2 0
LiRuO2
LiF
MeOLi
7Li Shift (ppm)
a b
NATURE MATERIALS | www.nature.com/naturematerials 7
SUPPLEMENTARY INFORMATIONDOI: 10.1038/NMAT3784
© 2013 Macmillan Publishers Limited. All rights reserved.
8
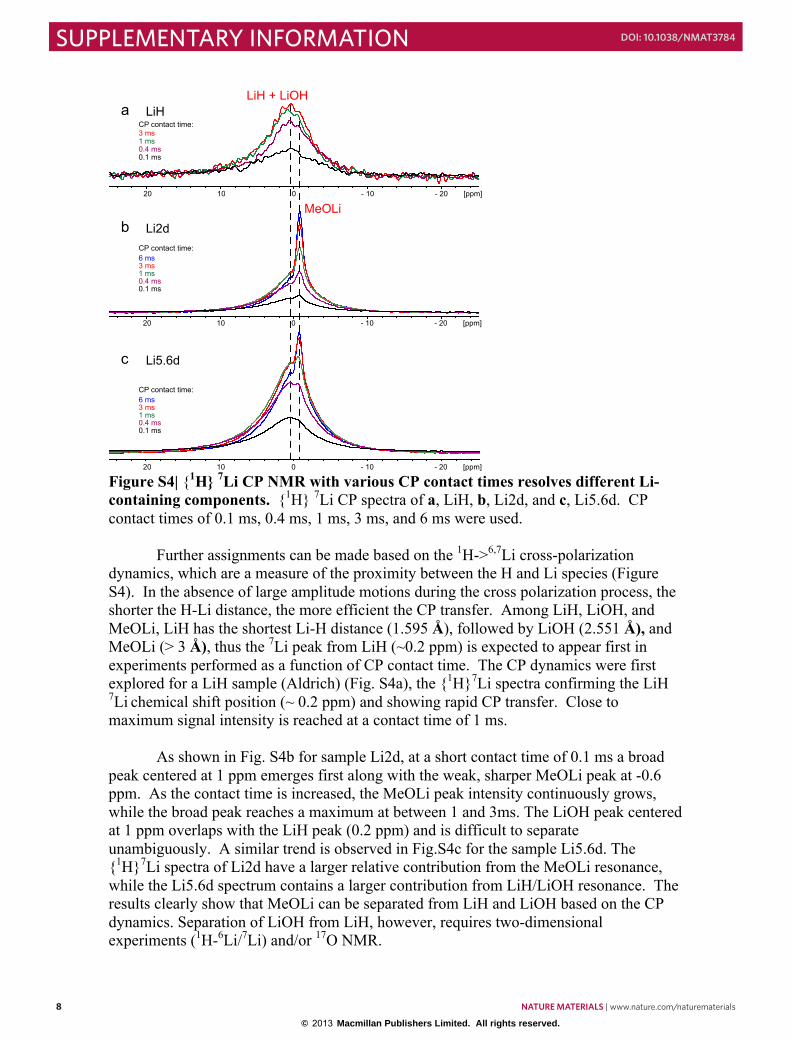
Figure S4| {1H} 7Li CP NMR with various CP contact times resolves different Li-containing components. {1H} 7Li CP spectra of a, LiH, b, Li2d, and c, Li5.6d. CP contact times of 0.1 ms, 0.4 ms, 1 ms, 3 ms, and 6 ms were used.
Further assignments can be made based on the 1H->6,7Li cross-polarization
dynamics, which are a measure of the proximity between the H and Li species (Figure S4). In the absence of large amplitude motions during the cross polarization process, the shorter the H-Li distance, the more efficient the CP transfer. Among LiH, LiOH, and MeOLi, LiH has the shortest Li-H distance (1.595 Å), followed by LiOH (2.551 Å), and MeOLi (> 3 Å), thus the 7Li peak from LiH (~0.2 ppm) is expected to appear first in experiments performed as a function of CP contact time. The CP dynamics were first explored for a LiH sample (Aldrich) (Fig. S4a), the {1H}7Li spectra confirming the LiH 7Li chemical shift position (~ 0.2 ppm) and showing rapid CP transfer. Close to maximum signal intensity is reached at a contact time of 1 ms.
As shown in Fig. S4b for sample Li2d, at a short contact time of 0.1 ms a broad
peak centered at 1 ppm emerges first along with the weak, sharper MeOLi peak at -0.6 ppm. As the contact time is increased, the MeOLi peak intensity continuously grows, while the broad peak reaches a maximum at between 1 and 3ms. The LiOH peak centered at 1 ppm overlaps with the LiH peak (0.2 ppm) and is difficult to separate unambiguously. A similar trend is observed in Fig.S4c for the sample Li5.6d. The {1H}7Li spectra of Li2d have a larger relative contribution from the MeOLi resonance, while the Li5.6d spectrum contains a larger contribution from LiH/LiOH resonance. The results clearly show that MeOLi can be separated from LiH and LiOH based on the CP dynamics. Separation of LiOH from LiH, however, requires two-dimensional experiments (1H-6Li/7Li) and/or 17O NMR.
[ppm] 20 10 0 - 10 - 20
Li2d
LiH
Li5.6d
CP contact time:
CP contact time:
0.1 ms0.4 ms1 ms3 ms6 ms
0.1 ms0.4 ms1 ms3 ms
CP contact time:
0.1 ms0.4 ms1 ms3 ms6 ms
[ppm] 20 10 0 - 10 - 20
[ppm] 20 10 0 - 10 - 20
a
b
c
MeOLi
LiH + LiOH
9
2.1.3 1H-7Li 2D heteronuclear correlation experiments to separate LiH/MeOLi from LiOH
Figure S5| 1H-7Li heteronuclear correlation (HetCor) spectra of samples Li2d, Li5.6d, and LiH. The 1D spectra next to each 2D spectrum are taken at the cross sections (with 1H chemical shifts of -1.3 ppm and 3.5 ppm) marked with dashed lines with the same colors as the 1D spectra. The CP contact times are marked on each figure.
The 1H-7Li heteronuclear correlation spectra shown in Figure S5 allow the LiOH
and LiH/MeOLi resonances to be separated on the basis of their very different 1H chemical shifts (-1.3 ppm and 3.5 ppm, respectively). For instance, in the spectra of sample Li2d, at a short CP contact time of 0.1 ms (Fig. S5a) shows that the -1.3 ppm 1H peak correlates with a broad 7Li peak centered at 1 ppm (red slice), which is assigned to LiOH, while the 3.5 ppm 1H peak correlates with a weak broad peak and an overlapping sharper peak (blue slice). At a longer CP contact time of 3 ms (Fig. S5b), the intensity of the LiOH peak grows (red slice) along with a much more dramatic increase of the sharp peak (blue slice). On this basis, the sharp peak in the 7Li dimension is assigned to MeOLi, while the weak broad overlapping peak is assigned to LiH and other SEI components. Fig. S5c and d show similar trends as those in Fig. S5a and b, however, the relative intensity of the broad LiH peak in comparison to the sharp MeOLi peak, is much bigger, indicating that the Li5.6d sample contains significantly more LiH as compared with Li2d. An additional component with 1H and 7Li resonances at 0 ppm and 0.5 ppm, respectively, is also seen. The same component has also been observed in other battery
[ppm] 6 4 2 0 - 2 - 4
[ppm
] 6
4
2
0
- 2
[ppm] 20 0 - 20
[ppm] 6 4 2 0 - 2 - 4
[ppm
] 6
4
2
0
- 2
[ppm] 6 4 2 0 - 2 - 4
[ppm
] 6
4
2
0
- 2
[ppm] 20 0 - 20
[ppm] 20 0 - 20
[ppm] 20 10 0 - 10 - 20
[ppm] 6 4 2 0 - 2 - 4 - 6
[ppm
] 6
4
2
0
- 2
[ppm] 6 4 2 0 - 2 - 4 - 6
[ppm
] 6
4
2
0
- 2
[ppm] 20 10 0 - 10 - 20
a
c d
e
b
7Li
7Li
7Li
7Li
7Li
1H
1H
1H
1H
1H
Li2d, 0.1 ms contact Li2d, 3 ms contact
Li5.6d, 3 ms contactLi5.6d, 0.1 ms contact
LiH, 3 ms contact
MeOLiMeOLi
LiOH
LiOH
LiOH
LiOH
LiH
LiH
LiH
LiOH
8 NATURE MATERIALS | www.nature.com/naturematerials
SUPPLEMENTARY INFORMATION DOI: 10.1038/NMAT3784
© 2013 Macmillan Publishers Limited. All rights reserved.

8
Figure S4| {1H} 7Li CP NMR with various CP contact times resolves different Li-containing components. {1H} 7Li CP spectra of a, LiH, b, Li2d, and c, Li5.6d. CP contact times of 0.1 ms, 0.4 ms, 1 ms, 3 ms, and 6 ms were used.
Further assignments can be made based on the 1H->6,7Li cross-polarization
dynamics, which are a measure of the proximity between the H and Li species (Figure S4). In the absence of large amplitude motions during the cross polarization process, the shorter the H-Li distance, the more efficient the CP transfer. Among LiH, LiOH, and MeOLi, LiH has the shortest Li-H distance (1.595 Å), followed by LiOH (2.551 Å), and MeOLi (> 3 Å), thus the 7Li peak from LiH (~0.2 ppm) is expected to appear first in experiments performed as a function of CP contact time. The CP dynamics were first explored for a LiH sample (Aldrich) (Fig. S4a), the {1H}7Li spectra confirming the LiH 7Li chemical shift position (~ 0.2 ppm) and showing rapid CP transfer. Close to maximum signal intensity is reached at a contact time of 1 ms.
As shown in Fig. S4b for sample Li2d, at a short contact time of 0.1 ms a broad
peak centered at 1 ppm emerges first along with the weak, sharper MeOLi peak at -0.6 ppm. As the contact time is increased, the MeOLi peak intensity continuously grows, while the broad peak reaches a maximum at between 1 and 3ms. The LiOH peak centered at 1 ppm overlaps with the LiH peak (0.2 ppm) and is difficult to separate unambiguously. A similar trend is observed in Fig.S4c for the sample Li5.6d. The {1H}7Li spectra of Li2d have a larger relative contribution from the MeOLi resonance, while the Li5.6d spectrum contains a larger contribution from LiH/LiOH resonance. The results clearly show that MeOLi can be separated from LiH and LiOH based on the CP dynamics. Separation of LiOH from LiH, however, requires two-dimensional experiments (1H-6Li/7Li) and/or 17O NMR.
[ppm] 20 10 0 - 10 - 20
Li2d
LiH
Li5.6d
CP contact time:
CP contact time:
0.1 ms0.4 ms1 ms3 ms6 ms
0.1 ms0.4 ms1 ms3 ms
CP contact time:
0.1 ms0.4 ms1 ms3 ms6 ms
[ppm] 20 10 0 - 10 - 20
[ppm] 20 10 0 - 10 - 20
a
b
c
MeOLi
LiH + LiOH
9
2.1.3 1H-7Li 2D heteronuclear correlation experiments to separate LiH/MeOLi from LiOH
Figure S5| 1H-7Li heteronuclear correlation (HetCor) spectra of samples Li2d, Li5.6d, and LiH. The 1D spectra next to each 2D spectrum are taken at the cross sections (with 1H chemical shifts of -1.3 ppm and 3.5 ppm) marked with dashed lines with the same colors as the 1D spectra. The CP contact times are marked on each figure.
The 1H-7Li heteronuclear correlation spectra shown in Figure S5 allow the LiOH
and LiH/MeOLi resonances to be separated on the basis of their very different 1H chemical shifts (-1.3 ppm and 3.5 ppm, respectively). For instance, in the spectra of sample Li2d, at a short CP contact time of 0.1 ms (Fig. S5a) shows that the -1.3 ppm 1H peak correlates with a broad 7Li peak centered at 1 ppm (red slice), which is assigned to LiOH, while the 3.5 ppm 1H peak correlates with a weak broad peak and an overlapping sharper peak (blue slice). At a longer CP contact time of 3 ms (Fig. S5b), the intensity of the LiOH peak grows (red slice) along with a much more dramatic increase of the sharp peak (blue slice). On this basis, the sharp peak in the 7Li dimension is assigned to MeOLi, while the weak broad overlapping peak is assigned to LiH and other SEI components. Fig. S5c and d show similar trends as those in Fig. S5a and b, however, the relative intensity of the broad LiH peak in comparison to the sharp MeOLi peak, is much bigger, indicating that the Li5.6d sample contains significantly more LiH as compared with Li2d. An additional component with 1H and 7Li resonances at 0 ppm and 0.5 ppm, respectively, is also seen. The same component has also been observed in other battery
[ppm] 6 4 2 0 - 2 - 4
[ppm
] 6
4
2
0
- 2
[ppm] 20 0 - 20
[ppm] 6 4 2 0 - 2 - 4 [p
pm]
6
4
2
0
- 2
[ppm] 6 4 2 0 - 2 - 4
[ppm
] 6
4
2
0
- 2
[ppm] 20 0 - 20
[ppm] 20 0 - 20
[ppm] 20 10 0 - 10 - 20
[ppm] 6 4 2 0 - 2 - 4 - 6
[ppm
] 6
4
2
0
- 2
[ppm] 6 4 2 0 - 2 - 4 - 6
[ppm
] 6
4
2
0
- 2
[ppm] 20 10 0 - 10 - 20
a
c d
e
b
7Li
7Li
7Li
7Li
7Li
1H
1H
1H
1H
1H
Li2d, 0.1 ms contact Li2d, 3 ms contact
Li5.6d, 3 ms contactLi5.6d, 0.1 ms contact
LiH, 3 ms contact
MeOLiMeOLi
LiOH
LiOH
LiOH
LiOH
LiH
LiH
LiH
LiOH
NATURE MATERIALS | www.nature.com/naturematerials 9
SUPPLEMENTARY INFORMATIONDOI: 10.1038/NMAT3784
© 2013 Macmillan Publishers Limited. All rights reserved.
10
systems containing amorphous carbon in the electrodes, ascribed to electrolyte absorption/reaction with carbon.
Fig. S5e shows the 1H-7Li correlation spectrum of LiH, which clearly has partially
decomposed to form LiOH. The 3.5 ppm 1H peak correlates with the 7Li peak at ~ 0.2 ppm, confirming again the 1H and 7Li chemical shifts of LiH. 2.1.4 The use of 17O NMR to separate Li2O from LiOH
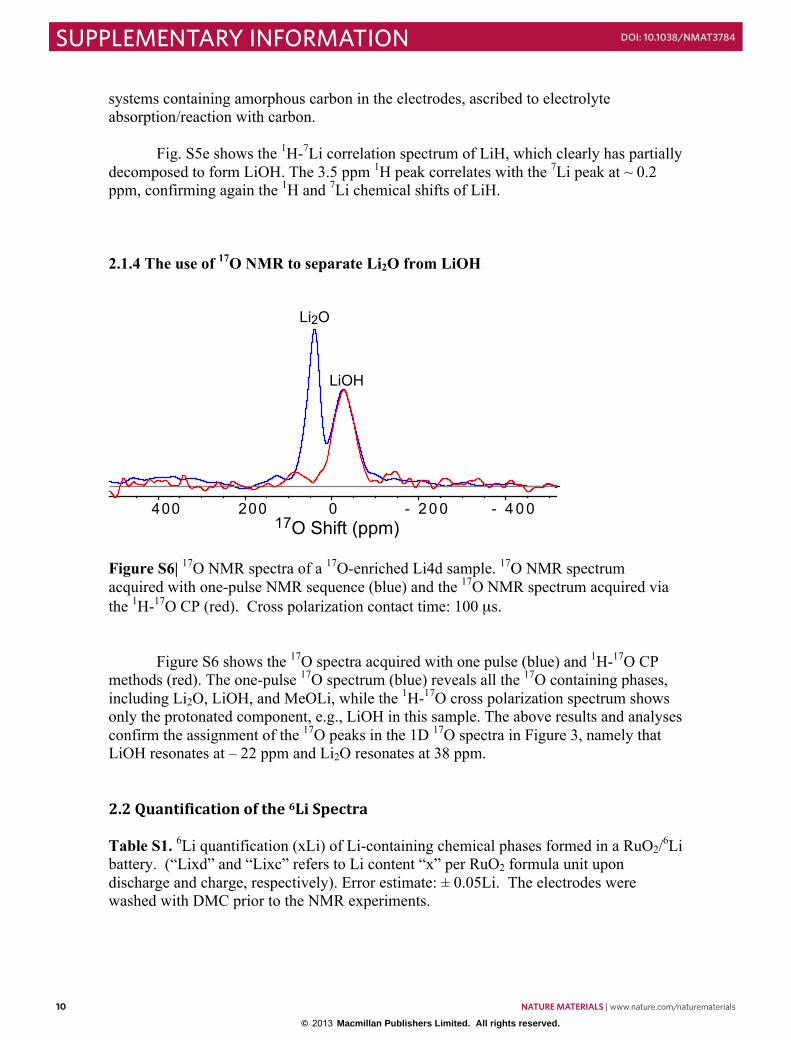
Figure S6| 17O NMR spectra of a 17O-enriched Li4d sample. 17O NMR spectrum acquired with one-pulse NMR sequence (blue) and the 17O NMR spectrum acquired via the 1H-17O CP (red). Cross polarization contact time: 100 µs.
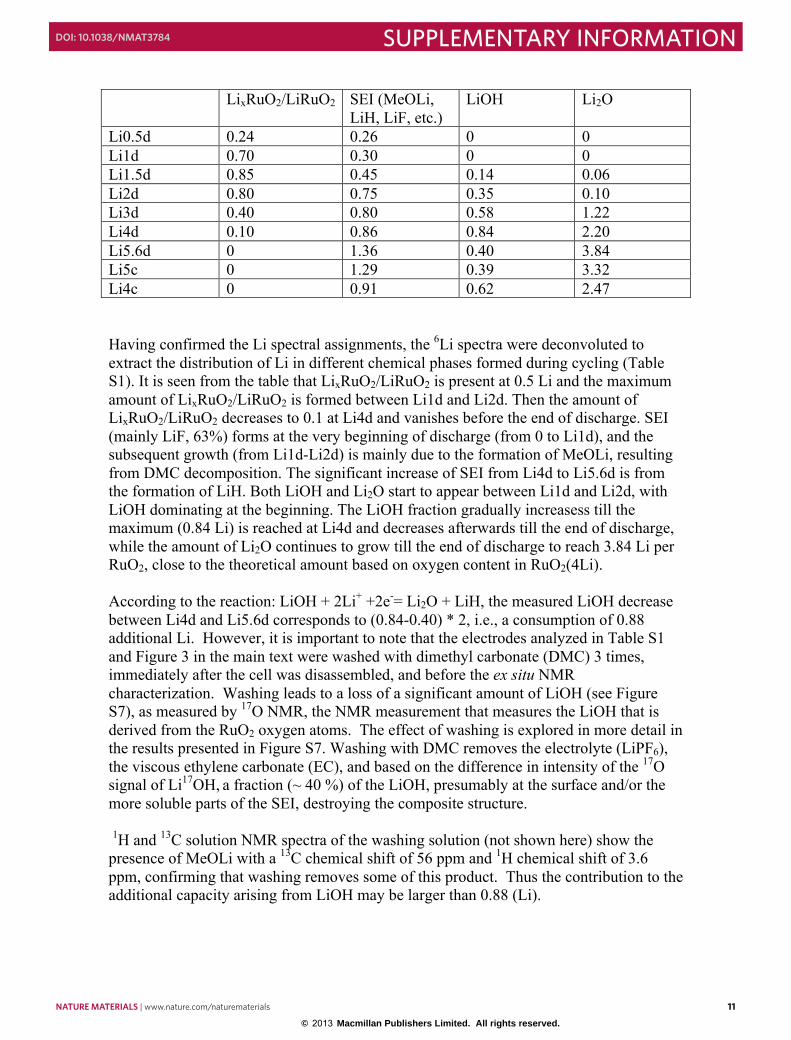
Figure S6 shows the 17O spectra acquired with one pulse (blue) and 1H-17O CP methods (red). The one-pulse 17O spectrum (blue) reveals all the 17O containing phases, including Li2O, LiOH, and MeOLi, while the 1H-17O cross polarization spectrum shows only the protonated component, e.g., LiOH in this sample. The above results and analyses confirm the assignment of the 17O peaks in the 1D 17O spectra in Figure 3, namely that LiOH resonates at – 22 ppm and Li2O resonates at 38 ppm. 2.2 Quantification of the 6Li Spectra Table S1. 6Li quantification (xLi) of Li-containing chemical phases formed in a RuO2/6Li battery. (“Lixd” and “Lixc” refers to Li content “x” per RuO2 formula unit upon discharge and charge, respectively). Error estimate: ± 0.05Li. The electrodes were washed with DMC prior to the NMR experiments.
Li2O
LiOH
17O Shift (ppm) 400 200 0 - 2 0 0 - 4 0 0
11
LixRuO2/LiRuO2 SEI (MeOLi, LiH, LiF, etc.)
LiOH Li2O
Li0.5d 0.24 0.26 0 0 Li1d 0.70 0.30 0 0 Li1.5d 0.85 0.45 0.14 0.06 Li2d 0.80 0.75 0.35 0.10 Li3d 0.40 0.80 0.58 1.22 Li4d 0.10 0.86 0.84 2.20 Li5.6d 0 1.36 0.40 3.84 Li5c 0 1.29 0.39 3.32 Li4c 0 0.91 0.62 2.47 Having confirmed the Li spectral assignments, the 6Li spectra were deconvoluted to extract the distribution of Li in different chemical phases formed during cycling (Table S1). It is seen from the table that LixRuO2/LiRuO2 is present at 0.5 Li and the maximum amount of LixRuO2/LiRuO2 is formed between Li1d and Li2d. Then the amount of LixRuO2/LiRuO2 decreases to 0.1 at Li4d and vanishes before the end of discharge. SEI (mainly LiF, 63%) forms at the very beginning of discharge (from 0 to Li1d), and the subsequent growth (from Li1d-Li2d) is mainly due to the formation of MeOLi, resulting from DMC decomposition. The significant increase of SEI from Li4d to Li5.6d is from the formation of LiH. Both LiOH and Li2O start to appear between Li1d and Li2d, with LiOH dominating at the beginning. The LiOH fraction gradually increasess till the maximum (0.84 Li) is reached at Li4d and decreases afterwards till the end of discharge, while the amount of Li2O continues to grow till the end of discharge to reach 3.84 Li per RuO2, close to the theoretical amount based on oxygen content in RuO2(4Li). According to the reaction: LiOH + 2Li+ +2e-= Li2O + LiH, the measured LiOH decrease between Li4d and Li5.6d corresponds to (0.84-0.40) * 2, i.e., a consumption of 0.88 additional Li. However, it is important to note that the electrodes analyzed in Table S1 and Figure 3 in the main text were washed with dimethyl carbonate (DMC) 3 times, immediately after the cell was disassembled, and before the ex situ NMR characterization. Washing leads to a loss of a significant amount of LiOH (see Figure S7), as measured by 17O NMR, the NMR measurement that measures the LiOH that is derived from the RuO2 oxygen atoms. The effect of washing is explored in more detail in the results presented in Figure S7. Washing with DMC removes the electrolyte (LiPF6), the viscous ethylene carbonate (EC), and based on the difference in intensity of the 17O signal of Li17OH, a fraction (~ 40 %) of the LiOH, presumably at the surface and/or the more soluble parts of the SEI, destroying the composite structure. 1H and 13C solution NMR spectra of the washing solution (not shown here) show the presence of MeOLi with a 13C chemical shift of 56 ppm and 1H chemical shift of 3.6 ppm, confirming that washing removes some of this product. Thus the contribution to the additional capacity arising from LiOH may be larger than 0.88 (Li).
10 NATURE MATERIALS | www.nature.com/naturematerials
SUPPLEMENTARY INFORMATION DOI: 10.1038/NMAT3784
© 2013 Macmillan Publishers Limited. All rights reserved.
10
systems containing amorphous carbon in the electrodes, ascribed to electrolyte absorption/reaction with carbon.
Fig. S5e shows the 1H-7Li correlation spectrum of LiH, which clearly has partially
decomposed to form LiOH. The 3.5 ppm 1H peak correlates with the 7Li peak at ~ 0.2 ppm, confirming again the 1H and 7Li chemical shifts of LiH. 2.1.4 The use of 17O NMR to separate Li2O from LiOH
Figure S6| 17O NMR spectra of a 17O-enriched Li4d sample. 17O NMR spectrum acquired with one-pulse NMR sequence (blue) and the 17O NMR spectrum acquired via the 1H-17O CP (red). Cross polarization contact time: 100 µs.
Figure S6 shows the 17O spectra acquired with one pulse (blue) and 1H-17O CP methods (red). The one-pulse 17O spectrum (blue) reveals all the 17O containing phases, including Li2O, LiOH, and MeOLi, while the 1H-17O cross polarization spectrum shows only the protonated component, e.g., LiOH in this sample. The above results and analyses confirm the assignment of the 17O peaks in the 1D 17O spectra in Figure 3, namely that LiOH resonates at – 22 ppm and Li2O resonates at 38 ppm. 2.2 Quantification of the 6Li Spectra Table S1. 6Li quantification (xLi) of Li-containing chemical phases formed in a RuO2/6Li battery. (“Lixd” and “Lixc” refers to Li content “x” per RuO2 formula unit upon discharge and charge, respectively). Error estimate: ± 0.05Li. The electrodes were washed with DMC prior to the NMR experiments.
Li2O
LiOH
17O Shift (ppm) 400 200 0 - 2 0 0 - 4 0 0
11
LixRuO2/LiRuO2 SEI (MeOLi, LiH, LiF, etc.)
LiOH Li2O
Li0.5d 0.24 0.26 0 0 Li1d 0.70 0.30 0 0 Li1.5d 0.85 0.45 0.14 0.06 Li2d 0.80 0.75 0.35 0.10 Li3d 0.40 0.80 0.58 1.22 Li4d 0.10 0.86 0.84 2.20 Li5.6d 0 1.36 0.40 3.84 Li5c 0 1.29 0.39 3.32 Li4c 0 0.91 0.62 2.47 Having confirmed the Li spectral assignments, the 6Li spectra were deconvoluted to extract the distribution of Li in different chemical phases formed during cycling (Table S1). It is seen from the table that LixRuO2/LiRuO2 is present at 0.5 Li and the maximum amount of LixRuO2/LiRuO2 is formed between Li1d and Li2d. Then the amount of LixRuO2/LiRuO2 decreases to 0.1 at Li4d and vanishes before the end of discharge. SEI (mainly LiF, 63%) forms at the very beginning of discharge (from 0 to Li1d), and the subsequent growth (from Li1d-Li2d) is mainly due to the formation of MeOLi, resulting from DMC decomposition. The significant increase of SEI from Li4d to Li5.6d is from the formation of LiH. Both LiOH and Li2O start to appear between Li1d and Li2d, with LiOH dominating at the beginning. The LiOH fraction gradually increasess till the maximum (0.84 Li) is reached at Li4d and decreases afterwards till the end of discharge, while the amount of Li2O continues to grow till the end of discharge to reach 3.84 Li per RuO2, close to the theoretical amount based on oxygen content in RuO2(4Li). According to the reaction: LiOH + 2Li+ +2e-= Li2O + LiH, the measured LiOH decrease between Li4d and Li5.6d corresponds to (0.84-0.40) * 2, i.e., a consumption of 0.88 additional Li. However, it is important to note that the electrodes analyzed in Table S1 and Figure 3 in the main text were washed with dimethyl carbonate (DMC) 3 times, immediately after the cell was disassembled, and before the ex situ NMR characterization. Washing leads to a loss of a significant amount of LiOH (see Figure S7), as measured by 17O NMR, the NMR measurement that measures the LiOH that is derived from the RuO2 oxygen atoms. The effect of washing is explored in more detail in the results presented in Figure S7. Washing with DMC removes the electrolyte (LiPF6), the viscous ethylene carbonate (EC), and based on the difference in intensity of the 17O signal of Li17OH, a fraction (~ 40 %) of the LiOH, presumably at the surface and/or the more soluble parts of the SEI, destroying the composite structure. 1H and 13C solution NMR spectra of the washing solution (not shown here) show the presence of MeOLi with a 13C chemical shift of 56 ppm and 1H chemical shift of 3.6 ppm, confirming that washing removes some of this product. Thus the contribution to the additional capacity arising from LiOH may be larger than 0.88 (Li).
NATURE MATERIALS | www.nature.com/naturematerials 11
SUPPLEMENTARY INFORMATIONDOI: 10.1038/NMAT3784
© 2013 Macmillan Publishers Limited. All rights reserved.
12
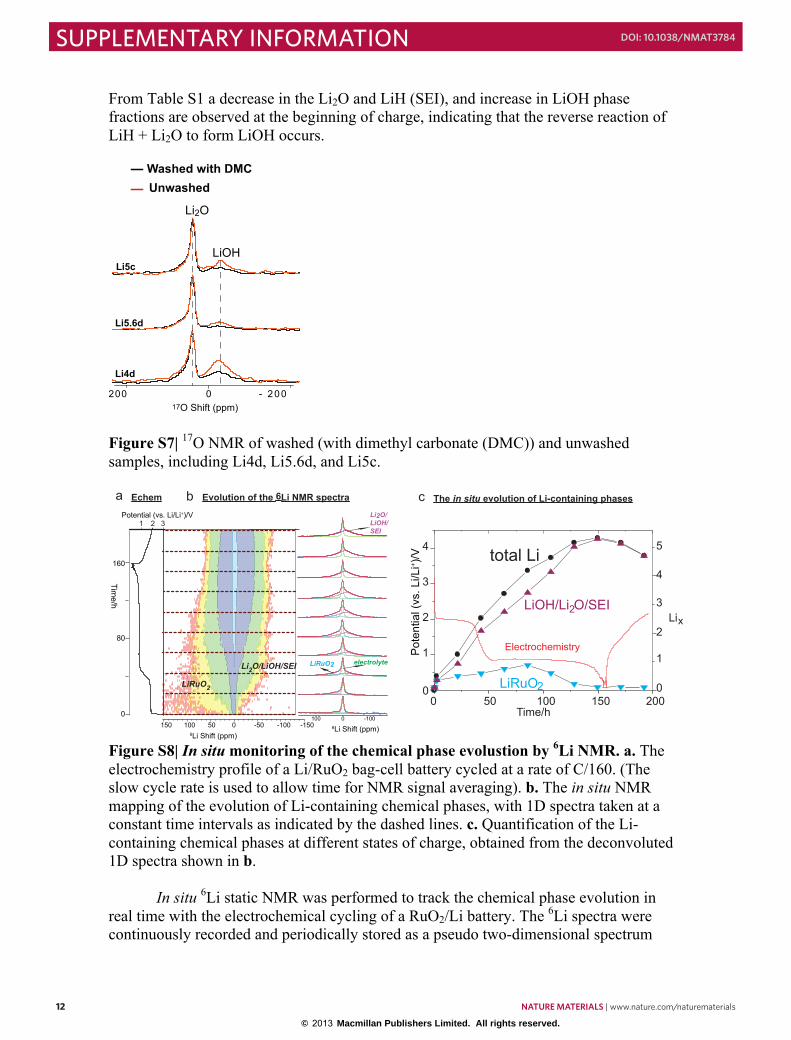
From Table S1 a decrease in the Li2O and LiH (SEI), and increase in LiOH phase fractions are observed at the beginning of charge, indicating that the reverse reaction of LiH + Li2O to form LiOH occurs.
Figure S7| 17O NMR of washed (with dimethyl carbonate (DMC)) and unwashed samples, including Li4d, Li5.6d, and Li5c.
Figure S8| In situ monitoring of the chemical phase evolustion by 6Li NMR. a. The electrochemistry profile of a Li/RuO2 bag-cell battery cycled at a rate of C/160. (The slow cycle rate is used to allow time for NMR signal averaging). b. The in situ NMR mapping of the evolution of Li-containing chemical phases, with 1D spectra taken at a constant time intervals as indicated by the dashed lines. c. Quantification of the Li-containing chemical phases at different states of charge, obtained from the deconvoluted 1D spectra shown in b.
In situ 6Li static NMR was performed to track the chemical phase evolution in real time with the electrochemical cycling of a RuO2/Li battery. The 6Li spectra were continuously recorded and periodically stored as a pseudo two-dimensional spectrum
Washed with DMCUnwashed
200 0 - 200
Li4d
Li5.6d
Li5c
Li2O
LiOH
17O Shift (ppm)
-150-100-50050100150
160
80
0
Time/h
6Li Shift (ppm)6Li Shift (ppm)
0
0
-1000100
LiRuO2
LiRuO2Li2O/LiOH/SEI
Li2O/LiOH/SEI
50 100 150 200
1
2
3
4
1
2
3
4
5
0
Time/h
total Li
LiOH/Li2O/SEI
LiRuO2
Lix
The in situ evolution of Li-containing phases
321
electrolyte
Electrochemistry
Echem Evolution of the 6Li NMR spectraa cb
00
Pot
entia
l (vs
. Li/L
i+ )/V
Potential (vs. Li/Li+)/V
13
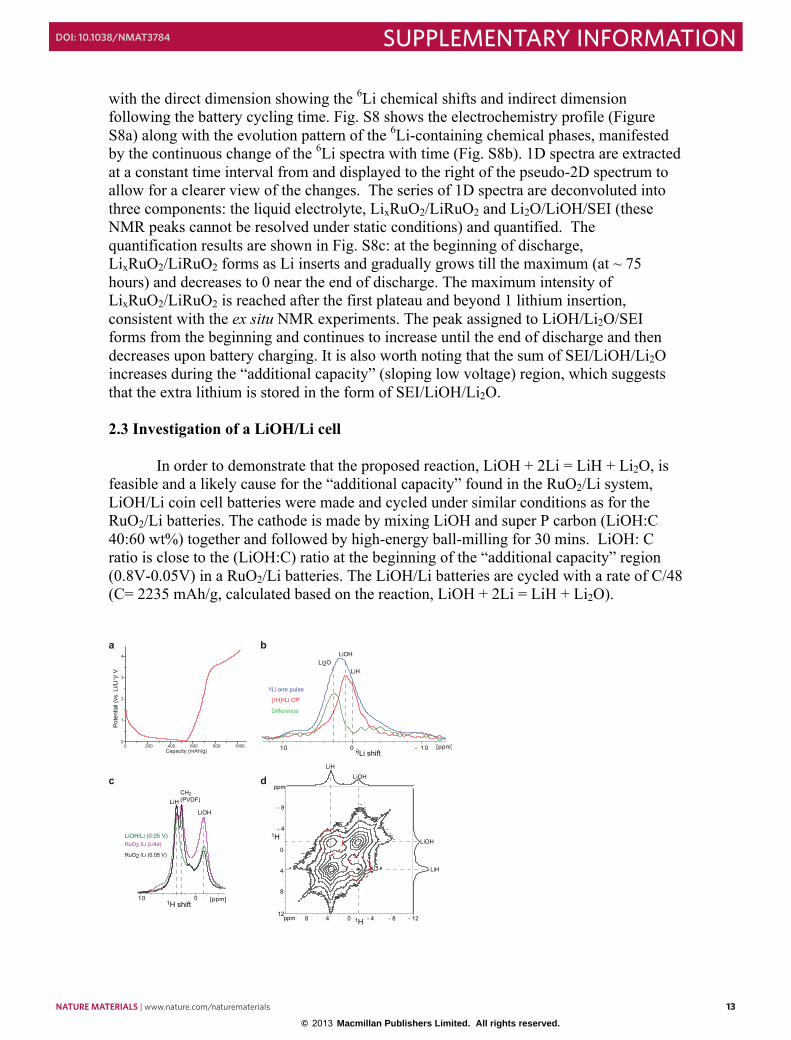
with the direct dimension showing the 6Li chemical shifts and indirect dimension following the battery cycling time. Fig. S8 shows the electrochemistry profile (Figure S8a) along with the evolution pattern of the 6Li-containing chemical phases, manifested by the continuous change of the 6Li spectra with time (Fig. S8b). 1D spectra are extracted at a constant time interval from and displayed to the right of the pseudo-2D spectrum to allow for a clearer view of the changes. The series of 1D spectra are deconvoluted into three components: the liquid electrolyte, LixRuO2/LiRuO2 and Li2O/LiOH/SEI (these NMR peaks cannot be resolved under static conditions) and quantified. The quantification results are shown in Fig. S8c: at the beginning of discharge, LixRuO2/LiRuO2 forms as Li inserts and gradually grows till the maximum (at ~ 75 hours) and decreases to 0 near the end of discharge. The maximum intensity of LixRuO2/LiRuO2 is reached after the first plateau and beyond 1 lithium insertion, consistent with the ex situ NMR experiments. The peak assigned to LiOH/Li2O/SEI forms from the beginning and continues to increase until the end of discharge and then decreases upon battery charging. It is also worth noting that the sum of SEI/LiOH/Li2O increases during the “additional capacity” (sloping low voltage) region, which suggests that the extra lithium is stored in the form of SEI/LiOH/Li2O. 2.3 Investigation of a LiOH/Li cell In order to demonstrate that the proposed reaction, LiOH + 2Li = LiH + Li2O, is feasible and a likely cause for the “additional capacity” found in the RuO2/Li system, LiOH/Li coin cell batteries were made and cycled under similar conditions as for the RuO2/Li batteries. The cathode is made by mixing LiOH and super P carbon (LiOH:C 40:60 wt%) together and followed by high-energy ball-milling for 30 mins. LiOH: C ratio is close to the (LiOH:C) ratio at the beginning of the “additional capacity” region (0.8V-0.05V) in a RuO2/Li batteries. The LiOH/Li batteries are cycled with a rate of C/48 (C= 2235 mAh/g, calculated based on the reaction, LiOH + 2Li = LiH + Li2O).
[ppm] 10 0 - 1 0
6Li one pulse
{1H}6Li CP
Difference
Li2OLiH
LiOH
[ppm] 10 0
LiOH
CH2(PVDF)LiH
RuO2 /Li (Li4d)
RuO2 /Li (0.05 V)
0
0
ppm
ppm
- 4
4
- 8
8
- 1212
4
- 4
8
- 8
1H
1H
1H shift
6Li shift
LiOH
LiOH
LiH
LiH
LiOH/Li (0.05 V)
a b
c d
0 200 400 600 800 10000
1
2
3
4
Capacity (mAh/g)
Pot
entia
l (vs
. Li/L
i+ )/ V
12 NATURE MATERIALS | www.nature.com/naturematerials
SUPPLEMENTARY INFORMATION DOI: 10.1038/NMAT3784
© 2013 Macmillan Publishers Limited. All rights reserved.
12
From Table S1 a decrease in the Li2O and LiH (SEI), and increase in LiOH phase fractions are observed at the beginning of charge, indicating that the reverse reaction of LiH + Li2O to form LiOH occurs.
Figure S7| 17O NMR of washed (with dimethyl carbonate (DMC)) and unwashed samples, including Li4d, Li5.6d, and Li5c.
Figure S8| In situ monitoring of the chemical phase evolustion by 6Li NMR. a. The electrochemistry profile of a Li/RuO2 bag-cell battery cycled at a rate of C/160. (The slow cycle rate is used to allow time for NMR signal averaging). b. The in situ NMR mapping of the evolution of Li-containing chemical phases, with 1D spectra taken at a constant time intervals as indicated by the dashed lines. c. Quantification of the Li-containing chemical phases at different states of charge, obtained from the deconvoluted 1D spectra shown in b.
In situ 6Li static NMR was performed to track the chemical phase evolution in real time with the electrochemical cycling of a RuO2/Li battery. The 6Li spectra were continuously recorded and periodically stored as a pseudo two-dimensional spectrum
Washed with DMCUnwashed
200 0 - 200
Li4d
Li5.6d
Li5c
Li2O
LiOH
17O Shift (ppm)
-150-100-50050100150
160
80
0
Time/h
6Li Shift (ppm)6Li Shift (ppm)
0
0
-1000100
LiRuO2
LiRuO2Li2O/LiOH/SEI
Li2O/LiOH/SEI
50 100 150 200
1
2
3
4
1
2
3
4
5
0
Time/h
total Li
LiOH/Li2O/SEI
LiRuO2
Lix
The in situ evolution of Li-containing phases
321
electrolyte
Electrochemistry
Echem Evolution of the 6Li NMR spectraa cb
00
Pot
entia
l (vs
. Li/L
i+ )/V
Potential (vs. Li/Li+)/V
13
with the direct dimension showing the 6Li chemical shifts and indirect dimension following the battery cycling time. Fig. S8 shows the electrochemistry profile (Figure S8a) along with the evolution pattern of the 6Li-containing chemical phases, manifested by the continuous change of the 6Li spectra with time (Fig. S8b). 1D spectra are extracted at a constant time interval from and displayed to the right of the pseudo-2D spectrum to allow for a clearer view of the changes. The series of 1D spectra are deconvoluted into three components: the liquid electrolyte, LixRuO2/LiRuO2 and Li2O/LiOH/SEI (these NMR peaks cannot be resolved under static conditions) and quantified. The quantification results are shown in Fig. S8c: at the beginning of discharge, LixRuO2/LiRuO2 forms as Li inserts and gradually grows till the maximum (at ~ 75 hours) and decreases to 0 near the end of discharge. The maximum intensity of LixRuO2/LiRuO2 is reached after the first plateau and beyond 1 lithium insertion, consistent with the ex situ NMR experiments. The peak assigned to LiOH/Li2O/SEI forms from the beginning and continues to increase until the end of discharge and then decreases upon battery charging. It is also worth noting that the sum of SEI/LiOH/Li2O increases during the “additional capacity” (sloping low voltage) region, which suggests that the extra lithium is stored in the form of SEI/LiOH/Li2O. 2.3 Investigation of a LiOH/Li cell In order to demonstrate that the proposed reaction, LiOH + 2Li = LiH + Li2O, is feasible and a likely cause for the “additional capacity” found in the RuO2/Li system, LiOH/Li coin cell batteries were made and cycled under similar conditions as for the RuO2/Li batteries. The cathode is made by mixing LiOH and super P carbon (LiOH:C 40:60 wt%) together and followed by high-energy ball-milling for 30 mins. LiOH: C ratio is close to the (LiOH:C) ratio at the beginning of the “additional capacity” region (0.8V-0.05V) in a RuO2/Li batteries. The LiOH/Li batteries are cycled with a rate of C/48 (C= 2235 mAh/g, calculated based on the reaction, LiOH + 2Li = LiH + Li2O).
[ppm] 10 0 - 1 0
6Li one pulse
{1H}6Li CP
Difference
Li2OLiH
LiOH
[ppm] 10 0
LiOH
CH2(PVDF)LiH
RuO2 /Li (Li4d)
RuO2 /Li (0.05 V)
0
0
ppm
ppm
- 4
4
- 8
8
- 1212
4
- 4
8
- 8
1H
1H
1H shift
6Li shift
LiOH
LiOH
LiH
LiH
LiOH/Li (0.05 V)
a b
c d
0 200 400 600 800 10000
1
2
3
4
Capacity (mAh/g)
Pot
entia
l (vs
. Li/L
i+ )/ V
NATURE MATERIALS | www.nature.com/naturematerials 13
SUPPLEMENTARY INFORMATIONDOI: 10.1038/NMAT3784
© 2013 Macmillan Publishers Limited. All rights reserved.

14
Figure S9| a. The electrochemistry profile of a LiOH/Li battery discharged to 0.05 V vs Li. and charged to 4.3V. b. 6Li NMR spectra at the end of discharge (0.05 V): One-pulse 6Li spectrum (blue), 1H-6Li cross-polarization (CP) spectrum (red) and the difference (green) between the one-pulse and CP spectrum. c. 1H spectra of a LiOH electrode discharged to 0.05 V (green line), a RuO2 electrode cycled against Li metal to contain 4 Li (Li4d, purple line), and down to 0.05 V (black line). d. 2D 1H spin exchange NMR spectrum of the LiOH electrode discharged against Li metal to 0.05 V. The red dashed circles mark the off-diagonal 1H peaks connecting LiOH (-1.3 ppm) and LiH (3.5 ppm). The electrochemistry profile of a LiOH/Li battery for the 1st discharge and charge is shown in Fig. S9a. LiOH is not an electronic conductor, thus the battery performance is largely dependent on the mixing of LiOH with electronically conductive C. The highest practical capacity of LiOH achieved here is ~ 700 mAh/g. Fig. S9b shows 6Li spectra of a LiOH/Li cell discharged to 0.05 V. The one-pulse 6Li NMR spectrum (blue) shows all Li-containing chemical phases, including, LiH (~ 0 ppm), LiOH (1 ppm), and Li2O (2.6 ppm), while the cross polarization spectrum (red) selects only the protonated components, LiOH and LiH/MeOLi, with the difference (green) between these two spectra showing the non-protonated Li2O. LiH and Li2O are the products of the cathode reaction, LiOH + 2Li = LiH + Li2O, while LiOH is the remaining reactant. The 1D 1H spectra of the cycled cathode materials of the LiOH/Li and RuO2/Li batteries show two major components, LiOH (-1.3 ppm) and LiH (3.5 ppm), while the 1H spectra (black and purple) of the cycled RuO2/Li cathodes show an additional peak at 2.6 ppm, which is from the inert polymer binder, PDVF, used to make self-supporting cathode films. The relative intensity changes of the LiOH and LiH 1H peaks of the RuO2/Li cycled cathode materials have demonstrated that the process of discharging the battery from 0.8 V (purple) to 0.05 V (black) consumes LiOH (decreased 1H peak intensity at -1.3 ppm) and generates LiH (increased 1H peak intensity at 3.5 ppm); this is consistent with the reaction, LiOH + 2Li = LiH + Li2O, at the end of battery discharge in the RuO2/Li system. Fig. S9c also shows similar relative intensity of the LiOH and LiH peaks for both the LiOH/Li and RuO2/Li cathode materials discharged to 0.05 V (black and green). Fig. S9d displays a 2D spin exchange 1H NMR spectrum of a LiOH cathode discharged to 0.05V against Li metal. The off-diagonal (cross) peaks between the LiOH (-1.3 ppm) and LiH indicate that the product LiH is close in space to the reactant LiOH. The 2D exchange experiments are discussed in more detail in the next section. In the RuO2/Li system, the LiOH + 2Li = LiH + Li2O occurs on the surfaces of the Ru nanoparticles, and thus there should be more ready access to the reaction sites for both electrons and Li+ ions. In contrast, in the LiOH/Li system, it is a bulk reaction, activated only by intimate mixing with the carbon. Thus, it is not surprising that the theoretical capacity of LiOH is not achieved due to the large diffusion length to the core of the bulk for both electrons and ions. Thus it is not surprising that the 1H and 6Li NMR spectra in Fig. S9 (b,c,d) show significant amount of unreacted LiOH (46%).
15
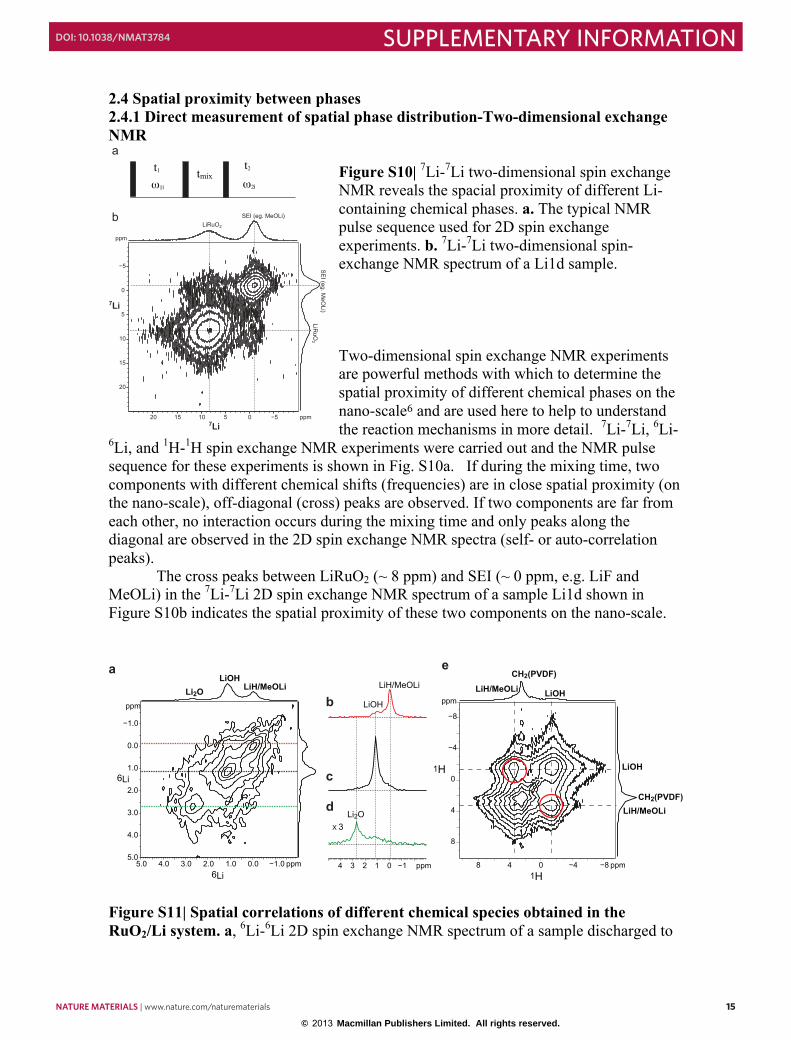
2.4 Spatial proximity between phases 2.4.1 Direct measurement of spatial phase distribution-Two-dimensional exchange NMR
Figure S10| 7Li-7Li two-dimensional spin exchange NMR reveals the spacial proximity of different Li-containing chemical phases. a. The typical NMR pulse sequence used for 2D spin exchange experiments. b. 7Li-7Li two-dimensional spin-exchange NMR spectrum of a Li1d sample.
Two-dimensional spin exchange NMR experiments are powerful methods with which to determine the spatial proximity of different chemical phases on the nano-scale6 and are used here to help to understand the reaction mechanisms in more detail. 7Li-7Li, 6Li-
6Li, and 1H-1H spin exchange NMR experiments were carried out and the NMR pulse sequence for these experiments is shown in Fig. S10a. If during the mixing time, two components with different chemical shifts (frequencies) are in close spatial proximity (on the nano-scale), off-diagonal (cross) peaks are observed. If two components are far from each other, no interaction occurs during the mixing time and only peaks along the diagonal are observed in the 2D spin exchange NMR spectra (self- or auto-correlation peaks).
The cross peaks between LiRuO2 (~ 8 ppm) and SEI (~ 0 ppm, e.g. LiF and MeOLi) in the 7Li-7Li 2D spin exchange NMR spectrum of a sample Li1d shown in Figure S10b indicates the spatial proximity of these two components on the nano-scale.
Figure S11| Spatial correlations of different chemical species obtained in the RuO2/Li system. a, 6Li-6Li 2D spin exchange NMR spectrum of a sample discharged to
LiOH
LiOH
CH2(PVDF)
CH2(PVDF)
ppm
−8−48 4 0 ppm
−8
−4
8
4
0
1H
1H
ea
b
c
d
ppm
−1.05.0 4.0 3.0 2.0 1.0 0.0 ppm
−1.0
5.0
4.0
3.0
2.0
1.0
0.0
−14 3 2 1 0 ppm
X 3
6Li
6Li
LiH/MeOLiLiOH
Li2OLiH/MeOLi LiH/MeOLi
LiH/MeOLi
LiOH
Li2O
ppm
−520 15 10 5 0 ppm
−5
20
15
10
5
0
SEI (eg. MeOLi)
SE
I (eg
. Me
OL
i)
LiRuO2
LiR
uO
2
a
b
t1ω1i ω2i
tmixt2
7Li
7Li
14 NATURE MATERIALS | www.nature.com/naturematerials
SUPPLEMENTARY INFORMATION DOI: 10.1038/NMAT3784
© 2013 Macmillan Publishers Limited. All rights reserved.
14
Figure S9| a. The electrochemistry profile of a LiOH/Li battery discharged to 0.05 V vs Li. and charged to 4.3V. b. 6Li NMR spectra at the end of discharge (0.05 V): One-pulse 6Li spectrum (blue), 1H-6Li cross-polarization (CP) spectrum (red) and the difference (green) between the one-pulse and CP spectrum. c. 1H spectra of a LiOH electrode discharged to 0.05 V (green line), a RuO2 electrode cycled against Li metal to contain 4 Li (Li4d, purple line), and down to 0.05 V (black line). d. 2D 1H spin exchange NMR spectrum of the LiOH electrode discharged against Li metal to 0.05 V. The red dashed circles mark the off-diagonal 1H peaks connecting LiOH (-1.3 ppm) and LiH (3.5 ppm). The electrochemistry profile of a LiOH/Li battery for the 1st discharge and charge is shown in Fig. S9a. LiOH is not an electronic conductor, thus the battery performance is largely dependent on the mixing of LiOH with electronically conductive C. The highest practical capacity of LiOH achieved here is ~ 700 mAh/g. Fig. S9b shows 6Li spectra of a LiOH/Li cell discharged to 0.05 V. The one-pulse 6Li NMR spectrum (blue) shows all Li-containing chemical phases, including, LiH (~ 0 ppm), LiOH (1 ppm), and Li2O (2.6 ppm), while the cross polarization spectrum (red) selects only the protonated components, LiOH and LiH/MeOLi, with the difference (green) between these two spectra showing the non-protonated Li2O. LiH and Li2O are the products of the cathode reaction, LiOH + 2Li = LiH + Li2O, while LiOH is the remaining reactant. The 1D 1H spectra of the cycled cathode materials of the LiOH/Li and RuO2/Li batteries show two major components, LiOH (-1.3 ppm) and LiH (3.5 ppm), while the 1H spectra (black and purple) of the cycled RuO2/Li cathodes show an additional peak at 2.6 ppm, which is from the inert polymer binder, PDVF, used to make self-supporting cathode films. The relative intensity changes of the LiOH and LiH 1H peaks of the RuO2/Li cycled cathode materials have demonstrated that the process of discharging the battery from 0.8 V (purple) to 0.05 V (black) consumes LiOH (decreased 1H peak intensity at -1.3 ppm) and generates LiH (increased 1H peak intensity at 3.5 ppm); this is consistent with the reaction, LiOH + 2Li = LiH + Li2O, at the end of battery discharge in the RuO2/Li system. Fig. S9c also shows similar relative intensity of the LiOH and LiH peaks for both the LiOH/Li and RuO2/Li cathode materials discharged to 0.05 V (black and green). Fig. S9d displays a 2D spin exchange 1H NMR spectrum of a LiOH cathode discharged to 0.05V against Li metal. The off-diagonal (cross) peaks between the LiOH (-1.3 ppm) and LiH indicate that the product LiH is close in space to the reactant LiOH. The 2D exchange experiments are discussed in more detail in the next section. In the RuO2/Li system, the LiOH + 2Li = LiH + Li2O occurs on the surfaces of the Ru nanoparticles, and thus there should be more ready access to the reaction sites for both electrons and Li+ ions. In contrast, in the LiOH/Li system, it is a bulk reaction, activated only by intimate mixing with the carbon. Thus, it is not surprising that the theoretical capacity of LiOH is not achieved due to the large diffusion length to the core of the bulk for both electrons and ions. Thus it is not surprising that the 1H and 6Li NMR spectra in Fig. S9 (b,c,d) show significant amount of unreacted LiOH (46%).
15
2.4 Spatial proximity between phases 2.4.1 Direct measurement of spatial phase distribution-Two-dimensional exchange NMR
Figure S10| 7Li-7Li two-dimensional spin exchange NMR reveals the spacial proximity of different Li-containing chemical phases. a. The typical NMR pulse sequence used for 2D spin exchange experiments. b. 7Li-7Li two-dimensional spin-exchange NMR spectrum of a Li1d sample.
Two-dimensional spin exchange NMR experiments are powerful methods with which to determine the spatial proximity of different chemical phases on the nano-scale6 and are used here to help to understand the reaction mechanisms in more detail. 7Li-7Li, 6Li-
6Li, and 1H-1H spin exchange NMR experiments were carried out and the NMR pulse sequence for these experiments is shown in Fig. S10a. If during the mixing time, two components with different chemical shifts (frequencies) are in close spatial proximity (on the nano-scale), off-diagonal (cross) peaks are observed. If two components are far from each other, no interaction occurs during the mixing time and only peaks along the diagonal are observed in the 2D spin exchange NMR spectra (self- or auto-correlation peaks).
The cross peaks between LiRuO2 (~ 8 ppm) and SEI (~ 0 ppm, e.g. LiF and MeOLi) in the 7Li-7Li 2D spin exchange NMR spectrum of a sample Li1d shown in Figure S10b indicates the spatial proximity of these two components on the nano-scale.
Figure S11| Spatial correlations of different chemical species obtained in the RuO2/Li system. a, 6Li-6Li 2D spin exchange NMR spectrum of a sample discharged to
LiOH
LiOH
CH2(PVDF)
CH2(PVDF)
ppm
−8−48 4 0 ppm
−8
−4
8
4
0
1H
1H
ea
b
c
d
ppm
−1.05.0 4.0 3.0 2.0 1.0 0.0 ppm
−1.0
5.0
4.0
3.0
2.0
1.0
0.0
−14 3 2 1 0 ppm
X 3
6Li
6Li
LiH/MeOLiLiOH
Li2OLiH/MeOLi LiH/MeOLi
LiH/MeOLi
LiOH
Li2O
ppm
−520 15 10 5 0 ppm
−5
20
15
10
5
0
SEI (eg. MeOLi)
SE
I (eg
. Me
OL
i)
LiRuO2
LiR
uO
2
a
b
t1ω1i ω2i
tmixt2
7Li
7Li
NATURE MATERIALS | www.nature.com/naturematerials 15
SUPPLEMENTARY INFORMATIONDOI: 10.1038/NMAT3784
© 2013 Macmillan Publishers Limited. All rights reserved.
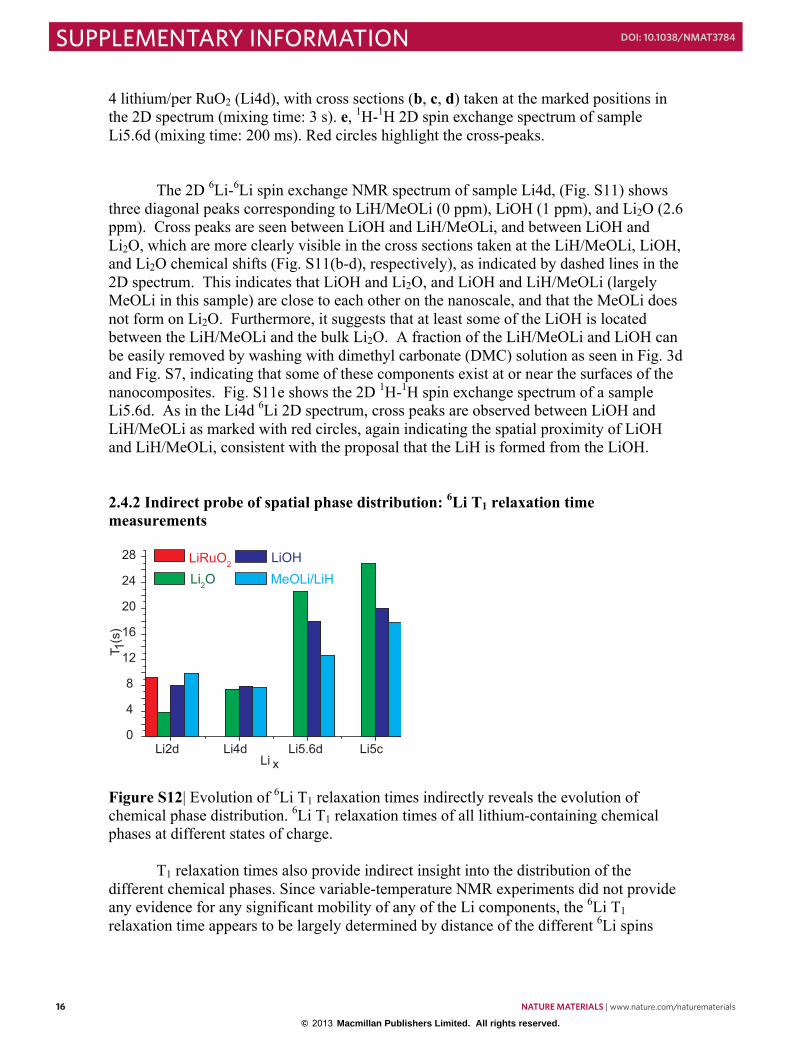
16
4 lithium/per RuO2 (Li4d), with cross sections (b, c, d) taken at the marked positions in the 2D spectrum (mixing time: 3 s). e, 1H-1H 2D spin exchange spectrum of sample Li5.6d (mixing time: 200 ms). Red circles highlight the cross-peaks.
The 2D 6Li-6Li spin exchange NMR spectrum of sample Li4d, (Fig. S11) shows three diagonal peaks corresponding to LiH/MeOLi (0 ppm), LiOH (1 ppm), and Li2O (2.6 ppm). Cross peaks are seen between LiOH and LiH/MeOLi, and between LiOH and Li2O, which are more clearly visible in the cross sections taken at the LiH/MeOLi, LiOH, and Li2O chemical shifts (Fig. S11(b-d), respectively), as indicated by dashed lines in the 2D spectrum. This indicates that LiOH and Li2O, and LiOH and LiH/MeOLi (largely MeOLi in this sample) are close to each other on the nanoscale, and that the MeOLi does not form on Li2O. Furthermore, it suggests that at least some of the LiOH is located between the LiH/MeOLi and the bulk Li2O. A fraction of the LiH/MeOLi and LiOH can be easily removed by washing with dimethyl carbonate (DMC) solution as seen in Fig. 3d and Fig. S7, indicating that some of these components exist at or near the surfaces of the nanocomposites. Fig. S11e shows the 2D 1H-1H spin exchange spectrum of a sample Li5.6d. As in the Li4d 6Li 2D spectrum, cross peaks are observed between LiOH and LiH/MeOLi as marked with red circles, again indicating the spatial proximity of LiOH and LiH/MeOLi, consistent with the proposal that the LiH is formed from the LiOH.
2.4.2 Indirect probe of spatial phase distribution: 6Li T1 relaxation time measurements
Figure S12| Evolution of 6Li T1 relaxation times indirectly reveals the evolution of chemical phase distribution. 6Li T1 relaxation times of all lithium-containing chemical phases at different states of charge.
T1 relaxation times also provide indirect insight into the distribution of the different chemical phases. Since variable-temperature NMR experiments did not provide any evidence for any significant mobility of any of the Li components, the 6Li T1 relaxation time appears to be largely determined by distance of the different 6Li spins
Li2d Li4d Li5.6d Li5c0
4
8
12
16
20
24
28
T 1 (s
)
Li x
LiRuO2
Li2OLiOH
MeOLi/LiH
17
from the metallic Ru particles, shorter distances resulting in shorter 6Li T1 relaxation times. As shown in Fig. S12, the shortest relaxation times (~ 4 s) are observed for Li2O formed initially (in sample Li2d), suggesting that these Li2O nanoparticles are formed on the Ru surfaces. (The fact that the LixRuO2 6Li T1 relaxation times are longer indicates that this phase is not the source of the major relaxation mechanism). As the reaction continues, the Li2O T1 relaxation times increase, suggesting some aggregation of Li2O into larger particles that are further from the Ru nanoparticles. A noticeable increase of the relaxation time from ~ 8 s (Li4d) to 23 s (Li5.6d) is in part ascribed to the formation of Li2O from LiOH forming a diamagnetic nanocomposite region comprising Li2O and LiH. 2.5 The Effect of Cell Relaxation on the Capacity and Chemical Species Observed
Cell relaxation imposes noticeable effects on the capacities and chemical species observed in the RuO2/Li battery, particularly at the low voltage region, which are related to the more sluggish electrolyte decomposition processes.
Fig. S13a shows a comparison of a GITT profile and a galvanostatic electrochemical profile by cycling a RuO2/Li battery continuously with two similar RuO2 electrodes (in terms of electrode composition, mass, film thickness (0.5 mm) etc). The cycle rate was C/100 for both cells and the rest time between steps for the GITT experiment was set to be 10 hours. Equilibrium is established in the first plateau region within 10 hours, and some additional capacity increase is seen in the GITT profile as compared to the regular cycling profile, as seen in Fig. S13a. More significant capacity gain in the GITT experiment has been observed at lower voltage regions, which is related to electrolyte decomposition and LiOH formation/reaction.
A thinner electrode film was prepared (50 µm thick) to carry out GITT experiments at the low voltage region (Fig. S13b), again the GITT profile shows significant capacity gain with relaxation. A comparison of the NMR spectrum of a battery cell disassembled immediately after cycling with one rested for 100 hours and then disassembled (Fig. S13c) shows an increased concentration of LiOH in the relaxed electrode. LiOH can, in principle, be generated via two schemes, the first involving the reduction of H2O associated with the RuO2 and the second via a reaction of water with the Li2O created during the conversion reaction (see Fig. 4 in the main text).
The formation of 17O enriched LiOH provides strong evidence that some of the water oxygen atoms must be associated with the original starting material. The fact that additional LiOH is generated during the relaxation step suggests that the direct formation of LiOH (reaction [1]) is likely accompanied by reaction [2].
LiRuO2•yH2O + 3Li+ + 3e- = 2yLiOH + Ru + (2-y)Li2O Reaction [1] LiRuO2•yH2O + 3Li+ + 3e- =Ru + 2Li2O + yH2O yLi2O + yH2O = 2yLiOH Reaction [2]
16 NATURE MATERIALS | www.nature.com/naturematerials
SUPPLEMENTARY INFORMATION DOI: 10.1038/NMAT3784
© 2013 Macmillan Publishers Limited. All rights reserved.
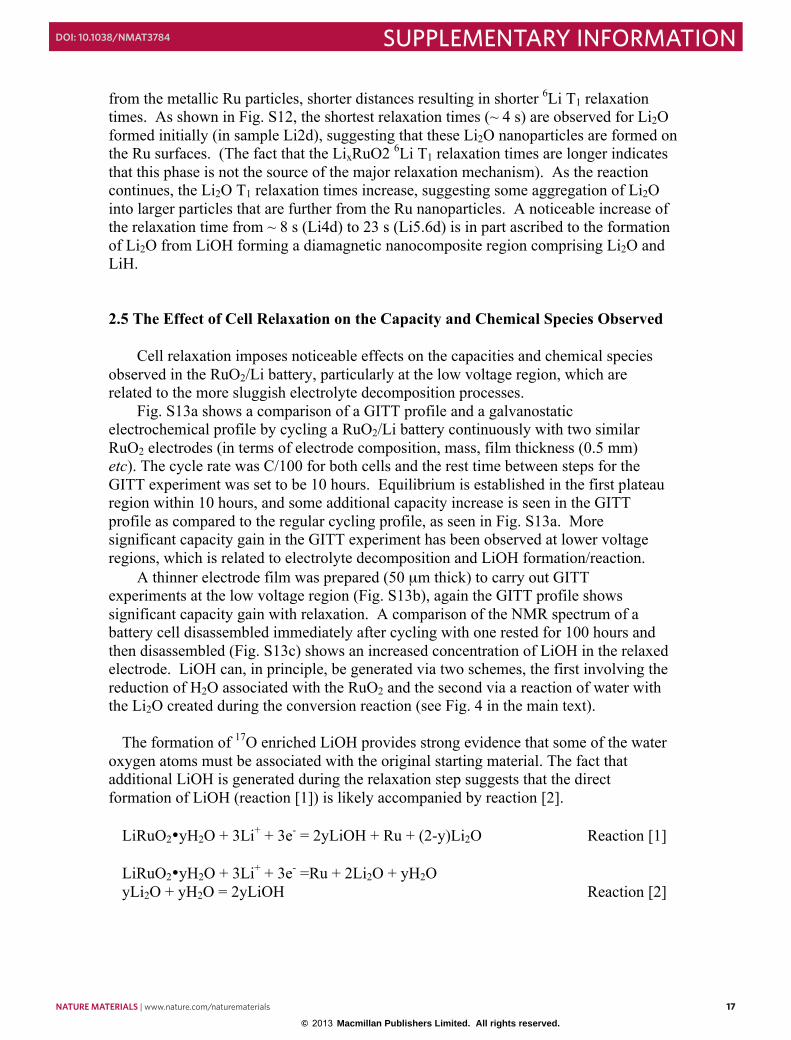
16
4 lithium/per RuO2 (Li4d), with cross sections (b, c, d) taken at the marked positions in the 2D spectrum (mixing time: 3 s). e, 1H-1H 2D spin exchange spectrum of sample Li5.6d (mixing time: 200 ms). Red circles highlight the cross-peaks.
The 2D 6Li-6Li spin exchange NMR spectrum of sample Li4d, (Fig. S11) shows three diagonal peaks corresponding to LiH/MeOLi (0 ppm), LiOH (1 ppm), and Li2O (2.6 ppm). Cross peaks are seen between LiOH and LiH/MeOLi, and between LiOH and Li2O, which are more clearly visible in the cross sections taken at the LiH/MeOLi, LiOH, and Li2O chemical shifts (Fig. S11(b-d), respectively), as indicated by dashed lines in the 2D spectrum. This indicates that LiOH and Li2O, and LiOH and LiH/MeOLi (largely MeOLi in this sample) are close to each other on the nanoscale, and that the MeOLi does not form on Li2O. Furthermore, it suggests that at least some of the LiOH is located between the LiH/MeOLi and the bulk Li2O. A fraction of the LiH/MeOLi and LiOH can be easily removed by washing with dimethyl carbonate (DMC) solution as seen in Fig. 3d and Fig. S7, indicating that some of these components exist at or near the surfaces of the nanocomposites. Fig. S11e shows the 2D 1H-1H spin exchange spectrum of a sample Li5.6d. As in the Li4d 6Li 2D spectrum, cross peaks are observed between LiOH and LiH/MeOLi as marked with red circles, again indicating the spatial proximity of LiOH and LiH/MeOLi, consistent with the proposal that the LiH is formed from the LiOH.
2.4.2 Indirect probe of spatial phase distribution: 6Li T1 relaxation time measurements
Figure S12| Evolution of 6Li T1 relaxation times indirectly reveals the evolution of chemical phase distribution. 6Li T1 relaxation times of all lithium-containing chemical phases at different states of charge.
T1 relaxation times also provide indirect insight into the distribution of the different chemical phases. Since variable-temperature NMR experiments did not provide any evidence for any significant mobility of any of the Li components, the 6Li T1 relaxation time appears to be largely determined by distance of the different 6Li spins
Li2d Li4d Li5.6d Li5c0
4
8
12
16
20
24
28
T 1 (s
)
Li x
LiRuO2
Li2OLiOH
MeOLi/LiH
17
from the metallic Ru particles, shorter distances resulting in shorter 6Li T1 relaxation times. As shown in Fig. S12, the shortest relaxation times (~ 4 s) are observed for Li2O formed initially (in sample Li2d), suggesting that these Li2O nanoparticles are formed on the Ru surfaces. (The fact that the LixRuO2 6Li T1 relaxation times are longer indicates that this phase is not the source of the major relaxation mechanism). As the reaction continues, the Li2O T1 relaxation times increase, suggesting some aggregation of Li2O into larger particles that are further from the Ru nanoparticles. A noticeable increase of the relaxation time from ~ 8 s (Li4d) to 23 s (Li5.6d) is in part ascribed to the formation of Li2O from LiOH forming a diamagnetic nanocomposite region comprising Li2O and LiH. 2.5 The Effect of Cell Relaxation on the Capacity and Chemical Species Observed
Cell relaxation imposes noticeable effects on the capacities and chemical species observed in the RuO2/Li battery, particularly at the low voltage region, which are related to the more sluggish electrolyte decomposition processes.
Fig. S13a shows a comparison of a GITT profile and a galvanostatic electrochemical profile by cycling a RuO2/Li battery continuously with two similar RuO2 electrodes (in terms of electrode composition, mass, film thickness (0.5 mm) etc). The cycle rate was C/100 for both cells and the rest time between steps for the GITT experiment was set to be 10 hours. Equilibrium is established in the first plateau region within 10 hours, and some additional capacity increase is seen in the GITT profile as compared to the regular cycling profile, as seen in Fig. S13a. More significant capacity gain in the GITT experiment has been observed at lower voltage regions, which is related to electrolyte decomposition and LiOH formation/reaction.
A thinner electrode film was prepared (50 µm thick) to carry out GITT experiments at the low voltage region (Fig. S13b), again the GITT profile shows significant capacity gain with relaxation. A comparison of the NMR spectrum of a battery cell disassembled immediately after cycling with one rested for 100 hours and then disassembled (Fig. S13c) shows an increased concentration of LiOH in the relaxed electrode. LiOH can, in principle, be generated via two schemes, the first involving the reduction of H2O associated with the RuO2 and the second via a reaction of water with the Li2O created during the conversion reaction (see Fig. 4 in the main text).
The formation of 17O enriched LiOH provides strong evidence that some of the water oxygen atoms must be associated with the original starting material. The fact that additional LiOH is generated during the relaxation step suggests that the direct formation of LiOH (reaction [1]) is likely accompanied by reaction [2].
LiRuO2•yH2O + 3Li+ + 3e- = 2yLiOH + Ru + (2-y)Li2O Reaction [1] LiRuO2•yH2O + 3Li+ + 3e- =Ru + 2Li2O + yH2O yLi2O + yH2O = 2yLiOH Reaction [2]
NATURE MATERIALS | www.nature.com/naturematerials 17
SUPPLEMENTARY INFORMATIONDOI: 10.1038/NMAT3784
© 2013 Macmillan Publishers Limited. All rights reserved.
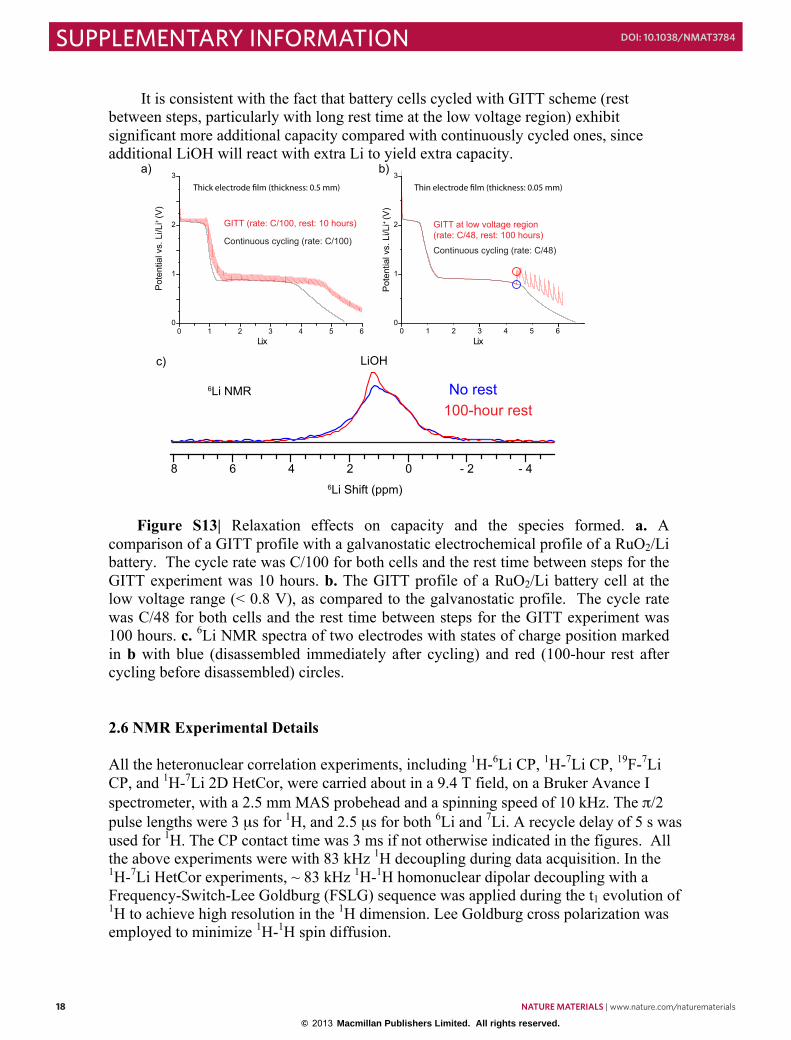
18
It is consistent with the fact that battery cells cycled with GITT scheme (rest between steps, particularly with long rest time at the low voltage region) exhibit significant more additional capacity compared with continuously cycled ones, since additional LiOH will react with extra Li to yield extra capacity.
Figure S13| Relaxation effects on capacity and the species formed. a. A
comparison of a GITT profile with a galvanostatic electrochemical profile of a RuO2/Li battery. The cycle rate was C/100 for both cells and the rest time between steps for the GITT experiment was 10 hours. b. The GITT profile of a RuO2/Li battery cell at the low voltage range (< 0.8 V), as compared to the galvanostatic profile. The cycle rate was C/48 for both cells and the rest time between steps for the GITT experiment was 100 hours. c. 6Li NMR spectra of two electrodes with states of charge position marked in b with blue (disassembled immediately after cycling) and red (100-hour rest after cycling before disassembled) circles. 2.6 NMR Experimental Details All the heteronuclear correlation experiments, including 1H-6Li CP, 1H-7Li CP, 19F-7Li CP, and 1H-7Li 2D HetCor, were carried about in a 9.4 T field, on a Bruker Avance I spectrometer, with a 2.5 mm MAS probehead and a spinning speed of 10 kHz. The π/2 pulse lengths were 3 µs for 1H, and 2.5 µs for both 6Li and 7Li. A recycle delay of 5 s was used for 1H. The CP contact time was 3 ms if not otherwise indicated in the figures. All the above experiments were with 83 kHz 1H decoupling during data acquisition. In the 1H-7Li HetCor experiments, ~ 83 kHz 1H-1H homonuclear dipolar decoupling with a Frequency-Switch-Lee Goldburg (FSLG) sequence was applied during the t1 evolution of 1H to achieve high resolution in the 1H dimension. Lee Goldburg cross polarization was employed to minimize 1H-1H spin diffusion.
0 1 2 3 4 5 6Lix Lix
GITT (rate: C/100, rest: 10 hours)
Continuous cycling (rate: C/100)
0
1
2
3
0
1
2
3
GITT at low voltage region (rate: C/48, rest: 100 hours)
Continuous cycling (rate: C/48)
Pot
entia
l vs.
Li/L
i+ (V
)
Pot
entia
l vs.
Li/L
i+ (V
)
1 2 3 4 5 60
Thick electrode �lm (thickness: 0.5 mm) Thin electrode �lm (thickness: 0.05 mm)
8 6 4 2 0 - 2 - 4
No rest100-hour rest
a) b)
c)
6Li Shift (ppm)
6Li NMR
LiOH
19
All the 2D exchange experiments, 1H 1D experiments, and the 17O experiments (including 17O one-pulse and CP experiments) were carried out in a 16.4 T field, on a Bruker Avance III spectrometer, and with a 1.3 mm MAS probehead. The spinning speed was 60 kHz for all the experiments, except for the 1H-17O CP experiment, which was at 10 kHz MAS. The π/2 pulse lengths were 2.5 µs for 1H, 2.6 µs for 6Li, 3 µs for 7Li, and 0.65 µs (solid π/2) for 17O. The recycle delays were 5 s for 1H, 90 s for 6Li, 10 s for 7Li, and 1 s for 17O. The mixing times in the 2D exchange experiments were 3 s for 7Li-7Li and 200 ms for 1H-1H 2D exchange. The 1H-17O CP contact time was 100 µs, and the Hartman-Hahn matching power level was 100 kHz for both 1H and 17O. 100 kHz MAS 1H decoupling was applied during data acquisition. A bag-cell assembled in an argon glove box was used for the in situ 6Li NMR experiment. The NMR experiment was carried out in a 7.0 T field, on a Bruker Avance I spectrometer, and with a 4-mm Bruker static probehead. A π/2 pulse length of 4 µs and a recycle delay of 60 s for 6Li were used. The battery was cycled with a rate of C/160 and each NMR spectrum was signal averaged over 128 scans. The 6Li NMR spectra in Fig. S9 were collected in a 4.7 T field, on a Bruker Avance III spectrometer, and with a 1.9-mm Bruker MAS probehead. The MAS spinning speed was 20 kHz. The 90o pulse lengths were of 3 µs for 6Li and 2.5 µs for 1H. The recycle delays were 90 s for 6Li and 5 s for 1H. A 1H-6Li CP contact time was 3 ms and 83 kHz 1H decoupling during data acquisition was used. The following chemical shift references were used: 1M 6LiCl (0 ppm) for 6Li, 1M 7LiCl (0 ppm) for 7Li, adamantine (1.75 and 1.87 ppm) for 1H, and CeO2 (877 ppm) for 17O. 3. First Principles Calculations 3.1 Results and discussions
!
1 2 3 4 5 6 7 8 9 10 11Distance L (angstrom)
-0.6
-0.4
-0.2
0
0.2
0.4
0.6
0.8
1
1.2
OCV
(V)
1 2 3 4 5 6 7 8 9 10 11Distance L (angstrom)
-1
-0.8
-0.6
-0.4
-0.2
0
0.2
0.4
0.6
0.8
Rela
tive
ener
gy (e
V)
!"
!"
#$%" #&%"
#'%"
18 NATURE MATERIALS | www.nature.com/naturematerials
SUPPLEMENTARY INFORMATION DOI: 10.1038/NMAT3784
© 2013 Macmillan Publishers Limited. All rights reserved.

18
It is consistent with the fact that battery cells cycled with GITT scheme (rest between steps, particularly with long rest time at the low voltage region) exhibit significant more additional capacity compared with continuously cycled ones, since additional LiOH will react with extra Li to yield extra capacity.
Figure S13| Relaxation effects on capacity and the species formed. a. A
comparison of a GITT profile with a galvanostatic electrochemical profile of a RuO2/Li battery. The cycle rate was C/100 for both cells and the rest time between steps for the GITT experiment was 10 hours. b. The GITT profile of a RuO2/Li battery cell at the low voltage range (< 0.8 V), as compared to the galvanostatic profile. The cycle rate was C/48 for both cells and the rest time between steps for the GITT experiment was 100 hours. c. 6Li NMR spectra of two electrodes with states of charge position marked in b with blue (disassembled immediately after cycling) and red (100-hour rest after cycling before disassembled) circles. 2.6 NMR Experimental Details All the heteronuclear correlation experiments, including 1H-6Li CP, 1H-7Li CP, 19F-7Li CP, and 1H-7Li 2D HetCor, were carried about in a 9.4 T field, on a Bruker Avance I spectrometer, with a 2.5 mm MAS probehead and a spinning speed of 10 kHz. The π/2 pulse lengths were 3 µs for 1H, and 2.5 µs for both 6Li and 7Li. A recycle delay of 5 s was used for 1H. The CP contact time was 3 ms if not otherwise indicated in the figures. All the above experiments were with 83 kHz 1H decoupling during data acquisition. In the 1H-7Li HetCor experiments, ~ 83 kHz 1H-1H homonuclear dipolar decoupling with a Frequency-Switch-Lee Goldburg (FSLG) sequence was applied during the t1 evolution of 1H to achieve high resolution in the 1H dimension. Lee Goldburg cross polarization was employed to minimize 1H-1H spin diffusion.
0 1 2 3 4 5 6Lix Lix
GITT (rate: C/100, rest: 10 hours)
Continuous cycling (rate: C/100)
0
1
2
3
0
1
2
3
GITT at low voltage region (rate: C/48, rest: 100 hours)
Continuous cycling (rate: C/48)
Pot
entia
l vs.
Li/L
i+ (V
)
Pot
entia
l vs.
Li/L
i+ (V
)
1 2 3 4 5 60
Thick electrode �lm (thickness: 0.5 mm) Thin electrode �lm (thickness: 0.05 mm)
8 6 4 2 0 - 2 - 4
No rest100-hour rest
a) b)
c)
6Li Shift (ppm)
6Li NMR
LiOH
19
All the 2D exchange experiments, 1H 1D experiments, and the 17O experiments (including 17O one-pulse and CP experiments) were carried out in a 16.4 T field, on a Bruker Avance III spectrometer, and with a 1.3 mm MAS probehead. The spinning speed was 60 kHz for all the experiments, except for the 1H-17O CP experiment, which was at 10 kHz MAS. The π/2 pulse lengths were 2.5 µs for 1H, 2.6 µs for 6Li, 3 µs for 7Li, and 0.65 µs (solid π/2) for 17O. The recycle delays were 5 s for 1H, 90 s for 6Li, 10 s for 7Li, and 1 s for 17O. The mixing times in the 2D exchange experiments were 3 s for 7Li-7Li and 200 ms for 1H-1H 2D exchange. The 1H-17O CP contact time was 100 µs, and the Hartman-Hahn matching power level was 100 kHz for both 1H and 17O. 100 kHz MAS 1H decoupling was applied during data acquisition. A bag-cell assembled in an argon glove box was used for the in situ 6Li NMR experiment. The NMR experiment was carried out in a 7.0 T field, on a Bruker Avance I spectrometer, and with a 4-mm Bruker static probehead. A π/2 pulse length of 4 µs and a recycle delay of 60 s for 6Li were used. The battery was cycled with a rate of C/160 and each NMR spectrum was signal averaged over 128 scans. The 6Li NMR spectra in Fig. S9 were collected in a 4.7 T field, on a Bruker Avance III spectrometer, and with a 1.9-mm Bruker MAS probehead. The MAS spinning speed was 20 kHz. The 90o pulse lengths were of 3 µs for 6Li and 2.5 µs for 1H. The recycle delays were 90 s for 6Li and 5 s for 1H. A 1H-6Li CP contact time was 3 ms and 83 kHz 1H decoupling during data acquisition was used. The following chemical shift references were used: 1M 6LiCl (0 ppm) for 6Li, 1M 7LiCl (0 ppm) for 7Li, adamantine (1.75 and 1.87 ppm) for 1H, and CeO2 (877 ppm) for 17O. 3. First Principles Calculations 3.1 Results and discussions
!
1 2 3 4 5 6 7 8 9 10 11Distance L (angstrom)
-0.6
-0.4
-0.2
0
0.2
0.4
0.6
0.8
1
1.2
OCV
(V)
1 2 3 4 5 6 7 8 9 10 11Distance L (angstrom)
-1
-0.8
-0.6
-0.4
-0.2
0
0.2
0.4
0.6
0.8
Rela
tive
ener
gy (e
V)
!"
!"
#$%" #&%"
#'%"
NATURE MATERIALS | www.nature.com/naturematerials 19
SUPPLEMENTARY INFORMATIONDOI: 10.1038/NMAT3784
© 2013 Macmillan Publishers Limited. All rights reserved.
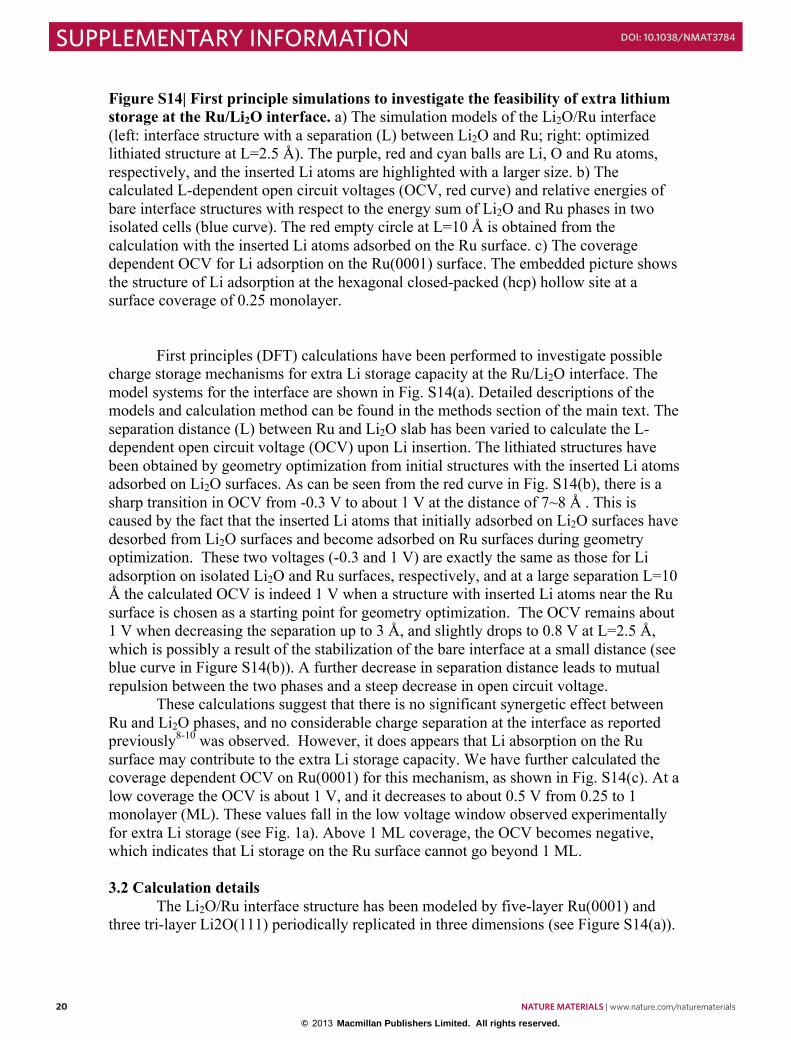
20
Figure S14| First principle simulations to investigate the feasibility of extra lithium storage at the Ru/Li2O interface. a) The simulation models of the Li2O/Ru interface (left: interface structure with a separation (L) between Li2O and Ru; right: optimized lithiated structure at L=2.5 Å). The purple, red and cyan balls are Li, O and Ru atoms, respectively, and the inserted Li atoms are highlighted with a larger size. b) The calculated L-dependent open circuit voltages (OCV, red curve) and relative energies of bare interface structures with respect to the energy sum of Li2O and Ru phases in two isolated cells (blue curve). The red empty circle at L=10 Å is obtained from the calculation with the inserted Li atoms adsorbed on the Ru surface. c) The coverage dependent OCV for Li adsorption on the Ru(0001) surface. The embedded picture shows the structure of Li adsorption at the hexagonal closed-packed (hcp) hollow site at a surface coverage of 0.25 monolayer.
First principles (DFT) calculations have been performed to investigate possible charge storage mechanisms for extra Li storage capacity at the Ru/Li2O interface. The model systems for the interface are shown in Fig. S14(a). Detailed descriptions of the models and calculation method can be found in the methods section of the main text. The separation distance (L) between Ru and Li2O slab has been varied to calculate the L-dependent open circuit voltage (OCV) upon Li insertion. The lithiated structures have been obtained by geometry optimization from initial structures with the inserted Li atoms adsorbed on Li2O surfaces. As can be seen from the red curve in Fig. S14(b), there is a sharp transition in OCV from -0.3 V to about 1 V at the distance of 7~8 Å . This is caused by the fact that the inserted Li atoms that initially adsorbed on Li2O surfaces have desorbed from Li2O surfaces and become adsorbed on Ru surfaces during geometry optimization. These two voltages (-0.3 and 1 V) are exactly the same as those for Li adsorption on isolated Li2O and Ru surfaces, respectively, and at a large separation L=10 Å the calculated OCV is indeed 1 V when a structure with inserted Li atoms near the Ru surface is chosen as a starting point for geometry optimization. The OCV remains about 1 V when decreasing the separation up to 3 Å, and slightly drops to 0.8 V at L=2.5 Å, which is possibly a result of the stabilization of the bare interface at a small distance (see blue curve in Figure S14(b)). A further decrease in separation distance leads to mutual repulsion between the two phases and a steep decrease in open circuit voltage.
These calculations suggest that there is no significant synergetic effect between Ru and Li2O phases, and no considerable charge separation at the interface as reported previously8-10 was observed. However, it does appears that Li absorption on the Ru surface may contribute to the extra Li storage capacity. We have further calculated the coverage dependent OCV on Ru(0001) for this mechanism, as shown in Fig. S14(c). At a low coverage the OCV is about 1 V, and it decreases to about 0.5 V from 0.25 to 1 monolayer (ML). These values fall in the low voltage window observed experimentally for extra Li storage (see Fig. 1a). Above 1 ML coverage, the OCV becomes negative, which indicates that Li storage on the Ru surface cannot go beyond 1 ML. 3.2 Calculation details
The Li2O/Ru interface structure has been modeled by five-layer Ru(0001) and three tri-layer Li2O(111) periodically replicated in three dimensions (see Figure S14(a)).
21
These two surfaces have been selected because they are stable and symmetry permits them to be incorporated in the same type of lattice. The Ru slab is placed right in the middle of the Li2O slab and its image along the z direction in order that there are two symmetric interfaces in the simulation cell. The relative alignment of the two slabs along xy directions allows the inserted Li atoms to locate at the hollow sites on Ru(0001) and the top sites of O atoms on Li2O(111). 1×1 surface unit cells are used for both Ru(0001) and Li2O(111), and the hexagonal surface lattice is fixed to that of Li2O(111). This means that the Ru lattice has to be stretched by 20% as there is a mismatch in the lattice constants. Ideally, one should model the interface by a surface supercell consisting of 5×5 Li2O(111) and 6×6 Ru(0001). It is however very expensive to simulate such a large cell. We have also calculated the interface with 2×2 Li2O(111) and 3×3 Ru(0001), i.e. the Ru lattice is suppressed by about 20%, and found that the results are consistent with what we find previously in the 1×1 surface unit cell.
When the L-dependent open circuit voltage (OCV) in Figure S14(b) is calculated, the unit cells have been fixed. When L is small, ~ 2.5 Å, one calculation was tried that allows the unit cell in the z direction to relax (xy directions are still fixed) during geometry optimization, and found the OCV is 1 V, being close to that without cell relaxation.
Li adsorption on single Ru phase has been calculated on a four-layer 2×2 Ru(0001) slab. The three-fold hollow site (both hcp and fcc hollow sites) is the most favorable for Li adsorption, only slightly more stable than bridge and top sites (by 0.03 and 0.2 eV, respectively).
The OCVs for Li insertion have been computed using the standard approach in literature 11 12, which is briefly summarized as follows. The cell reaction can be written as
, where Li(s) indicates metallic Li, x is the molar fraction of Li in the host materials and host in the present study stands for Li2O/Ru interface and Ru(0001) surface, respectively. The OCV is often represented as the average voltage of the above reaction
, where ΔG is the reaction free energy, z is the charge of lithium ion (z=1) and F is the Faraday constant. In solid states, entropic effect is usually small, and therefore ΔG is often replaced by the ground state total energy obtained by DFT calculations
References 1 Ohzuku, T., Sawai, K. & Hirai, T. Topotactic 2-‐Phase Reaction of Ruthenium
Dioxide (Rutile) in Lithium Nonaqueous Cell. Journal of The Electrochemical Society 137, 3004-‐3010, doi:Doi 10.1149/1.2086149 (1990).
2 Wang, Q., Hanson, J. C. & Frenkel, A. I. Solving the structure of reaction intermediates by time-‐resolved synchrotron x-‐ray absorption spectroscopy. J Chem Phys 129, doi:Artn 234502 Doi 10.1063/1.3040271 (2008).
3 Munoz-‐Rojas, D., Casas-‐Cabanas, M. & Baudrin, E. Effect of particle size and cell parameter mismatch on the lithium insertion/deinsertion processes into
€
(x2 − x1)Li(s) +Lix1host →Lix2host
€
OCV(x) = −ΔG
(x2 − x1)zF
€
ΔG ≈ Etot Lix2host[ ] − Etot Lix1host[ ] − (x2 − x1)Etot Li(s)[ ]
20 NATURE MATERIALS | www.nature.com/naturematerials
SUPPLEMENTARY INFORMATION DOI: 10.1038/NMAT3784
© 2013 Macmillan Publishers Limited. All rights reserved.
20
Figure S14| First principle simulations to investigate the feasibility of extra lithium storage at the Ru/Li2O interface. a) The simulation models of the Li2O/Ru interface (left: interface structure with a separation (L) between Li2O and Ru; right: optimized lithiated structure at L=2.5 Å). The purple, red and cyan balls are Li, O and Ru atoms, respectively, and the inserted Li atoms are highlighted with a larger size. b) The calculated L-dependent open circuit voltages (OCV, red curve) and relative energies of bare interface structures with respect to the energy sum of Li2O and Ru phases in two isolated cells (blue curve). The red empty circle at L=10 Å is obtained from the calculation with the inserted Li atoms adsorbed on the Ru surface. c) The coverage dependent OCV for Li adsorption on the Ru(0001) surface. The embedded picture shows the structure of Li adsorption at the hexagonal closed-packed (hcp) hollow site at a surface coverage of 0.25 monolayer.
First principles (DFT) calculations have been performed to investigate possible charge storage mechanisms for extra Li storage capacity at the Ru/Li2O interface. The model systems for the interface are shown in Fig. S14(a). Detailed descriptions of the models and calculation method can be found in the methods section of the main text. The separation distance (L) between Ru and Li2O slab has been varied to calculate the L-dependent open circuit voltage (OCV) upon Li insertion. The lithiated structures have been obtained by geometry optimization from initial structures with the inserted Li atoms adsorbed on Li2O surfaces. As can be seen from the red curve in Fig. S14(b), there is a sharp transition in OCV from -0.3 V to about 1 V at the distance of 7~8 Å . This is caused by the fact that the inserted Li atoms that initially adsorbed on Li2O surfaces have desorbed from Li2O surfaces and become adsorbed on Ru surfaces during geometry optimization. These two voltages (-0.3 and 1 V) are exactly the same as those for Li adsorption on isolated Li2O and Ru surfaces, respectively, and at a large separation L=10 Å the calculated OCV is indeed 1 V when a structure with inserted Li atoms near the Ru surface is chosen as a starting point for geometry optimization. The OCV remains about 1 V when decreasing the separation up to 3 Å, and slightly drops to 0.8 V at L=2.5 Å, which is possibly a result of the stabilization of the bare interface at a small distance (see blue curve in Figure S14(b)). A further decrease in separation distance leads to mutual repulsion between the two phases and a steep decrease in open circuit voltage.
These calculations suggest that there is no significant synergetic effect between Ru and Li2O phases, and no considerable charge separation at the interface as reported previously8-10 was observed. However, it does appears that Li absorption on the Ru surface may contribute to the extra Li storage capacity. We have further calculated the coverage dependent OCV on Ru(0001) for this mechanism, as shown in Fig. S14(c). At a low coverage the OCV is about 1 V, and it decreases to about 0.5 V from 0.25 to 1 monolayer (ML). These values fall in the low voltage window observed experimentally for extra Li storage (see Fig. 1a). Above 1 ML coverage, the OCV becomes negative, which indicates that Li storage on the Ru surface cannot go beyond 1 ML. 3.2 Calculation details
The Li2O/Ru interface structure has been modeled by five-layer Ru(0001) and three tri-layer Li2O(111) periodically replicated in three dimensions (see Figure S14(a)).
21
These two surfaces have been selected because they are stable and symmetry permits them to be incorporated in the same type of lattice. The Ru slab is placed right in the middle of the Li2O slab and its image along the z direction in order that there are two symmetric interfaces in the simulation cell. The relative alignment of the two slabs along xy directions allows the inserted Li atoms to locate at the hollow sites on Ru(0001) and the top sites of O atoms on Li2O(111). 1×1 surface unit cells are used for both Ru(0001) and Li2O(111), and the hexagonal surface lattice is fixed to that of Li2O(111). This means that the Ru lattice has to be stretched by 20% as there is a mismatch in the lattice constants. Ideally, one should model the interface by a surface supercell consisting of 5×5 Li2O(111) and 6×6 Ru(0001). It is however very expensive to simulate such a large cell. We have also calculated the interface with 2×2 Li2O(111) and 3×3 Ru(0001), i.e. the Ru lattice is suppressed by about 20%, and found that the results are consistent with what we find previously in the 1×1 surface unit cell.
When the L-dependent open circuit voltage (OCV) in Figure S14(b) is calculated, the unit cells have been fixed. When L is small, ~ 2.5 Å, one calculation was tried that allows the unit cell in the z direction to relax (xy directions are still fixed) during geometry optimization, and found the OCV is 1 V, being close to that without cell relaxation.
Li adsorption on single Ru phase has been calculated on a four-layer 2×2 Ru(0001) slab. The three-fold hollow site (both hcp and fcc hollow sites) is the most favorable for Li adsorption, only slightly more stable than bridge and top sites (by 0.03 and 0.2 eV, respectively).
The OCVs for Li insertion have been computed using the standard approach in literature 11 12, which is briefly summarized as follows. The cell reaction can be written as
, where Li(s) indicates metallic Li, x is the molar fraction of Li in the host materials and host in the present study stands for Li2O/Ru interface and Ru(0001) surface, respectively. The OCV is often represented as the average voltage of the above reaction
, where ΔG is the reaction free energy, z is the charge of lithium ion (z=1) and F is the Faraday constant. In solid states, entropic effect is usually small, and therefore ΔG is often replaced by the ground state total energy obtained by DFT calculations
References 1 Ohzuku, T., Sawai, K. & Hirai, T. Topotactic 2-‐Phase Reaction of Ruthenium
Dioxide (Rutile) in Lithium Nonaqueous Cell. Journal of The Electrochemical Society 137, 3004-‐3010, doi:Doi 10.1149/1.2086149 (1990).
2 Wang, Q., Hanson, J. C. & Frenkel, A. I. Solving the structure of reaction intermediates by time-‐resolved synchrotron x-‐ray absorption spectroscopy. J Chem Phys 129, doi:Artn 234502 Doi 10.1063/1.3040271 (2008).
3 Munoz-‐Rojas, D., Casas-‐Cabanas, M. & Baudrin, E. Effect of particle size and cell parameter mismatch on the lithium insertion/deinsertion processes into
€
(x2 − x1)Li(s) +Lix1host →Lix2host
€
OCV(x) = −ΔG
(x2 − x1)zF
€
ΔG ≈ Etot Lix2host[ ] − Etot Lix1host[ ] − (x2 − x1)Etot Li(s)[ ]
NATURE MATERIALS | www.nature.com/naturematerials 21
SUPPLEMENTARY INFORMATIONDOI: 10.1038/NMAT3784
© 2013 Macmillan Publishers Limited. All rights reserved.

22
RuO2. Solid State Ionics 181, 536-‐544, doi:Doi 10.1016/J.Ssi.2010.02.021 (2010).
4 Leriche, J. B. et al. An Electrochemical Cell for Operando Study of Lithium Batteries Using Synchrotron Radiation. Journal of The Electrochemical Society 157, doi:10.1149/1.3355977 (2010).
5 Ankudinov, A. L., Ravel, B., Rehr, J. J. & Conradson, S. D. Real-‐space multiple-‐scattering calculation and interpretation of x-‐ray-‐absorption near-‐edge structure. Phys Rev B 58, 7565-‐7576 (1998).
6 Schmidt-‐Rohr, K. & Spiess, H. W. Multidimensional Solid State NMR and Polymers. (Academic Press Limited, 1994).
7 Ponrouch, A., Taberna, P. L., Simon, P. & Palacin, M. R. On the origin of the extra capacity at low potential in materials for Li batteries reacting through conversion reaction. Electrochim Acta 61, 13-‐18, doi:Doi 10.1016/J.Electacta.2011.11.029 (2012).
8 Jamnik, J. & Maier, J. Nanocrystallinity effects in lithium battery materials -‐ Aspects of nano-‐ionics. Part IV. Phys Chem Chem Phys 5, 5215-‐5220, doi:Doi 10.1039/B309130a (2003).
9 Zhukovskii, Y. F., Balaya, P., Dolle, M., Kotomin, E. A. & Maier, J. Enhanced lithium storage and chemical diffusion in metal-‐LiF nanocomposites: Experimental and theoretical results. Phys Rev B 76, doi:Artn 235414 Doi 10.1103/Physrevb.76.235414 (2007).
10 Zhukovskii, Y. F., Balaya, P., Kotomin, E. A. & Maier, J. Evidence for interfacial-‐storage anomaly in nanocomposites for lithium batteries from first-‐principles simulations. Phys Rev Lett 96, doi:Artn 058302 Doi 10.1103/Physrevlett.96.058302 (2006).
11 Aydinol, M. K., Kohan, A. F., Ceder, G., Cho, K. & Joannopoulos, J. Ab initio study of lithium intercalation in metal oxides and metal dichalcogenides. Phys Rev B 56, 1354-‐1365 (1997).
12 Meng, Y. S. & Arroyo-‐de Dompablo, M. E. First principles computational materials design for energy storage materials in lithium ion batteries. Energ Environ Sci 2, 589-‐609, doi:Doi 10.1039/B901825e (2009).
22 NATURE MATERIALS | www.nature.com/naturematerials
SUPPLEMENTARY INFORMATION DOI: 10.1038/NMAT3784
© 2013 Macmillan Publishers Limited. All rights reserved.