Origin – Australia Pacific LNG Site Tour
67
Origin – Australia Pacific LNG Site Tour David Baldwin, Chief Executive Officer LNG 30-31 October 2014
Transcript of Origin – Australia Pacific LNG Site Tour

Origin – Australia Pacific LNG Site Tour
David Baldwin, Chief Executive Officer LNG 30-31 October 2014

Important Information
This presentation contains forward looking statements, including statements of current intention, statements of opinion and predictions as to possible future events. Such statements are not statements of fact and there can be no certainty of outcome in relation to the matters to which the statements relate. These forward looking statements involve known and unknown risks, uncertainties, assumptions and other important factors that could cause the actual outcomes to be materially different from the events or results expressed or implied by such statements. Those risks, uncertainties, assumptions and other important factors are not all within the control of Origin and cannot be predicted by Origin and include changes in circumstances or events that may cause objectives to change as well as risks, circumstances and events specific to the industry, countries and markets in which Origin and its related bodies corporate, joint ventures and associated undertakings operate. They also include general economic conditions, exchange rates, interest rates, the regulatory environment, competitive pressures, selling price, market demand and conditions in the financial markets which may cause objectives to change or may cause outcomes not to be realised.
None of Origin Energy Limited or any of its respective subsidiaries, affiliates and associated companies (or any of their respective officers, employees or agents) (the Relevant Persons) makes any representation, assurance or guarantee as to the accuracy or likelihood of fulfilment of any forward looking statement or any outcomes expressed or implied in any forward looking statements. The forward looking statements in this presentation reflect views held only at the date of this presentation.
Statements about past performance are not necessarily indicative of future performance.
Except as required by applicable law or the ASX Listing Rules, the Relevant Persons disclaim any obligation or undertaking to publicly update any forward looking statements, whether as a result of new information or future events.
This presentation does not constitute investment advice, or an inducement or recommendation to acquire or dispose of any securities in Origin, in any jurisdiction.
Reserves
This presentation includes disclosures of Origin and APLNG’s reserves and resources as at 30 June 2014. These reserves and resources were announced on 31 July 2014 in Origin’s Annual Reserves Report for the year ended 30 June 2014 (Annual Reserves Report). Origin confirms that it is not aware of any new information or data that materially affects the information included in the Annual Reserves Report and that all the material assumptions and technical parameters underpinning the estimates in the Annual Reserves Report continue to apply and have not materially changed.
Petroleum reserves and contingent resources are typically prepared by deterministic methods with support from probabilistic methods. Petroleum reserves and contingent resources are aggregated by arithmetic summation by category and as a result, proved reserves (1P reserves) may be a conservative estimate due to the portfolio effects of the arithmetic summation. Proved plus probable plus possible (3P reserves) may be an optimistic estimate due to the same aforementioned reasons.
Some of Australia Pacific LNG CSG reserves and resources are subject to reversionary rights to transfer back to Tri-Star a 45% interest in Australia Pacific LNG’s share of those CSG interests that were acquired from Tri-Star in 2002 if certain conditions are met. Origin has assessed the potential impact of reversionary rights associated with such interests based on economic tests consistent with these reserves and resources and based on that assessment does not consider that reversion will impact the reserves quoted within the Annual Reserves Report.
2 |

Safety is our first priority
6.0
4.7
0
500
1,000
1,500
2,000
2,500
1
2
3
4
5
6
7
Man
Hou
rs (
x1,0
00)
Reco
rdab
le In
juri
es /
TRI
FR
LNG TRIFR
Total Man Hours LNG TRIFR (Rolling 12 Months)
3 |

Operational Review and Asset Visit
CONDABRI - Day 1
Site Tour: - Flyover of gas operations - Bus tour Condabri Central construction area
- Gas processing facilities - Water treatment facilities - Landowner visit
- Flyover of Curtis Island, Gladstone
Presentations: - Field Performance / Exploration & Appraisal - Upstream Project Delivery - Commissioning - Sustain Phase
CURTIS ISLAND - Day 2
Site Tour: - Bus tour of APLNG site on Curtis Island
Presentation: - Downstream Delivery
4 |
Condabri Central – gas processing facility, October 2014
Curtis Island site, August 2014

Australia Pacific LNG has world leading operators
UPSTREAM – 85% complete1
• Operated by Origin
• Over 16 years’ CSG production experience in Australia
• Complemented by over 25 years of ConocoPhillips’ CSG experience
DOWNSTREAM – 82% complete1 • Operated by ConocoPhillips
• Over 40 years’ LNG production experience
• Using ConocoPhillips’ Optimised Cascade® technology licence, Bechtel has delivered 8 LNG trains globally
Drilling Gathering Gas & water facilities
Electrification Water disposal/ treatment Pipelines
LNG Plant, Tanks and LNG Terminal
(1) As at 30 September 2014.
5 |

0
500
1,000
1,500
2,000
TJ/D
ay
Production Post Turndown Production Pre Turndown
6 |
Mid-2015 Mid-2016
Turndown strategies expected to deliver opportunities through the ramp period to maximise value by retaining gas for future LNG sales
… with full production expected from both trains by the end of FY2016
APLNG is on track for first LNG in mid-2015...
Domestic
Train 1
Train 2

12.5
17.2
21.022.5
51%
70%
85%
91%
45%
60%
76%
84%
30%
40%
50%
60%
70%
80%
90%
100%
0.0
3.0
6.0
9.0
12.0
15.0
18.0
21.0
24.0
27.0
Jun-13 Dec-13 Jun-14 Dec-14 Jun-15 Dec-15
$bn
Project spend (LHS)% spent of $24.7bn (RHS)% project complete, reported (RHS)
Train 2Train 1
Project progress - 84% complete at 30 September 2014
• Project costs have been incurred ahead of project activity, with non-operated activity and spend incurred ahead of APLNG operated fields (% project complete measured using operated activity only)
• Actual capital expenditure to date in non-operated areas higher than anticipated based on progress to date and APLNG remains exposed to any increased costs arising in non-operated areas
7 |
mid
Planning underway for transitioning from initial development phase to investment in sustaining production and ongoing operations
mid-CY2015 late-CY2015
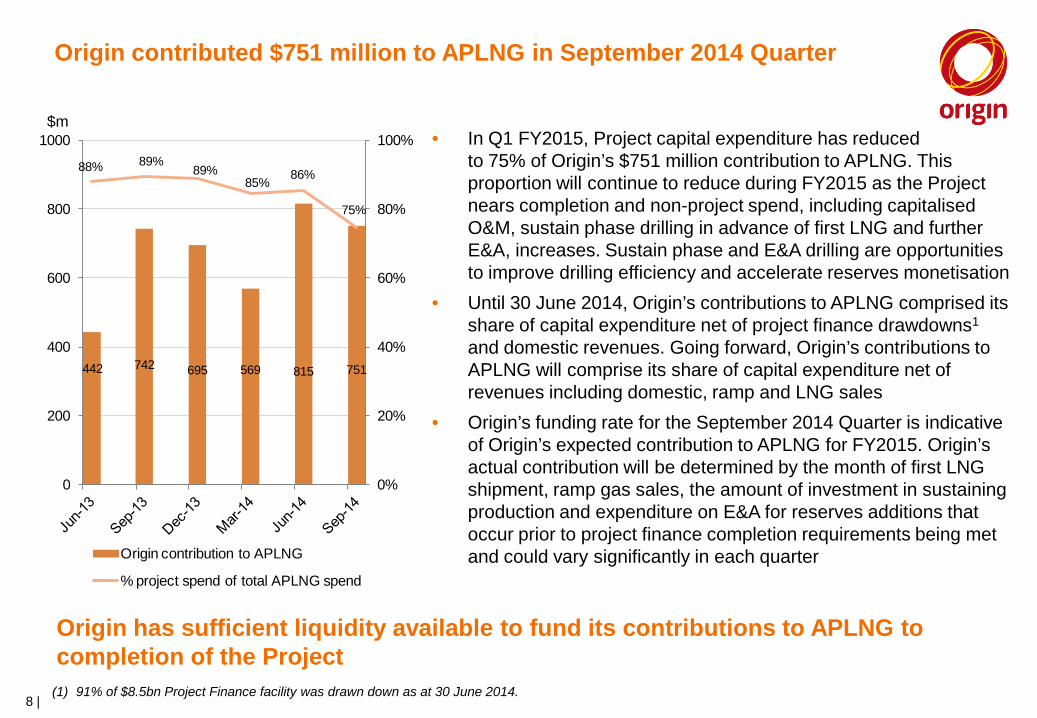
Origin contributed $751 million to APLNG in September 2014 Quarter
• In Q1 FY2015, Project capital expenditure has reduced to 75% of Origin’s $751 million contribution to APLNG. This proportion will continue to reduce during FY2015 as the Project nears completion and non-project spend, including capitalised O&M, sustain phase drilling in advance of first LNG and further E&A, increases. Sustain phase and E&A drilling are opportunities to improve drilling efficiency and accelerate reserves monetisation
• Until 30 June 2014, Origin’s contributions to APLNG comprised its share of capital expenditure net of project finance drawdowns1 and domestic revenues. Going forward, Origin’s contributions to APLNG will comprise its share of capital expenditure net of revenues including domestic, ramp and LNG sales
• Origin’s funding rate for the September 2014 Quarter is indicative of Origin’s expected contribution to APLNG for FY2015. Origin’s actual contribution will be determined by the month of first LNG shipment, ramp gas sales, the amount of investment in sustaining production and expenditure on E&A for reserves additions that occur prior to project finance completion requirements being met and could vary significantly in each quarter
8 |
Origin has sufficient liquidity available to fund its contributions to APLNG to completion of the Project
(1) 91% of $8.5bn Project Finance facility was drawn down as at 30 June 2014.
442 742 695 569 815 751
88% 89%89%
85% 86%
75%
0%
20%
40%
60%
80%
100%
0
200
400
600
800
1000$m
Origin contribution to APLNG
% project spend of total APLNG spend

FIELD PERFORMANCE/ EXPLORATION & APPRAISAL

10 |
(1) Refer to Important Information on slide 2. 1P Reserves are 4,581 PJe, 2P Reserves are 14,091 PJe. (2) Predominantly represents tail gas for two trains, with a small amount of ramp gas, volume will vary depending on operation strategy.
APLNG tenure in the Surat and Bowen basins at 30 April 2014
APLNG’s reserves base includes prime acreage in both known and industry accepted “sweet spots” in Queensland …
100% APLNG Reserves and Resources1
Train 1
Origin Contract
1P
Ramp and Tail Gas Train 2
3P
2P
QCLNG GSA
Domestic Gas
2
PJ
… with 2P reserves more than sufficient to cover gas requirements for all domestic contracts, as well as off-takes for both LNG trains
-
5,000
10,000
15,000
20,000
Estimated Requirements

Strong reserve increases from recent acreage additions, successful appraisal …
… and improved outcomes in development areas 11 |
Increased data density from development
drilling improves understanding
Successful appraisal to fill in
‘data gaps’
Accelerated maturation in
recent acreage additions with
results better than expected

Surat & Bowen Exploration & Appraisal Programme CY 15/16 targeting upside potential and application of new technology
12 |
Reids Dome. Follow up drilling complete. Excellent results obtained. Pilot to be accelerated into CY2015.
Walloons Appraisal Programme to determine benefits from fraccing mid perm coals.
Condabri Deviated Well Pilot Pad drilling trial. Online during Q4/CY2014.
Bowen Low Perm Horizontal pilots to be drilled in CY2015.
Deep Conventional Test during CY2015. Step-out appraisal drilling complete. CSG Pilots on flanks to be accelerated into CY2016.
Walloons Low Perm. Next Phase of fracc pilots (including high angle wells) online early CY2015.
13 |
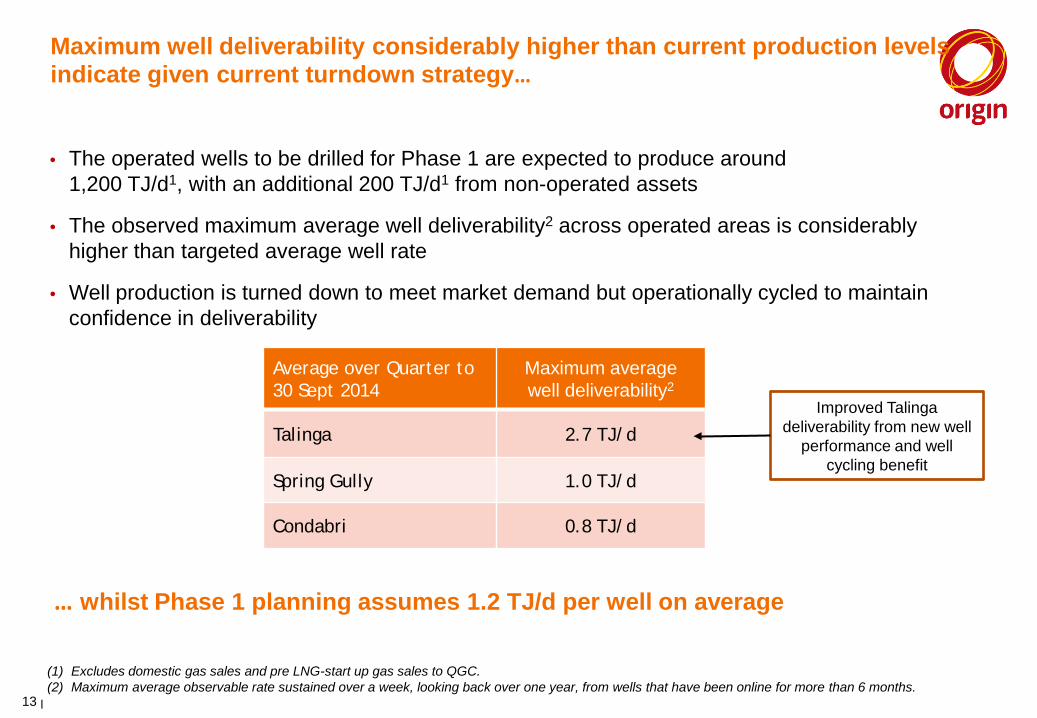
Maximum well deliverability considerably higher than current production levels indicate given current turndown strategy…
(1) Excludes domestic gas sales and pre LNG-start up gas sales to QGC. (2) Maximum average observable rate sustained over a week, looking back over one year, from wells that have been online for more than 6 months.
• The operated wells to be drilled for Phase 1 are expected to produce around 1,200 TJ/d1, with an additional 200 TJ/d1 from non-operated assets
• The observed maximum average well deliverability2 across operated areas is considerably higher than targeted average well rate
• Well production is turned down to meet market demand but operationally cycled to maintain confidence in deliverability
Average over Quarter to 30 Sept 2014
Maximum average well deliverability2
Talinga 2.7 TJ/d
Spring Gully 1.0 TJ/d
Condabri 0.8 TJ/d
… whilst Phase 1 planning assumes 1.2 TJ/d per well on average
Improved Talinga deliverability from new well
performance and well cycling benefit

Typical Phase 1 Well Forecast
• Typical phase 1 well forecast to
have: – peak gas rate 1-2 TJ/d – peak water rate 500-1000
bbl/d – approx 50-70% of well’s
reserves produced within first 5 years
– average well life is 30 years
Pro
duct
ion
Rat
e
Gas
Dewatering Stage
Water
Stable Production Stage Decline Stage
Time
14 |
Source data • Dewatering Stage
• Gas and Water: Spring Gully (Phase 1) and Condabri • Water data only: Combabula/Reedy Creek and Orana
• Stable Production Stage: • Gas and Water: Spring Gully (pre-LNG) and Talinga

0
2500
5000
7500
10000
12500
15000
17500
20000
0
5000
10000
15000
20000
25000
30000
35000
40000
06/1
307
/13
08/1
309
/13
10/1
311
/13
12/1
301
/14
02/1
403
/14
04/1
405
/14
06/1
407
/14
08/1
409
/14
10/1
4
Wat
er Pr
oduc
tion (
bbl/
d)
Gas P
rodu
ctio
n (G
J/d)
Spring Gully Phase 1 Production
Gas Production Water Production
0
500
1000
1500
2000
2500
3000
Mar
-09
Jul-0
9No
v-09
Mar
-10
Jul-1
0No
v-10
Mar
-11
Jul-1
1No
v-11
Mar
-12
Jul-1
2No
v-12
Mar
-13
Jul-1
3No
v-13
Mar
-14
Jul-1
4
Gas P
rodu
ctio
n Ra
te (G
J/d)
Gas Production for Existing Well
Gas Production GJ/d
Spring Gully Production Performance Gas performance of new Phase 1 wells continues to ramp up …
… and successful trials have demonstrated production uplift from horizontal wells enabling higher productivity in future developments Vertical well production
Total production with horizontal well
Production of vertical well transitioned to use as a horizontal well
Phase 1 Spring Gully Gas and Water Production
Uplift due to optimisation with fixing micro turbines
Uplift due to optimisation with fixing micro turbines
Vertical well production
Total production with horizontal well
15 |

Condabri Production Performance
Gas performance of new Phase 1 wells tracking well …
• Normalised Months Online refers to average well performance for the online duration of each well
• Average production rates are determined by all online commissioned Phase 1 wells • Smoothed data trend displayed for ‘Gas Average Including Turndown’ • Total well count: 281 wells
• Chart shows average performance per well for the online duration of each well
• Actual production has been turned down to minimise gas flaring
• Production per well continues to ramp up towards target rate of around 1.2 TJ/d
16 |
0
200
400
600
800
1000
1200
0 2 4 6 8 10
Aver
age
Gas
Rat
e (G
J/d)
Normalised Months Online
Condabri - Average Well Performance
Actual Gas Average
Field turndown capability
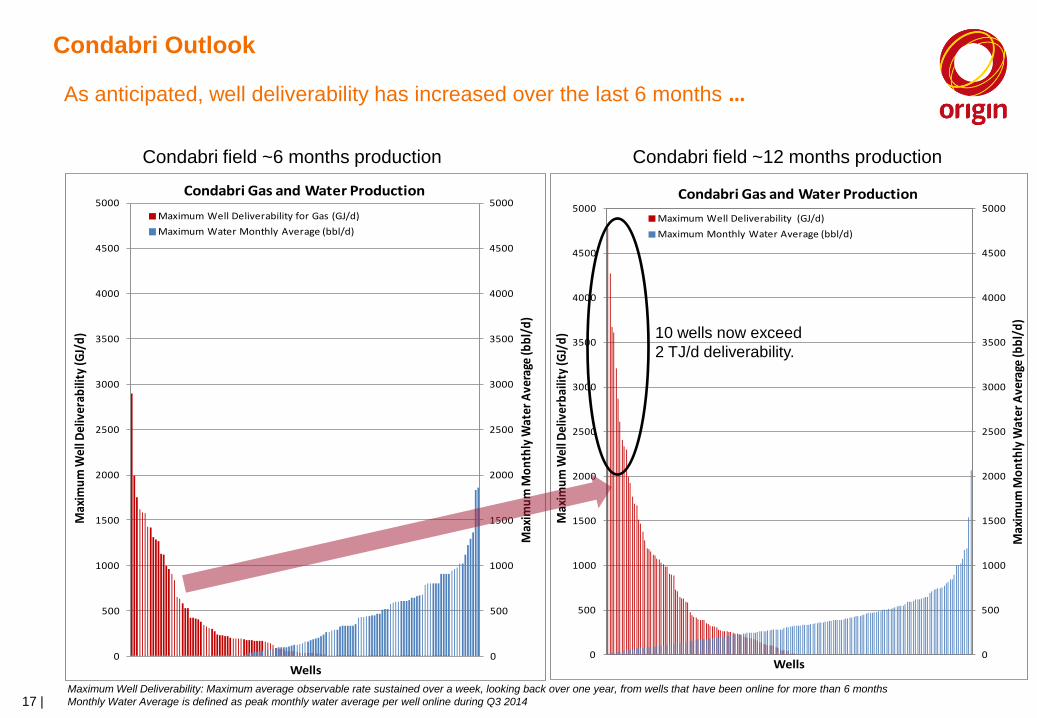
Condabri Outlook
Condabri field ~12 months production Condabri field ~6 months production
As anticipated, well deliverability has increased over the last 6 months …
Maximum Well Deliverability: Maximum average observable rate sustained over a week, looking back over one year, from wells that have been online for more than 6 months Monthly Water Average is defined as peak monthly water average per well online during Q3 2014 17 |
0
500
1000
1500
2000
2500
3000
3500
4000
4500
5000
0
500
1000
1500
2000
2500
3000
3500
4000
4500
5000
Max
imum
Mon
thly
Wat
er A
vera
ge (b
bl/d
)
Max
imum
Wel
l Del
iver
abili
ty (G
J/d)
Wells
Condabri Gas and Water Production Maximum Well Deliverability for Gas (GJ/d)Maximum Water Monthly Average (bbl/d)
0
500
1000
1500
2000
2500
3000
3500
4000
4500
5000
0
500
1000
1500
2000
2500
3000
3500
4000
4500
5000
Max
imum
Mon
thly
Wat
er A
vera
ge (b
bl/d
)
Max
imum
Wel
l Del
iver
baili
ty (G
J/d)
Wells
Condabri Gas and Water ProductionMaximum Well Deliverability (GJ/d)Maximum Monthly Water Average (bbl/d)
10 wells now exceed 2 TJ/d deliverability.
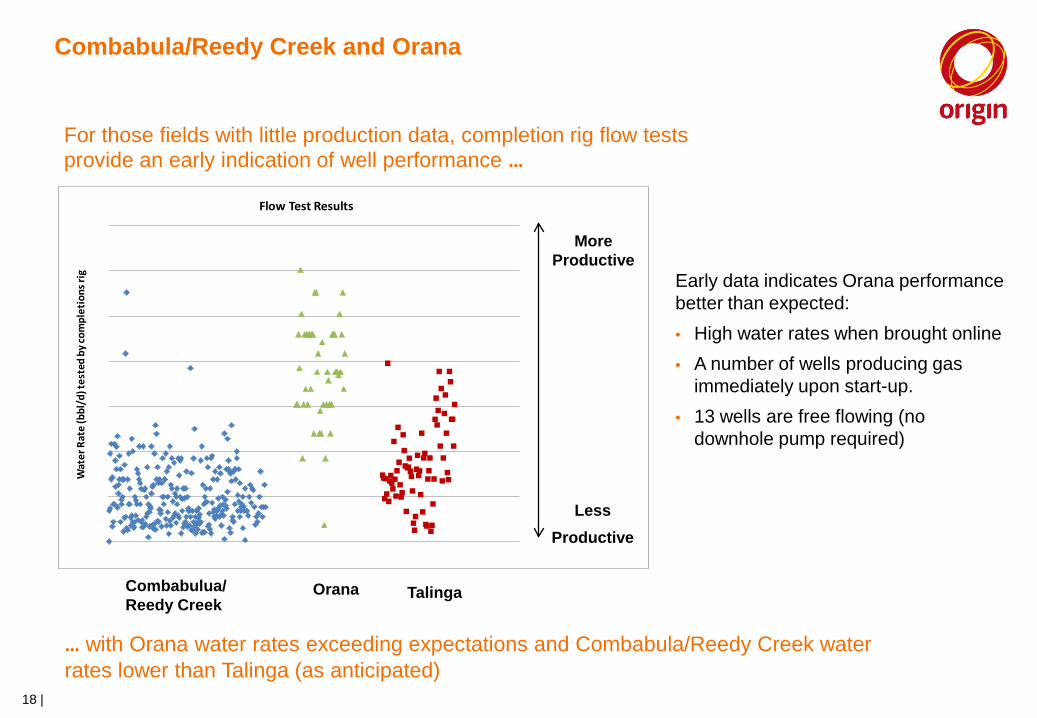
Combabula/Reedy Creek and Orana
For those fields with little production data, completion rig flow tests provide an early indication of well performance …
18 |
Combabulua/ Reedy Creek
Orana Talinga
Wat
er R
ate
(bbl
/d) t
este
d by
com
plet
ions
rig
Flow Test Results
More Productive
Less Productive
… with Orana water rates exceeding expectations and Combabula/Reedy Creek water rates lower than Talinga (as anticipated)
Early data indicates Orana performance better than expected: • High water rates when brought online • A number of wells producing gas
immediately upon start-up. • 13 wells are free flowing (no
downhole pump required)

Non-operated joint ventures progress (QGC-operated)
Bellevue (ATP 610) • 63 wells put on production* • Bellevue CPP (220 TJ/d) – 100% complete
(ready for start-up and has achieved forward flow)
Kenya (ATP 620) • 260 wells put on production* • Kenya CPP (180 TJ/d) - online
Kenya East (ATP 648) • 609 wells put on production* • Ruby Jo CPP (440 TJ/d) – operational Q2
CY2014 • Jordan CPP (440 TJ/d, QGC 100% owned)
– 75% complete (under construction) * As at 30 September 2014
19 |

Non-operated joint ventures progress (GLNG-operated)
Hub Compressor 5 (150 TJ/d) – under
commissioning
Hub Compressor 4 (250 TJ/d) – under
commissioning
Fairview (ATP 526) • 200 wells online • Hub Compressors 4 (250 TJ/d) & 5 (160 TJ/d)
under commissioning
Arcadia (ATP 653) • E&A work only
ATP 631, 745 & 804 • E&A work only
Non-operated costs and planning • Actual capital expenditure to date in non-
operated areas higher than anticipated based on progress to date and APLNG remains exposed to any increased costs arising in non-operated areas
• Planning underway for transitioning from initial development phase to investment in sustaining production and ongoing operations
20 |

UPSTREAM PROJECT DELIVERY

Upstream Project Goals
• Health and Safety •Zero Harm – Gathering system review underway 1
• Environment and Land •Honour our Commitments – Phase 1 essentially complete 2
• Safe & Operable Production System • Automation from the central control room is operational 3
22 |
• Project within schedule and budget •LNG train 1 support constructed, train 2 well advanced 4
• Team effectiveness •Operations team in place supporting commissioning 5
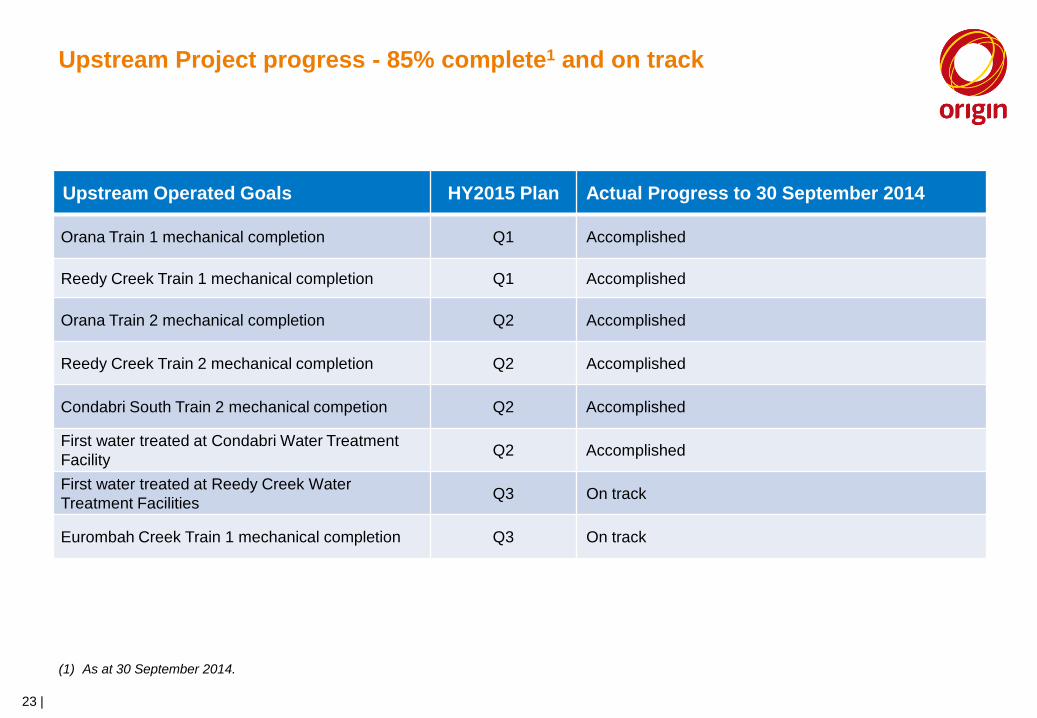
Upstream Project progress - 85% complete1 and on track
23 |
Upstream Operated Goals HY2015 Plan Actual Progress to 30 September 2014
Orana Train 1 mechanical completion Q1 Accomplished
Reedy Creek Train 1 mechanical completion Q1 Accomplished
Orana Train 2 mechanical completion Q2 Accomplished
Reedy Creek Train 2 mechanical completion Q2 Accomplished
Condabri South Train 2 mechanical competion Q2 Accomplished
First water treated at Condabri Water Treatment Facility Q2 Accomplished
First water treated at Reedy Creek Water Treatment Facilities Q3 On track
Eurombah Creek Train 1 mechanical completion Q3 On track
(1) As at 30 September 2014.

Upstream development land, environmental and stakeholder management is progressing
24 |
Gas and water gathering
Drilling and completion
Landholder agreements
• Activity is focussed on Sustain Phase work • Minor residual work on Phase 1 remains • 910 Phase 1 wells and 75 Sustain Phase
wells drilled at 30 September 2014
Phase 1 Operated Drilling (no of wells)
1086
6
988
109
910
75
0
200
400
600
800
1,000
1,200
Approvals Gathering (well equivalent)
Drilling
Fully approved
Compensation Arrangements Agreed
Gathering Lines Installed
Gathering Design Completed
Phase 1 wells drilled (spudded)
Sustain wells drilled (spudded)

25 |
Upstream development implementation – Phase 1 operated well progress - September 2014
Western Fields Spring Gully Combabula / Reedy Creek
Eastern Fields Condabri Talinga / Orana

26 |
Drilling Completions
Upstream development implementation - Drilling and Completion
• Rigs shifting to E&A and Sustain Phase activity as Phase 1 ramps down
• 910 Phase 1 operated wells drilled (spudded)* • 856 Phase 1 wells completed*
• 75 Sustain operated wells drilled* • 17 Sustain wells completed*
• 11 drilling rigs • 7 completion rigs • 3 flush-by rigs
* As at 30 September 2014

27 |
Well head technology
3D Model of APLNG Phase 1 Wellhead Separator
Key features that enable a wellhead separator to operate under a wide range of operating conditions include the following: 1. Automated Control System – includes
instrumentation, communication/Telemetry to a central control room to enable operator assisted start-up/shut-down, monitoring and ongoing optimisation.
2. Separator Design (internals)
Cost optimisation based on experience with the fleet of separators now operating is underway for Sustain Phase
Cyclone Inlet Device with Perforated Baffle Plate
This device provides the primary Gas/Water Separation with the remaining volume in the separator predominantly utilised for well water surge buffering capacity

Upstream development implementation - Gathering
• 959 drilling lease preps • 583 diameter-kilometres of flow lines installed
(988 equivalent wells) • Installation of cable, gas and water High Density
Polyethylene (HDPE) pipe to wells through trenching operations is ongoing
• Cost optimisation for Sustain Phase through co-mingling of gas produced, water, power and communications services in a single trench
28 |
WHS SHIPMENT 23, 12 Vessels Mounted on Skids, Pipe Fit Ups Commenced
First Weld at Seven Trees Reedy Creek Orana completed Wellhead Separator Installation

Upstream development implementation – Gas and Water Facilities
• All remaining modules in laydown or on site ready for construction • Construction of all facilities to support gas production for the start of up LNG Train 1 is complete • Condabri Central Gas Processing Facility and Water Treatment Facility operational • First production wells in Reedy Creek commissioned with gas flowing into the gathering network
and flared, and produced water flowing into ponds • First production wells in Orana commissioned with gas flared and produced water flowing to
eastern treatment facilities
29 |
Reedy Creek – water processing facility, October 2014 Orana – gas processing facility, October 2014

Upstream development implementation - Pipeline
• Pipeline design features: 360 km 42-inch main trunk line and 160 km lateral pipelines to gas fields
• The main pipeline construction is complete and commissioned on the mainland
• First gas (for commissioning) to Curtis Island expected in Q3 FY2015 • The Condabri lateral is carrying gas to the domestic market • The Talinga Pipeline Compression Facility is operational putting non-
operated QGC gas to the domestic market
30 |
Last Golden Weld on the Main Transmission Pipeline
Wandoan Interconnect, July 2014

` Roma
275kV/132 kV Network “Wandoan South to Eurombah Transmission Project” transmission line construction activity underway
Power Stations: Reedy Creek 1 (30MW) – operational Reedy Creek 2 (30MW) – construction underway Powerlink 132kV: Construction underway
Upstream development implementation - Electrification
31 |
• Power operational in the East • Western region progressing supported by temporary power stations
Power Station: Combabula (6MW) – operational Powerlink 132kV: Construction underway
Power Stations: EC 1 (27 MW) – construction underway Powerlink 132kV/275kV: Construction underway
Western Region Electrification

• Eastern water management systems are in place and operating: - Produced water connections between Condabri,
Talinga, Orana and QGC Kenya facility are operational
- Treated water connection between Talinga and Condabri completed with Monreagh storage and Fairymeadow Road irrigation operational
- Condabri Central treatment facility is operational • Western water management systems are well
advanced: - First produced water stored in completed brine
ponds - Aquifer injection system wells and pipe
distribution system is complete with injection treatment nearing completion
- Construction of the Reedy Creek treatment facility, which duplicates Condabri Central, is complete and commissioning is underway
Upstream development implementation - Water
32 |
Condabri Central – Feed Pump Station
Local landholder Simon Drury uses treated CSG water for crop irrigation

COMMISSIONING & OPERATIONAL READINESS

Well Commissioning Overview
1. Well Commissioning Team now delivering 70+ wells per month across the development
2. First well commissioned at Reedy Creek in late May
2014, at Orana in early July 2014 and at Combabula in October 2014
3. Phase 1 Well Delivery status (30 Sept 2014)
• East: 319 wells commissioned • West: 127 wells commissioned • Total: 446 wells commissioned Orana completed Wellhead Separator Installation
34 |

Gas and Water Facilities Commissioning Overview
Eastern Region
1. Condabri - Condabri Central Train 1 commissioned during June 2014 - Condabri Central Train 2 commissioned in mid October 2014 - Condabri South Train 1 pre-commissioning activities underway. Commissioning expected in
March 2015 - Condabri Central water treatment facility commissioned September 2014
2. Orana - Train 1 progressing well, with gas commissioning targeted for December 2014 Quarter. 93%
completion of Inspection and Test Records (ITRs), 96% of loop tests, 63% of systems fully pre-commissioned
Western Region
1. Reedy Creek - Train 1 commissioning targeted for December 2014 Quarter. 93% completion of ITRs, 99% of
loop tests, 68% of systems fully pre-commissioned 2. Eurombah Creek
- Skeleton commissioning team mobilised to site in September 2014. Assessment of schedule, manpower and vendor requirements ongoing
35 |

Pipelines Commissioning Overview
1. Pipelines a) Ruby spur line and Condabri/Talinga pipeline commissioning complete b) Gas received into Main Pipeline South in October 2014 c) Condabri Lateral North commissioning complete and line packed d) Woleebee Lateral pre-commissioning in progress and commissioning team established e) Pipeline commissioning resources expanded to support parallel commissioning on three pipeline
workfronts including Mainline (South and North), Wooleebee Lateral and Orana spur lines
2. Pipeline Compression / Interconnect Facilities (PCIF) a) Talinga PCIF commissioning complete with first formal gas nomination delivered in October 2014 b) Wandoan Interconect pre-commissioning ongoing
3. Electrification – High Voltage (HV) Commissioning
• Achieved a record month in September 2014 energising 22 gathering network kiosks, one Gas Processing Facility Train substation and one Water Treatment Facility HV substation
• HV commissioning scope within well gathering networks – now over 80% complete
36 |

Operations Readiness Key Focus Areas
Activities to ensure we meet the targets set out in Final Investment Decision for SAFETY, AVAILABILITY and PRODUCTION.
Current Focus Areas • Safe Start Up of Orana T1 and Reedy Creek T1 • Managing defects impacting production and safety from the Phase 1 project • Handover to operations for Condabri Central T1 – critical documentation and commissioning close out • Lessons learnt from Condabri Central • System performance and capacity testing program • Water Treatment Facility transition plan to operations
37 |

SUSTAIN PHASE

Drilling continues in the Walloons and Spring Gully areas through to 2020 …
39 |
Development focused on Walloons and Spring Gully in period to 2020: • Moving out from, and infill drilling in, initial
development areas • ~75% of wells in the Walloons • Focus on reducing drill & connect costs and
testing new well designs • Expect to drill operated wells equivalent to
around 300 single vertical wells per year on average
• Expect to participate in around 300 non-operated wells per year on average
• Expect to invest in further non-operated gas processing facilities prior to 2020
• APLNG has equity share in non-operated permits of between 20%-40%
… and extends to broader geographical areas, incorporating new technology plays, in the longer term

2014 2017
Drilling & Completions Gathering
APLNG is targeting a 30% decrease in drill and connect costs through improved execution & design improvements…
• Seeking a significant decrease in drill and connect costs through: - Changed market dynamics on resources
(people, contractors) and a refreshed contracting strategy
- Evolving standardised design fit for purpose allows choice of lowest cost/highest value option - Reducing size of well pads & increasing
proportion of Minimum Disturbance well pads
- Planning improvements allow for reduced well delivery time
• Common training with other proponents
Average drill and connect cost / well ($m/single vertical well)
… as well as through collaboration across the industry on best practices
40 |
From 2017 onwards 2014

APLNG is targeting decreases in cost/GJ and increased productivity through application of new well concepts…
Horizontal wells in Spring Gully deliver increased production/well. Increased drill costs offset by reduced connections Multi-well pad & deviated drilling trials underway to target increased production & reduced connection costs Mid & low permeability frac trials underway targeting increased production rate Studies underway to add value through well spacing optimisation Investigating a range of surface facility solutions from separators on every well to nodal separators to no separators
1
2
3
4
… with acceleration of various studies and trials
5
1
2 3
2
4
41 |

Existing CSG fields
LNG development
fields
Sustain Phase Operations
$/G
J
In addition to operational readiness, the focus is on increasing well availability to drive down costs and increase production efficiency
42 |
As more wells come online, we aim to realise scale benefits, driving down operating costs, with specific areas of focus to optimise activities:
• Labour and associated costs
• Reliability and maintenance
• Well workovers
• Well head technology
• Productivity improvements
Upstream operating costs include:
• Well and facilities maintenance and reliability
• Camp operations
• Power Usage
Dec
reas
ing
oper
atin
g co
sts
Targeting well availability to improve by 10-15% over the next 3-4 years

DOWNSTREAM PROJECT DELIVERY

Curtis Island has been designated as an LNG precinct by the State and Federal governments
44 |

• Two trains of 4.5 mtpa capacity and each train has: - 6 General Electric (GE) Model LM 2500+ G4 drivers - Turbine inlet air chilling - Redesigned nitrogen rejection units - Waste heat recovery
• EIS approval for four trains • Two LNG storage tanks
- Capacity of 160,000 m3 each • LNG loading berth and jetty
– Suitable for ships with capacity up to 220,000 m3
• Utilities - power generation, water and sewerage (from the mainland), air and nitrogen, ground flares
• Control room capable of operating four trains (with expansion)
• Temporary facilities set-up for construction include 2,750 man camp, offices, laydown area
APLNG Downstream Facilities
45 |
Liquefaction of natural gas is an established technology. The project utilises the Optimised Cascade Technology similar to the Darwin LNG project which has operated since 2006

Optimised Cascade Process
46 |

Downstream Project progress – 82% complete1 and on track
47 |
Downstream Operated Goals HY2015 Plan Actual Progress to 30 September 2014
Complete loading platform for LNG jetty Q4 FY14 Accomplished: September 2014 (no consequential impact to critical path)
Inlet Air Chiller Package received on Curtis Island Q1 Accomplished
LNG Tank B hydrostatic test complete Q1 Accomplished Complete Factory Acceptance Testing on Train 2 Integrated Control Safety System Q2 Accomplished
Last Train 2 module set Q2 On Track
Energise Gas Turbine Generators Q3 On Track
Tank A ready for LNG Q3 On Track
LNG Tanks, August 2014 Curtis Island site, August 2014 Overview of Train 1 Inside Battery Limits (ISBL)
(1) As at 30 September 2014.

Project Highlights
• Downstream project completion at 82% at 30 September 2014 – Engineering and Procurement are both >99% complete – All materials needed for Train 1 start-up are now available with no impediments to
construction – Construction manning is at peak and will remain at peak until Q1 CY2015 – Inlet facilities are now connected to the Main Pipeline and ready to receive gas when
needed – The first completed systems have been turned over from Construction to the
Commissioning & Start-up group, led by ConocoPhillips Renegotiation of the Project Labour Agreement (PLA) is now complete with labour
secured until the end of the project Project remains on track to produce first LNG by mid 2015
48 |

Downstream project current status - Construction
49 |
MARINE FACILITIES
• All concrete pours are complete. Electrical works are complete on the loading platform and dolphins
• Loading platform for the jetty completed in June FY2014 Quarter
MODULE FABRICATION, INDONESIA
• Three Train 2 modules were shipped in the first half of October
• The 2 remaining modules are due to be shipped in late October 2014, followed by mod yard closure
DREDGING
• Complete
TEMPORARY WORKERS’ ACCOMMODATION FACILITY (TWAF)
• 2,750 beds being utilised at TWAF, with additional onshore facilities being utilised
LNG TRAINS
• Train 1 construction 77% complete (at 30 September 2014). All modules and major equipment have been set. Critical path currently runs through the installation of the compression system piping
• Train 2 construction progressing. Critical path runs through delivery & setting of final Cryo module together with piping, instrument and electrical installation activities
LNG TANKS
• Tanks A & B: Hydro testing of both tanks is complete. Perlite insulation being installed in Tank A
• Both tanks are expected to be complete by 3Q FY15 and are not on the critical path to first cargo
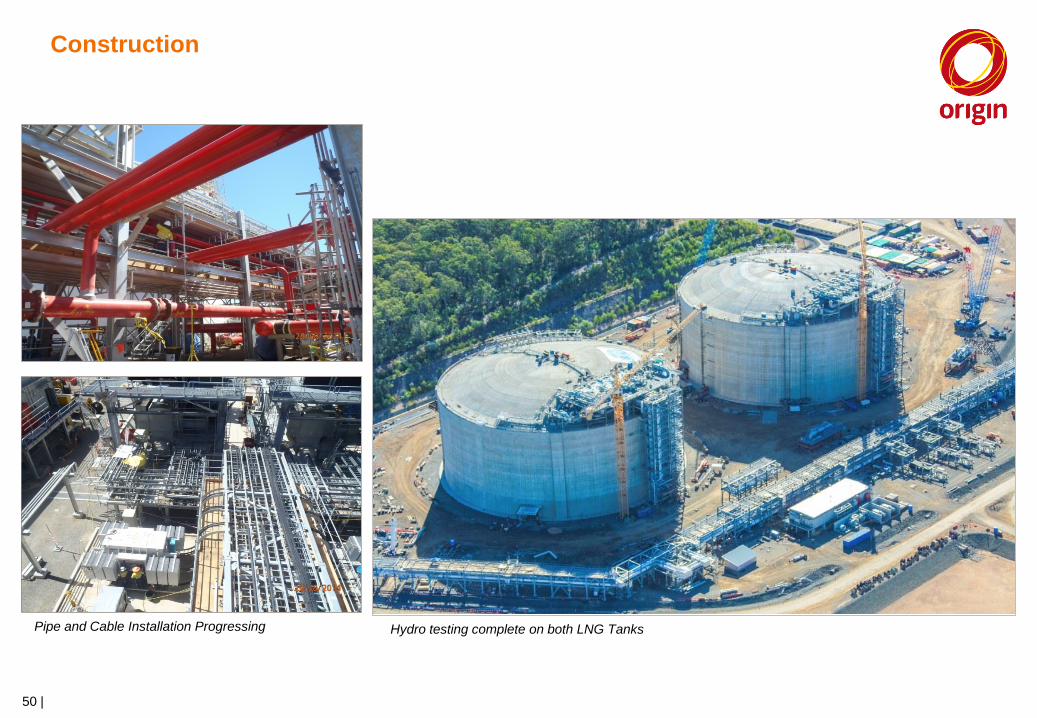
Construction
Pipe and Cable Installation Progressing
50 |
Hydro testing complete on both LNG Tanks

Full operations
51 |
• Key data
4.5 mtpa per LNG train
~730TJ/day gas rate per train
~30,000m3/day of LNG per train
~6 days to fill a Tank when one train running, ~3 days to fill a tank when two trains running
Ship every 6 days with one train & every 3 days with two trains
<12-14hrs to fill a ship (165,000m3 ship) (total time ~36hrs)
Minor maintenance (one train at half rate for 2-5 days) every 6 months
Major Maintenance (one train at no rate for 30 days) every 3-5 years
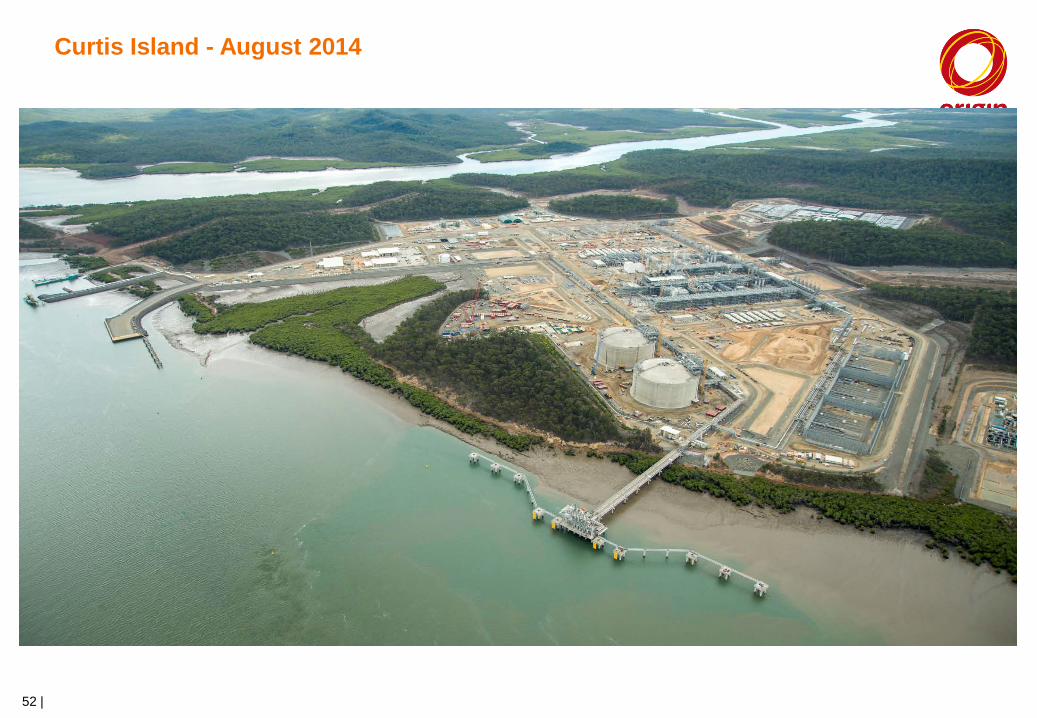
Curtis Island - August 2014
52 |

Trains 1 & 2 Inside Battery Limits (ISBL) – August 2014
53 |

Train 1 – August 2014
54 |
Pipe connections between Compressor Building and Module 101D (Cryo Coolers)
Train 1

Train 2 Area – August 2014
55 |

Train 2 – August 2014
Setting Module 202NB (Propane Condenser)
Large-Bore Spools Ready for Pneumatic Testing
56 |
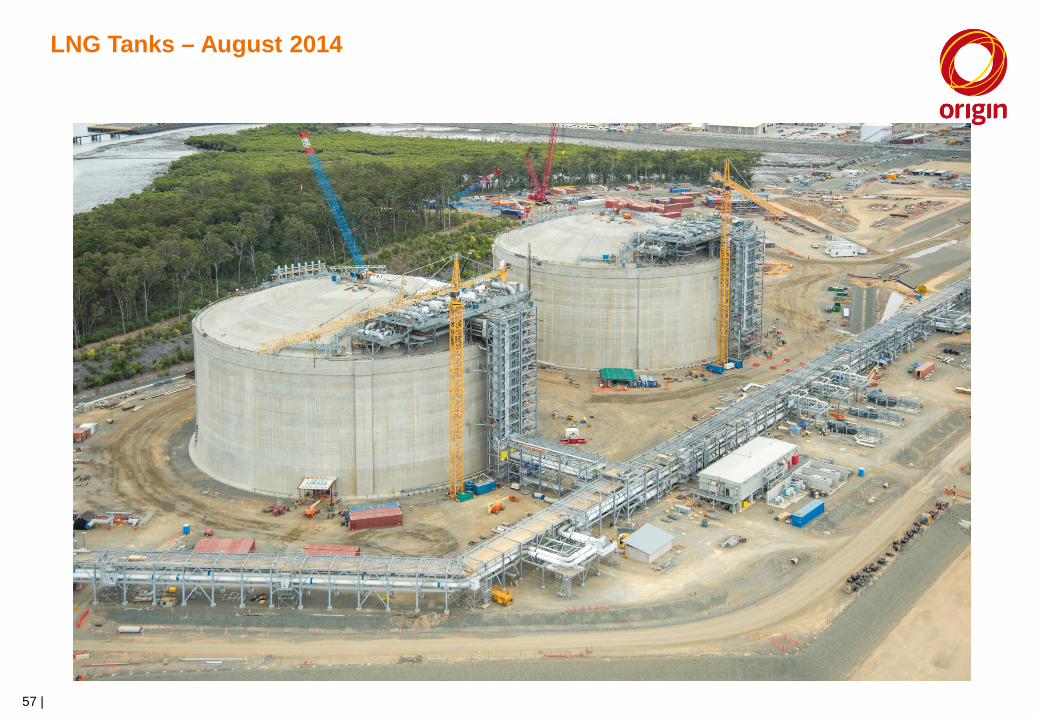
LNG Tanks – August 2014
57 |

Permanent Buildings – August 2014
Train 1 Compressor Control Building, Cable Pulling under Floor
58 |

LNG Jetty – August 2014
59 |
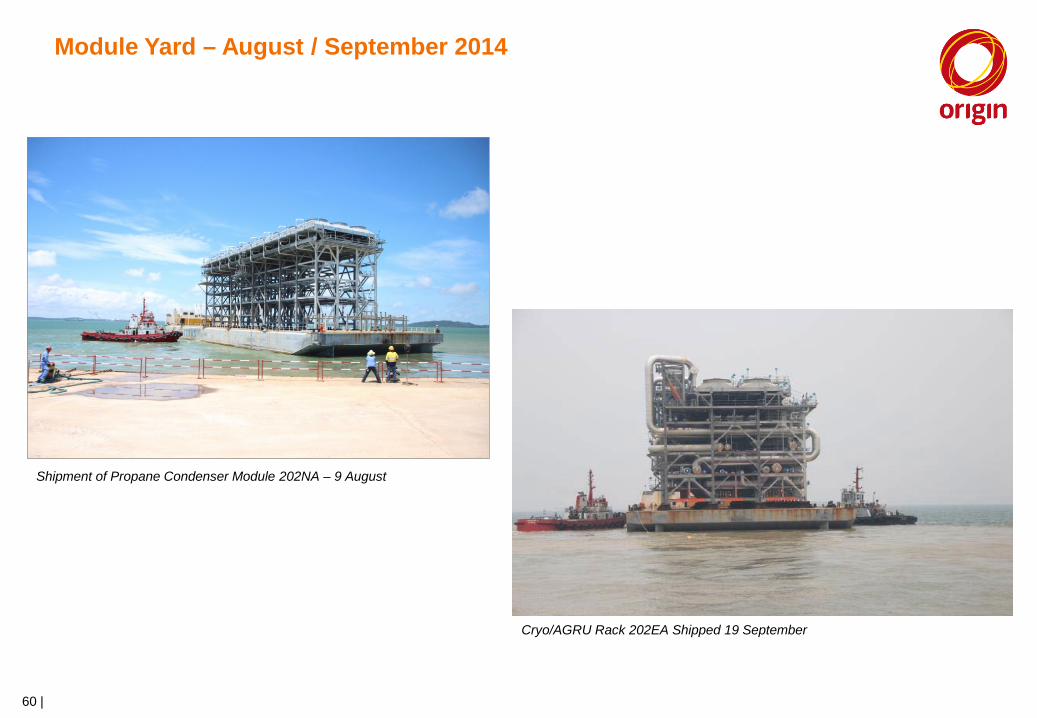
Module Yard – August / September 2014
Cryo/AGRU Rack 202EA Shipped 19 September
Shipment of Propane Condenser Module 202NA – 9 August
60 |

Module Yard – October 2014
Cryo/AGRU Rack (202DB) & Methane/NRU Cold Box Rack (202GA) Sailed away 6 October 2014
Shipment of Inlet Air Chiller Loose Spools 3 October 2014
61 |

APPENDIX 1 - METRICS
62 |

The first full year of earnings and cash flows from both APLNG trains is expected to be FY2017…
(1) Distributable amount is cash flow after revenues, operational expenditure, ongoing capital expenditure, project finance interest and repayments, and taxation. Based on the forward oil price curve as at May 2014.
… with distributable cash flow1 of around US$1 billion (Origin 37.5% share) on average per year
• With the phased start up of Train 1 and Train 2, APLNG’s FY2016 financial results will be subject to the following factors:
• The rate at which LNG production ramps up from ready for start up to full production from both
trains
• Gas sales as APLNG and other LNG projects ramp up gas production in readiness for LNG production
• Accounting considerations through ramp up period • APLNG is not expected to pay tax in the early years of LNG production given deductibility of previous
expenditure
63 |

APLNG Reference Information
64 |
Sales
Reference Metric Source LNG Train Capacity 9.0 mtpa FID2 Presentation 4 July 2012
Contract LNG Export Volumes 8.6 mtpa FID2 Presentation 4 July 2012
LNG Export Contracts Terms 20 year contracted off-take agreements with Sinopec and Kansai Electric, based on JCC - linked pricing: - Sinopec 4.3 mtpa; signed April 2011 - Sinopec 3.3 mtpa; signed January 2012 - Kansai 1.0 mtpa; signed June 2012
ASX releases: 21 April 2011 20 January 2012 29 June 2012
Domestic volumes Historical domestic sales volumes of 115 PJe (FY2012), 119 PJe (FY2013) and 133 PJe (FY2014)
Origin Energy Operating and Financial Reviews issued 23 August 2012, 22 August 2013 and 21 August 2014
QGC Gas Sale agreement QGC contracted sales for a 20 year term following commencement of commercial operations at QCLNG
ASX release 25 February 2010
Reference information in respect of the APLNG project and operations

APLNG Reference Information
65 |
Reference Metric Source Operating expenditure Key components comprise
• Downstream liquefaction costs • Upstream operating expenditure includes:
• Upstream well & facilities maintenance and reliability
• Upstream field power costs
May 2014 site tour presentation
Royalties • Methodology is subject to ongoing discussions with the Queensland State Government
Operating Expenditure
Project Finance
Reference Metric Source Quantum US$8.5 billion facility ASX Release 24 May 2012
Banks US EXIM, China EXIM, Commercial Banks ASX Release 24 May 2012
Terms 16 – 17 years from inception
2028 – Commercial banks
2029 – US EXIM
2028 – China EXIM
ASX Release 24 May 2012

APLNG Reference Information
66 |
Reference Metric Source Upstream sustaining capital expenditure
• Expect around 300 operated wells drilled per year in near term
• Drill, complete, connect cost approximately $3m per operated well, with cost reductions targeted through ongoing operations
• Expect to participate in around 300 non-operated wells per year
• Expected to invest in further gas processing facilities post LNG production, operated and non-operated
• Non-operated permit equity share between 20%-40%
May 2014 site tour presentation
Upstream Sustaining Capital Expenditure
Reference Metric Source Upstream Permit information Details of Operated and Non-Operated permit
information including percentage interests Quarterly Production report released 30 October 2014
Upstream Permit Information

THANK YOU