Lerner - The Big Bang Never Happened - A Startling Refutation of the Dominant Theory of the Origin o
and Evolution. All rights reserved. For permissions, please e-mail: [email protected] The Author 2006. Published by Oxford University Press on behalf of the Society for Molecular Biology
1
Research Article:
Origin and expansion of haplogroup H, the dominant human mitochondrial
DNA lineage in West Eurasia: the Near Eastern and Caucasian perspective
U. Roostalu1,*, I. Kutuev1,2, E.-L. Loogväli1, E. Metspalu1, K. Tambets1, M. Reidla1, E.K.
Khusnutdinova2, E. Usanga3, T. Kivisild1, R. Villems1
1. Department of Evolutionary Biology, Institute of Molecular and Cell Biology, University
of Tartu and Estonian Biocentre, Tartu, Estonia
2. Institute of Biochemistry and Genetics, Ufa Research Center, Russian Academy of
Sciences, Ufa., Russia
3. Department of Hematology, University of Calabar, Calabar, Nigeria
* Present address: Institute for Toxicology and Genetics, Research Centre Karlsruhe,
Germany
Correspondence:
Eva-Liis Loogväli, Department of Evolutionary Biology, Institute of Molecular and Cell
Biology, University of Tartu, Tartu 51010, Estonia. E-mail: [email protected]; Phone:
+3727375053; Fax: +3727420194.
Urmas Roostalu, Institute for Toxicology and Genetics, Research Centre Karlsruhe Germany.
E-mail: [email protected]
Running Title: Peopling of Western Eurasia
Key words: human mitochondrial DNA, haplogroup, population genetics, human evolution,
Near East, Caucasus
MBE Advance Access published November 10, 2006
2
Abbreviations: AMH, anatomically modern humans; CRS, Cambridge reference sequence;
(sub-)hg(s), (sub-)haplogroup(s); HVS-1, first hypervariable segment; LGM, Last Glacial
Maximum; mtDNA, mitochondrial DNA; np(s), nucleotide position(s); RFLP, restriction
fragment length polymorphism; YBP- years before present
3
Abstract
More than a third of the European pool of human mitochondrial DNA (mtDNA) is
fragmented into a number of subclades of haplogroup (hg) H, the most frequent hg throughout
western Eurasia. While there has been considerable recent progress in studying mitochondrial
genome variation in Europe at the complete sequence resolution, little data of comparable
resolution is so far available for regions like the Caucasus and the Near and Middle East –
areas where most of European genetic lineages, including hg H, have likely emerged. This
gap in our knowledge causes a serious hindrance for progress in understanding the
demographic pre-history of Europe and western Eurasia in general. Here we describe the
phylogeography of hg H in the populations of the Near East and the Caucasus. We have
analyzed 545 samples of hg H at high resolution, including 15 novel complete mtDNA
sequences. As in Europe, most of the present-day Near Eastern – Caucasus area variants of hg
H started to expand after the Last Glacial Maximum (LGM) and presumably before the
Holocene. Yet importantly, several hg H sub-clades in Near East and Southern Caucasus
region coalesce to the pre-LGM period. Furthermore, irrespective of their common origin,
significant differences between the distribution of hg H sub-hgs in Europe and in the Near
East and South Caucasus imply limited post-LGM maternal gene flow between these regions.
In a contrast, the North Caucasus mitochondrial gene pool has received an influx of hg H
variants, arriving from the Pontocaspian/East European area.
4
Introduction
The Levantine part of the Near East was the area which was colonized foremost, though
likely only episodically, about 100,000 YBP (years before present) (Shea 2003). Based on
genetic data it has been suggested that the earliest phase of the long-lasting settlement of
Eurasia by AMH started 60,000-70,000 YBP and proceeded alongside the southern coast of
the super-continent, probably crossing first the Red Sea around Bab-el-Mandeb, continuing to
India and further East (Cavalli-Sforza, Menozzi and Piazza 1994, Lahr and Foley 1994,
Quintana-Murci et al. 1999, Kivisild et al. 2003a, Forster 2004, Kivisild et al. 2004, Metspalu
et al. 2004, Macaulay et al. 2005, Thangaraj et al. 2005, Sun et al. 2006). According to the
newest interpretation of the C14 calibration data, Europe was populated around 41,000-
46,000 YBP, likely after some hiatus since the “opening” of the southern route (Mellars
2006).
The demographic history of human populations during the Pleistocene has been profoundly
influenced by large-scale climate fluctuations, from which one of the most significant took
place between 19,000-22,000 YBP, during the Last Glacial Maximum (LGM), when the
climate became significantly colder and dryer (Clark et al. 2004, Yokoyama et al. 2000).
During this cold peak extreme deserts occupied most of the Near East and Central Asia, while
much of Europe and northern Asia was covered by steppe-tundra, forcing forest into scattered
refugium areas in the western Caucasus and southern European peninsulas (Adams and Faure
1997, Peyron et al. 1998, Tarasov et al. 1999, Tarasov et al. 2000, Crucifix, Betts and Hewitt
2005). Postglacial expansion-recolonization from refugia is a concept that has recently been
used to explain the genetic diversity of the present-day Europeans ( Torroni et al. 1998,
Semino et al. 2000, Torroni et al. 2001, Achilli et al. 2004, Rootsi et al. 2004, Tambets et al.
2004, Pereira et al. 2005). Much less, however, is known about the LGM period in the Near
East and in the Caucasus. After the postglacial recolonization another expansion happened
5
thousands of years later, when agriculture started to develop in the Near East, resulting,
according to many authors, in an outward migration of agriculturist populations to Europe and
different parts of Asia, with an impact, the range of which is still hotly debated (Ammerman
and Cavalli-Sforza 1984, Sokal, Oden and Wilson 1991, Barbujani et al. 1994, Cavalli-Sforza
et al. 1996, Chikhi et al. 2002, Dupanloup et al. 2004, Haak et al. 2005, Pinhasi, Fort and
Ammerman 2005).
An absolute majority of the western Eurasian mtDNA pool consists of a small number of
phylogenetically well-characterized branches of haplogroup R. The dominant hg in western
Eurasia (H) descends from the HV family of hgs, defined by substitutions at nps 73 and
11719 relative to R* (Finnilä, Lehtonen and Majamaa 2001, Macaulay et al. 1999, Saillard et
al. 2000, Torroni et al. 2006). It has been accepted for some time now that most of the
mtDNA haplogroups presently found in Europe, including hg H (Torroni et al. 1994),
originated in the Near and Middle East (Torroni et al. 1994, Richards et al. 1996, for a review
see Forster 2004) – the question is when did they evolve? Hg H encompasses over 40% of the
total mtDNA variation in most of Europe. Its frequency declines towards the East and South,
but in the Near East, the Caucasus and Central Asia its frequency is still as high as 10-30%
(Metspalu et al. 1999, Richards et al. 2000, Tambets et al. 2000, Al-Zahery et al. 2003, Achilli
et al. 2004, Loogväli et al. 2004, Quintana-Murci et al. 2004, Metspalu et al. 2004, Pereira et
al. 2005).
More than ten subclades within hg H, as defined by coding region mutations, have been
described thus far, and a phylogenetic tree of 267 coding region sequences has been
previously published by us (Loogväli et al. 2004). A number of hg H subclades show
characteristic regional distribution. Thus, H1 and H3 are common in western Europe, having
expanded after the LGM from the Francocantabrian refugium (Achilli et al. 2004, Loogväli et
al. 2004, Pereira et al. 2005), whereas a subset of H2, defined by transition at np 951, is
6
typical to eastern Europe and Asia, while H6 is the most frequent among the identified
subclades of hg H in Central Asia (Loogväli et al. 2004).
Irrespective of their likely ancestral status relative to Europeans, the West Asian and the
Caucasus populations have been profoundly underrepresented in the published mtDNA data
sets. Here we analyze spatial and temporal spread of hg H in the Near East and the Caucasus
and interpret the obtained results in a comprehensive West Eurasian context of this major
maternal lineage, informative in terms of ancient human migrations between West Asia, the
Caucasus and Europe.
7
Materials and Methods
A total of 6199 samples were screened for the absence of 7025 AluI restriction site
(induced by a T to C transition at np 7028), indicative of hg H. Of these 1219 fell to hg H and
545 samples were involved to detailed clustering. Samples were divided into 11 groups, based
on linguistic similarity and geographic location: 1) 54 Armenians, 2) 30 samples from
Georgia (22 Georgians and 8 Mingrelians), 3) 45 Ossetians (25 from North-Ossetia, 20 from
South-Ossetia), 4) 69 from the northwestern Caucasus (29 Adygeis, 12 Abazins, 28
Abkhazians), 5) 50 Karatchaians-Balkarians (19 Karatchaians, 31 Balkarians), 6) 60 from
Daghestan (26 Dargins, 14 Avars, 11 Lezgins, 9 Tabasarans), 7) 52 from the Arabian
Peninsula (20 from Saudi-Arabia, 18 from Kuwait, 9 from Oman, 5 from Yemen), 8) 34
Lebanese, 9) 28 Syrians, 10) 33 Jordanians, 11) 90 Turks. A partial RFLP (restriction
fragment length polymorphism) analysis and HVS-1 (the first hypervariable segment of
mitochondrial genome control region) data of 48 Turks, 10 Jordanians, 9 Syrians, 8 Lebanese
and 6 Saudi-Arabians has previously been published in Loogväli et al. (2004) (see Table S2 in
Supplementary Material online).
All confirmed hg H mtDNAs were subsequently screened for a series of SNPs that define
different subbranches of this mtDNA lineage. The transition at np 239 was screened by
sequencing, similarly to Loogväli et al. (2004), in all the samples, which harbored a transition
at np 16362. 24 polymorphisms throughout the mitochondrial genome were analyzed in all
545 samples. Transitions at nps 477, 951, 1438, 3010, 3796, 4336, 4745, 4769, 4793, 5004,
7645, 8448, 8598, 8994, 9380, 13020, 13101, 13708, 16482 and 14470TA transversion were
detected by RFLP analysis (Fig. 1). To identify the transition at np 3010 we used mismatch
forward primer 5´-np2981-acgacctcgatgttggatcaggacatcgc and similarly a mismatch forward
primer was used in the case of the 14470TA transversion with the sequence 5´-np14448-
caatagccatcgctgtaggat. A reverse mismatch primer, with the sequence 5´-np499-
8
cgggggttgtattgatgagact, was employed to detect a polymorphism at np 477. Mutations at nps
14869 and 14872 were detected by the absence of the 14869 MboI cutting site. To distinguish
between the two transitions all the samples which lacked this site were sequenced. Transitions
at nps 456 and 6776 were detected by allele specific polymerase chain reaction and by
sequencing. Polymorphism at np 10166 was analyzed by sequencing samples lacking DdeI
site at np 5003. Polymorphisms at nps 709 and 4745 were analyzed by RFLP in samples,
which had a C to T mutation at np 14872. The polymorphism at np 11140 was screened in
samples having BseMII site at np 1438.
The HVS-1 sequence of all the 545 samples was scored between nps 16024 and 16383. In
order to elucidate the topology of the so far poorly resolved subclades of hg H, 15 samples
were selected for complete sequencing. Samples inside the desired clades were selected
randomly. We sequenced six samples with the 14872 transition (samples: Abazin 43, Lezgin
19, Mingrelian 9, Jordanian 923, Tabasaran 6, Turk 209), three samples with the 1438
transition (Dargins 18, 29, 75), two samples with the 5004 transition (Lezgin 5, Turk 137),
two samples with a transition at np 7645 (Armenian 2, Turk 345), one sample with the 239
transition (North-Ossetian 71), one sample with the transition at np 8994 (Abkhazian 59).
DYEnamic ET Terminator Cycle Sequencing Kit from Amersham Pharmacia Biotech was
used for sequencing on a MegaBACETM 1000 Sequencer (Amersham Biosciences). Sequence
trace files were analyzed either in Seqlab (GCG Wisconsin Package 10, Genetics Computer
Group) or in case of complete sequencing in Phred, Phrap and Consed programs (Ewing et al.
1998, Nickerson, Tobe and Taylor 1997).
Phylogenetic networks were constructed with Network 4.1.1.1 program
(http://www.fluxus-engineering.com). The reduced median algorithm (r set at 2) (Bandelt et
al. 1995), followed by median joining algorithm (epsilon set at 0) was applied (Bandelt,
Forster and Röhl 1999). Polymorphisms were divided into four classes according to their rate
9
of evolution ( Hasegawa et al. 1993, Malyarchuk and Derenko 2001, Allard et al. 2002). Fast
positions (16093, 16129, 16189, 16311, 16362) were weighted by one, intermediate positions
(16051, 16126, 16145, 16168, 16172, 16184, 16192, 16209, 16218, 16223, 16256, 16261,
16278, 16291, 16293, 16294, 16304, 16320, 16325) by two, slow positions (all other
transitions between 16024 and 16383 as well as 16482) by four. Transversions (except for
16192CA, which might be due to length variation as shown in Bendall and Sykes 1995) and
coding region polymorphisms were assigned the weight of eight. The resulting network was
corrected by taking into account previously known hg H topology (Loogväli et al. 2004).
Due to the large size of the dataset only the part of the network with samples classified into
sub-hgs, is presented. Coalescence ages of sub-hgs were calculated based on the network, by
means of the average transitional distance from the root haplotypes (rho). One transitional
step between nps 16090 and 16365 was taken equal to 20,180 years (Forster et al. 1996) and
between 577 and 16023 equal to 5138 years (Mishmar et al. 2003). For synonymous
substitutions we used the rate of one substitution in 6764 years (Kivisild et al. 2006). Standard
deviations for age estimates were calculated as in Saillard et al. (2000). Coalescence ages for
the clades in Europe were calculated on the data from Loogväli et al. (2004).
We used STATISTICA 6.0. to carry out principal component analysis on hg frequencies.
The analysis used a correlation matrix, formed on the standardized frequencies. At first an
analysis was made using 14 variables (H1*, H1a, H1b, H2a1, H3, H4, H5*, H5a, H6a, H6b,
H7, H8, H11), which we had previously analyzed in various Eurasian populations (Loogväli
et al. 2004), or which, in the case of H20 could be deduced from HVS-1 data. We separated
Altaians from Central Asia as the frequencies of some clades are very different. Secondly, we
used the information of all mtDNA haplogroups, pooling the frequencies of Asian clades (hgs
A-G, M, N9) and African L clades. Other clades we included were preHV (R0a/b in Torroni
et al. 2006), HV, preV-V (HV0 in Torroni et al. 2006), J, T, K, U*, U1, U2, U3, U4, U5, U6,
10
U7, I, X, and W. Data for Arabia was taken from Kivisild et al. (2003b), for Armenians from
Tambets et al. (2000), for Georgians and for Turks from Quintana-Murci et al. (2004) and
Tambets et al. (2000), for Syrians from Richards et al. (2000), for French from Dubut et al.
(2004), for Estonians from Sajantila et al. (1995, 1996) , for the Volga-Ural region Finno-
Ugrians from Bermisheva et al. (2002), for Balkan nations (Albanians, Greeks, Croatians)
from Babalini et al. (2005), Belledi et al. (2000), Richards et al. (2000) and Tolk et al. (2001),
for Central Asia (Uzbeks, Turkmens) from Quintana-Murci et al. (2004), for Eastern Slavs
(Russians) from Malyarchuk et al. (2002), for northwestern Caucasus (Adygeis) from
Macaulay et al. (1999), for Altaians from Derenko et al. (2003), for Ossetians from Richards
et al. (2000), Tambets et al. (2000).
In an analysis of hg H variability for the Near East and the Caucasus the information on
European populations was drawn from the data presented by Herrnstadt et al. (2002), and
complemented by frequencies for French from Loogväli et al. (2004) and Portuguese and
Spanish from Pereira et al. (2005). Note that the samples of Herrnstadt et al. (2002) are from
US or UK, and of unspecified descent. Yet, the sub-hg distribution is characteristic to other
Western European populations. To minimize deviation we used average frequencies over the
aforementioned populations (UK/US, French, Portuguese, Spaniards), in case the
polymorphism was studied in more than one of them. Otherwise we used the only available
frequency. To plot hgs on the same graph as populations their coordinates (ranging from -1 to
1) were multiplied by 10. We calculated mismatch distributions (distributions of pairwise
differences between sequences) on HVS-1 data in Arlequin 3.01 (Excoffier, Laval and
Schneider 2005).
11
Results
Topology of haplogroup H phylogenetic tree
In a total of 6199 samples from 11 Caucasus and Near Eastern populations we found 1219
samples to belong to hg H. From these, 545 hg H samples were chosen randomly over the
region, to be tested for markers defining major sub-hgs of hg H and their internal branches
(Fig. 1, Supplementary Material online, Tables S1, S2). Altogether 61% of the samples could
be clustered among 17 sub-hgs. A nomenclature, which we hereby update (Supplementary
Material online, Fig. S1), follows Finnilä et al. (2001), Herrnstadt et al. (2002), Achilli et al.
(2004), Loogväli et al. (2004), Quintans et al. (2004) and Brandstätter et al. (2006), with
several new improvements.
Inside hg H1 a new clade is characterized: H1d is defined by a transition at np 456 (Fig. 1).
The presence of a transition at np 3796, representing H1b, has been noticed previously
(Achilli et al. 2004, Herrnstadt et al. 2002, Mishmar et al. 2003, Pereira et al. 2005, Simon et
al. 2003). However, we found this mutation also on the hg H5 background, which is
noteworthy due to its non-synonymous nature – the observed A to G substitution results in
threonine to alanine replacement in the ND1 subunit of mitochondrial complex I. Notice that
this mutation at np 3796 has been shown to be positively correlated with adult-onset dystonia
and was suggested to cause abnormalities in the mitochondrial electron-transport chain
(Simon et al. 2003). Furthermore, outside hg H, the A to G transition at np 3796 has been
detected in hg B (Herrnstadt et al. 2002), in hg M21 (Macaulay et al. 2005) and as a
transversion from A to T in hg L1c, the latter substitution resulting in a serine codon (Ingman
et al. 2000, Herrnstadt et al. 2002, Mishmar et al. 2003, Kivisild et al. 2006). Accordingly,
non-synonymous substitutions at np 3796 appear to be common in different, phylogenetically
distant branches of human mtDNA and, therefore, unlikely to be under strong purifying
selection (see also Mitchell et al. 2006).
12
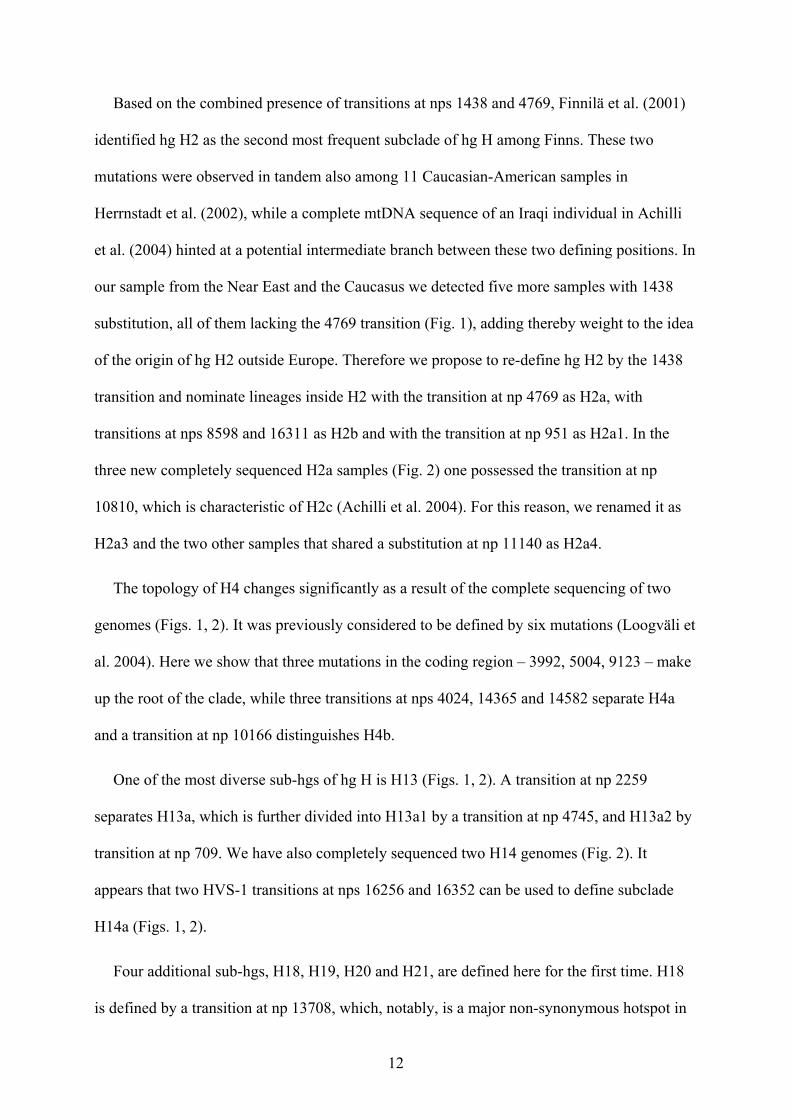
Based on the combined presence of transitions at nps 1438 and 4769, Finnilä et al. (2001)
identified hg H2 as the second most frequent subclade of hg H among Finns. These two
mutations were observed in tandem also among 11 Caucasian-American samples in
Herrnstadt et al. (2002), while a complete mtDNA sequence of an Iraqi individual in Achilli
et al. (2004) hinted at a potential intermediate branch between these two defining positions. In
our sample from the Near East and the Caucasus we detected five more samples with 1438
substitution, all of them lacking the 4769 transition (Fig. 1), adding thereby weight to the idea
of the origin of hg H2 outside Europe. Therefore we propose to re-define hg H2 by the 1438
transition and nominate lineages inside H2 with the transition at np 4769 as H2a, with
transitions at nps 8598 and 16311 as H2b and with the transition at np 951 as H2a1. In the
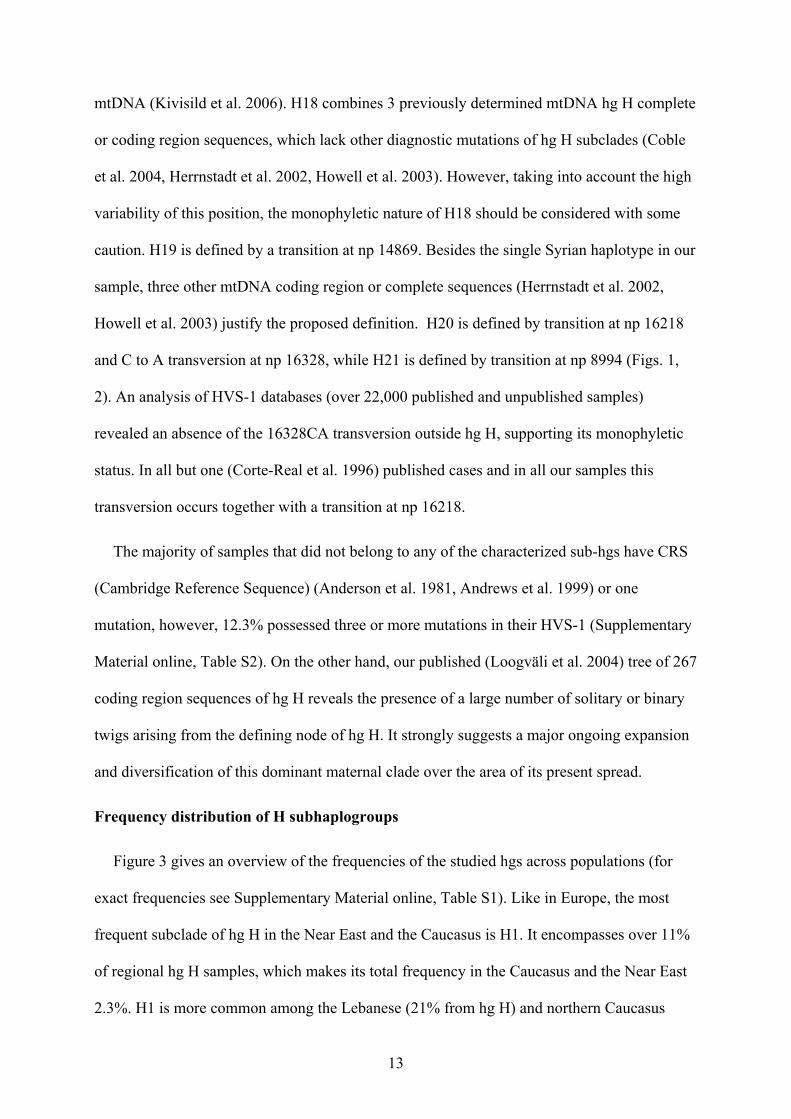
three new completely sequenced H2a samples (Fig. 2) one possessed the transition at np
10810, which is characteristic of H2c (Achilli et al. 2004). For this reason, we renamed it as
H2a3 and the two other samples that shared a substitution at np 11140 as H2a4.
The topology of H4 changes significantly as a result of the complete sequencing of two
genomes (Figs. 1, 2). It was previously considered to be defined by six mutations (Loogväli et
al. 2004). Here we show that three mutations in the coding region – 3992, 5004, 9123 – make
up the root of the clade, while three transitions at nps 4024, 14365 and 14582 separate H4a
and a transition at np 10166 distinguishes H4b.
One of the most diverse sub-hgs of hg H is H13 (Figs. 1, 2). A transition at np 2259
separates H13a, which is further divided into H13a1 by a transition at np 4745, and H13a2 by
transition at np 709. We have also completely sequenced two H14 genomes (Fig. 2). It
appears that two HVS-1 transitions at nps 16256 and 16352 can be used to define subclade
H14a (Figs. 1, 2).
Four additional sub-hgs, H18, H19, H20 and H21, are defined here for the first time. H18
is defined by a transition at np 13708, which, notably, is a major non-synonymous hotspot in
13
mtDNA (Kivisild et al. 2006). H18 combines 3 previously determined mtDNA hg H complete
or coding region sequences, which lack other diagnostic mutations of hg H subclades (Coble
et al. 2004, Herrnstadt et al. 2002, Howell et al. 2003). However, taking into account the high
variability of this position, the monophyletic nature of H18 should be considered with some
caution. H19 is defined by a transition at np 14869. Besides the single Syrian haplotype in our
sample, three other mtDNA coding region or complete sequences (Herrnstadt et al. 2002,
Howell et al. 2003) justify the proposed definition. H20 is defined by transition at np 16218
and C to A transversion at np 16328, while H21 is defined by transition at np 8994 (Figs. 1,
2). An analysis of HVS-1 databases (over 22,000 published and unpublished samples)
revealed an absence of the 16328CA transversion outside hg H, supporting its monophyletic
status. In all but one (Corte-Real et al. 1996) published cases and in all our samples this
transversion occurs together with a transition at np 16218.
The majority of samples that did not belong to any of the characterized sub-hgs have CRS
(Cambridge Reference Sequence) (Anderson et al. 1981, Andrews et al. 1999) or one
mutation, however, 12.3% possessed three or more mutations in their HVS-1 (Supplementary
Material online, Table S2). On the other hand, our published (Loogväli et al. 2004) tree of 267
coding region sequences of hg H reveals the presence of a large number of solitary or binary
twigs arising from the defining node of hg H. It strongly suggests a major ongoing expansion
and diversification of this dominant maternal clade over the area of its present spread.
Frequency distribution of H subhaplogroups
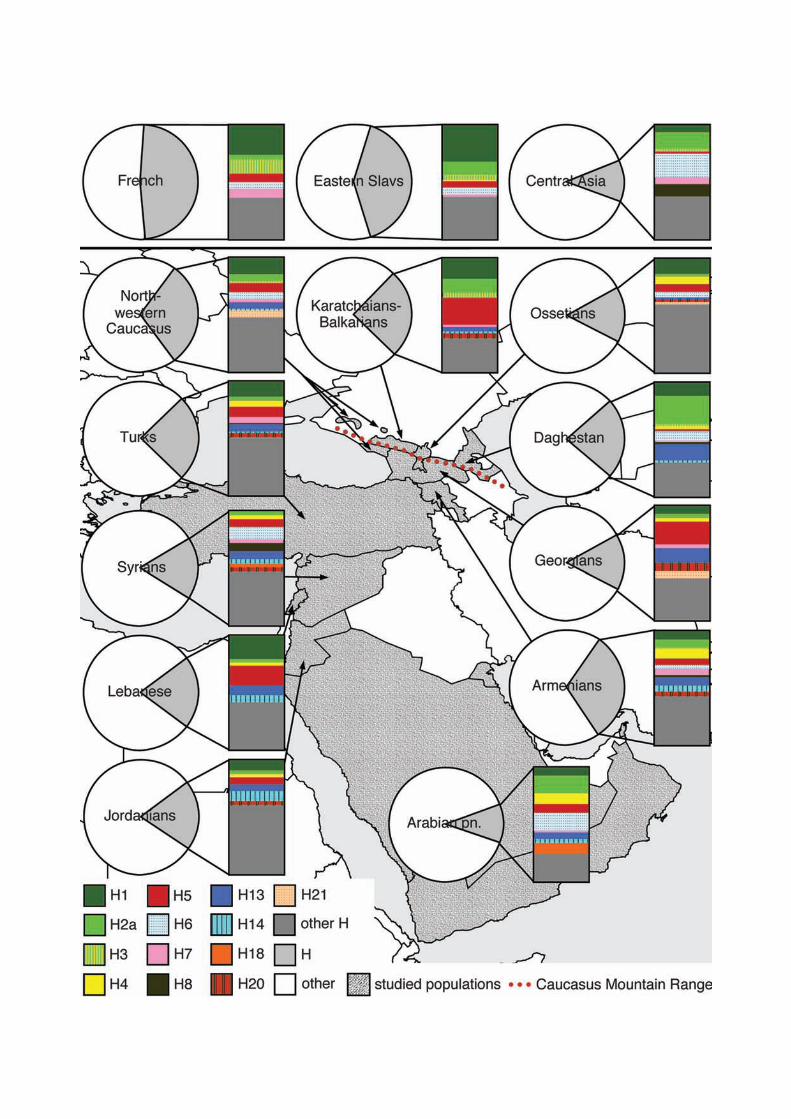
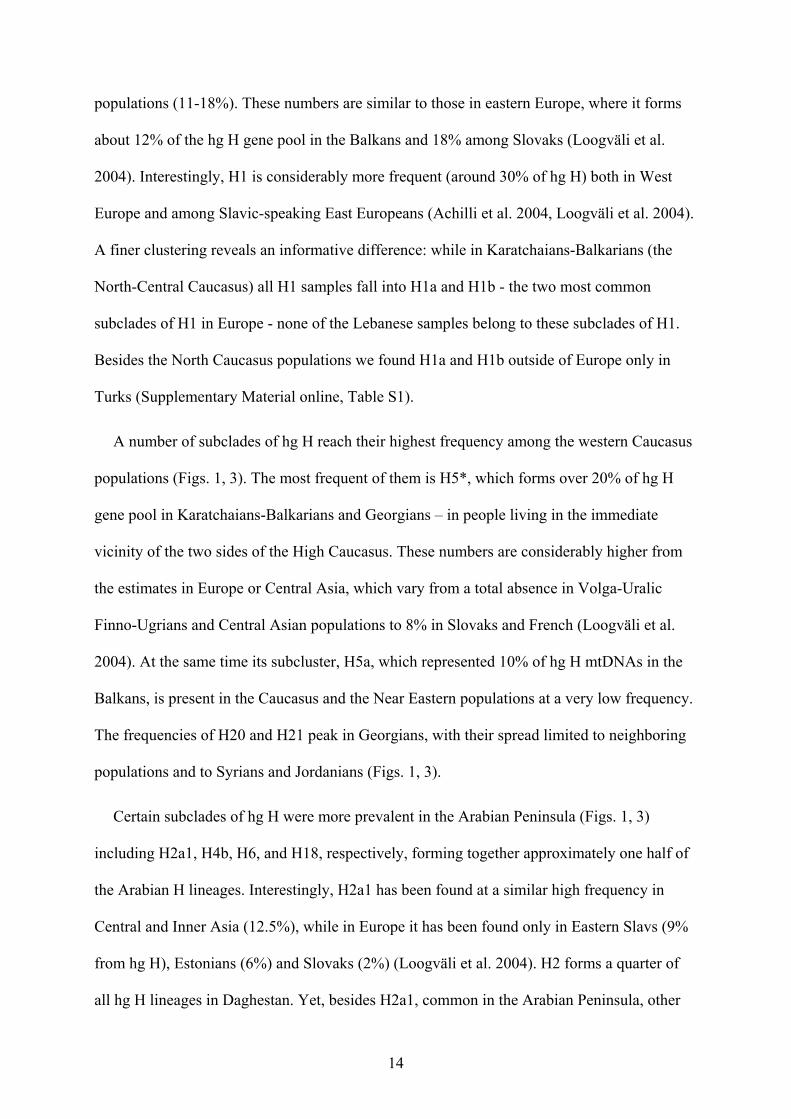
Figure 3 gives an overview of the frequencies of the studied hgs across populations (for
exact frequencies see Supplementary Material online, Table S1). Like in Europe, the most
frequent subclade of hg H in the Near East and the Caucasus is H1. It encompasses over 11%
of regional hg H samples, which makes its total frequency in the Caucasus and the Near East
2.3%. H1 is more common among the Lebanese (21% from hg H) and northern Caucasus
14
populations (11-18%). These numbers are similar to those in eastern Europe, where it forms
about 12% of the hg H gene pool in the Balkans and 18% among Slovaks (Loogväli et al.
2004). Interestingly, H1 is considerably more frequent (around 30% of hg H) both in West
Europe and among Slavic-speaking East Europeans (Achilli et al. 2004, Loogväli et al. 2004).
A finer clustering reveals an informative difference: while in Karatchaians-Balkarians (the
North-Central Caucasus) all H1 samples fall into H1a and H1b - the two most common
subclades of H1 in Europe - none of the Lebanese samples belong to these subclades of H1.
Besides the North Caucasus populations we found H1a and H1b outside of Europe only in
Turks (Supplementary Material online, Table S1).
A number of subclades of hg H reach their highest frequency among the western Caucasus
populations (Figs. 1, 3). The most frequent of them is H5*, which forms over 20% of hg H
gene pool in Karatchaians-Balkarians and Georgians – in people living in the immediate
vicinity of the two sides of the High Caucasus. These numbers are considerably higher from
the estimates in Europe or Central Asia, which vary from a total absence in Volga-Uralic
Finno-Ugrians and Central Asian populations to 8% in Slovaks and French (Loogväli et al.
2004). At the same time its subcluster, H5a, which represented 10% of hg H mtDNAs in the
Balkans, is present in the Caucasus and the Near Eastern populations at a very low frequency.
The frequencies of H20 and H21 peak in Georgians, with their spread limited to neighboring
populations and to Syrians and Jordanians (Figs. 1, 3).
Certain subclades of hg H were more prevalent in the Arabian Peninsula (Figs. 1, 3)
including H2a1, H4b, H6, and H18, respectively, forming together approximately one half of
the Arabian H lineages. Interestingly, H2a1 has been found at a similar high frequency in
Central and Inner Asia (12.5%), while in Europe it has been found only in Eastern Slavs (9%
from hg H), Estonians (6%) and Slovaks (2%) (Loogväli et al. 2004). H2 forms a quarter of
all hg H lineages in Daghestan. Yet, besides H2a1, common in the Arabian Peninsula, other
15
variants of H2, like H2a4, form a large share of hg H in Daghestan. H6 is even more frequent
in Central and Inner Asia (21%), especially so in Altaians (35%) (Loogväli et al. 2004).
One of the most diverse subclades of hg H, H13, reaches its highest frequency in
Daghestan and in Georgia (15% and 13.3% from hg H, respectively) (Fig. 3, Supplementary
Material online). While all of the H13 samples in Daghestan and also in Europe (Herrnstadt et
al. 2002; Coble et al. 2004; Brandstätter et al. 2006) fall into H13a, the largest subclade of
H13 – additional H13 lineages are present in the southern Caucasus and Near East
populations (Fig. 1).
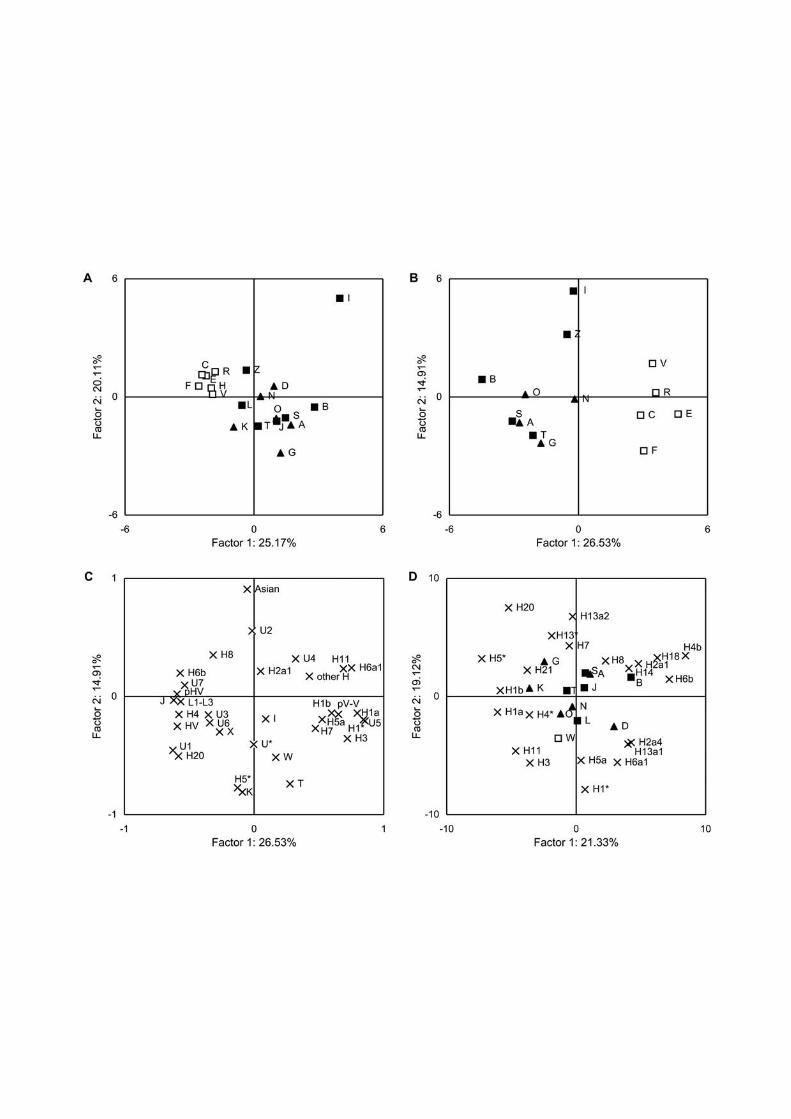
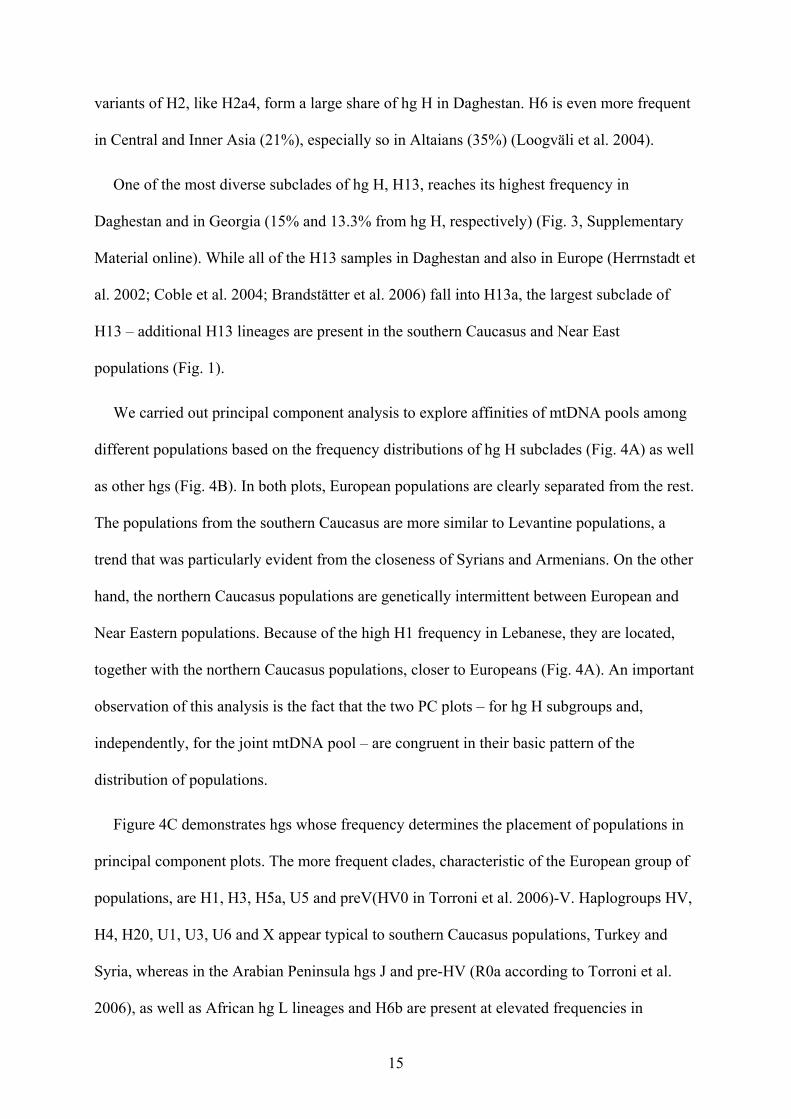
We carried out principal component analysis to explore affinities of mtDNA pools among
different populations based on the frequency distributions of hg H subclades (Fig. 4A) as well
as other hgs (Fig. 4B). In both plots, European populations are clearly separated from the rest.
The populations from the southern Caucasus are more similar to Levantine populations, a
trend that was particularly evident from the closeness of Syrians and Armenians. On the other
hand, the northern Caucasus populations are genetically intermittent between European and
Near Eastern populations. Because of the high H1 frequency in Lebanese, they are located,
together with the northern Caucasus populations, closer to Europeans (Fig. 4A). An important
observation of this analysis is the fact that the two PC plots – for hg H subgroups and,
independently, for the joint mtDNA pool – are congruent in their basic pattern of the
distribution of populations.
Figure 4C demonstrates hgs whose frequency determines the placement of populations in
principal component plots. The more frequent clades, characteristic of the European group of
populations, are H1, H3, H5a, U5 and preV(HV0 in Torroni et al. 2006)-V. Haplogroups HV,
H4, H20, U1, U3, U6 and X appear typical to southern Caucasus populations, Turkey and
Syria, whereas in the Arabian Peninsula hgs J and pre-HV (R0a according to Torroni et al.
2006), as well as African hg L lineages and H6b are present at elevated frequencies in
16
comparison with other populations. Finally, we estimated the effect of the previously
uncharacterized subclades of hg H on the overall genetic landscape (Fig. 4D). The relatively
high frequency of H13a1, together with those of H2a4, H6a, characterizes Daghestan
populations, distinguishing them from other northern Caucasus populations. H20 and H21, in
addition to H5*, separate Georgians and Karatchaians-Balkarians from the rest.
Coalescence analysis
From the HVS-1 coalescence analysis (Table 1) it is evident that most clades of hg H bear
the strongest signal for the beginning of their expansion after the LGM, during the Late
Pleistocene and early Holocene. Significantly older is the estimate for H13. The apparent
coalescence time for H1 is influenced by its subclades H1a and H1b, as without them the
respective estimate in the Near East and the Caucasus drops from around 20,000 to 12,000
years before present. H6, one of the oldest clades in the Near East and the Caucasus, shows,
in sharp contrast, an expansion age of a mere 3400 YBP in Europe, which is the youngest
estimate overall for the major subclades of hg H.
In addition to HVS-1 analysis we also estimated the coalescence age from coding region
data (Fig. 2). Using the calibration method of Mishmar et al. (2003), which does not
differentiate between mutation types (synonymous vs. non-synonymous), the age for H13 is
24,300 (SD 6900) YBP and for H4 is 27,500 (SD 9400) YBP. The age estimate for H13,
when counting only synonymous substitutions (Kivisild et al. 2006), is 18,500 YBP (SD
6600) and 10,100 YBP (SD 6000) for H4. As an interesting empirical observation, we found
that the non-synonymous versus synonymous mutations ratio differs considerably between
sub-hgs and, as estimated on the tree presented in Figure 2, equals 0.5 for H13, only 0.2 for
H13a1, and 0.67 for H4.
17
We calculated the mean number of pairwise differences for some clades (Supplementary
Material online, Fig. S2). Sub-hgs with younger coalescence times show mainly unimodal
mismatch distributions, with the peak centered at one difference between sequence pairs. For
a comparison we have added our previous data of H3 sequences from European populations
(Loogväli et al. 2004), since they represented lineages that were characteristic of post-glacial
recolonization of northern Europe (for a discussion see Achilli et al. 2004 and Loogväli et al.
2004). In older clades there is a shift towards larger differentiation between lineages, moving
the peak of mismatch distributions to 2 or 3 differences. The distributions can become
multimodal as a result of constant population size for a longer period or multiple expansions
and bottlenecks. The subclades of H6 show multimodal mismatch distributions, caused either
by small sample sizes or, rather, by the complex demographic history of their carriers.
Slightly multimodal is the distribution in the case of H1, which could be transformed to
unimodal by excluding H1a and H1b.
18
Discussion
The peopling of Europe by AMH probably started more than 40,000 YBP (Mellars 2006),
with the first evidence in the Lower Danube Basin (Churchill and Smith 2000, Conard and
Bolus 2003), suggesting the Near East - Anatolia as a likely route for these pioneer hunter-
gatherers to Europe. The present-day variation of hg H suggests that this mtDNA clade arose
outside Europe before the LGM (Richards et al. 2000, Torroni et al. 1998, Loogväli et al.,
2004, Pereira et al. 2005). In our attempt to expose pre-LGM limbs of hg H, we have
characterized here the phylogeography of H13, which is one of the most diverse sub-hgs in
the Near East and the Caucasus. It has a coalescence age of about 31,000 YBP according to
HVS-1 (Table 1) and about 25,000 or 19,000 YBP when calculated using coding region
mutations. These dates place its origin before the LGM, because the coalescence age,
signaling the beginning of the expansion, is only the minimal absolute age of the clade. The
beginning of the expansion of some other clades, like H6 and H14, date to the pre-LGM
period as well, but with standard deviations rather large, a more exact placement of their
temporal origin is not currently possible. Furthermore, the timing of expansions relies heavily
on the molecular clock exploited.
The topology of H14 (Fig. 1) illustrates the intricacy of estimating coalescence age in the
case of a complex demographic history. Thus, H14a, being on a root of two HVS-1 mutations,
elevates the apparent coalescence age of the whole H14 to 39,000 YBP. Yet the topology of
H14 is perhaps better explained by assuming the presence of two founders of unknown and
unequal time of origin (H14 root haplotype and that of H14a), subject to a later, likely
simultaneous expansion phase, manifested in their present-day diversity.
It is likely that the subclades of hg H that are common today, some of which being
associated with post-LGM re-occupation, were already frequent before the LGM, decreasing
the probability of their extinction. This suggestion is indirectly supported by multimodal
19
mismatch distributions observed for H6 subclades and H1 (Supplementary Material online).
In particular, H13 shows significantly earlier “summary” coalescence age, compared to other
large subclades of hg H, and a unimodal mismatch distribution (see Table 1 and
Supplementary Material online, Fig. S2). The reason for this could lie in its area of spread,
centered in the southern Caucasus and the northern part of the Near East (Fig. 3), having
presumably milder and less arid climate during the LGM, favorable for human occupation
(Adams and Faure 1997, Ramrath et al. 1999, Tarasov et al. 1999, Tarasov et al. 2000, Aksu
et al. 2002). A global climate model, based on solar output, has revealed that a significant
warming of Earth climate occurred between 33,000 to 26,000 YBP (Perry and Hsu 2000).
Independently, more humid conditions in the Near East and Greece before the LGM (31,000-
25,000 YBP) have been deduced from geological and pollen data analysis (Abed and Yaghan
2000, Tzedakis et al. 2002, Vaks et al. 2003, Hughes, Woodward and Gibbard 2005). These
estimates overlap with the coalescence dates calculated here for the oldest subclades of hg H.
We assume, therefore, that the first expansion wave of hg H may have taken place during this
favorable timeframe, probably in the northern part of the Near East and the southern
Caucasus, where the oldest clades of hg H appear to be more diverse until now. It has been
shown that the Upper Paleolithic archaeological culture was present in the South Caucasus
more than 30,000 YBP, well before the LGM (Adler et al. 2006), giving support for our
estimates of past population expansions in this region.
How far the pre-LGM expansion of hg H from the Near East may have reached before the
onset of the LGM is indicated by the distributions of some hg H subclades (H1, H3) (Achilli
et al. 2004, Pereira et al. 2005), as well as its sister clade hg V (Torroni et al. 1998, Torroni et
al. 2001). In Europe, these clades display frequency clines radiating from the Iberian
Peninsula. This pattern has been associated with the spread of the carriers of the Magdalenian
20
culture after the LGM, suggesting that hg H had reached Europe (Pereira et al. 2005) and,
perhaps, western Siberia/Inner Asia (Loogväli et al. 2004), before the LGM.
It is most likely that the initial population expansion in the southern Caucasus and the Near
East involved other maternal lineages besides hg H as well. In this context it is worth pointing
out that hg U3 has been shown to be most divergent in this region, having begun to expand
about 30,000 YBP (Metspalu et al. 1999). Similarly, hg HV1, with an analogous coalescence
estimate, is most common and diverse in the southern Caucasus, present in the eastern
Mediterranean. On the other hand, neither of the two became ever as frequent in Europe as hg
H did (Tambets et al. 2000), suggesting that profoundly different later migration scenarios
apply to them.
It should be stressed that for the majority of hg H subclades the signal of expansion in the
Near East and the Caucasus lies in a time frame between 18,000 and 10,000 YBP (Table 1). It
may suggest that such subclades not only expanded, but in fact arose much later than the
earliest limbs of hg H. The European hg H gene pool differs significantly from that in the
southern Caucasus and the Near East (Fig. 4A), because different sub-hgs have expanded
after the LGM in different large sub-continental areas. Most importantly - it appears that after
the initial migration of the carriers of hg H into Europe, presumably already before or during
the Gravettian period, there was little subsequent admixture of the West Asian and European
hg H lineages.
As for Europe, a number of frequency/diversity clines in the Near East and the Caucasus
could be associated with the postglacial population expansion phase. This can be partially
ascribed, as in Europe, to the (re)colonization of areas which were unsuitable for human
occupation during the LGM due to aridity and lower temperatures. Sub-hgs H5*, H20 and
H21 are the most frequent and diverse in the western Caucasus hg H gene pool. The region,
stretching over the southeastern coast of the Black Sea, was a refugium area for forest (Adams
21
and Faure 1997, Tarasov et al. 1999, Tarasov et al. 2000) and could have thus provided better
conditions for fauna, as well as perhaps for human beings during the LGM. The
phylogeography of H20 and H21 appears to be strictly limited within the immediate
neighboring populations, suggesting their autochthonous origin in the Caucasus, while H5*
has also been found throughout western Eurasia, albeit at a lower frequency (Loogväli et al.
2004). The expansion of humans to the Arabian Peninsula likely took place later, due to
persisting aridity, which is still characteristic of the region today. As a consequence, the
overall genetic diversity of hg H lineages in this region is very low (Fig. 1) and the
corresponding frequency pattern of hg H subclades differs from that observed elsewhere in
the Near East (Fig. 3).
Furthermore, our analysis provides evidence for possible back migration to the Caucasus
and the Near East from the European populations. This possibility, as far as the Near East is
concerned, has been discussed in some details by Richards et al. (2000), where a need for
rigorous comparative phylogeographic lineage analysis (“founder analysis”) has been
stressed. Complete mtDNA sequence based phylogeographic analysis – an approach that
became available only recently – offers a new and more powerful means for such analysis
(Torroni et al. 2006). Our results show that hg H-related gene flow from the East European
Plain to the Caucasus populations is particularly evident in the mtDNA pool of the Turkic-
speaking Karatchaians-Balkarians, where typically European sub-hgs of hg H, such as H1a,
H1b and H3, are present at a high frequency (Figs. 1, 2 and Supplementary Material online).
This apparent overlap may have ancient roots, such as shared ancestry of Karatchaians-
Balkarians and northern Ponto-Caspian nomadic people.
Taken together with recent series of predominantly “eurocentric” high resolution
phylogeographic analysis of hg H (Achilli et al. 2004, Loogväli et al. 2004, Pereira et al.
2005), presented here data suggests that hg H had already expanded before the LGM, with its

22
oldest lineages being frequent in the southern Caucasus and the northern part of the Near East.
A new phase of expansion followed the climate amelioration after the LGM. Later on, there
appears to be only limited mtDNA flow from the Near East/the southern Caucasus towards
Europe, as far as the dominant maternal lineage cluster – hg H – is concerned. As a result,
different frequency spectra of hg H subclades characterize an otherwise largely joint Near
Eastern heritage of maternal lineages for both West Asia and Europe.
23
Supplementary Material
Supplementary tables S1 (frequencies of hg H subclades) and S2 (RFLP data and HVS-1
haplotypes) as well as figures S1 (hg H nomenclature) and S2 (mismatch distributions) are
available at the journal ’s website. Fifteen completely sequenced mitochondrial genomes have
been submitted to the EMBL Nucleotide Sequence Database (http://www.ebi.ac.uk/embl/)
under accession numbers AM263177-AM263191.
Acknowledgments
We are grateful to all the voluntary donors of DNA samples used in this study and to
Mukaddes Gölge for her help in collecting the Turkish samples and Armen Torosjan for
Armenian samples. We thank Jaan Lind and Ille Hilpus for expert technical assistance. This
study was supported by Estonian Science Foundation grants 5574 (to T.K.), 5807 (to E.M.)
and 6040 (to K.T).
24
Literature Cited
Abed AM, Yaghan R. 2000. On the paleoclimate of Jordan during the last glacial maximum.
Palaeogeogr. Palaeocol. 160:23-33.
Achilli A, Rengo C, Magri C, et al. (21 co-authors). 2004. The molecular dissection of
mtDNA haplogroup H confirms that the Franco-Cantabrian glacial refuge was a major
source for the European gene pool. Am. J. Hum. Genet. 75:910-918.
Adams JM, Faure H. 1997. Preliminary vegetation maps of the World since the Last Glacial
Maximum: an aid to archaeological understanding. J. Archaeol. Sci. 24:623-647.
Adler DS, Bar-Oz G, Belfer-Cohen A, Bar-Yosef O. 2006. Ahead of the game. Curr.
Anthropol. 47:89-118.
Aksu AE, Hiscott RN, Kaminski MA, Mudie PJ, Gillespie H, Abrajano T, Yasar D. 2002.
Last glacial-Holocene paleoceanography of the Black Sea and Marmara Sea: stable
isotopic, foraminiferal and coccolith evidence. Mar. Geol. 190:119-149.
Allard MW, Miller K, Wilson M, Monson K, Budowle B. 2002. Characterization of the
Caucasian haplogroups present in the SWGDAM forensic mtDNA dataset for 1771
human control region sequences. Scientific Working Group on DNA Analysis
Methods. J. Forensic Sci. 47:1215-1223.
Al-Zahery N, Semino O, Benuzzi G, Magri C, Passarino G, Torroni A, Santachiara-
Benerecetti AS. 2003. Y-chromosome and mtDNA polymorphisms in Iraq, a
crossroad of the early human dispersal and of post-Neolithic migrations. Mol. Phyl.
Evol. 28:458-472.
Ammerman AJ, Cavalli-Sforza LL. 1984. The Neolithic transition and the genetics of
populations in Europe. Princeton University Press, Princeton, NJ.
Anderson S, Bankier AT, Barrell BG, et al. (14 co-authors). 1981. Sequence and organization
of the human mitochondrial genome. Nature 290:457-465.
25
Andrews RM, Kubacka I, Chinnery PF, Lightowlers RN, Turnbull DM, Howell N. 1999.
Reanalysis and revision of the Cambridge Reference Sequence for human
mitochondrial DNA. Nature Genet. 23:147.
Babalini C, Martinez-Labarga C, Tolk H-V, et al. (16 co-authors). 2005. The population
history of the Croatian linguistic minority of Molise (southern Italy): a maternal view.
Eur. J. Hum. Genet. 13:1-11.
Bandelt H-J, Forster P, Sykes BC, Richards MB. 1995. Mitochondrial portraits of human
populations using median networks. Genetics 141:743-753.
Bandelt H-J, Forster P, Röhl A. 1999. Median-joining networks for inferring intraspecific
phylogenies. Mol. Biol. Evol. 16:37-48.
Barbujani G, Pilastro A, De Domenico S, Renfrew C. 1994. Genetic variation in North Africa
and Eurasia: Neolithic demic diffusion vs. Paleolithic colonisation. Am. J. Phys.
Anthropol. 95:137-154.
Belledi M, Poloni ES, Casalotti R, Conterio F, Mikerezi I, Tagliavini J, Excoffier L. 2000.
Maternal and paternal lineages in Albania and the genetic structure of Indo-European
populations. Eur. J. Hum. Genet. 8:480-486.
Bendall KE, Sykes BC. 1995. Length heteroplasmy in the first hypervariable segment of the
human mtDNA control region. Am. J. Hum. Genet. 57:248-256.
Bermisheva MA, Tambets K, Villems R, Khusnutdinova EK. 2002. Diversity of
mitochondrial DNA haplogroups in ethnic populations of the Volga-Ural region of
Russia. Mol. Biol. (Mosk.) 36:990-1001.
Brandstätter A, Salas A, Niederstätter H, Gassner C, Carracedo A, Parson W. 2006.
Dissection of mitochondrial superhaplogroup H using coding region SNPs.
Electrophoresis 27:2541-2550.
26
Cavalli-Sforza LL, Menozzi P, Piazza A. 1994. The history and geography of human genes.
Princeton University Press, Princeton, NJ.
Chikhi L, Nichols RA, Barbujani G, Beaumont MA. 2002. Y genetic data support the
Neolithic demic diffusion model. Proc. Natl. Acad. Sci. USA 99:11008-11013.
Churchill SE, Smith FH. 2000. Makers of the early Aurignacian of Europe. Yearb. Phys.
Anthropol. 49:61-115
Clark PU, McCabe AM, Mix AC, Weaver AJ. 2004. Rapid rise of the sea level 19,000 years
ago and its global implications. Science 304:1141-1144.
Coble MD, Just RS, O`Callaghan JE, Letmanyi IH, Peterson CT, Irwin JA, Parsons TJ. 2004.
Single nucleotide polymorphisms over the entire mtDNA genome that increase the
power of forensic testing in Caucasians. Int. J. Legal. Med. 118:137-146.
Conard NJ, Bolus M. 2003. Radiocarbon dating the appearance of modern humans and timing
of cultural innovations in Europe: new results and new challenges. J. Hum. Evol.
44:331-371.
Corte-Real HBSM, Macaulay VA, Richards M, Hariti G, Issad MS, Cambon-Thomsen A,
Papiha S, Bertranpetit J, Sykes BC. 1996. Genetic diversity in the Iberian Peninsula
determined from mitochondrial sequence analysis. Ann. Hum. Genet. 60:331-350.
Crucifix M, Betts RA, Hewitt CD. 2005. Pre-industrial-potential and Last Glacial Maximum
global vegetation simulation with a coupled climate-biosphere model: diagnosis of
bioclimatic relationships. Global Planet. Change 45:295-312.
Derenko MV, Grzybowski T, Malyarchuk BA, et al. (11 co-authors). 2003. Diversity of
mitochondrial DNA lineages in South Siberia. Ann. Hum. Genet. 67:391-411.
Dubut V, Chollet L, Murail P, Cartault F, Béraud-Colomb E, Serre M, Mogentale-Profizi N.
2004. mtDNA polymorphisms in five French groups: importance of regional
sampling. Eur. J. Hum. Genet. 12:293-300.
27
Dupanloup I, Bertorelle G, Chikhi L, Barbujani G. 2004. Estimating the impact of prehistoric
admixture on the genomes of Europeans. Mol. Biol. Evol. 21:1361-1372.
Ewing B, Hillier L, Wendl MC, Green P. 1998. Base-calling of automated sequencer traces
using PHRED. I. Accuracy assessment. Genome Res. 8:175-185.
Excoffier L, Schneider S. 1999. Why hunter-gatherer populations do not show signs of
Pleistocene demographic expansions. Proc. Natl. Acad. Sci. USA 96:10597-10602.
Excoffier L, Laval G, Schneider S. 2005. Arlequin ver. 3.0: an integrated software package
for population genetic data analysis. Evol. Bioinf. Online 1:47-50.
Finnilä S, Lehtonen MS, Majamaa K. 2001. Phylogenetic network for European mtDNA. Am.
J. Hum. Genet. 68:1475-1484.
Forster P, Harding R, Torroni A, Bandelt HJ. 1996. Origin and evolution of Native American
mtDNA variation: a reappraisal. Am. J. Hum. Genet. 59:935-945.
Forster P. 2004. Ice Ages and the mitochondrial DNA chronology of human dispersals: a
review. Phil. Trans. R. Soc. Lond. 359:255-264.
Haak W, Forster P, Bramanti B, et al. (11 co-authors). 2005. Ancient DNA from the first
European farmers in 7500-year-old Neolithic sites. Science 310:1016-1018.
Hasegawa M, Di Rienzo A, Kocher TD, Wilson A. 1993. Toward a more accurate time scale
for the human mitochondrial DNA tree. J. Mol. Evol. 37:347-354.
Herrnstadt C, Elson JL, Fahy E, et al. (11 co-authors). 2002. Reduced-median-network
analysis of complete mitochondrial DNA coding-region sequences for the major
African, Asian, and European haplogroups. Am. J. Hum. Genet. 70:1152-1171.
Howell N, Oostra RJ, Bolhuis PA, Spruijt L, Clarke LA, Mackey DA, Preston G, Herrnstadt
C. 2003. Sequence analysis of the mitochondrial genomes from Dutch pedigrees with
Leber hereditary optic neuropathy. Am. J. Hum. Genet. 72:1460-1469.
28
Hughes PD, Woodward JC, Gibbard PL. 2005. Late Pleistocene glaciers and climate in the
Mediterranean. Global Planet. Change 50:83-98.
Ingman M, Kaessmann H, Pääbo S, Gyllensten U. 2000. Mitochondrial genome variation and
the origin of modern humans. Nature 408:708-713.
Kivisild T, Rootsi S, Metspalu M. et al. (18 co-authors). 2003a. The genetic heritage of the
earliest settlers persists both in Indian tribal and caste populations. Am. J. Hum.
Genet. 72:313-332.
Kivisild T, Rootsi S, Metspalu M, Metspalu E, Parik J, Kaldma K, Usanga E, Mastana S,
Papiha SS, Villems R. 2003b. The genetics of the language and farming spread in
India. In: Renfrew C, Boyle K, editors. Examining the farming/language dispersal
hypothesis. Cambridge, McDonald Institute Monographs series. p. 215-222..
Kivisild T, Reidla M, Metspalu E, Rosa A, Brehm A, Pennarun E, Parik J, Geberhiwot T,
Usanga E, Villems R. 2004. Ethiopian mitochondrial DNA heritage: tracking
geneflow across and around the Gate of Tears. Am. J. Hum. Genet. 75:752-770.
Kivisild T, Shen P, Wall DP, et al. (17 co-authors). 2006. The role of selection in the
evolution of human mitochondrial genomes. Genetics 172:373-387.
Lahr MM, Foley RA. 1994. Multiple dispersals and modern human origins. Evol. Anthropol.
3:48-60.
Loogväli E-L, Roostalu U, Malyarchuk BA, et al. (35 co-authors). 2004. Disuniting
uniformity: a pied cladistic canvas of mtDNA haplogroup H in Eurasia. Mol. Biol.
Evol. 21:2012-2021.
Macaulay VA, Richards MB, Hickey E, Vega E, Cruciani F, Guida V, Scozzari R, Bonné-
Tamir B, Sykes B, Torroni A. 1999. The emerging tree of west Eurasian mtDNAs: a
synthesis of control-region sequences and RFLPs. Am. J. Hum. Genet. 64:232-249.
29
Macaulay V, Hill C, Achilli A, et al. (21 co-authors). 2005. Single, rapid coastal settlement of
Asia revealed by analysis of complete mitochondrial genomes. Science 308:1034-
1036.
Malyarchuk BA, Derenko MV. 2001. Variation of human mitochondrial DNA: distribution of
hot spots in hypervariable segment I of the major noncoding region. Genetika 37:991-
1001.
Malyarchuk BA, Grzybowski T, Derenko MV, Czarny J, Wozniak M, Miscicka-Sliwka D.
2002. Mitochondrial DNA variability in Poles and Russians. Ann. Hum. Genet.
66:261-283.
Mellars P. 2006. A new radiocarbon revolution and the dispersal of modern humans in
Eurasia. Nature 439:931-935.
Metspalu E, Kivisild T, Kaldma K, Parik J, Reidla M, Tambets K, Villems R. 1999. The
Trans-Caucasus and the expansion of the Caucasoid-specific human mitochondrial
DNA. In: Papiha SS, Deka R, Chakraborty R, editors. Genome Diversity: Applications
in Human Population Genetics. New York, Kluwer. p. 121-133.
Metspalu M, Kivisild T, Metspalu E, et al. (17 co-authors). 2004. Most of the extant mtDNA
boundaries in the South and the Southwest Asia were likely shaped during the initial
settlement of Eurasia by anatomically modern humans. BMC Genet. 5:26.
Mishmar D, Ruiz-Pesini E, Golik P, et al. (13 co-authors). 2003. Natural selection shaped
regional mtDNA variation in humans. Proc. Natl. Acad. Sci. USA 100:171-176.
Mitchell AL, Elson JL, Howell N, Taylor RW, Turnbull DM. 2006. Sequence variation in
mitochondrial complex I genes: mutation or polymorphism? J Med Genet 43: 175-
179.
30
Nickerson DA, Tobe VO, Taylor SL. 1997. PolyPhred: automating the detection and
genotyping of single-nucleotide substitutions using fluorescence-based resequencing.
Nucleic Acid Res. 25:2745-2751.
Palanichamy MG, Sun C, Agrawal S, Bandelt HJ, Kong QP, Khan F, Wang CY, Chaudhuri
TK, Palla V, Zhang YP. 2004. Phylogeny of mitochondrial DNA macrohaplogroup N
in India, based on complete sequencing: implications for the peopling of South Asia.
Am J Hum Genet. 2004 75:966-978.
Pereira L, Richards M, Goios A, et al. (13 co-authors). 2005. High-resolution mtDNA
evidence for the late-glacial resettlement of Europe from an Iberian refugium. Genome
Res. 15:19-24.
Perry CA, Hsu KJ. 2000. Geophysical, archaeological, and historical evidence support a
solar-output model for climate change. Proc. Natl. Acad. Sci. USA 97:12433-12438.
Peyron O, Guiot J, Cheddadi R, Tarasov P, Reille M, de Beaulieu J-L, Bottema S, Andrieu V.
1998. Climatic reconstruction in Europe for 18,000 Y.B.P. from pollen data.
Quaternary Res. 49:183-196.
Pinhasi R, Fort J, Ammerman A. 2005. Tracing the origin and spread of agriculture in Europe.
PLoS Biol. 3:2220-2228.
Quintana-Murci L, Semino O, Bandelt H-J, Passarino G, McElreavey K, Santachiara-
Benerecetti AS. 1999. Genetic evidence of an early exit of Homo sapiens sapiens from
Africa through eastern Africa. Nature. 23:437-441.
Quintana-Murci L, Chaix R, Wells SR, et al. (17 co-authors). 2004. Where West meets East:
the complex mtDNA landscape of the Southwest and Central Asian corridor. Am. J.
Hum. Genet. 74:827-845.
31
Quintans B, Alvarez-Iglesias V, Salas A, Phillips C, Lareu MV, Carracedo A. 2004. Typing
of mitochondrial DNA coding region SNPs of forensic and anthropological interest
using SNaPshot minisequencing. Forensic Sci Int 140:251-257.
Ramrath A, Zolitschka B, Wulf S, Negendank JFKW. 1999. Late Pleistocene climate
variations as recorded in two Italian maar lakes (Lago di Mezzano, Lago Grande di
Monticchio). Quaternary Sci. Rev. 18:977-992.
Richards M, Corte-Real H, Forster P, Macaulay V, Wilkinson-Herbots H, Demaine A, Papiha
S, Hedges R, Bandelt H-J, Sykes B. 1996. Paleolithic and Neolithic lineages in the
European mitochondrial gene pool. Am. J. Hum. Genet. 59:185-203.
Richards M, Macaulay V, Hickey E, et al. (26 co-authors). 2000. Tracing European founder
lineages in the Near Eastern mtDNA pool. Am. J. Hum. Genet. 67:1251-1276.
Rootsi S, Magri C, Kivisild T, et al. (45 co-authors). 2004. Phylogeography of Y-
chromosome haplogroup I reveals distinct domains of prehistoric gene flow in Europe.
Am. J. Hum. Genet. 75:128-137.
Saillard J, Magalhaes PJ, Schwartz M, Rosenberg T, Norby S. 2000. Mitochondrial DNA
variant 11719G is a marker for the mtDNA haplogroup cluster HV. Hum.Biol.
72:1065-1068.
Saillard J, Forster P, Lynnerup N, Bandelt H-J, Norby S. 2000. mtDNA variation among
Greenland Eskimos: the edge of the Beringian expansion. Am. J. Hum. Genet. 67:718-
726.
Sajantila A, Lahermo P, Anttinen T, et al. (13 co-authors). 1995. Genes and languages in
Europe: and analysis of mitochondrial lineages. Genome Res. 5:42-52.
Sajantila A, Salem AH, Savolainen P, Bauer K, Gierig C, Paabo S. 1996. Paternal and
maternal DNA lineages reveal a bottleneck in the founding of the Finnish population.
Proc. Natl. Acad. Sci. USA 93:12035-12039.
32
Semino O, Passarino G, Oefner PJ, et al. (17 co-authors). 2000. The genetic legacy of
Paleolithic Homo sapiens sapiens in extant Europeans: a Y chromosome perspective.
Science 290:1155-1159.
Shea JJ. 2003. The Middle Paleolithic of the East Mediterranean Levant. J. World Prehist.
17:313-394.
Simon DK, Friedman J, Breakefield XO, et al. (11 co-authors). 2003. A heteroplasmic
mitochondrial complex I gene mutation in adult-onset dystonia. Neurogenetics 4:199-
205.
Sokal RR, Oden NL, Wilson C. 1991. New genetic evidence for the spread of agriculture in
Europe by demic diffusion. Nature 351:143-145.
Sun C, Kong Q-P, Palanichamy MG, Agrawal S, Bandelt H-J, Yao Y-G, Khan F, Zhu C-L,
Chaudhuri TK, Zhang Y-P. 2006. The dazzling array of basal branches in the mtDNA
macrohaplogroup M from India as inferred from complete genomes. Mol. Biol. Evol.
23:683-690.
Tambets K, Kivisild T, Metspalu E, et al. (13 co-authors). 2000. The topology of the maternal
lineages of the Anatolian and Trans-Caucasus populations and the peopling of Europe:
some preliminary considerations. In: Renfrew C, Boyle K, editors. Archaeogenetics:
DNA and the Population Prehistory of Europe. Cambridge, Cambridge University
Press. p. 219-235.
Tambets K, Rootsi S, Kivisild T, et al. (46 co-authors). 2004. The western and eastern roots of
the Saami - the story of genetic "outliers" told by mitochondrial DNA and Y
chromosome. Am. J. Hum. Genet. 74:661-682.
Tarasov PE, Peyron O, Guiot J, Brewer S, Volkova VS, Bezusko LG, Dorofeyuk NI,
Kvavadze EV, Osipova IM, Panova NK. 1999. Last Glacial Maximum climate of the
33
former Soviet Union and Mongolia reconstructed from pollen and plant macrofossil
data. Climate Dyn. 15:227-240.
Tarasov PE, Volkova VS, Webb III T, et al. (13 co-authors). 2000. Last glacial maximum
biomes reconstructed from pollen and plant macrofossil data from northern Eurasia. J.
Biogeogr. 27:609-620.
Thangaraj K, Chaubey G, Kivisild T, Reddy AG, Singh VK, Rasalkar AA, Singh L. 2005.
Reconstructing the origin of Andaman islanders. Science 308:996.
Tolk H-V, Barac L, Pericic M, Klaric IM, Janicijevic B, Campbell H, Rudan I, Kivisild T,
Villems R, Rudan P. 2001. The evidence of mtDNA haplogroup F in a European
population and its ethnohistoric implication. Eur. J. Hum. Genet. 9:717-723.
Torroni A, Lott MT, Cabell MF, Chen YS, Lavergne L, Wallace DC. 1994. mtDNA and the
origin of Caucasians: identification of ancient Caucasian-specific haplogroups, one of
which is prone to a recurrent somatic duplication in the D-loop region. Am. J. Hum.
Genet. 55:760-776.
Torroni A, Bandelt H-J, D'Urbano L, et al. (11 co-authors). 1998. mtDNA analysis reveals a
major Late Paleolithic population expansion from southwestern to northeastern
Europe. Am. J. Hum. Genet. 62:1137-1152.
Torroni A, Bandelt H-J, Macaulay V, et al. (33 co-authors). 2001. A signal, from human
mtDNA, of postglacial recolonization in Europe. Am. J. Hum. Genet. 69:844-852.
Torroni A, Achilli A, Macaulay V, Richards M, Bandelt H-J. 2006. Harvesting the fruit of the
human mtDNA tree. Trends Genet 22:339-345.
Tzedakis PC, Lawson IT, Frogley MR, Hewitt GM, Preece RC. 2002. Buffered tree
population changes in a Quaternary refugium: evolutionary implications. Science
297:2044-2047.
34
Vaks A, Bar-Matthews M, Ayalon A, Schilman B, Gilmour M., Hawkesworth CJ, Frumkin,
A, Kaufman A, Matthews A. 2003. Paleoclimate reconstruction based on the timing of
speleothem growth and oxygen and carbon isotope composition in a cave located in
the rain shadow in Israel. Quaternary Res. 59:182-193.
Yokoyama Y, Lambeck K, De Deckker P, Johnston P, Fifield L. 2000. Timing of the Last
Glacial Maximum from observed sea-level minima. Nature 406:713-716.
35
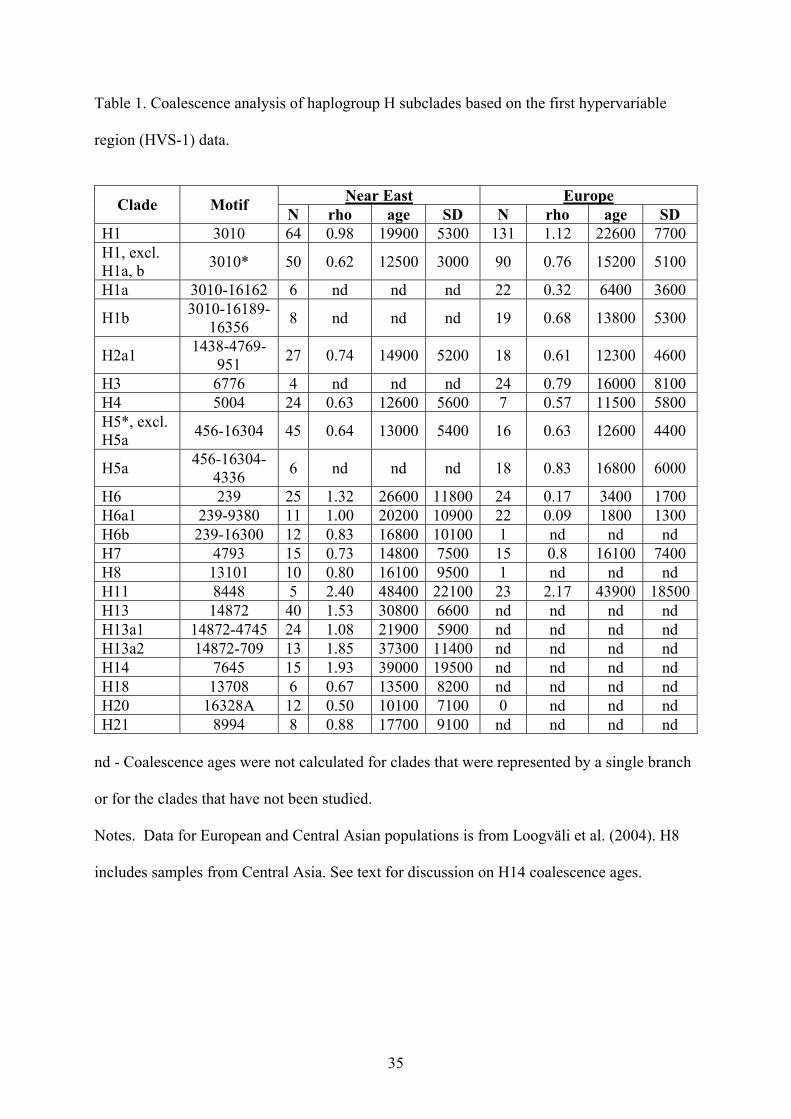
Table 1. Coalescence analysis of haplogroup H subclades based on the first hypervariable
region (HVS-1) data.
Near East Europe Clade Motif N rho age SD N rho age SD H1 3010 64 0.98 19900 5300 131 1.12 22600 7700 H1, excl. H1a, b 3010* 50 0.62 12500 3000 90 0.76 15200 5100
H1a 3010-16162 6 nd nd nd 22 0.32 6400 3600
H1b 3010-16189-16356 8 nd nd nd 19 0.68 13800 5300
H2a1 1438-4769-951 27 0.74 14900 5200 18 0.61 12300 4600
H3 6776 4 nd nd nd 24 0.79 16000 8100 H4 5004 24 0.63 12600 5600 7 0.57 11500 5800 H5*, excl. H5a 456-16304 45 0.64 13000 5400 16 0.63 12600 4400
H5a 456-16304-4336 6 nd nd nd 18 0.83 16800 6000
H6 239 25 1.32 26600 11800 24 0.17 3400 1700 H6a1 239-9380 11 1.00 20200 10900 22 0.09 1800 1300 H6b 239-16300 12 0.83 16800 10100 1 nd nd nd H7 4793 15 0.73 14800 7500 15 0.8 16100 7400 H8 13101 10 0.80 16100 9500 1 nd nd nd H11 8448 5 2.40 48400 22100 23 2.17 43900 18500H13 14872 40 1.53 30800 6600 nd nd nd nd H13a1 14872-4745 24 1.08 21900 5900 nd nd nd nd H13a2 14872-709 13 1.85 37300 11400 nd nd nd nd H14 7645 15 1.93 39000 19500 nd nd nd nd H18 13708 6 0.67 13500 8200 nd nd nd nd H20 16328A 12 0.50 10100 7100 0 nd nd nd H21 8994 8 0.88 17700 9100 nd nd nd nd
nd - Coalescence ages were not calculated for clades that were represented by a single branch
or for the clades that have not been studied.
Notes. Data for European and Central Asian populations is from Loogväli et al. (2004). H8
includes samples from Central Asia. See text for discussion on H14 coalescence ages.
36
Figure Legends
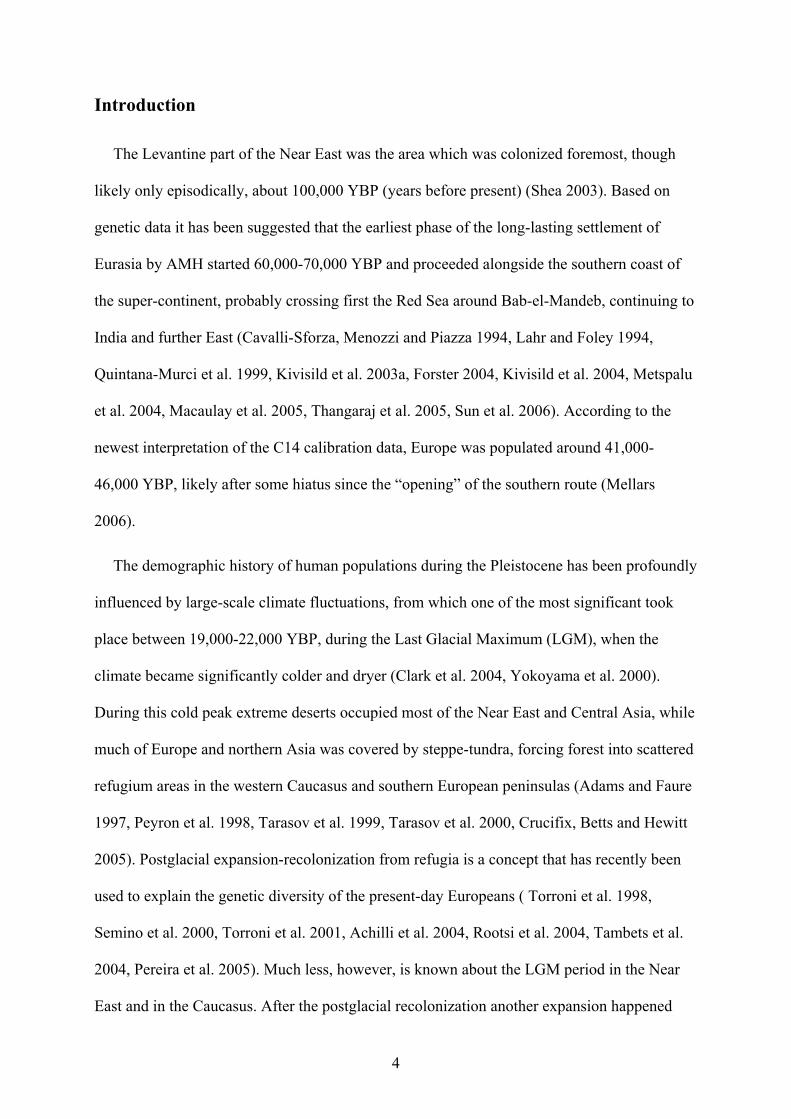
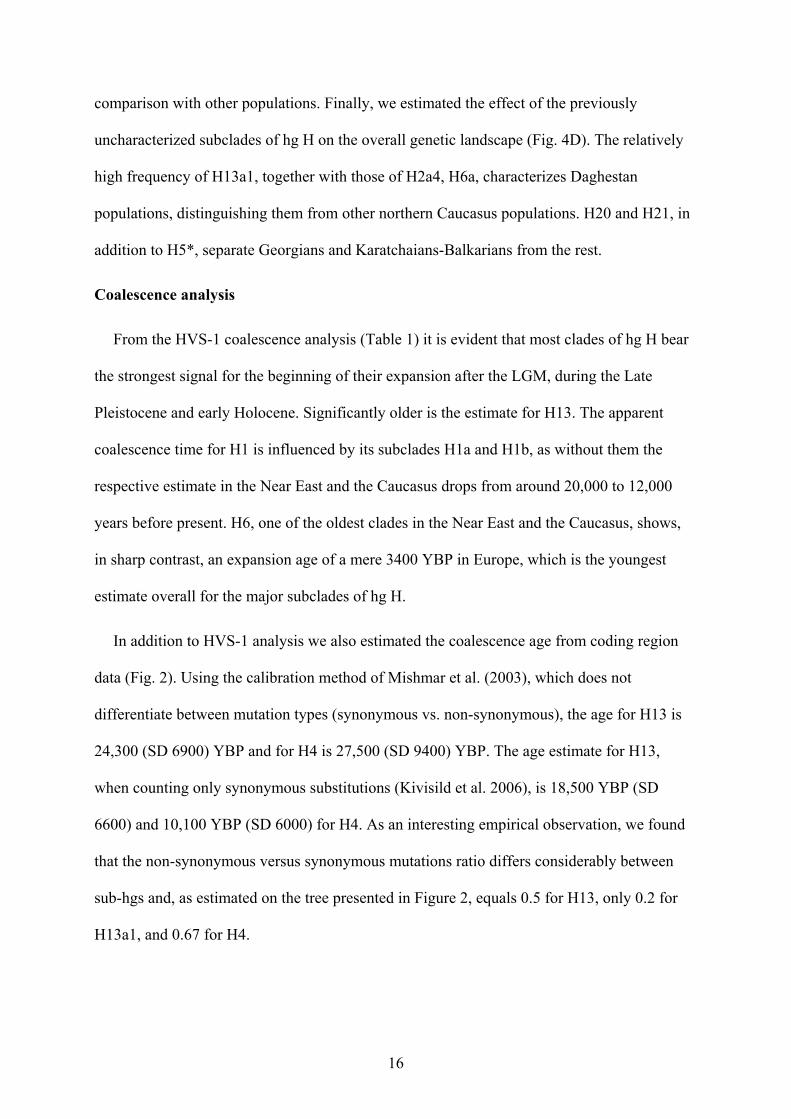
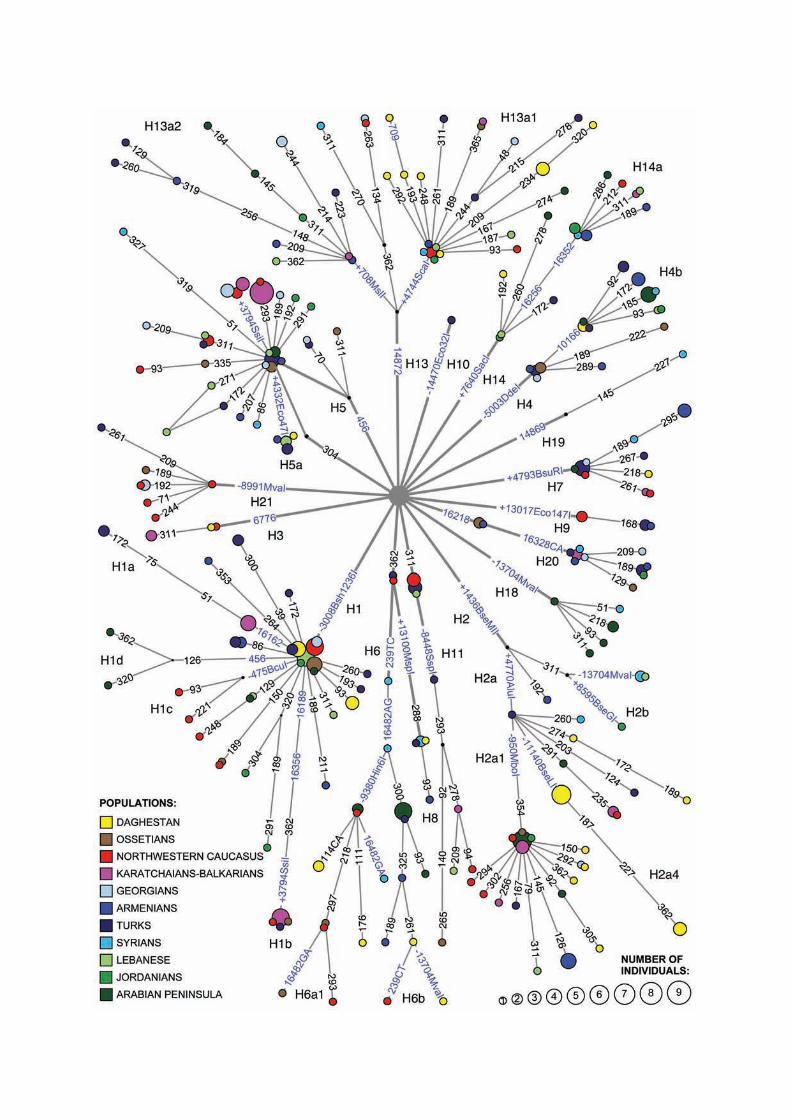
Figure 1. Phylogenetic network of haplogroup H subhaplogroups in the Near East and the Caucasus.
Circle areas are proportional to haplotype frequencies. Blue text indicates polymorphisms, which were
used to define subclades. Names of restrictases are indicated for RFLP positions (“+” designates gain
of restriction site and “–” the loss of site). HVS-1 positions (-16,000) are shown with black numbers.
All mutations are transitions unless otherwise indicated.
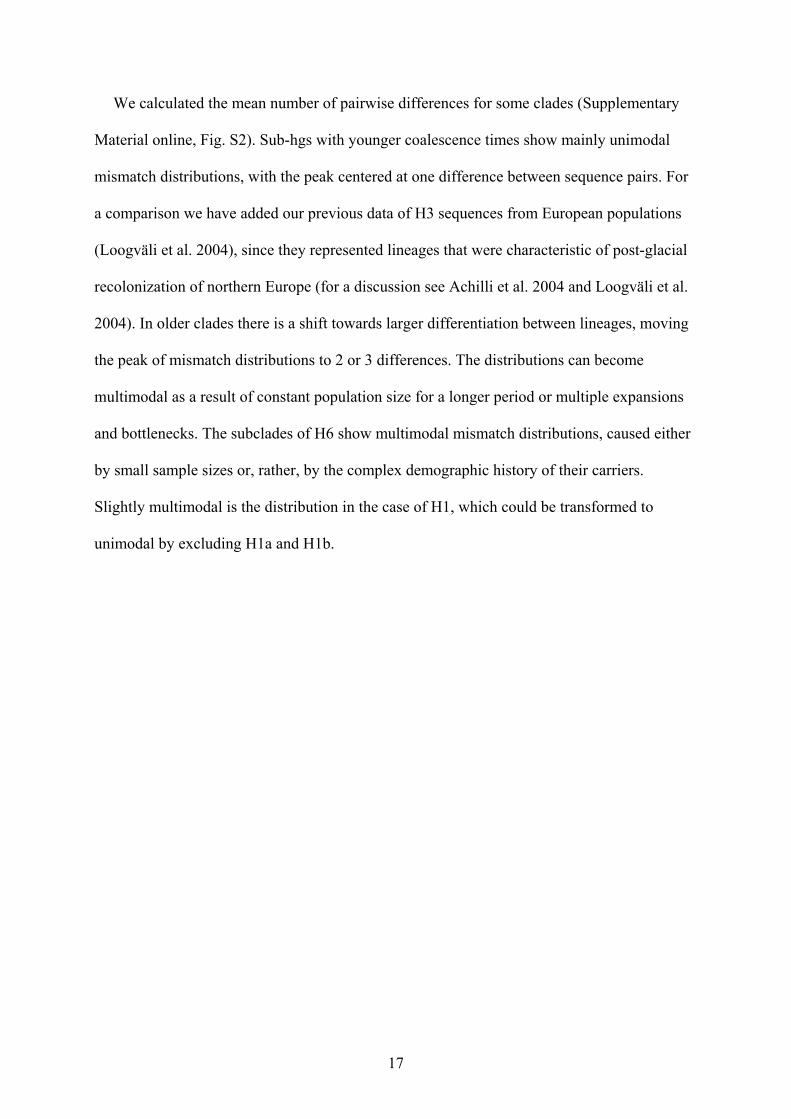
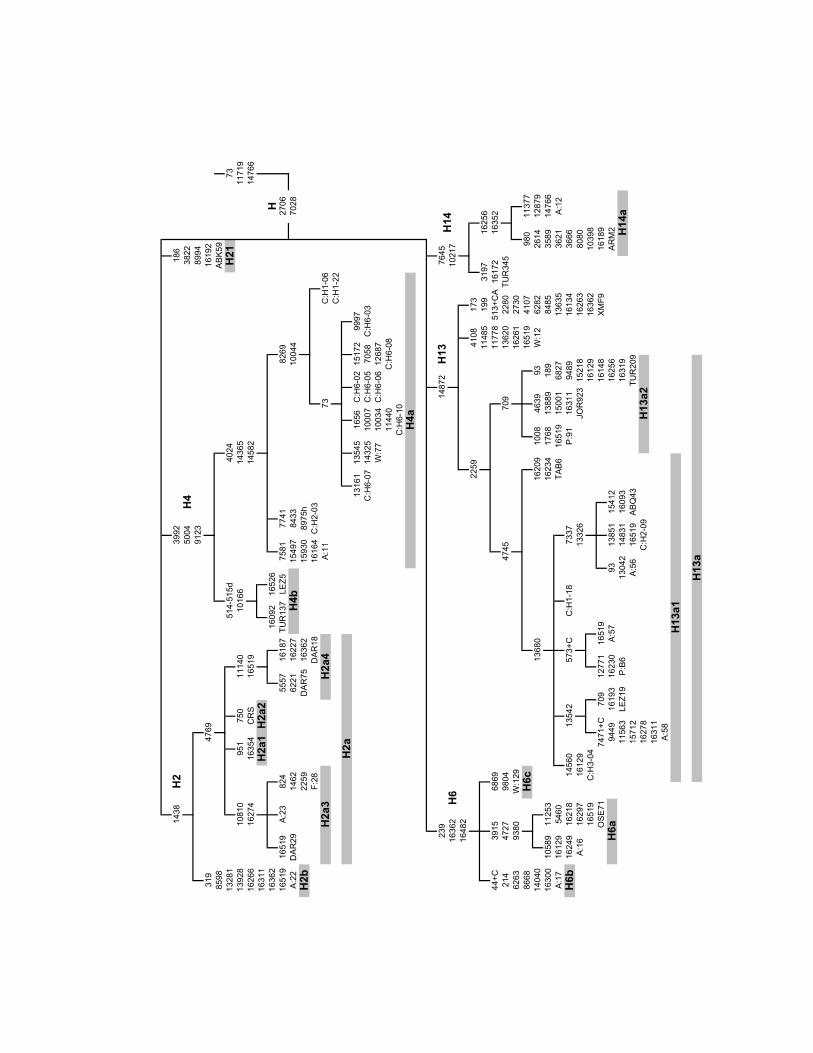
Figure 2. A fraction of haplogroup H phylogeny as inferred from 43 complete genomes. Samples
from the current study (ABQ-Abazin, ABK- Abkhazian, ARM- Armenian, DAR- Dargin, JOR-
Jordanian, LEZ- Lezgin, OSE- North-Ossetian, TAB- Tabasaran, TUR- Turk, XMF- Mingrelian) or
from literature (Achilli et al. (2004) designated by A: and the original sample number, Finnilä et al.
(2001) by F:, Coble at al. (2004) by C:, Palanichamy et al. (2004) by P: and from Howell et al. (2003)
by W:). CRS in H2a2 marks the Cambridge Reference Sequence (Andreson et al. 1981; Andrews et al.
1999). Substitution at np 152, variation of the number of Cs at np 309 and insertion at nps 522-523
were left out due to very fast mutation rates at these sites (from our sequenced samples DAR 29, LEZ
5, TAB 6, TUR 137, TUR 345 have transition at np 152; DAR 75, LEZ 5, LEZ 19, OSE 71, TUR 345
have a single C insertion at np 309; ABQ 43, DAR 16 and TAB 6 have two Cs inserted at np 309).
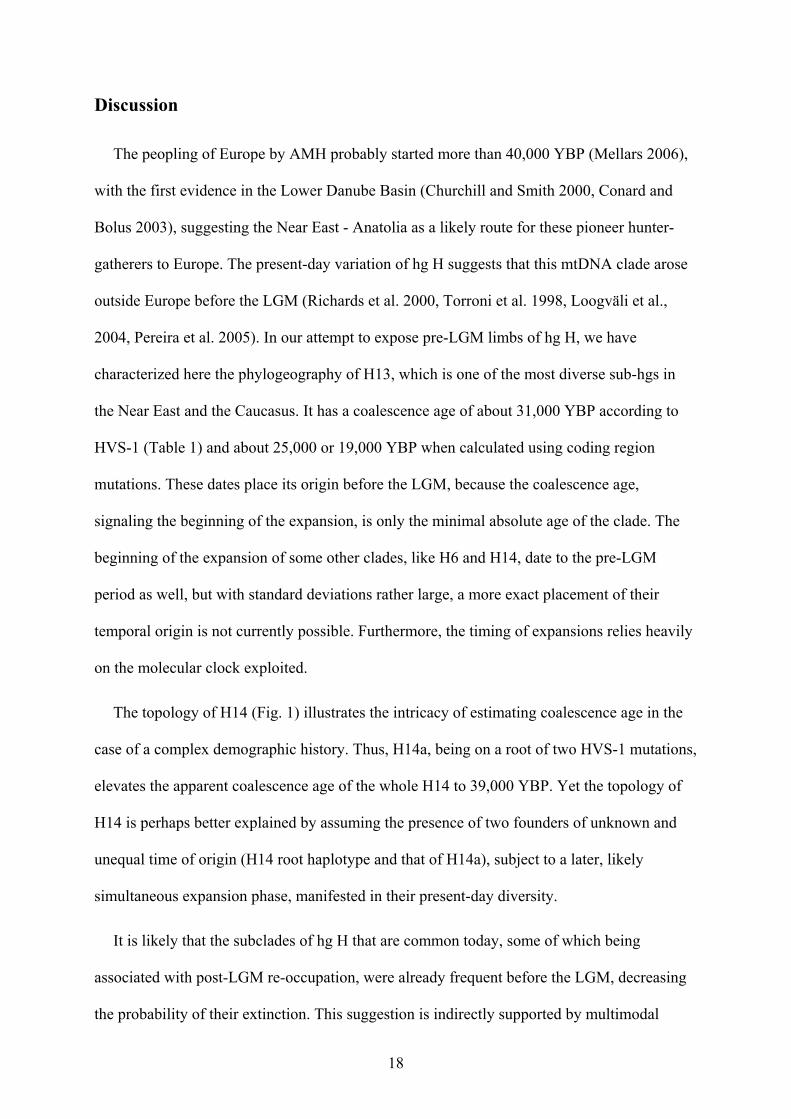
Figure 3. Frequency of haplogroup H and its subclades (Table S1). Subclades H13, H14, H18, H21
were not studied in French, Eastern Slavs and Central Asia, which data was taken from Loogväli et al.
(2004).
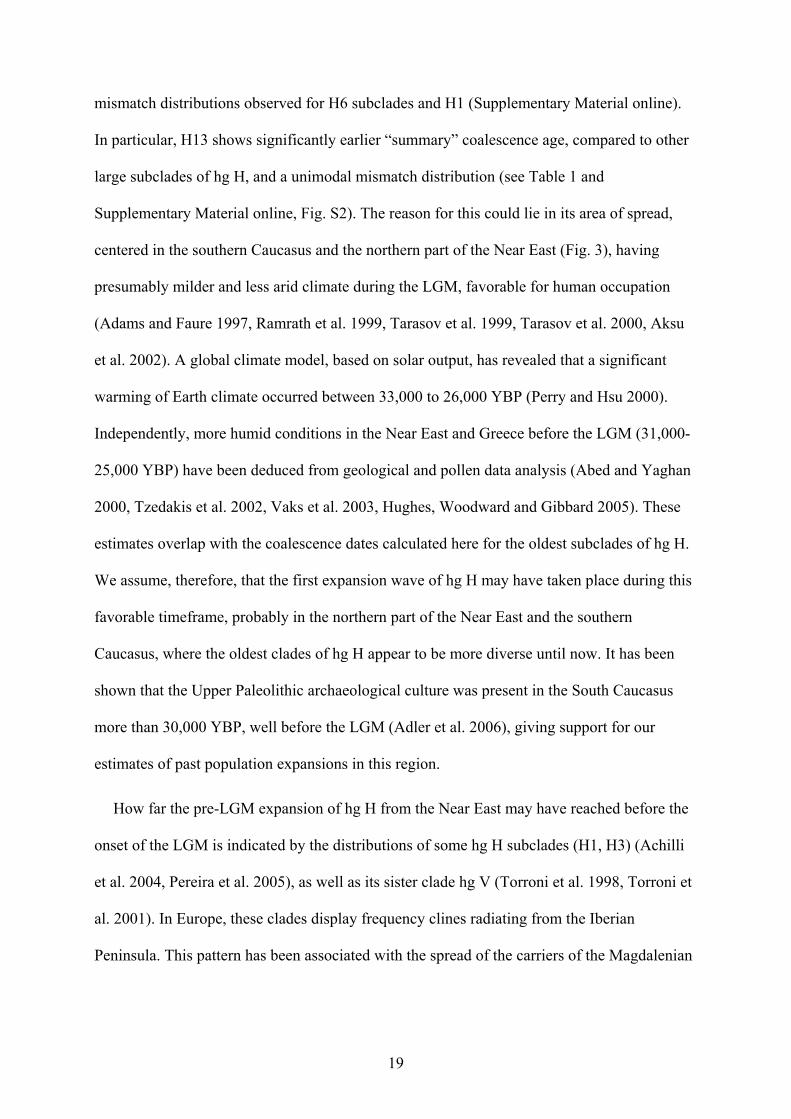
Figure 4. Principal component analysis. A- haplogroup H subclades (H1*, H1a, H1b, H2a1, H3, H4,
H5*, H5a, H6a1, H6b, H7, H8, H11) in respect to H, B- all mtDNA haplogroups (preHV, HV, preV-
V, J, T, K, U*, U1, U2, U3, U4, U5, U6, U7, I, X, W, Asian clades, L and H subclades from figure A),
C- mtDNA haplogroups determining population locations in figure B, D- all haplogroup H subclades
determined in the current study (includes additionally H2a4, H13*, H13a1, H13a2, H14, H18, H20,
H21). European populations are marked by open squares, the Caucasus populations by black triangles,
other populations by black squares and clades by crosses. Populations are coded as follows: A-

37
Armenians, B- Arabian pn., C- Balkan pn., D- Daghestan, E- Estonians, F- French, G- Georgians, H-
Slovaks, I-Altaians, J- Jordanians, L- Lebanese, N- Northwestern Caucasus, O- Ossetians, R- Eastern
Slavs, S- Syrians, T- Turks, V- Volga-Uralic Finno-Ugrians, W- Western Europe, Z- Central Asia
(see text for data sources).
ABK59
H21186
3822
8994
16192
11719
73
2706
7028H
14766
16227
16519
16354H2a2
H2a1
16274
CRS
2259
DAR75
16362
16519
H2
16092
16526
TUR137
H6F:
28DAR18
A:23
239
16362
16482
DAR29
1462
6221
1438
5004
9123
10166
3992
4769
10810
11140
951
750
7741
8269
15497
8433
10044
LEZ5
7581
H2b
H2a3
15930
16519
A:11
16187
5557
824
8975h
16164
A:22
319
8598
13281
13928
16266
16311
16362
C:H1-06
C:H1-22
73
13161
13545
C:H6-03
C:H6-05
7058
10007
9997
C:H6-02
15172
1656
13620
199
C:H6-07
14325
W:77
C:H6-06
12687
10034
16256
16172
16352
980
11377
TUR345
3197
2614
12879
3589
14766
3621
A:12
3666
8080
10398
16189
H4
ARM2
11778513+CA
2259
4108
709
44+C
3915
6869
214
4727
9804
6263
9380
W:129
8668
H6c
H6b
14040
16300
10589
A:17
16129
5460
16249
16218
13680
11253
H13a
A:16
16297
16519
OSE71
H6a
H13a1
C:H3-04
JOR92316129
4745
463914
872
2280
16261
2730
16519
4107
173
11485
93W:12
6282
16234
1768
189
8485
16209
1008
TAB6
16519
13889
6827
13635
14560
13542
573+C
C:H1-18
7337
P:91
15001
9489
16134
16129
13326
16311
15218
16263
16362
7471+C
709
12771
16519
16148
XMF9
14831
15412
9449
16193
16230
A:57
9313851
13042
16256
16319
15712
A:56
16519
16093
TUR209
11563
LEZ19
P:B6
16278
C:H2-09
ABQ43
16311
H14
A:58
H2a4
H4b
H13a2
H14a
H13
H2a
C:H2-03
514-515d
H4a
7645
10217
4024
14365
14582
C:H6-08
11440
C:H6-10