Orica Limited
20
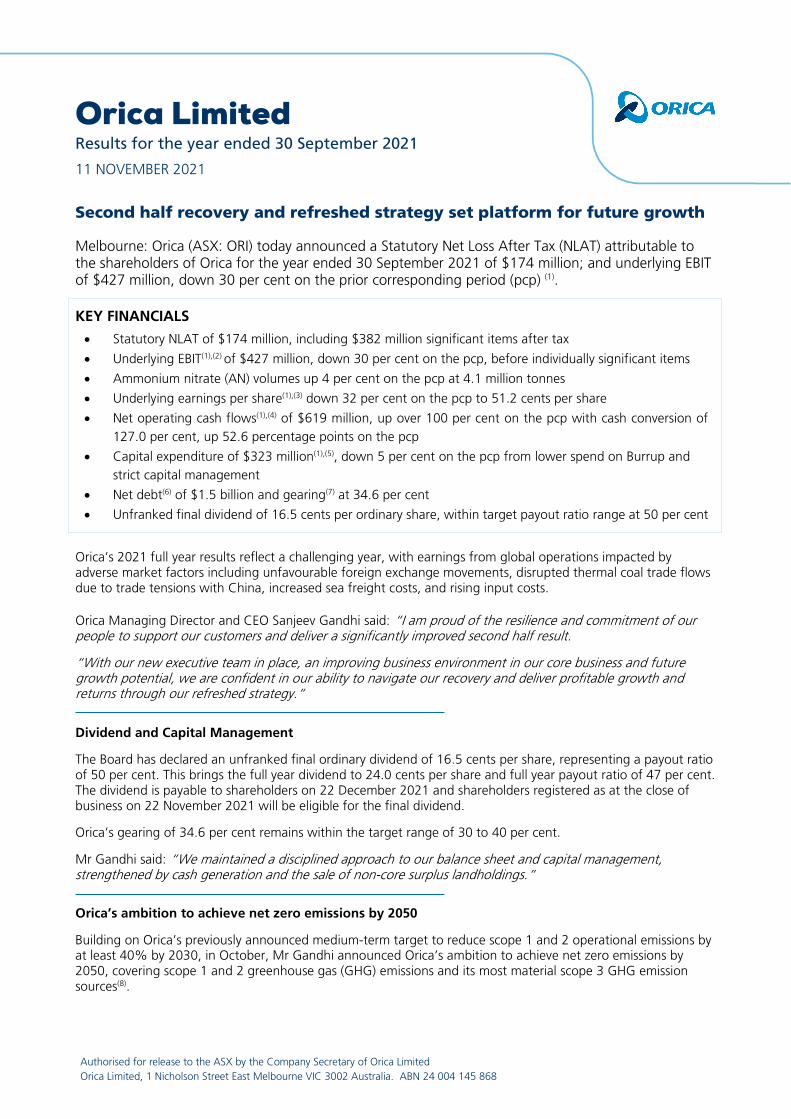
Authorised for release to the ASX by the Company Secretary of Orica Limited Orica Limited, 1 Nicholson Street East Melbourne VIC 3002 Australia. ABN 24 004 145 868 Orica Limited Results for the year ended 30 September 2021 11 NOVEMBER 2021 Second half recovery and refreshed strategy set platform for future growth Melbourne: Orica (ASX: ORI) today announced a Statutory Net Loss After Tax (NLAT) attributable to the shareholders of Orica for the year ended 30 September 2021 of $174 million; and underlying EBIT of $427 million, down 30 per cent on the prior corresponding period (pcp) (1) . KEY FINANCIALS • Statutory NLAT of $174 million, including $382 million significant items after tax • Underlying EBIT (1),(2) of $427 million, down 30 per cent on the pcp, before individually significant items • Ammonium nitrate (AN) volumes up 4 per cent on the pcp at 4.1 million tonnes • Underlying earnings per share (1),(3) down 32 per cent on the pcp to 51.2 cents per share • Net operating cash flows (1),(4) of $619 million, up over 100 per cent on the pcp with cash conversion of 127.0 per cent, up 52.6 percentage points on the pcp • Capital expenditure of $323 million (1),(5) , down 5 per cent on the pcp from lower spend on Burrup and strict capital management • Net debt (6) of $1.5 billion and gearing (7) at 34.6 per cent • Unfranked final dividend of 16.5 cents per ordinary share, within target payout ratio range at 50 per cent Orica’s 2021 full year results reflect a challenging year, with earnings from global operations impacted by adverse market factors including unfavourable foreign exchange movements, disrupted thermal coal trade flows due to trade tensions with China, increased sea freight costs, and rising input costs. Orica Managing Director and CEO Sanjeev Gandhi said: “I am proud of the resilience and commitment of our people to support our customers and deliver a significantly improved second half result. “With our new executive team in place, an improving business environment in our core business and future growth potential, we are confident in our ability to navigate our recovery and deliver profitable growth and returns through our refreshed strategy.” Dividend and Capital Management The Board has declared an unfranked final ordinary dividend of 16.5 cents per share, representing a payout ratio of 50 per cent. This brings the full year dividend to 24.0 cents per share and full year payout ratio of 47 per cent. The dividend is payable to shareholders on 22 December 2021 and shareholders registered as at the close of business on 22 November 2021 will be eligible for the final dividend. Orica’s gearing of 34.6 per cent remains within the target range of 30 to 40 per cent. Mr Gandhi said: “We maintained a disciplined approach to our balance sheet and capital management, strengthened by cash generation and the sale of non-core surplus landholdings.” Orica’s ambition to achieve net zero emissions by 2050 Building on Orica’s previously announced medium-term target to reduce scope 1 and 2 operational emissions by at least 40% by 2030, in October, Mr Gandhi announced Orica’s ambition to achieve net zero emissions by 2050, covering scope 1 and 2 greenhouse gas (GHG) emissions and its most material scope 3 GHG emission sources (8) .
Transcript of Orica Limited
Authorised for release to the ASX by the Company Secretary of Orica Limited Orica Limited, 1 Nicholson Street East Melbourne VIC 3002 Australia. ABN 24 004 145 868
Orica Limited Results for the year ended 30 September 2021 11 NOVEMBER 2021
Second half recovery and refreshed strategy set platform for future growth Melbourne: Orica (ASX: ORI) today announced a Statutory Net Loss After Tax (NLAT) attributable to the shareholders of Orica for the year ended 30 September 2021 of $174 million; and underlying EBIT of $427 million, down 30 per cent on the prior corresponding period (pcp) (1). KEY FINANCIALS
• Statutory NLAT of $174 million, including $382 million significant items after tax
• Underlying EBIT(1),(2) of $427 million, down 30 per cent on the pcp, before individually significant items
• Ammonium nitrate (AN) volumes up 4 per cent on the pcp at 4.1 million tonnes • Underlying earnings per share(1),(3) down 32 per cent on the pcp to 51.2 cents per share
• Net operating cash flows(1),(4) of $619 million, up over 100 per cent on the pcp with cash conversion of 127.0 per cent, up 52.6 percentage points on the pcp
• Capital expenditure of $323 million(1),(5), down 5 per cent on the pcp from lower spend on Burrup and strict capital management
• Net debt(6) of $1.5 billion and gearing(7) at 34.6 per cent • Unfranked final dividend of 16.5 cents per ordinary share, within target payout ratio range at 50 per cent
Orica’s 2021 full year results reflect a challenging year, with earnings from global operations impacted by adverse market factors including unfavourable foreign exchange movements, disrupted thermal coal trade flows due to trade tensions with China, increased sea freight costs, and rising input costs.
Orica Managing Director and CEO Sanjeev Gandhi said: “I am proud of the resilience and commitment of our people to support our customers and deliver a significantly improved second half result.
“With our new executive team in place, an improving business environment in our core business and future growth potential, we are confident in our ability to navigate our recovery and deliver profitable growth and returns through our refreshed strategy.”
Dividend and Capital Management
The Board has declared an unfranked final ordinary dividend of 16.5 cents per share, representing a payout ratio of 50 per cent. This brings the full year dividend to 24.0 cents per share and full year payout ratio of 47 per cent. The dividend is payable to shareholders on 22 December 2021 and shareholders registered as at the close of business on 22 November 2021 will be eligible for the final dividend.
Orica’s gearing of 34.6 per cent remains within the target range of 30 to 40 per cent.
Mr Gandhi said: “We maintained a disciplined approach to our balance sheet and capital management, strengthened by cash generation and the sale of non-core surplus landholdings.”
Orica’s ambition to achieve net zero emissions by 2050
Building on Orica’s previously announced medium-term target to reduce scope 1 and 2 operational emissions by at least 40% by 2030, in October, Mr Gandhi announced Orica’s ambition to achieve net zero emissions by 2050, covering scope 1 and 2 greenhouse gas (GHG) emissions and its most material scope 3 GHG emission sources(8).
ORICA RESULTS FOR THE YEAR ENDED 30 SEPTEMBER 2021
ORICA LIMITED | 1 NICHOLSON STREET EAST MELBOURNE VIC 3002 AUSTRALIA | ABN 24 004 145 868 2
“We continued to deliver on our sustainability commitments, reducing scope 1 and 2 greenhouse gas emissions by 13 per cent on the 2019 baseline, and we remain on track to achieve our target of reducing scope 1 and 2 greenhouse gas emissions by at least 40 per cent by 2030.
“We’ve taken our 2030 medium-term target and extended our planning over the long term, developing a clear roadmap to support our ambition to achieve net zero emissions(8) by 2050. It shows our commitment to playing a part in achieving the goals of the Paris Agreement(9) and is a strong signal that the decarbonisation of Orica will, and must, continue beyond 2030. This will require a collaborative approach across all of our stakeholders.”
Refreshed strategy
Orica’s refreshed strategy has been rolled out, to deliver solutions and technology that drive productivity for its mining and infrastructure customers across the globe. The strategy is centred on optimising operations, delivering smarter solutions, and partnering for progress across the core business, and focusing on four key business verticals – mining, quarry and construction, digital and mining chemicals.
Mr Gandhi said: “The fundamentals of the business are strong. We have refreshed our strategy to refocus on driving profitable growth and creating enduring value for our shareholders and other stakeholders. As our strategy is embedded in our business, we will be well placed to seize opportunities as the market stabilises.
“Our four key business verticals will allow us to leverage our strengths and create opportunities for growth beyond blasting.
“Our customers share our appetite to leverage new technology in order to improve safety, productivity and sustainability outcomes which will play a pivotal role as we look to build on our expanded offering in high-growth and future-facing commodities(10).
“Importantly, our refreshed strategy does not rely on significant additional organic capital investment. As we execute on our key priorities, we expect to see our return on net assets improve.”
Outlook
Subject to market conditions, the strong momentum from the second half of the current financial year is expected to continue into the 2022 financial year.
Commenting on the 2022 outlook, Mr Gandhi said: “We expect steady commodity growth in 2022 which will drive stabilised demand for explosives-related products and services, particularly in copper, gold and quarry and construction markets.
“Earnings in 2022 are expected to improve from increased adoption of our advanced technology offerings, volume growth, supply chain initiatives and sustainable overhead cost reductions. Meanwhile, our focus on pricing discipline will continue to play a key role in supporting the strategy rollout and mitigating the impacts of rising input costs.”
Capital expenditure in the 2022 financial year is expected to be between $340 million and $360 million. The depreciation and amortisation expense is expected to be up to 5 per cent higher than the pcp.
A focus on balance sheet and cash flow optimisation will be maintained, with gearing expected to remain within the target range of 30 to 40 per cent.
For further information
Investors Media Delphine Cassidy Andrew Valler Mobile: +61 419 163 467 Mobile: +61 437 829 211 ABOUT ORICA
Orica (ASX: ORI) is the world’s largest provider of commercial explosives and innovative blasting systems to the mining, quarrying, oil and gas and construction markets, a leading supplier of sodium cyanide for gold extraction, and a specialist provider of ground support services in mining and tunnelling.
For more information about Orica, visit: www.orica.com

ORICA RESULTS FOR THE YEAR ENDED 30 SEPTEMBER 2021
ORICA LIMITED | 1 NICHOLSON STREET EAST MELBOURNE VIC 3002 AUSTRALIA | ABN 24 004 145 868 3
REVIEW OF OPERATIONS
Safety
Safety remains the top priority at Orica.
The 2021 financial year was a fatality free year, while the serious injury case rate (SICR) increased by 0.03 on the pcp to 0.19 serious injuries per 200,000 hours worked. This was above the target of 0.14, however the average days lost per injury reduced by 25 per cent on the pcp. Focus has been directed towards injury prevention going forward.
The major hazards management (MHM) program empowers team members to immediately stop work if they observe a potentially hazardous situation. This has driven a three-fold increase in the number of MHM stops in the 2021 financial year.
Reporting, investigating and sharing information about high potential incidents (HPI) provides an opportunity to reduce the risk of fatalities and serious injuries. There was a 25 per cent increase in HPIs reported which has allowed proactive action to be taken to prevent incidents.
With ongoing uncertainty from the global pandemic, supporting team members’ mental health and wellbeing has been a particular focus during the year.
Sustainability and Environment
Orica’s commitment to embedding sustainability in critical business priorities and ways of working has been reinforced by both the commitment to reduce operational scope 1 and 2 greenhouse gas (GHG) emissions by at least 40 per cent on 2019 levels by 2030, and the recently announced ambition to achieve net zero scope 1, 2 and material scope 3 GHG emissions by 2050(8).
In 2021, scope 1 and 2 GHG emissions reduced 13 per cent on the 2019 baseline, in line with plan.
In October 2021, installation of tertiary abatement technology was completed at the Carseland plant in Canada to reduce nitrous oxide emissions. During the year, Orica also announced the Kooragang Island Decarbonisation Project in partnership with the New South Wales (NSW) Government and Clean Energy Finance Corporation in Australia, which seeks to reduce GHG emissions by implementing new low-emissions technology. In April 2021, Orica secured approval to generate Australian Carbon Credit Units (ACCUs) and was awarded an optional Carbon Abatement Contract for the purchase of 3.4 million ACCUs by the Australian Government. This approach helps to de-risk the project.
Excluding the Minova business, which is held for sale and therefore presented as a discontinued operation, thermal coal exposure has decreased from 20 per cent in the 2018 financial year to 17 per cent in the 2021 financial year, following the acquisition of Exsa and diversification across metals sectors such as gold and iron ore.
In 2021, a focus on spill prevention and response has led to a reduction in loss of containment instances, which has lowered the likelihood of Orica operations having harmful impacts on the environment.
Customer
Fulfilling customers' needs during the challenging year remained a top priority. This was enabled by the reliability of Orica’s global supply, together with a shared appetite for innovative solutions to maximise customer value and improve safety and sustainability outcomes. The quality of products and services provided to customers was uncompromised during the uncertain times. Product and service quality, and value through technology and innovation were notable areas of Orica’s outstanding performance as measured by the Net Promoter Score, which has continued to improve each year since 2017.

ORICA RESULTS FOR THE YEAR ENDED 30 SEPTEMBER 2021
ORICA LIMITED | 1 NICHOLSON STREET EAST MELBOURNE VIC 3002 AUSTRALIA | ABN 24 004 145 868 4
People
Diversity and inclusion are a part of Orica’s culture, with a global workforce spanning across 49 countries, representing over 90 nationalities and bringing together a wide range of backgrounds, experiences and skill sets. The diverse team is the backbone of Orica’s global operations, a key competitive advantage in often fragmented markets.
Gender diversity is also important to the Orica team. At 30 September 2021, women represented 28 per cent of senior management, with a targeted increase to 35 per cent by 2024.
Strategy
Over the last six months, Orica’s strategy has been refreshed, aimed at achieving its goal to sustainably deliver enduring value to shareholders and other stakeholders, delivering solutions and technology that drive productivity for customers across the globe. The strategy is underpinned by three value drivers:
1. Smarter solutions; 2. Optimised operations; and 3. Partnering for progress.
Smarter solutions
Orica’s scope and capabilities are being expanded across the value chain. Recent digital acquisitions provide both upstream and downstream solutions, with orebody intelligence from tools such as RHINO™ to ore processing from tools such as Integrated Extraction Simulator (IES). Orica can provide best-in-class products and offer a seamless workflow solution across the value chain. Rapid commercialisation of products and solutions is key to the technology strategy.
Optimised operations
Value will be realised through continuing overhead cost reduction, reduced manufacturing costs and supply chain efficiencies, as well as monetising non-core land assets. The intent to sell Minova has been announced and exits from jurisdictions which are not strategically aligned or could be better serviced through alternative channels have commenced.
Partnering for progress
The strategy is shaped to equip employees with the changing skills and competencies needed to deliver strong performance. Focus will be placed on deeper talent management and supporting the development of capabilities that drive Orica’s competitive advantage. Collaboration is key, and work will continue with stakeholders to drive growth and to solve shared challenges. Public-private partnerships will play a significant role in creating value. This year, a significant decarbonisation milestone was achieved through government partnerships in Australia.
This focus on working smarter, more efficiently and collaboratively with partners will allow for profitable organic growth without the need to increase capital expenditure from historical levels. The level of return on Orica’s asset base is expected to improve as a result.
The approach will focus on four business verticals:
1. Mining; 2. Quarry and construction; 3. Digital solutions; and 4. Mining chemicals.
These verticals will leverage Orica’s strengths and create opportunities for growth beyond blasting.
Mining
The largest business vertical, mining, will be centred on growth from future-facing commodities(10) as the world continues to transition to a low carbon economy, and accelerating the adoption of Orica’s premium blasting solutions. WebGenTM wireless detonators are an example of this, with increased sales volumes in the 2021 financial year on the pcp, led by increased demand in Canada and following the introduction to the market in Brazil and Peru. Joining forces with innovative partners and collaborating with foundation customers has allowed trials of new flagship technologies, such as the second-generation wireless detonator WebGenTM 200 and semi-automated explosives delivery system AvatelTM to commence.

ORICA RESULTS FOR THE YEAR ENDED 30 SEPTEMBER 2021
ORICA LIMITED | 1 NICHOLSON STREET EAST MELBOURNE VIC 3002 AUSTRALIA | ABN 24 004 145 868 5
Quarry and construction
The quarry and construction business will focus on maximising outcomes from both mature markets such as North America and Northern Europe, and from high-growth developing markets where Orica currently has low presence. Orica will continue to work closely with customers to provide differentiated value propositions and business models in order to effectively serve these different customer segments.
Digital solutions
As the adoption and expansion of Orica’s digital solutions increase, the digital business vertical will grow both upstream and downstream, by providing best-in-class products and integrated digital workflow solutions to unlock greater value for customers across all segments, supported by collaborative partnerships. The uptake of digital solutions has been consistently building momentum, including penetration in Asian markets and rollout to Exsa customers, while BlastIQTM adoption almost doubled on the pcp in North America in the 2021 financial year.
Mining chemicals
The mining chemicals business offering will allow Orica to expand an already leading global presence, building on a global supply chain and customer relationships, and unlocking further capacity to broaden and capture growing demand. Long term growth in the mining chemicals vertical is expected to be underpinned by effective partnerships.
Pathway towards profitable growth
Key strategic priorities in the next three years include to:
• Pursue organic growth from the core
• Accelerate adoption of innovative blasting technologies and digital solutions, both upstream and downstream
• Optimise manufacturing and supply chains
• Grow presence in future-facing commodities(10)
• Diversify portfolio by increasing presence in quarry and construction markets and seek opportunities in high growth economies
• Expand in high-growth mining chemicals segments, building on existing global supply chain and customer relationships to unlock further capacity to broaden and capture growing demand
The strategy will be supported by an ongoing commitment to safety and sustainability, pricing discipline and enhanced capabilities from the SAP system.
The success of these strategic priorities is expected to drive the following outcomes:
Safety targets
• Zero fatalities
• Serious Injury Case Rate: < 0.14
3- year targets
• Average 3-year Return on Net Assets: 10 to 12 per cent
• Gearing: 30 to 40 per cent
• Dividend Payout Ratio: 40 to 70 per cent
• Annual Capital Expenditure: $340 million to $360 million annually
Long term greenhouse gas emissions objectives
• Commitment to reduce scope 1 & 2 greenhouse gas emissions by ≥40 per cent by 2030
• Ambition to achieve net zero scope 1, 2 and material scope 3 emissions(8) by 2050
ORICA RESULTS FOR THE YEAR ENDED 30 SEPTEMBER 2021
ORICA LIMITED | 1 NICHOLSON STREET EAST MELBOURNE VIC 3002 AUSTRALIA | ABN 24 004 145 868 6
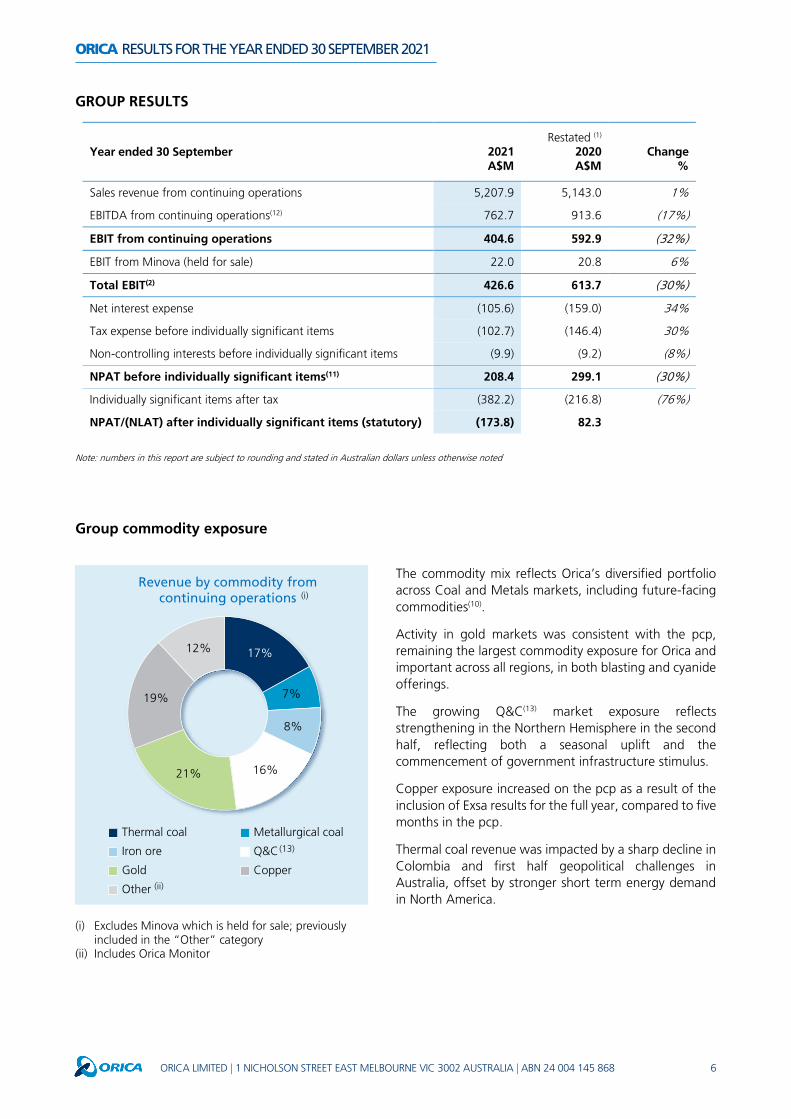
GROUP RESULTS
Year ended 30 September 2021 A$M
Restated (1) 2020 A$M
Change %
Sales revenue from continuing operations 5,207.9 5,143.0 1%
EBITDA from continuing operations(12) 762.7 913.6 (17%)
EBIT from continuing operations 404.6 592.9 (32%)
EBIT from Minova (held for sale) 22.0 20.8 6%
Total EBIT(2) 426.6 613.7 (30%)
Net interest expense (105.6) (159.0) 34%
Tax expense before individually significant items (102.7) (146.4) 30%
Non-controlling interests before individually significant items (9.9) (9.2) (8%)
NPAT before individually significant items(11) 208.4 299.1 (30%)
Individually significant items after tax (382.2) (216.8) (76%)
NPAT/(NLAT) after individually significant items (statutory) (173.8) 82.3
Note: numbers in this report are subject to rounding and stated in Australian dollars unless otherwise noted
Group commodity exposure
The commodity mix reflects Orica’s diversified portfolio across Coal and Metals markets, including future-facing commodities(10).
Activity in gold markets was consistent with the pcp, remaining the largest commodity exposure for Orica and important across all regions, in both blasting and cyanide offerings.
The growing Q&C(13) market exposure reflects strengthening in the Northern Hemisphere in the second half, reflecting both a seasonal uplift and the commencement of government infrastructure stimulus.
Copper exposure increased on the pcp as a result of the inclusion of Exsa results for the full year, compared to five months in the pcp.
Thermal coal revenue was impacted by a sharp decline in Colombia and first half geopolitical challenges in Australia, offset by stronger short term energy demand in North America.
(i) Excludes Minova which is held for sale; previously included in the “Other” category
(ii) Includes Orica Monitor
17%
7%
8%
16%21%
19%
12%
Revenue by commodity from continuing operations
Thermal coal Metallurgical coal
Iron ore Q&C
Gold Copper
Other
(i)
(ii)
(13)

ORICA RESULTS FOR THE YEAR ENDED 30 SEPTEMBER 2021
ORICA LIMITED | 1 NICHOLSON STREET EAST MELBOURNE VIC 3002 AUSTRALIA | ABN 24 004 145 868 7
FY20 to FY21 EBIT (A$M)
Financial performance
The 2021 full year result reflects significant challenges from adverse market factors compared to the pcp, including ongoing uncertainty from the global COVID-19 pandemic.
Political and economic instability continued to drive volatility in Mexico and Latin America, while geopolitical tensions with China impacted thermal coal exports from the East Coast of Australia in the first half.
Foreign exchange
In 2021 the Australian dollar strengthened against most major currencies. This has resulted in lower EBIT on translation of foreign denominated earnings into Australian dollars.
SAP
Incremental operating costs related to the SAP system were incurred in line with expectations.
Volume
Total ammonium nitrate (AN) volumes increased 4 per cent on the pcp, driven by the inclusion of a full year of Exsa sales. Despite this, the net volume impact was unfavourable on the pcp given the reduction of high margin Australian East Coast volumes from disrupted thermal coal trade flows, and from lower sales volumes in Colombia and Chile.
Total initiating system volumes were in line with the pcp, with an increase in premium electronic blasting systems (EBS) offset by a reduction in conventional detonators.
Cyanide volumes were 6 per cent down on the pcp, from lower customer demand and shipping constraints.
Manufacturing
Reduced volumes adversely impacted manufacturing fixed cost recoveries, particularly at the large continuous plants. Following an incident in the first half at the La Portada manufacturing plant increased insurance and sourcing costs were incurred.
Mix & margin
In the pcp North America benefited from carbon credits that have not repeated in the 2021 financial year. A competitive environment in Latin America has resulted in lower contract pricing to customers, while customers’ cost constraints have also led to temporary negative mix impacts, particularly in Peru and across Africa.
Higher sea freight costs impacted earnings in Latin America and Europe, Middle East & Africa (EMEA) where AN product is sourced offshore.
Rise & fall lag
Increases in ammonia input costs, in particular in the second half of the year, had a temporary adverse impact on EBIT in Australia and Asia. While most of these costs are ultimately passed through in sales prices, there is a time delay between rising input cost and the recovery thereof.
Adjacent businesses (Orica Monitor and Minova)
The Orica Monitor result was stronger than the pcp from increased radar sales and leases, higher services revenue and lower overhead costs at Nitro Consult following a successful restructuring.
The result from Minova, which is held for sale, was slightly higher than the pcp, from higher customer demand and the commencement of new construction projects.
614
42712
Mix & margin
Adjacentbusinesses
(22)
ManufacturingForeignexchange
EBITFY20
Restated
Rise &fall lag
SAP Volume Other
(27)
EBITFY21
(5)
(42)(32)
(31)
(40)
(1)

ORICA RESULTS FOR THE YEAR ENDED 30 SEPTEMBER 2021
ORICA LIMITED | 1 NICHOLSON STREET EAST MELBOURNE VIC 3002 AUSTRALIA | ABN 24 004 145 868 8
Stabilising the core
Several key milestones were achieved during the 2021 financial year, progressing the business towards a stabilised core as market conditions improve, and positioning Orica to execute on its refreshed strategy to deliver a recovery from the core and drive future growth.
The following were achieved in line with plan:
• Successful integration of Exsa business; • Burrup plant fully operational and producing consistent quality product; • Continuing uptake of technology solutions; • Stock keeping unit (SKU) reduction and initial initiating system plant closures; and • Global restructuring program, driving sustainable cost reduction.
Sales of non-core land generated cash proceeds of $140 million.
Business Summary
A summary of the performance of the segments for the 2021 and 2020 financial years is presented below:
Year ended 30 September A$M
2021 2020
External sales
revenue
EBITDA (12)
EBIT (2)
External sales
revenue
EBITDA (1), (12)
EBIT (1), (2)
Australia Pacific & Asia (APA) 2,105.9 453.9 279.7 2,050.6 522.0 373.4
North America 1,229.6 168.9 107.9 1,260.0 235.7 165.3
Latin America 956.5 73.3 28.9 855.6 72.4 38.4
Europe, Middle East & Africa (EMEA) 801.4 56.1 25.0 882.8 96.3 64.2
Orica Monitor 114.5 43.6 30.7 94.0 33.1 20.3
Global Support - (33.1) (67.6) - (45.9) (68.7)
Continuing Operations 5,207.9 762.7 404.6 5,143.0 913.6 592.9
Minova (held for sale) 474.3 33.7 22.0 468.3 32.2 20.8
Total 5,682.2 796.4 426.6 5,611.3 945.8 613.7
ORICA RESULTS FOR THE YEAR ENDED 30 SEPTEMBER 2021
ORICA LIMITED | 1 NICHOLSON STREET EAST MELBOURNE VIC 3002 AUSTRALIA | ABN 24 004 145 868 9
33%
13%13%
7%
15%
12%7%
External revenue by commodity
Thermal coal Metallurgical coalIron ore Q&CGold CopperOther
(13)
Australia Pacific & Asia
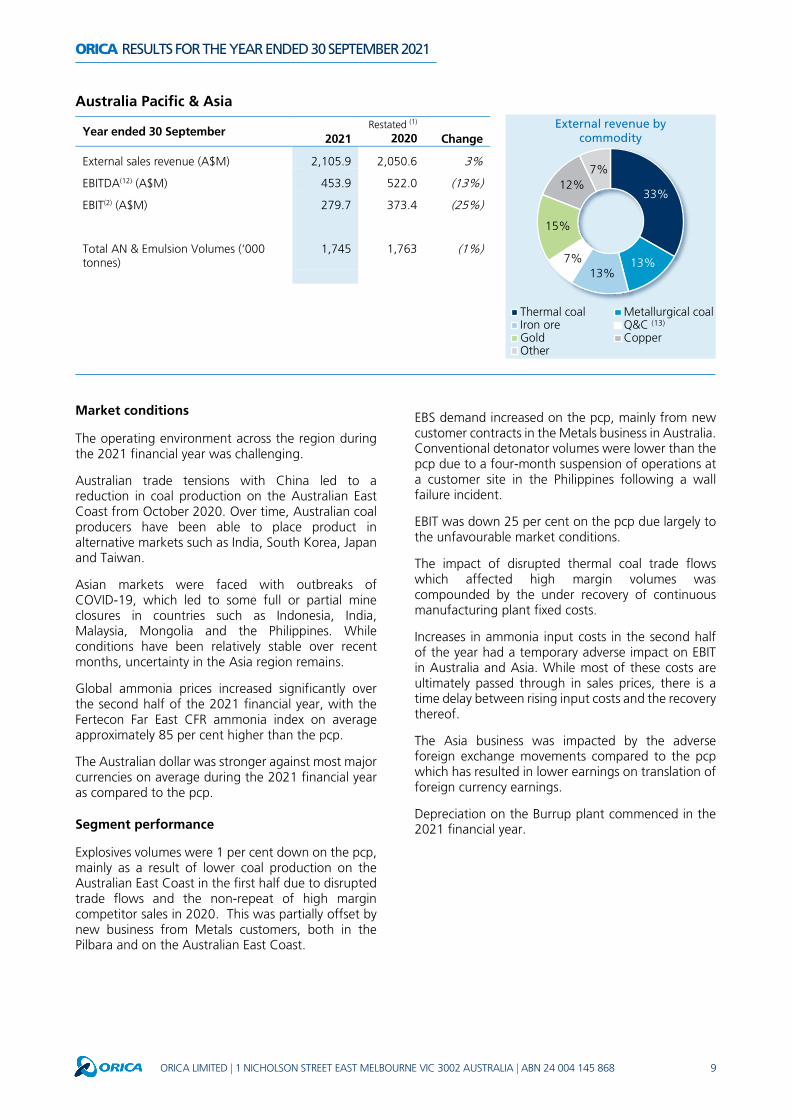
Market conditions
The operating environment across the region during the 2021 financial year was challenging.
Australian trade tensions with China led to a reduction in coal production on the Australian East Coast from October 2020. Over time, Australian coal producers have been able to place product in alternative markets such as India, South Korea, Japan and Taiwan.
Asian markets were faced with outbreaks of COVID-19, which led to some full or partial mine closures in countries such as Indonesia, India, Malaysia, Mongolia and the Philippines. While conditions have been relatively stable over recent months, uncertainty in the Asia region remains.
Global ammonia prices increased significantly over the second half of the 2021 financial year, with the Fertecon Far East CFR ammonia index on average approximately 85 per cent higher than the pcp.
The Australian dollar was stronger against most major currencies on average during the 2021 financial year as compared to the pcp.
Segment performance
Explosives volumes were 1 per cent down on the pcp, mainly as a result of lower coal production on the Australian East Coast in the first half due to disrupted trade flows and the non-repeat of high margin competitor sales in 2020. This was partially offset by new business from Metals customers, both in the Pilbara and on the Australian East Coast.
EBS demand increased on the pcp, mainly from new customer contracts in the Metals business in Australia. Conventional detonator volumes were lower than the pcp due to a four-month suspension of operations at a customer site in the Philippines following a wall failure incident.
EBIT was down 25 per cent on the pcp due largely to the unfavourable market conditions.
The impact of disrupted thermal coal trade flows which affected high margin volumes was compounded by the under recovery of continuous manufacturing plant fixed costs.
Increases in ammonia input costs in the second half of the year had a temporary adverse impact on EBIT in Australia and Asia. While most of these costs are ultimately passed through in sales prices, there is a time delay between rising input costs and the recovery thereof.
The Asia business was impacted by the adverse foreign exchange movements compared to the pcp which has resulted in lower earnings on translation of foreign currency earnings.
Depreciation on the Burrup plant commenced in the 2021 financial year.
Year ended 30 September 2021
Restated (1) 2020 Change
External sales revenue (A$M) 2,105.9 2,050.6 3%
EBITDA(12) (A$M) 453.9 522.0 (13%)
EBIT(2) (A$M) 279.7 373.4 (25%)
Total AN & Emulsion Volumes (‘000 tonnes)
1,745 1,763 (1%)

ORICA RESULTS FOR THE YEAR ENDED 30 SEPTEMBER 2021
ORICA LIMITED | 1 NICHOLSON STREET EAST MELBOURNE VIC 3002 AUSTRALIA | ABN 24 004 145 868 10
North America
Year ended 30 September 2021
Restated (1) 2020 Change
External sales revenue (A$M) 1,229.6 1,260.0 (2%)
EBITDA(12) (A$M) 168.9 235.7 (28%)
EBIT(2) (A$M) 107.9 165.3 (35%)
Total AN & Emulsion Volumes (‘000 tonnes)
1,013 1,023 (1%)
Market conditions
Operating conditions in North America were varied across the region during the 2021 financial year.
Socio-political and economic challenges continue to constrain the market in Mexico where mining activity has not yet recovered to historical levels.
An increase in power consumption in the USA and high gas prices have seen a short-term uplift in thermal coal demand in the second half.
Despite the re-opening of mines and a slow build in infrastructure activity, ongoing labour shortages in the USA and Canada are hampering the region’s recovery from the worst of the COVID-19 pandemic.
In the 2021 financial year, the Australian dollar was stronger against most major currencies, including the US dollar, Canadian dollar and Mexican peso as compared to the pcp.
Segment performance
The 35 per cent EBIT decline on the pcp, was largely driven by the non-repeat of carbon credits in 2020 and adverse foreign exchange impacts.
Explosives volumes were 1 per cent down on the pcp. Volumes in the USA were lower due to a decline in coal production in the Powder River basin in the first half, partially offset by higher volumes in Canada as a result of reduced mining activity in the pcp.
Both EBS and conventional detonator volumes increased as a result of greater demand from joint venture partners in the USA, and from a step up in gold production and reopening of mines in Canada.
Initiating system sourcing costs were elevated in the first half, with some product being temporarily sourced from third parties following an incident at the La Portada manufacturing plant. The planned turnaround at Carseland, which commenced in the last quarter of the financial year, resulted in some AN being sourced from third parties.
This turnaround at the Carseland plant was successfully completed in October 2021 and included the installation of tertiary abatement technology to reduce nitrous oxide emissions.
11%4%
9%
28%30%
9%9%
External revenue by commodity
Thermal coal Metallurgical coalIron ore Q&CGold CopperOther
(13)
ORICA RESULTS FOR THE YEAR ENDED 30 SEPTEMBER 2021
ORICA LIMITED | 1 NICHOLSON STREET EAST MELBOURNE VIC 3002 AUSTRALIA | ABN 24 004 145 868 11
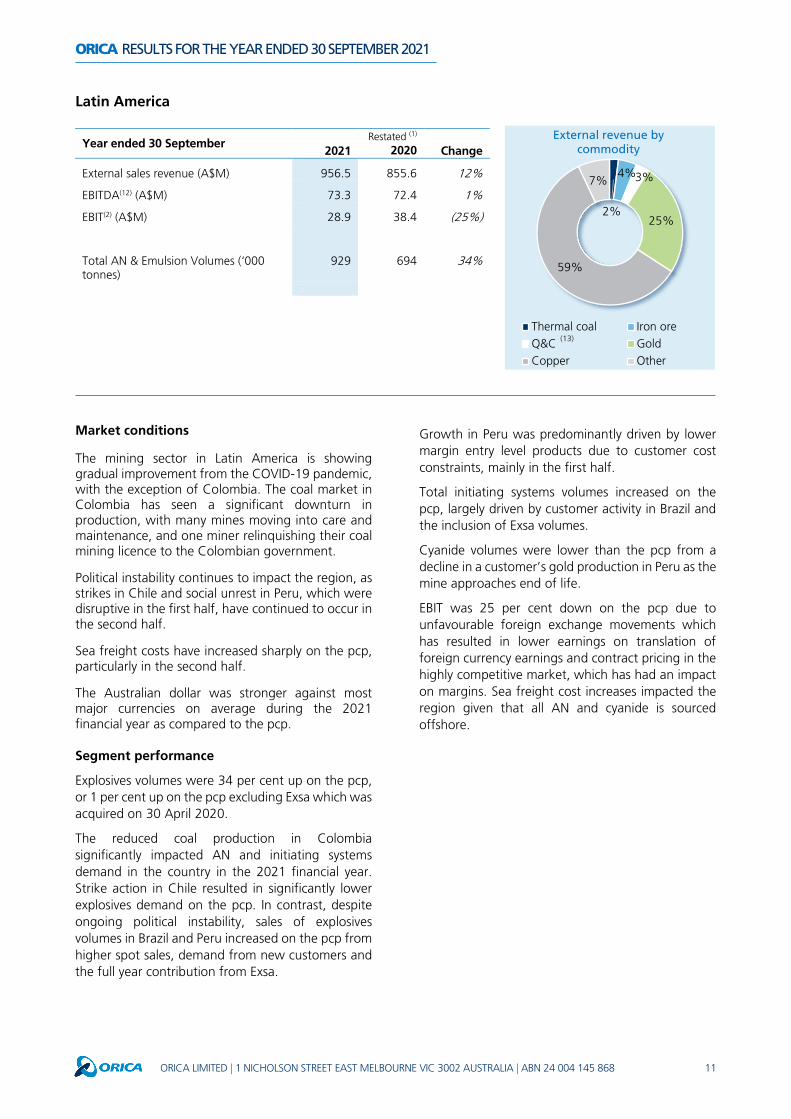
Latin America
Year ended 30 September 2021
Restated (1) 2020 Change
External sales revenue (A$M) 956.5 855.6 12%
EBITDA(12) (A$M) 73.3 72.4 1%
EBIT(2) (A$M) 28.9 38.4 (25%)
Total AN & Emulsion Volumes (‘000 tonnes)
929 694 34%
Market conditions
The mining sector in Latin America is showing gradual improvement from the COVID-19 pandemic, with the exception of Colombia. The coal market in Colombia has seen a significant downturn in production, with many mines moving into care and maintenance, and one miner relinquishing their coal mining licence to the Colombian government.
Political instability continues to impact the region, as strikes in Chile and social unrest in Peru, which were disruptive in the first half, have continued to occur in the second half.
Sea freight costs have increased sharply on the pcp, particularly in the second half.
The Australian dollar was stronger against most major currencies on average during the 2021 financial year as compared to the pcp.
Segment performance
Explosives volumes were 34 per cent up on the pcp, or 1 per cent up on the pcp excluding Exsa which was acquired on 30 April 2020.
The reduced coal production in Colombia significantly impacted AN and initiating systems demand in the country in the 2021 financial year. Strike action in Chile resulted in significantly lower explosives demand on the pcp. In contrast, despite ongoing political instability, sales of explosives volumes in Brazil and Peru increased on the pcp from higher spot sales, demand from new customers and the full year contribution from Exsa.
Growth in Peru was predominantly driven by lower margin entry level products due to customer cost constraints, mainly in the first half.
Total initiating systems volumes increased on the pcp, largely driven by customer activity in Brazil and the inclusion of Exsa volumes.
Cyanide volumes were lower than the pcp from a decline in a customer’s gold production in Peru as the mine approaches end of life.
EBIT was 25 per cent down on the pcp due to unfavourable foreign exchange movements which has resulted in lower earnings on translation of foreign currency earnings and contract pricing in the highly competitive market, which has had an impact on margins. Sea freight cost increases impacted the region given that all AN and cyanide is sourced offshore.
2%
4%3%
25%
59%
7%
External revenue by commodity
Thermal coal Iron oreQ&C GoldCopper Other
(13)

ORICA RESULTS FOR THE YEAR ENDED 30 SEPTEMBER 2021
ORICA LIMITED | 1 NICHOLSON STREET EAST MELBOURNE VIC 3002 AUSTRALIA | ABN 24 004 145 868 12
Europe, Middle East & Africa
Year ended 30 September 2021
Restated (1) 2020 Change
External sales revenue (A$M) 801.4 882.8 (9%)
EBITDA(12) (A$M) 56.1 96.3 (42%)
EBIT(2) (A$M) 25.0 64.2 (61%)
Total AN & Emulsion Volumes (‘000 tonnes)
406 450 (10%)
Market conditions
Market conditions varied across the region during the 2021 financial year.
Following significant second and third waves of the COVID-19 pandemic in the first half, a considerable increase in vaccination rates across Europe coupled with government stimulus has led to improved mining and infrastructure activity in the second half.
Mining activity in both the CIS and Africa has been resilient during the pandemic but has nonetheless been constrained by quarantine requirements and mine closures due to outbreaks.
Sea freight costs have increased sharply on the pcp, particularly in the second half.
The Australian dollar was stronger against most major currencies on average during the 2021 financial year as compared to the pcp.
Segment performance
Explosives volumes declined 10 per cent on the pcp, driven predominantly by reduced mining, tunnelling and construction activity in Europe and the Middle East.
Initiating systems volumes were down on the pcp, mainly from lower demand from wholesale customers in the Nordics.
Cyanide volumes were lower than the pcp due to shipment delays to Africa.
EBIT was down 61 per cent on the pcp, due to unfavourable foreign exchange movements, lower volumes and higher freight costs which affected offshore sourcing. Further exacerbating this was a demand shift in Africa to lower margin products and a reduction in services as customers sought to reduce costs.
1% 2%
2%
37%
26%
8%
24%
External revenue by commodity
Thermal coal Metallurgical coalIron ore Q&CGold CopperOther
(13)

ORICA RESULTS FOR THE YEAR ENDED 30 SEPTEMBER 2021
ORICA LIMITED | 1 NICHOLSON STREET EAST MELBOURNE VIC 3002 AUSTRALIA | ABN 24 004 145 868 13
Orica Monitor
Year ended 30 September 2021 A$M
2020 A$M Change
External sales revenue 114.5 94.0 22%
EBITDA(12) 43.6 33.1 32%
EBIT(2) 30.7 20.3 51%
The Orica Monitor segment comprises GroundProbe and Nitro Consult businesses.
GroundProbe sales were higher than the pcp, driven by increased demand for radar systems, mainly in Brazil and Africa, the introduction of new products and remote geotechnical services. EBIT improved on the pcp from positive mix as high margin leases and premium radar sales increased.
The Nitro Consult EBIT result improved on the pcp, with both increased revenue from new customers and a reduction in costs following a business restructure that took place in 2020.
Global Support
Year ended 30 September 2021 A$M
2020 A$M
Change
EBIT(2) (67.6) (68.7) 2%
Global Support costs were in line with the pcp as costs were contained through restructuring activity.
Minova (held for sale)
Year ended 30 September 2021 A$M
Restated (1) 2020 A$M Change
External sales revenue 474.3 468.3 1%
EBITDA(12) 33.7 32.2 5%
EBIT(2) 22.0 20.8 6%
Sales volumes were slightly higher than the pcp, due to higher customer demand in the hard rock market in Canada and customer demand in Europe, offset by lower volumes in the US from the decline in the coal market and the geopolitical tension between Australia and China, which impacted on sales into the coal segment.
EBIT earnings increased by 6 per cent from the pcp, with strong growth across Canada from increased demand, market share gains and new construction projects commencing in Europe.
The business remains EBIT and cash flow positive, driving good momentum into the future.

ORICA RESULTS FOR THE YEAR ENDED 30 SEPTEMBER 2021
ORICA LIMITED | 1 NICHOLSON STREET EAST MELBOURNE VIC 3002 AUSTRALIA | ABN 24 004 145 868 14
Net interest expense
Net interest expense of $106 million decreased on the pcp primarily as a result of an increase in the discount rate applied to remeasure long-term provisions as at 30 September 2021. In the pcp a significant decrease in discount rates impacted the measurement of provisions unfavourably. Net interest expense excluding the impact of the unwinding of discount on provisions and lease interest is in line with the pcp at $98 million.
Year ended 30 September 2021 A$M
2020 A$M
Variance A$M
Net interest expense excluding unwinding of discount on provisions and lease interest (98.0) (98.2) 0.2
Unwinding of discount on provisions 4.7 (48.2) 52.9
Lease interest (12.3) (12.6) 0.3
Net interest (105.6) (159.0) 53.4
Tax expense
The effective tax rate before individually significant items of 32.0 per cent is in line with the pcp.
Group Cash Flow
Year ended 30 September 2021 A$M
Restated (1) 2020 A$M
Variance A$M
Net Operating cash flows(4) 618.9 144.7 474.2
Net Investing cash flows(14) (195.9) (527.7) 331.8
Net Operating and Investing cash flows 423.0 (383.0) 806.0 Dividends – Orica Limited (72.4) (179.4) 107.0
Dividends – non-controlling interest shareholders (7.2) (11.3) 4.1
Adjusted net cash flows 343.4 (573.7) 917.1
Movement in borrowings and other net financing cash flows(15)
(669.0) 1,126.6 (1,795.6)
Net cash inflow / (outflow)(16) (325.6) 552.9 (878.5)
Net Operating cash flows
Net cash generated from operating activities was favourable due to a decrease in working capital, partly offset by lower earnings.
Net Investing cash flows
The lower investing cash flow largely relates to the non-repeat of the Exsa acquisition in the pcp and lower spend on the Burrup plant which was commissioned at the end of the 2020 financial year.
Movement in borrowings and other net financing cash flows
The net financing cash outflow relates to the principal portion of lease payments and the US Private Placement (USPP) bond redemption which was repaid in October 2020. The prior year comprised funds from the equity raising in February 2020 to fund the Exsa acquisition and net borrowings from debt facilities, which includes a US Private Placement of $725 million.
ORICA RESULTS FOR THE YEAR ENDED 30 SEPTEMBER 2021
ORICA LIMITED | 1 NICHOLSON STREET EAST MELBOURNE VIC 3002 AUSTRALIA | ABN 24 004 145 868 15
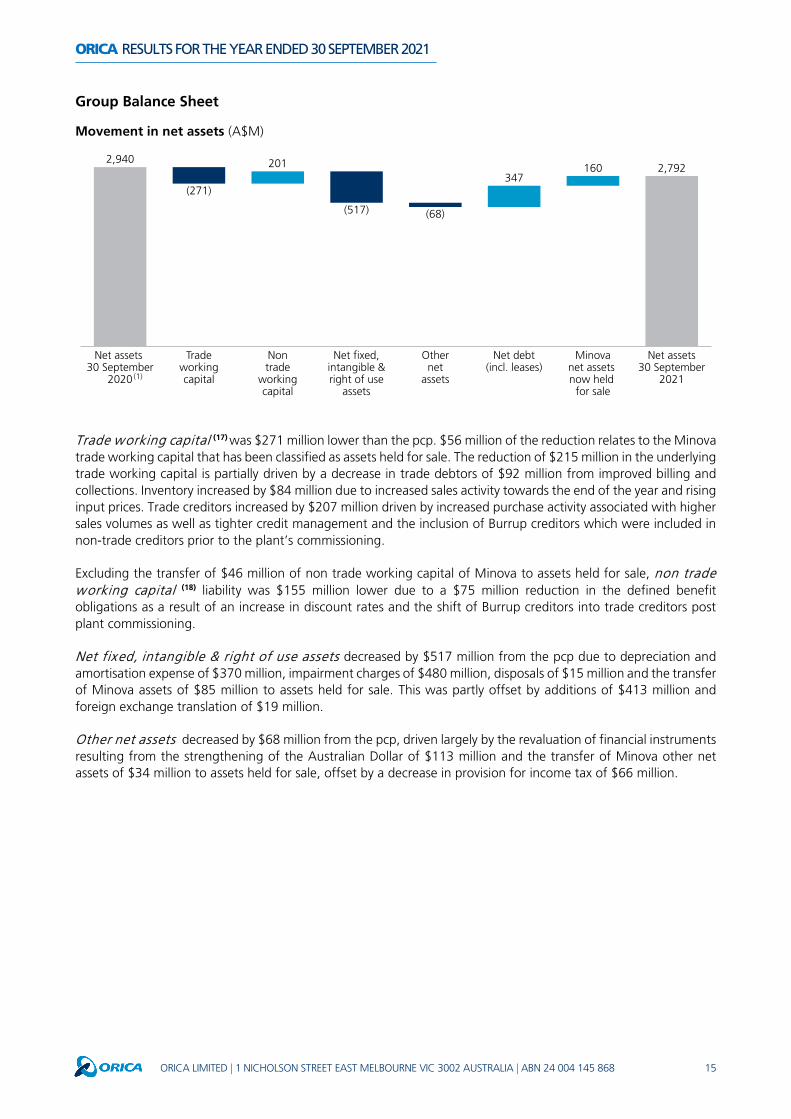
Group Balance Sheet
Movement in net assets (A$M)
Trade working capital (17) was $271 million lower than the pcp. $56 million of the reduction relates to the Minova trade working capital that has been classified as assets held for sale. The reduction of $215 million in the underlying trade working capital is partially driven by a decrease in trade debtors of $92 million from improved billing and collections. Inventory increased by $84 million due to increased sales activity towards the end of the year and rising input prices. Trade creditors increased by $207 million driven by increased purchase activity associated with higher sales volumes as well as tighter credit management and the inclusion of Burrup creditors which were included in non-trade creditors prior to the plant’s commissioning.
Excluding the transfer of $46 million of non trade working capital of Minova to assets held for sale, non trade working capital (18) liability was $155 million lower due to a $75 million reduction in the defined benefit obligations as a result of an increase in discount rates and the shift of Burrup creditors into trade creditors post plant commissioning.
Net fixed, intangible & right of use assets decreased by $517 million from the pcp due to depreciation and amortisation expense of $370 million, impairment charges of $480 million, disposals of $15 million and the transfer of Minova assets of $85 million to assets held for sale. This was partly offset by additions of $413 million and foreign exchange translation of $19 million.
Other net assets decreased by $68 million from the pcp, driven largely by the revaluation of financial instruments resulting from the strengthening of the Australian Dollar of $113 million and the transfer of Minova other net assets of $34 million to assets held for sale, offset by a decrease in provision for income tax of $66 million.
2,9402,792201
347160
Othernet
assets
Net assets 30 September
2020
Net fixed,intangible &right of use
assets
Net assets30 September
2021
Tradeworkingcapital
Minovanet assets now held
for sale
Nontrade
workingcapital
Net debt(incl. leases)
(271)
(517) (68)
(1)

ORICA RESULTS FOR THE YEAR ENDED 30 SEPTEMBER 2021
ORICA LIMITED | 1 NICHOLSON STREET EAST MELBOURNE VIC 3002 AUSTRALIA | ABN 24 004 145 868 16
Debt Management and Liquidity
As at 30 September 2021 Restated (1)
2020 Variance
Interest bearing liabilities - excluding lease liabilities (A$M) (2,072.7) (2,741.0) 668.3
Less: Cash and cash equivalents (A$M) 593.7 920.5 (326.8)
Net debt (6) (A$M) (1,479.0) (1,820.5) 341.5
Lease liabilities (A$M) (260.4) (298.7) 38.3
Net debt – including lease liabilities (A$M) (1,739.4) (2,119.2) 379.8
Gearing % - excluding Lease liabilities (7) (%) 34.6% 38.2% (3.6pts)
Interest bearing liabilities of $2,073 million comprise $2,069 million of US Private Placement bonds and $4 million of committed and other bank facilities. The average tenor of drawn debt is 5.4 years (September 2020 5.0 years).
Cash of $594 million provides for a strong liquidity position, complemented by undrawn committed bank facilities of $1,486 million.
Gearing excluding lease liabilities at 34.6 per cent is within the Group’s target range of 30 to 40 per cent and is well below the 57.5 per cent covenant default measure. The interest cover ratio at 4.6x also has significant headroom against the debt covenant of 2.0x.
On 2 March 2021, Standard and Poor’s (S&P) affirmed Orica’s credit rating at ‘BBB’, whilst revising the outlook to ‘negative’ from ‘stable’. S&P’s rating methodology adjusts Orica’s net debt to incorporate post-retirement benefit obligations, asset retirement obligations (i.e. environmental and decommissioning provisions) and leases. Orica’s debt covenants do not include these items.
The chart below illustrates the movement in net debt from 30 September 2020.
Movement in net debt (A$M)
(i) Impact of foreign exchange translation (ii) The net debt balance at 30 September 2021 excludes Minova cash of $42 million
1,821
1,538 1,479196
140
Netfinancingcash flows
Net debt30 September
2020(excl. leases)
Netoperatingcash flows
Net debt30 September
2021(excl. leases)
Netinvesting
cash flows
Non cashmovementson net debt
Sub-total
(619)
(59)
(i) (ii)

ORICA RESULTS FOR THE YEAR ENDED 30 SEPTEMBER 2021
ORICA LIMITED | 1 NICHOLSON STREET EAST MELBOURNE VIC 3002 AUSTRALIA | ABN 24 004 145 868 17
Individually significant items
Year ended 30 September 2021 Gross A$M
Tax A$M
Net A$M
Gain on sale of land 112.4 5.7 118.1
Operating model restructuring (45.6) 12.8 (32.8)
Environmental provision expense (39.3) 11.8 (27.5)
EMEA goodwill impairment (162.4) - (162.4)
Pilbara impairment (317.6) 41.0 (276.6)
Individually significant items from continuing operations (452.5) 71.3 (381.2)
Individually significant items from Minova (held for sale) (1.4) 0.4 (1.0)
Individually significant items attributable to shareholders of Orica (453.9) 71.7 (382.2)
Gain on sale of land
Sale of Botany Lot 1 (formerly Lot 9)
In September 2021 Orica completed the sale of Botany Lot 1 (formerly Lot 9), resulting in a gain on sale. Due to the utilisation of carried forward capital losses, there was no tax expense on this transaction.
Sale of Villawood
In March 2021, Orica sold its Villawood property in New South Wales, resulting in a gain on sale. A net tax benefit was recognised in respect of the utilisation of brought forward capital losses.
Operating model restructuring
As part of the global restructuring project, further redundancy costs were recognised during the year.
Environmental provision expense
Botany Groundwater Treatment Plant (GTP)
The performance of trials of remediation technologies to date has been limited by lower biological activity than expected. It is considered unlikely that results will improve, therefore the assumption of the future cost saving has been removed from the provision calculation. This has resulted in an increase to the environmental provision with the expense included as a significant item.
Botany Hexachlorabenzene (HCB) waste
The provision increased due to a requirement for an additional shipment to complete waste destruction.
EMEA goodwill impairment
As part of Orica’s periodic impairment testing, and in the context of the ongoing challenging market conditions, a non-cash impairment charge was recognised on the goodwill in the EMEA segment. After the recognition of this impairment charge, $49 million of goodwill remains in EMEA.
Pilbara impairment
Following the impairment recognised by Yara Pilbara Nitrates (Pty) Ltd, the joint venture company that operates the Burrup plant, Orica has reviewed the carrying value of its 50 per cent shareholding. This has resulted in Orica recognising a non-cash impairment of $158 million against Goodwill and $160 million against Property Plant & Equipment.
ORICA RESULTS FOR THE YEAR ENDED 30 SEPTEMBER 2021
ORICA LIMITED | 1 NICHOLSON STREET EAST MELBOURNE VIC 3002 AUSTRALIA | ABN 24 004 145 868 18
Dividend
The Board has declared a final dividend on ordinary shares of 16.5 cents per share, unfranked. This final dividend represents a payout ratio of 50 per cent(19). This brings the full year dividend to 24.0 cents per share, and a full year payout ratio of 47 per cent.
The dividend is payable to shareholders on 22 December 2021 and shareholders registered as at the close of business on 22 November 2021 will be eligible for the final dividend.
It is anticipated that dividends in the near future will be unfranked. Tax contribution summary
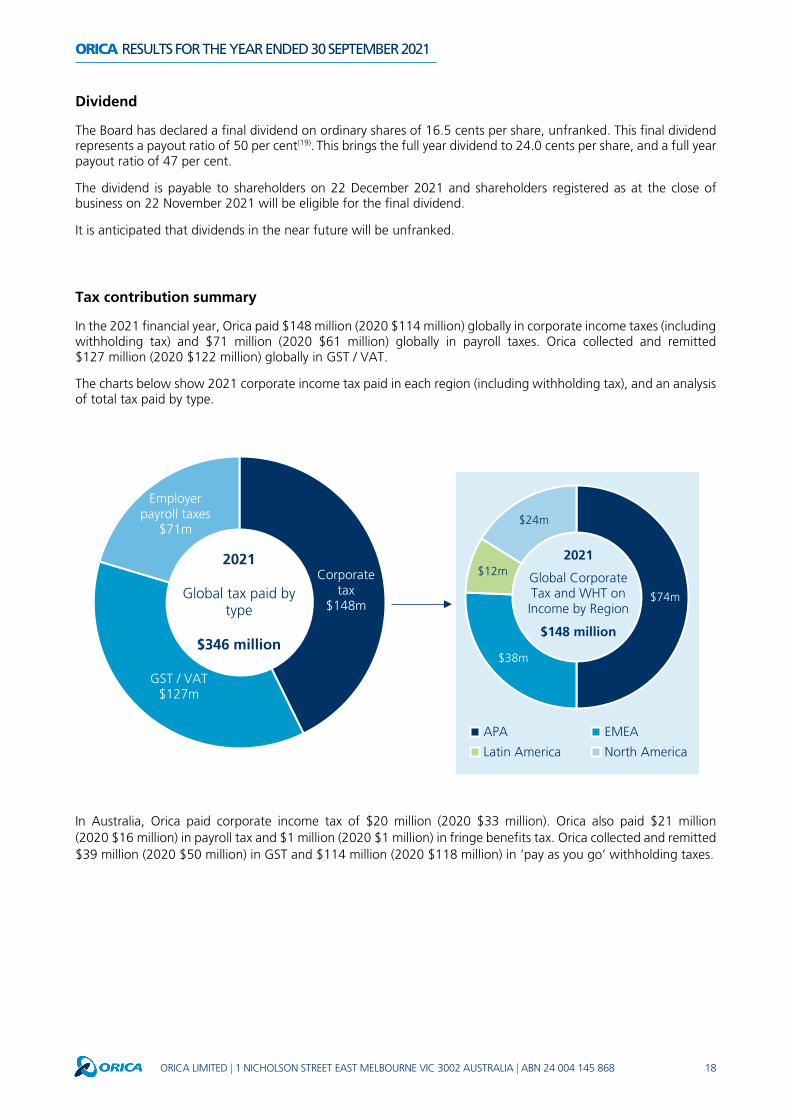
In the 2021 financial year, Orica paid $148 million (2020 $114 million) globally in corporate income taxes (including withholding tax) and $71 million (2020 $61 million) globally in payroll taxes. Orica collected and remitted $127 million (2020 $122 million) globally in GST / VAT.
The charts below show 2021 corporate income tax paid in each region (including withholding tax), and an analysis of total tax paid by type.
In Australia, Orica paid corporate income tax of $20 million (2020 $33 million). Orica also paid $21 million (2020 $16 million) in payroll tax and $1 million (2020 $1 million) in fringe benefits tax. Orica collected and remitted $39 million (2020 $50 million) in GST and $114 million (2020 $118 million) in ‘pay as you go’ withholding taxes.
Corporate tax
$148m
GST / VAT$127m
Employer payroll taxes
$71m
2021
Global tax paid by type
$346 million
$74m
$38m
$12m
$24m
APA EMEA
Latin America North America
2021
Global Corporate Tax and WHT on Income by Region
$148 million
ORICA RESULTS FOR THE YEAR ENDED 30 SEPTEMBER 2021
ORICA LIMITED | 1 NICHOLSON STREET EAST MELBOURNE VIC 3002 AUSTRALIA | ABN 24 004 145 868 19
2022 OUTLOOK
• Global commodity growth is anticipated to continue, particularly in copper and gold; and in quarry and construction markets
• Subject to market conditions, 2022 financial year EBIT is expected to increase on the pcp from continuing operations:
‒ Strong momentum in the final quarter of the 2021 financial year has continued, driving expectations for a stronger first half in 2022 than in the pcp
‒ The result is expected to be weighted towards the second half, reflecting greater manufacturing plant turnaround activity in the first half
• Improvement in earnings is expected to be attributable to:
1. Volume growth, expected to be in line with global GDP growth
2. Increased adoption of advanced technology offerings, particularly digital and monitoring solutions
3. Key strategic initiatives driving supply chain efficiencies
4. Sustainable overhead cost reductions, net of inflation
• Pricing discipline is expected to broadly mitigate rising input costs and pass-through lag
• Capital expenditure is expected to be within $340 million to $360 million; the depreciation and amortisation expense is expected to be up to 5 per cent higher than the pcp
• A continuing focus on balance sheet and cash flow optimisation, with gearing expected to remain within stated range of 30 to 40 per cent
ORICA RESULTS FOR THE YEAR ENDED 30 SEPTEMBER 2021
ORICA LIMITED | 1 NICHOLSON STREET EAST MELBOURNE VIC 3002 AUSTRALIA | ABN 24 004 145 868 20
Footnotes
The following footnotes apply to this results announcement: (1) 2020 restated for the retrospective application of a change in Orica’s accounting policy on AASB 138 Intangible Assets and AASB 116
Property, Plant and Equipment, following an International Financial Reporting Interpretations Committee (‘IFRIC’) agenda decision in 2021. Refer to Note 24 within the Appendix 4E – Preliminary Final Report for detail
(2) Equivalent to profit/(loss) before financing costs and income tax as disclosed in Note 1(b) within Appendix 4E – Preliminary Final Report, before individually significant items
(3) Basic earnings per share before individually significant items as disclosed in Note 2 within Appendix 4E – Preliminary Final Report (4) Equivalent to net cash flows from operating activities, as disclosed in the Statement of Cash Flows within Appendix 4E – Preliminary Final
Report (5) Comprises spend on property, plant and equipment and intangible assets, on an accruals basis from the 2020 financial year to align with
SAP reporting, and on a cash basis in prior years (6) Total interest bearing liabilities – excluding lease liabilities less cash and cash equivalents, as disclosed in Note 3(a) within Appendix 4E –
Preliminary Final Report (7) Net debt / (net debt + total equity), where net debt excludes lease liabilities (8) Achieving this ambition will require effective government policy frameworks, supportive regulation and financial incentives, and access to
new low-carbon technologies operating at commercial scale. Material means the scope 1 and scope 2 greenhouse gas (GHG) emissions embodied in purchased ammonia and ammonium nitrate included in Orica’s scope 3 reporting category of purchased goods and services. These comprise around two-thirds of Orica’s scope 3 emissions footprint
(9) On 12 December 2015, parties to the United Nations Framework Convention on Climate Change (UNFCCC) reached a landmark agreement to combat climate change and to accelerate and intensify the actions and investments needed for a sustainable low carbon future. This is known as the Paris Agreement
(10) Includes nickel, lithium minerals, cobalt, zinc, potash, phosphate rock (11) Equivalent to profit after income tax expense before individually significant items attributable to shareholders of Orica Limited, as disclosed
in Note 1(b) within Appendix 4E – Preliminary Final Report (12) EBIT before individually significant items plus depreciation and amortisation expense (13) Quarry and construction (14) Equivalent to net cash flows used in investing activities, as disclosed in the Statement of Cash Flows within Appendix 4E – Preliminary Final
Report (15) Equivalent to net cash flows (used in)/from financing activities (as disclosed in the Statement of Cash Flows within Appendix 4E – Preliminary
Final Report) excluding dividends paid to Orica ordinary shareholders and non-controlling interests (16) Equivalent to net increase/(decrease) in cash held, as disclosed in the Statement of Cash Flows within Appendix 4E – Preliminary Final
Report (17) Comprises inventories, trade receivables and trade payables, as disclosed in the Balance Sheet within Appendix 4E – Preliminary Final Report
(18) Comprises other receivables, other payables and provisions, as disclosed in the Balance Sheet within Appendix 4E – Preliminary Final Report, plus prepayments
(19) Dividend amount / NPAT before individually significant items
Forward-looking statements This announcement has been prepared by Orica Limited. The information contained is for informational purposes only. The information contained in this presentation is not investment or financial product advice and is not intended to be used as the basis for making an investment decision. This announcement has been prepared without taking into account the investment objectives, financial situation or particular needs of any particular person. No representation or warranty, express or implied, is made as to the fairness, accuracy, completeness or correctness of the information, opinions and conclusions contained in this presentation. To the maximum extent permitted by law, none of Orica Limited, its directors, employees or agents, nor any other person accepts any liability, including, without limitation, any liability arising out of fault or negligence, for any loss arising from the use of the information contained in this presentation. In particular, no representation or warranty, express or implied, is given as to the accuracy, completeness or correctness, likelihood of achievement or reasonableness of any forecasts, prospects or returns contained in this announcement. Such forecasts, prospects or returns are by their nature subject to significant uncertainties and contingencies. Before making an investment decision, you should consider, with or without the assistance of a financial adviser, whether an investment is appropriate in light of your particular investment needs, objectives and financial circumstances. Past performance is no guarantee of future performance. Non-International Financial Reporting Standards (Non-IFRS) information This report makes reference to certain non-IFRS financial information. This information is used by management to measure the operating performance of the business and has been presented as this may be useful for investors. This information has not been reviewed by the Group’s auditor. The 2021 Full Year Results presentation includes non-IFRS reconciliations. Forecast information has been estimated on the same measurement basis as actual results.
For further information
Investors Media Delphine Cassidy Andrew Valler Mobile: +61 419 163 467 Mobile: +61 437 829 211