Organizing for System Expansion - soundtransit.org Workshop... · Presentation. 7 Governance Model...
95
Board Workshop May 4, 2018 Organizing for System Expansion 1
Transcript of Organizing for System Expansion - soundtransit.org Workshop... · Presentation. 7 Governance Model...

Board Workshop May 4, 2018
Organizing for System Expansion
1

2
Welcome

3
Meeting Purpose and Desired Outcomes

Feedback from Board Process Review Sessions
4
• The Board Chair and CEO completed outreach sessions with board members in 2017 to understand how to improve board engagement on strategic issues facing Sound Transit.
• Today, the board will discuss three major themes that emerged: o What is the scope of the workload coming to the board in the
next five years? o How should the board committees be organized to handle the
upcoming workload?o Should the board consider rebalancing the workload and
funding authorities between the committees and full board?

5
Facilitator Introduction

6
• How will your success be measured by the public?• How should the board organize itself to facilitate success?• What is the board’s role in implementing the program? What is
the CEO’s role?• What is the right balance in decision-making between the board
and the CEO?
Considerations for Five-Year Outlook Presentation

7
Governance Model

Sound Transit Board of Directors: Five-Year Outlook
Board WorkshopMay 4, 2018
8

Staff Objectives for the Board Process Review
• Optimize the board’s time on the key issues and challenges facing the agency
• Expand opportunities for the board to engage in more meaningful and frequent policy discussion
• Enhance board engagement in the project development process, consistent with the System Expansion Implementation Plan 9

Goal of the Five-Year Outlook• Our goal is to help inform the board’s decisions on:
o Board rules and procedureso Committee structureo Committee leadershipo Scheduling of the board’s work
10

Five-Year Outlook: Five Major CategoriesI. Leadership on project developmentII. Capital project deliveryIII. Operations business modelIV. New policy directionsV. Continuing oversight and
governance
11

12
Number of board actions continuing to riseI. Leadership on Project Development
0
50
100
150
200
250
2011 2012 2013 2014 2015 2016 2017
Number of annual actions (2011-2017)
Motions Resolutions

• The System Expansion Implementation Plan seeks to shorten project delivery times.
• Elemental to the agency’s success will be:o Establishing trust with growing number of
municipalities, tribes and stakeholderso Driving to a preferred alternative earlier while
maintaining project scope disciplineo Executing partnering agreements and concurrence
documents that allow the environmental review and permitting process to be streamlined 13
Shorter project delivery times mean more project decisions than ever before
I. Leadership on Project Development

ST3 promised voters expedited project timelines
14
I. Leadership on Project Development
Initial Contract Award to ROD

Major project decisions coming to the board faster than ever before• Board member engagement across subareas will require some
knowledge of project details regarding preferred alternatives
1515
Tacoma Community College Tacoma Link Extension – Q3
Everett Link Extension – Q3
I-405 and SR 522 BRT projects – Q1West Seattle and Ballard Link Extensions – Q2Tacoma Dome Link Extension – Q2
2021 2027South Sounder expansion program – Q1
20202019
I. Leadership on Project Development

16
Questions?
I. Leadership on Project Development

Public-private partnership analysis coming to the board for evaluation of efficacy• Determine feasibility and efficacy of public-
private partnerships (P3s) for ST projects • Will require board review of costs/benefits
on P3s pertaining to:o Financingo Agency bandwidtho Contractor performance,
accountability and independenceo Community acceptance 17
II. Capital Project Delivery

ST3 includes potential P3 projects • Potential P3 projects could
include:o I-405 and SR 522 bus rapid
transito ST2 bus baseo South Kirkland-Issaquah Linko Other projects under
evaluation
18
II. Capital Project Delivery
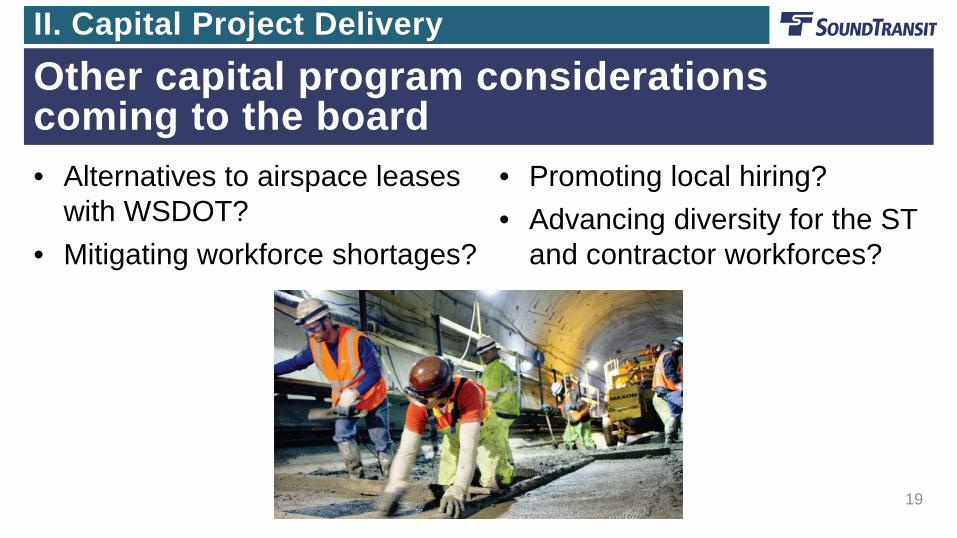
Other capital program considerations coming to the board• Alternatives to airspace leases
with WSDOT? • Mitigating workforce shortages?
19
• Promoting local hiring?• Advancing diversity for the ST
and contractor workforces?
II. Capital Project Delivery

Emerging technologies to consider for the future of the regional transit system
• Semi-automated operations for rail?o Feasibility of an independent rail segment?o Integration with the existing Link system?
• Vehicle automation for bus service and/or connecting services?
• Integrated payment systems? o Online parking reservations?
• Enhanced bidirectional customer communication? 20
II. Capital Project Delivery
21
Questions?
II. Capital Project Delivery

ST will require the right operations business model to meet growing demand
22
75,508
163,000
Average weekday ridership
690,000
560,000
PRO
JEC
TED
2010 2017 2040
III. Operations Business Model

Board direction needed to ensure the long-term sustainability of agency operations• Who operates and maintains Sound
Transit’s services?• At what cost?• What is ST’s ability to maintain
quality and protect ST’s brand over time through contractors?
23
III. Operations Business Model

Significant light rail expansion may require a different operations and maintenance model
• Future of light rail operations and maintenance contract?o Anticipate short-term, multi-year
contract extensiono Consider long-term options: Opportunities for cost
containment? Expansion into Pierce and
Snohomish Counties? 24
III. Operations Business Model

Sound Transit Link light rail is one of the highest cost systems in the country
25
III. Operations Business Model

Sound Transit ownership of the DSTT comes with implementation questions• Ownership and maintenance of
the Downtown Seattle Transit Tunnel (DSTT)o Transition operations and
maintenance to ST?o Contract for operations and
maintenance with KCM?
26
III. Operations Business Model
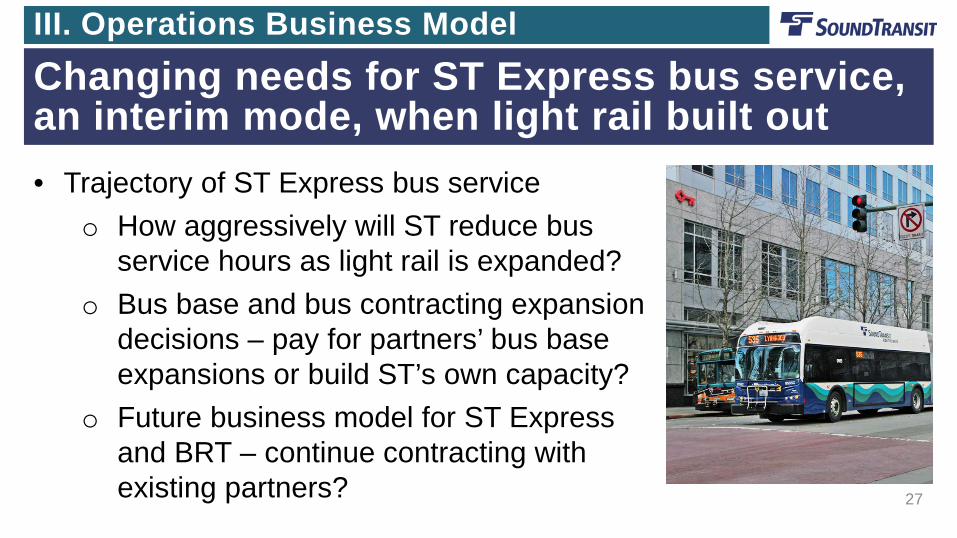
Changing needs for ST Express bus service, an interim mode, when light rail built out• Trajectory of ST Express bus service
o How aggressively will ST reduce bus service hours as light rail is expanded?
o Bus base and bus contracting expansion decisions – pay for partners’ bus base expansions or build ST’s own capacity?
o Future business model for ST Express and BRT – continue contracting with existing partners? 27
III. Operations Business Model

ST Express bus service costs continually increasing over time
28 $40.00
$60.00
$80.00
$100.00
$120.00
$140.00
$160.00
1999A
2000A
2001A
2002A
2003A
2004A
2005A
2006A
2007A
2008A
2009A
2010A
2011A
2012A
2013A
2014A
2015A
2016A
2017F
2018B
Blended bus partner cost per hour (without fuel)
Blended Cost per hour
III. Operations Business Model
29
Questions?
III. Operations Business Model

• Board consultation on equitable TOD guidelines• TOD transactions will continue coming to the
board – increasingly outside of the City of Seattle
• Partnering with public housing authorities?• Opportunities to support community TOD within
a half mile of stations?• Structure, goals and governance of new TOD
revolving fund?
Equitable transit oriented development is becoming an ongoing board responsibility
30
IV. New Policy Directions

31
Roosevelt Station – North and South parcelsNorthgate StationLynnwood Transit CenterKent-Des Moines StationFederal Way Transit CenterSoutheast Redmond Station
Mount Baker StationOverlake Village Station U District StationPine Street TriangleAngle Lake StationOperations Maintenance Facility EastColumbia City Station Redmond Technology Station
RooseveltFirst HillCapitol Hill Site D
>2019 Future Potential Offerings
2018-2019: Pre-development & Potential Offering2018 Transactions
• Per the recently updated Equitable TOD Policy, a regional plan will strategically capture inventory status and be reported to the board.
IV. New Policy DirectionsTOD transactions will be coming to the board faster than ever before
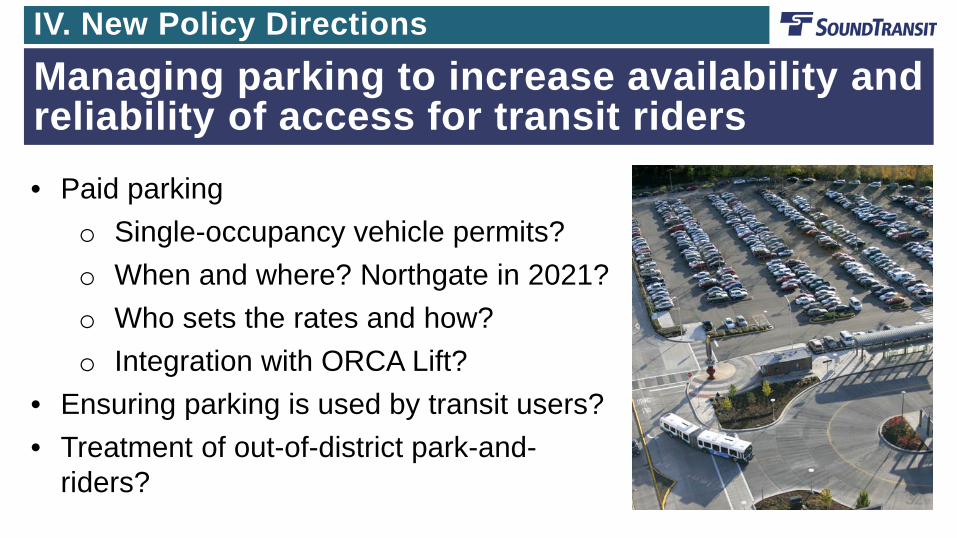
• Paid parkingo Single-occupancy vehicle permits?o When and where? Northgate in 2021?o Who sets the rates and how? o Integration with ORCA Lift?
• Ensuring parking is used by transit users?• Treatment of out-of-district park-and-
riders?
Managing parking to increase availability and reliability of access for transit riders
32
IV. New Policy Directions

Effective system access increasingly important as the system expands
33
IV. New Policy Directions
• Structure of new ST3 system access fund?o Process for allocating the
fund?o Use of any parking revenue
above ST3 assumption?• Agency’s approach to
rideshare?

Advancing sustainability• Evaluate costs, benefits and risks of electric battery technology for
ST Express bus and BRT services• Consider expansion of capacity for double-decker buses?• Consider opportunities for purchasing electricity to enable light rail
to run on 100% “clean, green power”
34
IV. New Policy Directions

• Pursue simplified fare policy and payment options?o Fare collection methods – next gen ORCAo Elimination of cash fare payments?
• Establish customer defined performance metrics?• Replace existing wayfinding with more simplified,
intuitive tools?• Enhance seamless modal integration? How?• Prohibit bicycles on Link during peak periods? All periods?• Improve timely, continuous and credible customer communication
Enhanced customer experience strategies will come to the board more often
35
IV. New Policy Directions

36
Questions?
IV. New Policy Directions

37
V. Continuing Oversight and GovernanceDramatically increasing volume of contract actions as the agency launches major projects in all five subareas
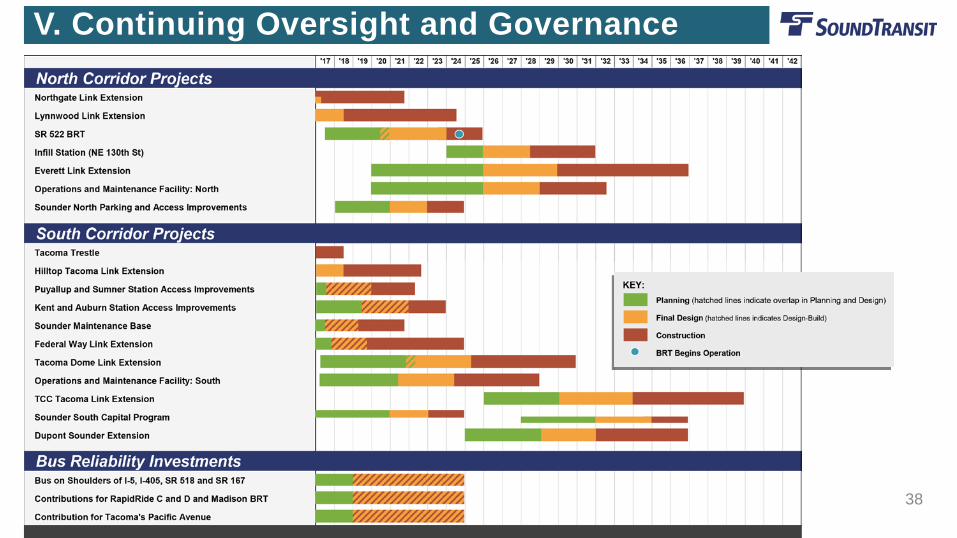
38
V. Continuing Oversight and Governance

Financial management – a growing responsibility of the board
39
• Monitor shifts in the financial plan
• Ensure capital plan remains affordable in an increasingly dynamic funding environment
• Limited unused financial capacity
V. Continuing Oversight and Governance
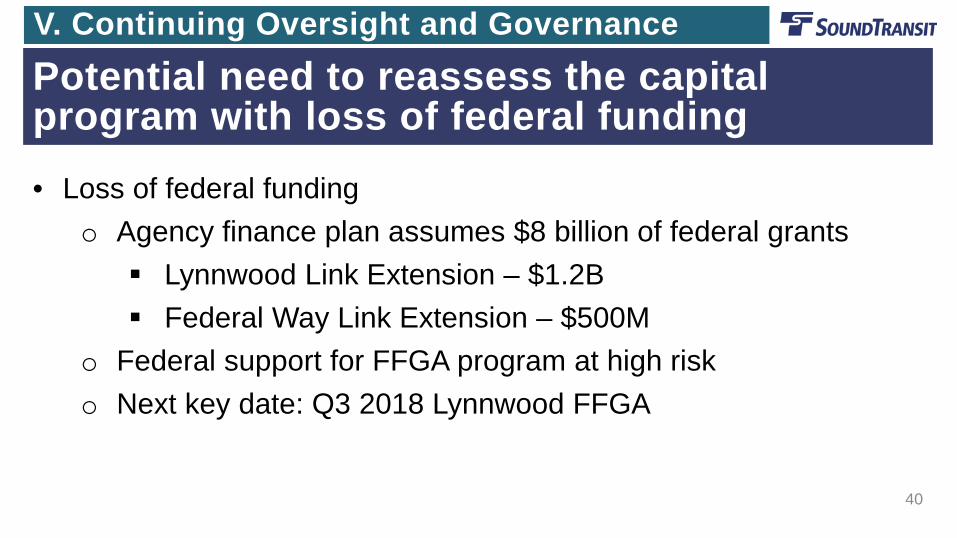
Potential need to reassess the capital program with loss of federal funding
40
V. Continuing Oversight and Governance
• Loss of federal fundingo Agency finance plan assumes $8 billion of federal grants Lynnwood Link Extension – $1.2B Federal Way Link Extension – $500M
o Federal support for FFGA program at high risko Next key date: Q3 2018 Lynnwood FFGA

Potential need to reassess the capital program with loss of MVET funding
41
V. Continuing Oversight and Governance
• Several proposals could significantly reduce MVET revenue collections.o HB 2201 financial impact of $2.3Bo SB 5893 financial impact of $12Bo Initiative 976 financial impact of $12B
• Next key dates: o December 31, 2018: I-976 must have 259,622 signatures to
be considered in 2019.o Q1 2019 legislative session

Potential need to reassess the capital program due to economic factors
42
V. Continuing Oversight and Governance
• Potential major recession risk: >$2Bo All tax revenues would be negatively impacted.o The earlier the recession, the more severe the impact.
• Unabated project cost growtho Inflation risk ($1-4B) due to high costs for real estate and
constructiono Program scope/cost uncertainties ($1-5B) since much of the
system expansion program has yet to be baselined

Mitigating considerable community disruption during construction
• Buses leaving the DSTT• Street and lane closures for
multiple projects• Ten-week operating change
to Link spine operations to facilitate East Link construction
43
V. Continuing Oversight and Governance

Board direction on how to approach the long-term future for Sound Transit offices• Should the agency transition to unified administrative office
space? Where?• Targeting the same one-year period (~end of 2023) for lease
expirations for ST’s administrative office buildings
44
V. Continuing Oversight and Governance

Board participation in regional plans and projects• Engagement in PSRC Transportation 2040 and
Vision 2050• Transit integration and coordination with partners’
projectso E.g. Colman Dock, RapidRide, Swift, Pacific
Avenue BRT• Board composition
o Requirement to reconstitute the board after the census 45
V. Continuing Oversight and Governance

46
Questions?
IV. Continuing Oversight and Governance

47
Why Must We Do All This?• 116 miles of light rail providing a
true seamless network throughout the region
• Real BRT connecting residents rapidly to light rail and commuter rail
• Expanded and extended commuter rail to more district commuters
• Residents will enjoy a real choice to avoid congestion that will be far worse than it is today.

Summary of the Next Five Years
48
• Intensified board engagement needed for:o Project development in collaboration with jurisdictions for
expedited project timelineso Dramatic increase in the number of contract actionso Critical decisions on capital delivery approacheso Fundamentals of operating business modelso Policy debate and decision-makingo Continued oversight of dynamic financial plan and
budget development

49

Break
50

Board Workshop May 4, 2018
Board Committee Responsibilities and Structures
51

52
Increased Workload Ahead• Five-year outlook summary• System expansion project timelines• Ongoing board responsibilities
• Comments received during conversations with board members on board committee structure: o Restructure committees to focus on strategic issues and build
on board member expertise.o Look at how to address new subject areas (e.g. transit
oriented development), either through changes to committee structures or other options.
53
Board Member Feedback on Committee Structure

• Provide direction to staff on a committee structure that will best help the board deliver the expanded board responsibilities over the next five years.
54
Desired Outcome
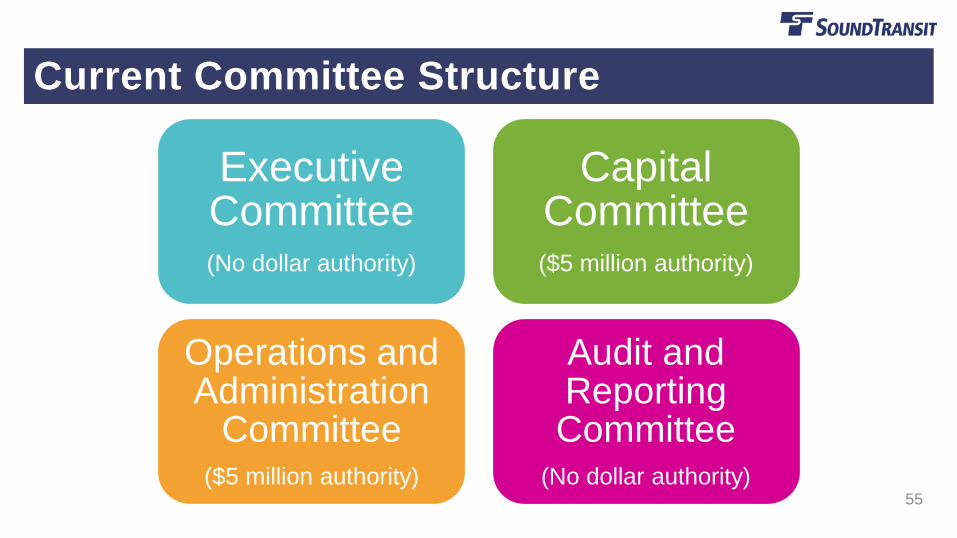
Executive Committee(No dollar authority)
Capital Committee($5 million authority)
Operations and Administration
Committee($5 million authority)
Audit and Reporting Committee
(No dollar authority) 55
Current Committee Structure

Review agency budget and
financial plan
Executive Committee
(No dollar authority)
Recommend board rules and
governance structure
Recommend board policy
56
Key Committee Responsibilities – Current

Approve contract awards related to operations and agency admin.
Recommend service-related
board policy (e.g. fare policy)
Recommend service and fleet
plans
Recommend annual operations and staff budgets
Operations and Administration
Committee ($5 million authority)
57
Key Committee Responsibilities – Current
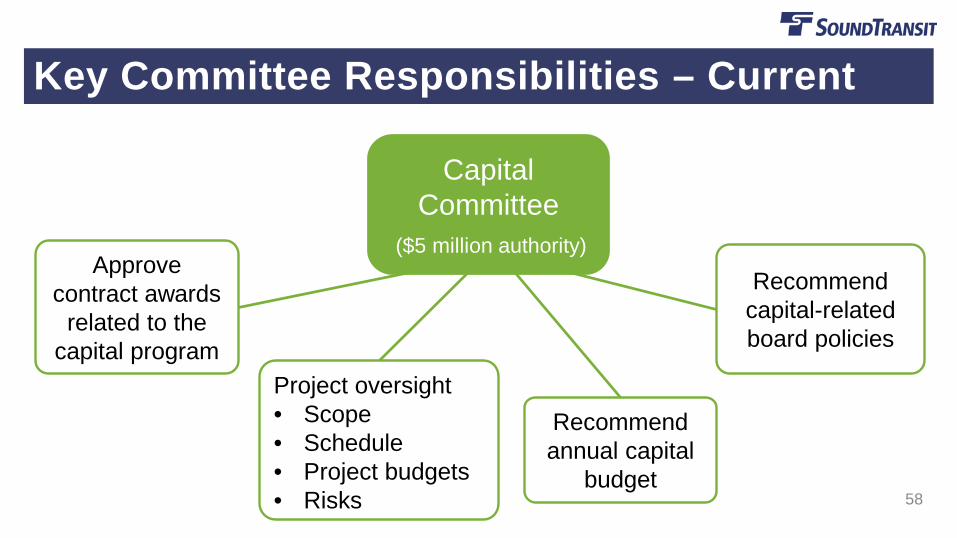
Project oversight• Scope• Schedule• Project budgets• Risks
Recommend annual capital
budget
Approve contract awards
related to the capital program
Capital Committee
($5 million authority)
Recommend capital-related board policies
58
Key Committee Responsibilities – Current

Audit and Reporting
Committee*(No dollar authority)
Direct independent and internal agency auditing activities
Review agency internal controls
*Membership of ARC includes the Chair of the Citizen Oversight Panel
Review quarterly financial reports
59
Key Committee Responsibilities – Current

Board
Budget adoption and
amendments
Adoption of policies and decisions on
projects and strategic areas
Responsibilities not delegated by the board:
Approve transactions that
exceed committees’ delegation
System plans and long-range
planning 60
Key Board Responsibilities – Current

• Topic areas not currently assigned:o TOD and related surplus property declarations o Systemwide programs like the System Access Fund and
Innovation Fund• Unbalanced workload and fragmented oversight
o Varied workload among committeeso Decentralized financial oversighto Overlapping committee subject areas, such as Capital
Committee review of operations-related capital projects61
Challenges

62
Discussion on Committee Structure• What does the perfect committee structure accomplish?• At the end of discussion, how will you know it’s the right solution?

Lunch
63
Board WorkshopMay 4, 2018
Balance of Board Oversight and Workload
64

• Comments received during conversations with board members on board oversight and workload: o Provide more opportunities for board engagement on strategic
issues.o Consider increasing approval levels.
65
Feedback on Board Oversight and Workload

• Provide direction to staff on a balance of board vs. CEO authority/actions that will be most efficient in delivering the expanded board responsibilities over the next five years.
66
Desired Outcome
$-
$500,000
$1,000,000
$1,500,000
$2,000,000
$2,500,000
$3,000,000
$3,500,000
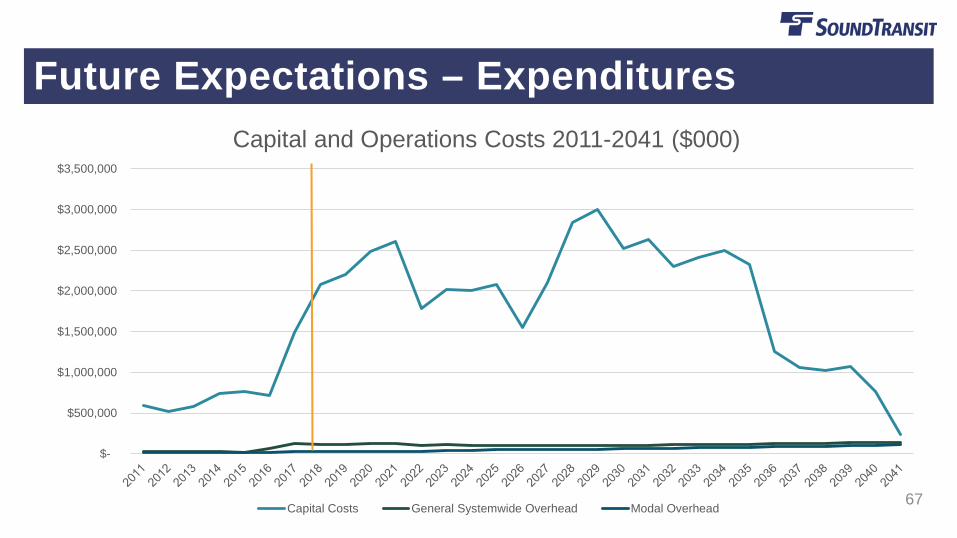
Capital and Operations Costs 2011-2041 ($000)
Capital Costs General Systemwide Overhead Modal Overhead67
Future Expectations – Expenditures

$-
$500,000
$1,000,000
$1,500,000
$2,000,000
$2,500,000
$3,000,000
$3,500,000
Capital and Operations Costs 2018-2022 ($000)
Capital Costs General Systemwide Overhead Modal Overhead68
Future Expectations – Expenditures
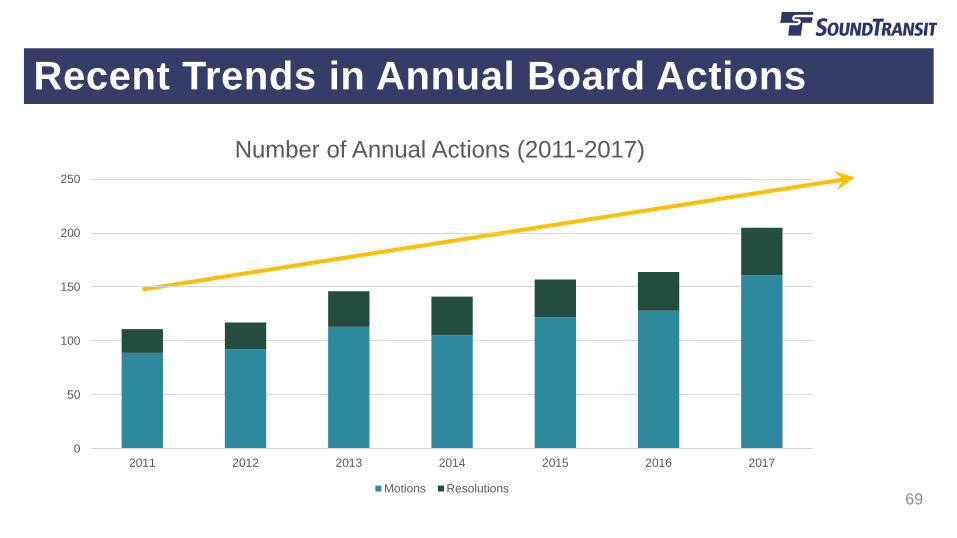
69
Recent Trends in Annual Board Actions
0
50
100
150
200
250
2011 2012 2013 2014 2015 2016 2017
Number of Annual Actions (2011-2017)
Motions Resolutions

70
Recent Trends in Annual Board Actions
• Number of agenda items increasing• For example, average Capital Committee agenda:
2011 2017Average of 4 Average of 8items per agenda items per agenda(high of 7) (high of 12)

• Existing board policy establishes approval levels for a variety of actions.
• Based on your feedback, today, we are focusing on approval levels for contract awards.
71
Existing Delegations
BoardCEO Committee
$200K $5M
72
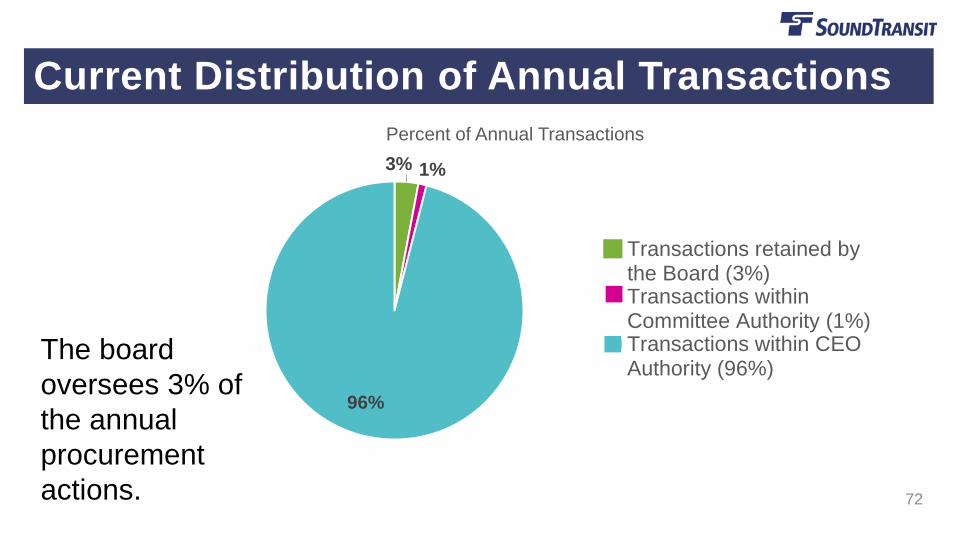
Current Distribution of Annual Transactions
3% 1%
96%
Percent of Annual Transactions
Transactions retained bythe Board (3%)Transactions withinCommittee Authority (1%)Transactions within CEOAuthority (96%)
The board oversees 3% of the annual procurement actions.

73
Current Distribution of Annual Dollars
97%
2% 1%Percent of Annual Dollars
Dollars retained by theBoard (97%)Dollars within CommitteeAuthority (2%)Dollars within CEOAuthority (1%)The board
controls 97% of the annual procurement dollars.

74
Comparing Annual Transactions and Dollars
97%
2%1%
Percent of Annual Dollars
Dollars retained bythe Board (97%)
Dollars withinCommittee Authority(2%)
Dollars within CEOAuthority (1%)
3%1%
96%
Percent of Annual Transactions
Transactions retainedby the Board (3%)
Transactions withinCommittee Authority(1%)
Transactions withinCEO Authority (96%)
The board oversees 3% of the actions and 97% of the dollars.

75
• Peer analysis indicates that transit agencies rely on quantitative (dollar) levels.
• Some agencies set more than one approval level based on:o The contract type, for example, goods and services,
construction, or professional serviceso The procurement method, for example, Invitation for Bid
(sealed bid) and Request for Proposals (weighted evaluation), sole source
Approval Levels Peer Review
76
• Delegations to CEOs or general managers range from a low of $100,000 to a high of unlimited value, with several of them at $500,000 (see handout).
• CEOs or general managers may elevate any particular approval within their dollar authority as appropriate on a case-to-case basis.
Approval Levels Peer Review (Continued)

• With expanded board responsibilities over the next five years:o The quantity of agenda items will minimize time for strategic
discussion.o The quantity of board decisions needed at existing approval
levels will, at times, exceed the amount of available meeting time.
77
Challenges
78
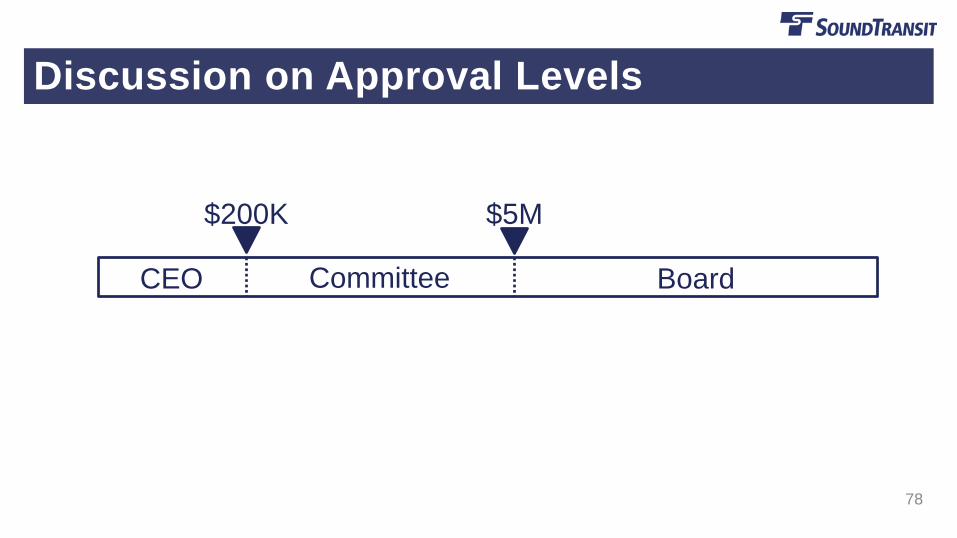
BoardCEO Committee
$200K $5M
Discussion on Approval Levels

79
Example A• Committee delegation increased to $10 million; CEO delegation
increased to $500Ko Decreases the number of annual actions approved by the
Board by 9%, or around 13 actions.o Decreases the number of annual actions delegated to the
committees by 6%, or around 4 actions.
CEO Committee Board
$500K $10M

80
Example A• Board controls 94% of the annual procurement dollars.• Committee controls 5% of the annual procurement dollars.
• Examples of contract types under $500K: maintenance and repair contracts, professional services, equipment and supplies
CEO Committee Board
$500K $10M

81
Example B
CEO Committee Board
$1M $20M
• Committee delegation increased to $20 million; CEO delegation increased to $1 milliono Decreases the number of annual actions approved by the
Board by 18%, or around 27 actions.o Decreases the number of annual actions delegated to the
committees by 9%, or around 6 actions.

82
Example B
CEO Committee Board
$1M $20M
• Board controls 90% of the annual procurement dollars.• Committee controls 9% of the annual procurement dollars.
• Examples of contract types under $1 million: maintenance and repair contracts, professional services, small engineering services contracts
83
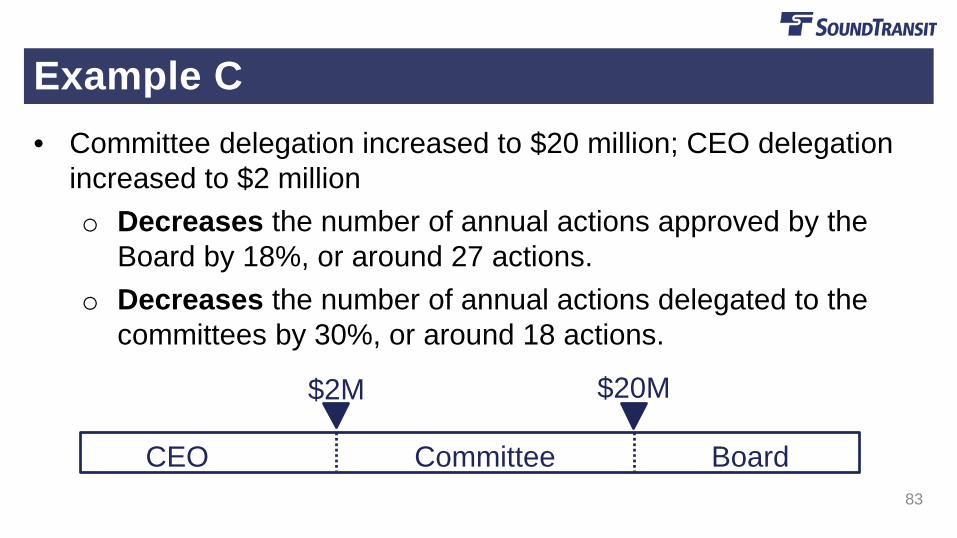
Example C• Committee delegation increased to $20 million; CEO delegation
increased to $2 milliono Decreases the number of annual actions approved by the
Board by 18%, or around 27 actions.o Decreases the number of annual actions delegated to the
committees by 30%, or around 18 actions.
CEO Committee Board
$2M $20M

84
Example C
CEO Committee Board
$2M $20M
• Board controls 89% of the annual procurement dollars.• Committee controls 9% of the annual procurement dollars.
• Examples of contract types under $2 million: professional services, small engineering services contracts, small construction and construction management contracts

85
Example D• Committee delegation increased to $50 million; CEO delegation
increased to $5 milliono Decreases the number of annual actions approved by the
Board by 24%, or around 35 actions.o Decreases the number of annual actions delegated to the
committees by 43%, or around 26 actions.
CEO Committee Board
$5M $50M

86
Example D• Board controls 82% of the annual procurement dollars.• Committee controls 15% of the annual procurement dollars.
• Examples of contract types under $5 million: professional services, small engineering services contracts, small construction and construction management contracts, small service vehicle procurements
CEO Committee Board
$5M $50M

87
• Some peer agencies set different approval levels based on contract type or procurement method.
• Sound Transit currently has different approval levels for:o Sole source contracts o Proprietary contracts
• The board could consider a categorical approach with more than one approval level, or exceptions or exclusions to the approval levels.
Categorical Approach to Approval Levels

88
Discussion on Board Oversight and Workload
BoardCEO Committee
$200K $5M

Board WorkshopMay 4, 2018
Board Communications
89

90
• Comments received during conversations with board members on communication: o Provide more opportunities for communication between board
memberso Provide opportunities for outside perspective
Board Member Feedback on Communications
91
• Ensure the board has the information needed at the right time to address the work ahead
Desired Outcome for Communications

92
• 40 meeting packets / 205 staff reports• A variety of reports and publications are also distributed to the
board every year. (See handout)
Current Reports and Publications
2 Monthly Reports 5 Quarterly Reports 14 Annual Reports

93
• What information is important to the board and/or needed for decision-making?
• How could existing reports or publications be changed to better meet your needs?
• How can the board process and accomplishments be better communicated with the public?
• What types of opportunities would you like for outside perspective?
Discussion on Board Communications

Next Steps
94

95