Organizational Network Analysis (ONA) of Fisheries Co ...
26
Fisheries Integration of Society and Habitats (FISH) Project, Award No. AID-612-A-14-00004, December 2015 1 Organizational Network Analysis (ONA) of Fisheries Co-management in Lakes Malawi, Malombe & Chilwa. ________________________________________________________________________________ Fisheries Integration of Society and Habitats (FISH) PREPARED FOR: USAID AWARD NUMBER: AID-612-A-14-00004 PREPARED BY: Pact Inc., and Partners. DATE: 30 th December, 2015
Transcript of Organizational Network Analysis (ONA) of Fisheries Co ...

Fisheries Integration of Society and Habitats (FISH) Project, Award No. AID-612-A-14-00004, December 2015 1
Organizational Network Analysis
(ONA) of Fisheries Co-management
in Lakes Malawi, Malombe &
Chilwa. ________________________________________________________________________________
Fisheries Integration of Society and
Habitats (FISH)
PREPARED FOR: USAID
AWARD NUMBER: AID-612-A-14-00004
PREPARED BY: Pact Inc., and Partners.
DATE: 30th December, 2015

Cover Page Photograph: Fishers about to set off fishing from a beach in Lake Malombe
ACKNOWLEDGEMENTS
This report was compiled by Derek Chiwanda, Organizational Network Analysis Specialist,
Pact Malawi. The on-the-ground research for this ONA was carried out from August 2015 by
a team of 4 researchers lead by Derek Chiwanda, supported by Dr. Dick Kachilonda,
Governance and Capacity Development Specialist based out of Mangochi, with assistance
from the District Fisheries Office, Stanley Mvula and Richard Kachala from local partners
CEPA and CISER respectively. We are indebted to them for the ground work that lead to this
Report and to the many participating parties who contributed through key informant
interviews (KIIs), focus group discussions (FGDs) and who provided secondary sources.
CITATION:
FISH, (2015) An Organizational Network Analysis (ONA) of Fisheries Co-management in
Lakes Malawi, Malombe and Chilwa. USAID/FISH Project, Pact Publication, Lilongwe,
Malawi: 24 p.
DISCLAIMER:
Prepared under USAID Cooperative Agreement No. AID-612-A-14-00004, awarded on
September 9, 2014, entitled Malawi Fisheries Integration for Society and Habitat (FISH)
Project.
This report is made possible by the generous support of the American People through the
U.S. Agency for International Development (USAID). The contents are the sole
responsibility of Pact, Inc. and FISH and do not necessarily reflect the views of USAID or the
United States Government.
CONTACT ADDRESS
Pact Malawi,
1st Floor, Amina House,
P.O. Box 1013,
Lilongwe, Malawi,
Phone: +265-1751220; +265-1751201,
e-mail: [email protected]
Pact Inc,
1828 L Street NW,
Suite 300,
Washington, DC 20036,
USA.
+1-202-466-5666.
Fisheries Integration of Society and Habitats (FISH) Project, Award no. AID-612-A-14-00004, December 2015
Contents
Abbreviations and Acronyms ....................................................................................................... i
1. Background ............................................................................................................................... 1 1.1. Objectives of ONA ...................................................................................................... 1 1.2. Expected Outputs ......................................................................................................... 2
2. Introduction to the ONA Methodology ................................................................................... 2
3. Baseline ONA Process in Mangochi and Machinga............................................................... 3 3.1. Meeting Agenda ........................................................................................................... 3 3.2. Plenary Discussions ..................................................................................................... 3
4. ONA Results .............................................................................................................................. 4 4.1. Results of TA Chowe ONA ......................................................................................... 4 4.2. Results of TA Mponda ONA ....................................................................................... 9
4.3. Results of TA Kawinga ONA .................................................................................... 12
5. Summary of ONA Results from All Traditional Authorities.............................................. 15
6. Recommendations and Way Forward .................................................................................. 18
Appendix 1. List of Organizations that Participated in the Survey, by Traditional
Authority ...................................................................................................................................... 19
Appendix 2. ONA Survey Questionnaire .................................................................................. 20

Fisheries Integration of Society and Habitats (FISH) Project, Award no. AID-612-A-14-00004, December 2015 i
Abbreviations and Acronyms
ADC Area Development Committee
APEA Applied Political Economic Analysis
BVC Beach Village Committee
CPI Community Performance Index
DDP District Development Plan
DFO District Fisheries Office
FA Fisheries Association
FAO Food and Agriculture Organization of the United Nations
FISH Fisheries Integration of Society and Habitats Project
GVH group village headman
NGO nongovernmental organization
ONA Organizational Network Analysis
TA traditional authority
VDC Village Development Committee
VNRMC Village Natural Resource Management Committee

Fisheries Integration of Society and Habitats (FISH) Project, Award no. AID-612-A-14-00004, December 2015 i
Executive Summary
The Organizational Network Analysis (ONA) used by Pact, from its global experience, has
identified a set of tools and methodologies to assess networking, to reinforce and build the
constituencies/social capital required for making tough policy choices and strengthening good
governance at all levels. The outcome, leading to improved structures, processes and
adaptability to changing conditions. The ONA was applied to co-management in fisheries in
Malawi’s 3 main lakes (Lake Malawi, Malombe and Chilwa) to look at linkages between
organizations in terms of nodes and ties. Nodes are the individual organizations within a
network, and ties are the relationships between those organizations.
The study was conducted at TA level and revealed:
For Lake Malombe, for TA Chowe: The number of linkages in the network is 107,
corresponding to a network density of 45 percent. This suggests that there is already
considerable tangible networking happening among the organizations. About 13 of the 16
organizations (81 percent) have reached out to other organizations to obtain information
and/or resources related to fisheries co-management. This indicates that there is some
significant exchange already happening among the organizations. And, 15 organizations (94
percent) that are part of the network have provided other organizations information and
resources related to fisheries co-management activities. This network has a centralization
score of 0.074, making it a less vulnerable network.
For Lake Malawi, for TA Mponda: Out of 240 possible, the number of linkages in the
network is 72, corresponding to a network density of 30 percent. This suggests that there is
already some tangible networking happening among the organizations. About 10 of the 16
organizations (63 percent) have reached out to other organizations to obtain information
and/or resources related to fishing. This indicates that there is some significant exchange
already happening among the organizations. All the 16 organizations (100 percent) that are
part of the network have provided other organizations information and resources related to
fisheries co-management. This network has a centralization score of 0.194, making it a less
vulnerable network.
For Lake Chilwa, for TA Kawinga: A total of 9 of the 13 organizations (69 percent) have
reached out to other organizations to obtain information and/or resources related to fishing.
This indicates that there is some significant exchange already happening among the
organizations. A high 12 organizations (92 percent) have provided other organizations
information and resources related to fish programming This network has a centralization
score of 0.125, making it a less vulnerable network.
In conclusion:
a. All the three TAs average 33 percent network density meaning that there is already some
tangible coordination happening among the institutional structures at community level.
This is to the advantage of the fisheries co-management however it is low because there is
no organization to coordinate meetings where fisheries successes and challenges could be
discussed. DoF needs to create such a platform, notably at FA level for ecosystem based
management.
b. Results have shown that Chiefs, both TAs and GVHs, have an important role in fisheries
co-management and this role must be taken note of and TAs should be involved in FA
Fisheries Integration of Society and Habitats (FISH) Project, Award no. AID-612-A-14-00004, December 2015 ii
and in fisheries development plans and enforcement. There is a need to improve
coordination with Chiefs and the Fisheries Department.
c. Some BVCs understand their role in fisheries co-management but there is need for more
civic education to engage them in their role.
d. Stakeholders at TA level understand the importance of coordinating their efforts in
fisheries co-management but they require more support in terms of capacity development
and funding.
a. Fisheries co-management should be linked to mainstreaming in the organic management
meetings that currently take place such as at VDC and ADC or TA level. This process
would help stakeholders to tackle developmental challenges.
b. The same meetings could also be used for capacity building of these structures,
explaining their roles in fisheries co-management as well as mainstreaming fisheries
management in local development planning.
c. BVCs need more support from the Fisheries Department to curb illegal fishing (e.g. by
trawlers in Area A of the eastern arm of the lake).

Fisheries Integration of Society and Habitats (FISH) Project, Award no. AID-612-A-14-00004, December 2015 1
1. Background
Institutional capacity and good governance are at the center of creating the enabling
environment for community co-management of natural resources, such as fisheries and is
therefore at the heart of the Fisheries Integration of Society and Habitats (FISH) Project. Pact,
from its global experience, has identified a set of tools/methodologies termed Organizational
Network Analysis (ONA) are at the center of creating the enabling environment for FISH.
Therefore, Pact has identified a set of tools/methodologies that reinforce and build the
constituencies/social capital required for making tough policy choices and strengthening good
governance at all levels, leading to improved structures, processes, and adaptability to
changing conditions.
Pact’s approach to ONA is to use it as a diagnostic tool that can be applied with and through
local stakeholders to map a social or institutional network, to better understand the
relationships between different actors and stakeholders. It provides a forum for coordination,
collaboration, and mutual goal-setting. ONA views interactions in terms of nodes and ties or
linkages that enable people to interact and learn from or derive support from each other. Any
network’s structure is made of nodes (generally individuals or organizations) that are tied by
one or more specific type of relationships. This could be linked to information exchange,
resource exchange and collaboration around activities or mutual support or enforcement. The
ONA can be used as a tool to track the exchange of information and resources, including
funding, equipment, supplies, training or intellectual capital, as well as the strength and
quality of relationships and collaboration between stakeholders in a given network.
Networks of individuals and organizations pursuing similar goals exist everywhere in human
society and can become the backbone of a successful society or institution. However, many
struggle to reach their full potential for a number of reasons, for example ineffective
communication, poor leadership, low interpersonal trust, and a lack of resources. On one
hand, when individuals and organization face complex and persistent challenges, it can be too
much to tackle alone. On the other hand, when people reach out to others and unite as a
network under a common goal, leveraging knowledge, talent, and resources, anything is
possible. This is where Pact’s network strengthening approaches, including tools like ONA,
can find application in biodiversity conservation and climate change adaptation, and are
particularly helpful in designing project support. Through earlier studies like Community
Performance Index (CPI) and Applied Political Economic Analysis (APEA), Pact has
identified several challenges which ONA will try to address. These are:
1. Low co-management governance capacity of fisheries resources particularly at district
and community level
2. Overfishing due to the “open access” nature of fisheries and poor enforcement and low
regulatory compliance in fisheries co-management
3. Lack of sufficient communication and coordination between stakeholders to better
manage fisheries resource use
1.1. Objectives of ONA
The objective of this activity is to identify strengths and weaknesses of Beach Village
Committees (BVCs) and Fisheries Associations (FAs), as well as their governance and
support networks, and to ultimately inform the development of network strengthening plans
and actions to achieve a shared vision of sustainable fisheries management.

Fisheries Integration of Society and Habitats (FISH) Project, Award no. AID-612-A-14-00004, December 2015 2
1.2. Expected Outputs
The expected outputs from ONA are to:
1. Produce ONA maps and metrics showing how local structures in the targeted districts of
Machinga and Mangochi network in fisheries management
2. Guide the BVC/FA organization and networking for fisheries co-management
3. Inform FISH partners on the development of appropriate BVC/FA network strengthening
plans and strategy, and guiding the inclusion in the lake management plan and
mainstreaming in the District Development Plan (DDP)
2. Introduction to the ONA Methodology
(ONA is a tool that helps visualize patterns of interaction among members of a network. The
results of an ONA application are also informative for discussions about network
effectiveness or network strengthening. The tool analyses social relationships between
organizations in terms of nodes and ties. Nodes are the individual organizations within a
network, and ties are the relationships between those organizations.
Pact’s approach to ONA involves the following three stages.
1. Participant survey: A network analysis survey tool is developed by facilitators, often in
collaboration with participants. The survey includes questions about the flows of
information, resources, and collaboration that are important to the network.
Network surveys may be undertaken with a bounded group, in which case answers are
limited to a predefined cadre of individuals or organizations. Alternatively, surveys may
be unbounded, in which case respondents are encouraged to enter the name of any
individual or organization with whom they have interacted in the manner described by the
question.
To maximize participant understanding and data quality, surveys are usually facilitated
with the full group of participants present. However, surveys may also be implemented
with small groups, as individual interviews or as surveys sent to participants.
2. Data analysis: The results of the ONA survey are input into InFlow, a network analysis
software application. InFlow has inbuilt algorithms that generate network maps,
positioning organizations or individuals according to their connections with others.
InFlow also includes a range of performance measurements that can be used to generate
deeper understanding and support the monitoring of network development over time.
3. Participatory feedback: Although the network maps and metrics are useful in their own
right, they are most powerful when used to facilitate discussions with network members.
The questions generated by analyzing the ONA results can help to draw out extremely
valuable qualitative observations about a network that can form the basis of a plan to
increase network effectiveness.
ONA provides key information that can be used to develop strategies for network
strengthening. ONA maps can be compared over time to analyze progress made by members
in strengthening relationships among network members. They can also help to identify key
resource or information organizations in the network and members that are isolated and/or
underutilized. ONA maps also help to visualize where information/resource bottlenecks occur

Fisheries Integration of Society and Habitats (FISH) Project, Award no. AID-612-A-14-00004, December 2015 3
and strategize ways to improve collaboration among network members given existing
patterns.
3. Baseline ONA Process in Mangochi and Machinga
On August 4–7, 2015, FISH facilitated ONA survey meetings in three traditional authorities
where the project is being implemented. The survey was conducted in two TAs in Mangochi,
TA Chowe with structures operating around Lake Malombe and TA Mponda with structures
operating around Lake Malawi, while one TA was selected in Machinga, TA Kawinga with
structures operating around Lake Chilwa. ONA feedback sessions were conducted on
September 1–4, 2015 in the same TAs. These TAs were selected as a representative sample
of all TAs where FISH is being implemented, with the assumption that the results of the
ONA survey from these areas will be similar to all areas and that the network strengthening
strategies developed from these areas will be replicated in all the TAs of the project. An
average of 15 structures and organizations involved in the fishing industry from each of these
TAs participated in the surveys and the feedback meetings. The meetings were organized
with the support of the District Fisheries Office (DFO) in each of the two districts.
The objectives of the meetings were to:
Collect ONA surveys from participants: government departments, fish structures, and
nongovernmental organizations (NGOs) implementing FISH-related activities in each TA
Discuss the challenges and find solutions to networking and collaboration, and to
strategize and plan on how to formalize and strengthen a FISH network in the TA
3.1. Meeting Agenda
Pact presented on the ONA methodology during the first meeting to clarify ONA for
participants. During the meeting, participants practiced filling out the ONA survey form and
the group went through the process together to ensure the quality of data collected. During
the feedback meeting participants discussed the results by looking at the network map and
comparing it to the network metrics which came out. Participants discussed
challenges/barriers that they have been experiencing with networking and determined
solutions to the barriers/challenges, which they presented in plenary, where more discussions
followed.
3.2. Plenary Discussions
The following barriers/challenges to networking were discussed in plenary:
Lack of resources and adequate funds to help conduct meetings
Knowledge gap on interpersonal communication
Lack of coordination meetings
Negative attitude/approach of government officers in the area on the issues (e.g.,
fisheries, agriculture, health)
Poor reporting channels
Lack of leadership commitment to keep the network active
The strategies to brainstormed to improve networking include:
Commitment even when meetings are not funded
Fairness in sharing resources
Conduct interface or coordination meetings

Fisheries Integration of Society and Habitats (FISH) Project, Award no. AID-612-A-14-00004, December 2015 4
Continuity in member representation (proper handovers when leaving station)
Ability to share locally available resources
Improve funding from partners running the programs
Improve attitude through civic education
Conduct meetings and exchange visits between districts for cross learning
Improve channels of communication/reporting by sharing experiences
Conduct regular network meetings
Reporting issues to relevant authorities (e.g., district level, donor)
Capacity building on networking
More qualitative information from the feedback sessions is discussed in detail in Section 4.
The ONA survey questionnaire (annex) filled out by participants included the following
question:
In the past 6 months, how often have you exchanged information or resources related
to fishing activities with the organizations on the following list? Please enter a
number from the scale below to indicate the frequency with which you collaborated
with each organization (leave blank if there was no collaboration).
5: Daily/Several Times a Day
4: Weekly/Several Times a Week
3: Monthly/Several Times a Month
2: Several Times a Year
1: Once or Twice in a Year
4. ONA Results
4.1. Results of TA Chowe ONA
Figure 1 shows the ONA map for TA Chowe. The arrows on the map indicate the direction of
the relationship. Connections in a network occur in two directions, from participant A to
participant B and from participant B to participant A. Since participants complete separate
survey forms, their answers do not necessarily mirror one another, and it is not uncommon
for network members to report links with others that are unreciprocated.

Fisheries Integration of Society and Habitats (FISH) Project, Award no. AID-612-A-14-00004, December 2015 5
Figure 1. ONA Map for TA Chowe
The color of the nodes indicates the type of organization:
Red: NGO
Green: BVC
Yellow: Chief
Deep Blue: VDC/ADC
Purple: Government Department
4.1.1 Analysis of TA Chowe Data
While most organizations that filled out the survey indicated that they are exchanging
information related to fisheries co-management with other organizations in the areas, there is
more room for enhanced collaboration. If all the organizations were exchanging/sharing
information, there would be 240 linkages (16 organizations * 15 possible links) in the
network map. However, in reality the number of linkages in the network is 107,
corresponding to a network density1 of 45%. This suggests that there is already more tangible
networking happening among the organizations in the TA. What needs to be done is just to
develop strategies on how to improve the collaboration further.
Degrees out describes the number of connections that a network member reports having the
other members. Nodes with high degrees out index scores are therefore those network
members that consider themselves to be particularly active in networking with others.
Emmanuel International seconded by group village headman (GVH) Kadewere then Nalikolo
1 Network density is a commonly used measure in ONA. It is a percentage calculated by dividing the
number of actual linkages in the network by the total number of linkages that would exist if every
network member were linked to every other member. Thus, the higher the network density, the more
connected the network is.

Fisheries Integration of Society and Habitats (FISH) Project, Award no. AID-612-A-14-00004, December 2015 6
VDC had the highest degrees out. Thirteen of the 16 organizations (81%) participating in the
ONA survey have reached out to other organizations to obtain information and/or resources
related to fisheries co-management. This indicates that there is some significant exchange
already happening among the organizations.
Table 1. Degrees Out for TA Chowe
Degrees out Name Degrees out Name
0.800 Emmanuel International 0.400 Agriculture
0.800 GVH Kadewere 0.400 Health
0.800 Nalikolo VDC 0.400 Nalikolo BVC
0.733 Chowe ADC 0.400 Nkata ADC
0.600 T/A Chowe 0.267 Parks and Wild life
0.533 Fisheries 0.000 Malawi Lake Basin
0.533 Forest 0.000 Nkata VDC
0.467 Sili BVC 0.000 VNRM
Degrees in describes the number of connections that other network members report having
with a particular network member. Nodes with high degrees in scores are therefore
considered to be key resource hubs for the network. It may be strategic for the network to
connect other members to these resources, or alternatively to direct members to currently
underutilized resources. Fisheries followed by Forestry and Chowe ADC had the highest
scores within the district. Fifteen organizations (94%) that are part of the network have
provided other organizations information and resources related to fisheries co-management
activities except Nkata ADC.
Table 2. Degrees In for TA Chowe
Degrees in Name Degrees in Name
0.800 Fisheries 0.400 Nkata VDC
0.733 Forest 0.400 Sili BVC
0.600 Chowe ADC 0.400 VNRM
0.600 Emmanuel International 0.333 Health
0.600 Malawi Lake Basin 0.267 GVH Kadewere
0.600 Nalikolo VDC 0.267 TA Chowe
0.533 Agriculture 0.200 Parks and Wild life
0.400 Nalikolo BVC 0.000 Nkata ADC
Although the connectivity of individual nodes (organizations in the map) is important, it may
not be those members with the most connections that hold the overall network together. The
between-ness score is an index score between 0 and 1 that describes the extent to which an
individual member acts as a bridge between different nodes, thus maintaining the viability
and sustainability of the overall network. Nodes with high between-ness scores are powerful
actors with the potential to make or break the network. They can also be bottlenecks by
holding up the flow of resources or information within the network. Forestry followed by

Fisheries Integration of Society and Habitats (FISH) Project, Award no. AID-612-A-14-00004, December 2015 7
Nalikolo VDC and Emmanuel International have the highest between-ness score in the
network. It was surprising to note that Forestry instead of Fisheries is at the core of this
network. Further scrutiny revealed that Forestry has more activities on the ground than
Fisheries and engages the communities throughout the year, while Fisheries only engage the
communities during the closed season.
Table 3. Between-ness Scores for TA Chowe
Between-ness Name Between-ness Name
0.100 Forest 0.011 TA Chowe
0.091 Nalikolo VDC 0.010 Agriculture
0.077 Emmanuel International 0.009 Health
0.063 Chowe ADC 0.008 Parks and Wildlife
0.056 Fisheries 0.000 Malawi Lake Basin
0.030 GVH Kadewere 0.000 Nkata ADC
0.021 Nalikolo BVC 0.000 Nkata VDC
0.021 Sili BVC 0.000 VNRM
If connectivity within a network is dominated by a small number of nodes with a particularly
high between-ness score, then the network is considered to be vulnerable. The network is
likely to fragment if one or more of the bridge nodes leave. The centrality score is an index
score for the entire network, based on the between-ness scores of individual actors. Centrality
scores range from 0 to 1, and any score approaching or exceeding 0.3 describes a network
that is vulnerable. This network has a centralization score of 0.074, making it a less
vulnerable network.
4.1.2. Qualitative Discussion of Results from TA Chowe
Initial observations. Participants were asked to look at the map and imagine it is a bicycle
tire. Then they were asked, “Who do you think are the hubs on the map?” The results reflects
a ranking of:
TA Chowe
Fisheries
Nalikolo VDC
Emmanuel International
GVH Kadewere
Sili BVC
Chowe ADC
According to the results this is also where most of the organizations go to get services,
information, and materials. Table 4 shows the roles of different institutions in the network.

Fisheries Integration of Society and Habitats (FISH) Project, Award no. AID-612-A-14-00004, December 2015 8
Table 4. Roles of Institutions that Network at TA Chowe on Fisheries Co-Management
Issues
Name of Institution Role of the Institution
GVH Kadewere Before anyone starts fishing activities they go first to the GVH to register
his/her name to find a place to stay. (They also go to the Fisheries
personnel to register the fishing gear).
A popular fish landing site in Lake Malombe is located at GVH Kadewere
and the GVH has good working relationship with the local communities.
Nalikolo VDC Health goes to the BVC to discuss with the members on illegal usage of
mosquito nets as a fishing gear.
Sili BVC share boundaries with Nalikolo BVC, and they work together
during closed season to confiscate illegal fishing gears.
Forest works with Nalikolo BVC by providing permits to collect firewood
in the Forest areas which is used for smoking fish.
Fisheries Provide extension services to fishing communities around Lake Malombe
West on fisheries co-management, for example fisheries legislation,
hygienic fish processing methods, and fish marketing.
Sili BVC Work closely with fishers and all the community members in the
implementation of fisheries co-management activities.
Chowe ADC Acts as a bridge between VDCs at the TA level and the District Council on
developmental projects at the district level.
Emmanuel
International
Most FISH activities in the area are spearheaded by Emmanuel
International because this is their working area as a partner in the project.
Parks and Wildlife Parks and wildlife work with fishermen all the times. They rescue fishers
when they are caught by crocodiles, the rangers hunt the crocodiles and
kill them. The interface of Liwonde National Park and Lake Malombe,
especially within the 100 meter band, is a protected area. Most of the fish
breed at this area and the national park rangers guard this area and as a
result of this protect the fish found there. They take all the poachers to
court once they are caught.
Game rangers go to the lake to set traps for crocodiles and other aquatic
mammals so that they protect fishermen and other local people from any
attack.
Agriculture Agriculture work hand in hand with Fisheries on co-management
activities, conservation activities, and food security issues.
At the end of the discussion, Parks and Wildlife reminded the fishermen to be very careful
when seining around the shallow fishing grounds near the emerged aquatic weeds because
this is the same areas where crocodiles like to rest early in the morning in search for fish to
eat. This type of fishing is called Usodzi Wadala.
TA Chowe gave his remarks on the importance of ONA activity: it acted as an eye opener to
the local-level institutions on the need for networking to promote fisheries co-management in
Lake Malombe. The TA wished that this could be a recurrent activity to enable partners to
discuss challenges and agree on ways forward.
What is the value chain network of the fish caught from Lake Malombe to the
consumer? Fish from Lake Malombe are caught by fishermen who sell to either fish traders

Fisheries Integration of Society and Habitats (FISH) Project, Award no. AID-612-A-14-00004, December 2015 9
or fish processors (sun drying, frying, cooking, brining, and smoking). After the fish is
processed it is sold to fish traders, and, if the fish is going to the city, transporters take the
fish to urban markets and deliver them to fish retailers who sell the fish to consumers. Figure
2 shows the Lake Malombe fish value chain.
Figure 2. Value Chain of Fish Caught in Lake Malombe
How do they fix fish prices? Fish has no fixed price; it depends on the catch of the day
(supply versus demand).
Changes in weather patterns, such as Mpoto winds versus Mwera winds, can cause an
elevation in price. Price also depends on the availability of fish from other lakes when fish
traders meet at the market; prices lower when more fish is available. Lack of storage facilities
to reduce spoilage also force the fish traders to sell the fish at lower prices.
4.2. Results of TA Mponda ONA
Figure 3 is the ONA map for TA Mponda.
Figure 3. ONA Map for TA Mponda
Fishers catch the
fish selling 99% of
the fish catch. Most
of the fish is sold
fresh without ice.
Fish traders/
processors possess
the fish for less than
one week and
selling 99% of the
fish.
Retail sector
vendors, restaurants
sell 99% of the fish
domestically to
consumers

Fisheries Integration of Society and Habitats (FISH) Project, Award no. AID-612-A-14-00004, December 2015 10
The color of the nodes indicates the type of organization:
Red: NGO
Green: BVC
Yellow: Chief
Deep blue: VDC/ADC
Purple: Government department
Sky blue: Private organization
4.2.1. Analysis of TA Mponda Data
While most organizations that filled the survey indicated that they are exchanging
information related to fisheries co-management with other organizations within the TA, there
is more room for enhanced collaboration. If organization were exchanging information, there
would be 240 linkages (16 organizations * 15 possible links) in the network map. In reality,
however, the number of linkages in the network is 72, corresponding to a network density of
30%. This suggests that there is already tangible networking happening among the
organizations in the TA. What needs to be done is just to develop strategies on how to
improve the collaboration further.
Degrees out describes the number of connections that a network member reports having with
other members. Nodes with high degrees out index scores are therefore those network
members that consider themselves to be particularly active in networking with others.
Michesi BVC seconded by fisheries then Namiasi BVC had the highest degrees out. Ten of
the 16 organizations (63%) that participated in the ONA survey have reached out to other
organizations to obtain information and/or resources related to fishing. This indicates that
there is some significant exchange already happening among the organizations.
Table 5. Degrees Out for TA Mponda
Degrees out Name Degrees out Name
0.933 Michesi BVC 0.133 Forest
0.733 Fisheries 0.133 Kela BVC
0.667 Namiasi BVC 0.000 FAO
0.600 Emmanuel International 0.000 GVH Kela
0.533 Koche ADC 0.000 GVH Michesi
0.400 Michesi VDC 0.000 Health
0.333 Community Development 0.000 Koche VDC
0.333 Kela VDC 0.000 Opportunity Bank
Degrees in describes the number of connections that other network members report having
with a particular network member. Nodes with high degrees in scores are therefore
considered to be key resource hubs for the network. It may be strategic for the network to
connect other members to these resources, or alternatively to direct members to currently
underutilized resources. Fisheries followed by Emmanuel International and GVH Michesi
had the highest scores within the district. All the 16 organizations (100%) that are part of the
network have provided other organizations information and resources related to fisheries co-
management.

Fisheries Integration of Society and Habitats (FISH) Project, Award no. AID-612-A-14-00004, December 2015 11
Table 6. Degrees In for TA Mponda
Degrees in Name Degrees in Name
0.467 Fisheries 0.333 Kela VDC
0.400 Emmanuel International 0.333 Opportunity Bank
0.400 GVH Michesi 0.267 Community Development
0.400 Koche ADC 0.267 GVH Kela
0.400 Michesi VDC 0.200 Michesi BVC
0.333 Forest 0.133 FAO
0.333 Health 0.133 Namiasi BVC
0.333 Kela BVC 0.067 Koche VDC
Although the connectivity of individual nodes (organizations in the map) is important, it may
not be those members with the most connections that hold the overall network together. The
between-ness score is an index score between 0 and 1 that describes the extent to which an
individual member acts as a bridge between different nodes, thus maintaining the viability
and sustainability of the overall network. Nodes with high between-ness scores are powerful
actors with the potential to make or break the network. They can also be bottlenecks by
holding up the flow of resources or information within the network. Fisheries followed by
Emmanuel International and Michesi BVC have the highest between-ness score in the
network.
Table 7. Between-ness Scores for TA Mponda
Between-ness Name Between-ness Name
0.228 Fisheries 0.010 Forest
0.162 Emmanuel International 0.007 Kela BVC
0.133 Michesi BVC 0.000 FAO
0.077 Koche ADC 0.000 GVH Kela
0.045 Community Development 0.000 GVH Michesi
0.039 Michesi VDC 0.000 Health
0.019 Kela VDC 0.000 Koche VDC
0.018 Namiasi BVC 0.000 Opportunity Bank
If connectivity within a network is dominated by a small number of nodes with a particularly
high between-ness score, then the network is considered to be vulnerable. The network is
likely to fragment if one or more of the bridge nodes leave. The centrality score is an index
score for the entire network, based on the between-ness scores of individual actors. Centrality
scores range from 0 to 1, and any score approaching or exceeding 0.3 describes a network
that is vulnerable. This network has a centralization score of 0.194, making it a less
vulnerable network.

Fisheries Integration of Society and Habitats (FISH) Project, Award no. AID-612-A-14-00004, December 2015 12
4.2.2 Qualitative Discussion of Results from TA Mponda
Table 8. Role of Different Institutions at TA Mponda that Network on Fisheries Co-
Management Issues
Name of Institution Role of the Institution
Koche VDC Showed only one network connection only. Its main role is to facilitate
developmental meetings at the GVH level related to fisheries co-
management and acts as a bridge between BVC and ADC at TA level.
GVH Kela Has so many network connections from other institutions because it
champions and arranges the community meetings related to fisheries.
Kela BVC The network tie is thin because the old BVC committee was not working
properly. The trawler owners who illegally fish in Area A of Lake Malawi
(prohibited to trawler fishing) corrupted previous BVC committee by
offering jobs to committee members in return for allowing them to fish in
Area A. hence it did not serve the interest of the other ordinary BVC
members. The new BVC committee is just 1 ½ months old and is trying
very hard to get back in control. Main role of the BVC is to work with the
fishers and all community members in the implementation of fisheries co-
management activities for example conducting awareness meetings on
recommended fishing gears and report the feedback to fisheries.
Opportunity Bank Have many network arrows pointing to them because fish traders and other
community members get loans to boost their fishing business. Provides
Small Medium Enterprises Loans to community members.
Health They work with fishers around the lake on health education and good
sanitation in the lakes especially migratory fishermen.
Forest Provide seedlings to communities planted along the major rivers that drain
in Lake Malawi and provide permit to access the forest reserve areas to the
community. People collect firewood for fish processing and timber for
making fishing boats. They also give technical advice to community
members who want to own private tree nurseries.
Active networkers. Fisheries, Emmanuel International, Koche ADC, and Michesi BVC are
the institutions holding the network together. Most of the community members go to these
institutions to get services and materials related to fisheries co-management. The current
percentage of the network is 30% but the participants wish it could reach above 50%.
4.3. Results of TA Kawinga ONA
Figure 4 is the ONA map for TA Kawinga.

Fisheries Integration of Society and Habitats (FISH) Project, Award no. AID-612-A-14-00004, December 2015 13
Figure 4. ONA Map for TA Kawinga
4.3.1 Analysis of TA Kawinga Data
Most organizations that filled out the survey indicated that they are exchanging information
related to fishing with other organizations in the TA, but there is more room for enhanced
collaboration. If organizations were exchanging information, there would be 156 linkages
(13 organizations * 12 possible links) in the network map. In reality, however, the number of
linkages in the network is 36, corresponding to a network density of 23%. This suggests that
there is already some form of networking happening among the organizations in the TA.
What needs to be done is to develop strategies on how to improve the collaboration further.
Degrees out describes the number of connections that a network member reports having with
other members. Nodes with high degrees out index scores are therefore those network
members that consider themselves to be particularly active in networking with others.
Mtengo Umodzi BVC seconded by Mtira BVC then Councilor had the highest degrees out.
Nine of the 13 organizations (69%) that participated in the ONA survey have reached out to
other organizations to obtain information and/or resources related to fishing. This indicates
that there is some significant exchange already happening among the organizations.
Table 9. Degrees Out for TA Kawinga
Degrees out Name Degrees out Name
0.667 Mtengo umodzi BVC 0.167 Mbanila VDC
0.500 Mtira BVC 0.083 Forest
0.417 Councilor 0.000 Bird Hunters Association
0.417 Fisheries 0.000 GVH Khuzumba
0.417 GVH Mtira 0.000 Health

Fisheries Integration of Society and Habitats (FISH) Project, Award no. AID-612-A-14-00004, December 2015 14
Degrees out Name Degrees out Name
0.167 Agriculture 0.000 MOMS
0.167 Kawinga ADC
Degrees in describes the number of connections that other network members report having
with a particular network member. Nodes with high degrees in scores are therefore
considered to be key resource hubs for the network. It may be strategic for the network to
connect other members to these resources, or alternatively to direct members to currently
underutilized resources. Health followed by Mbanila VDC and Mtira BVC had the highest
scores within the district. Twelve organizations (92%) that are part of the network have
provided other organizations information and resources related to fish programming except
Agriculture. A discussion on why not even one is connected to them showed that people are
not aware of the role of the Agriculture department in fishing. This belief was changed after it
was explained how they play a big role in the fishing industry.
Table 10. Degrees In for TA Kawinga
Degrees in Name Degrees in Name
0.667 Health 0.250 MOMS
0.417 Mbanila VDC 0.083 Councilor
0.333 Mtira BVC 0.083 Fisheries
0.250 Bird Hunters Association 0.083 Forest
0.250 GVH Khuzumba 0.083 Mtengo Umodzi BVC
0.250 GVH Mtira 0.000 Agriculture
0.250 Kawinga ADC
Although the connectivity of individual nodes (organizations in the map) is important, it may
not be those members with the most connections that hold the overall network together. The
between-ness score is an index score between 0 and 1 that describes the extent to which an
individual member acts as a bridge between different nodes, thus maintaining the viability
and sustainability of the overall network. Nodes with high between-ness scores are powerful
actors with the potential to make or break the network. They can also be bottlenecks by
holding up the flow of resources or information within the network. Mtira BVC followed by
Fisheries and Mtengo Umodzi BVC have the highest between-ness score in the network.
Table 11. Between-ness Scores for TA Kawinga
Between-ness Name Between-ness Name
0.136 Mtira BVC 0.000 Bird Hunters Association
0.037 Fisheries 0.000 Forest
0.037 Mtengo umodzi BVC 0.000 GVH Khuzumba
0.025 GVH Mtira 0.000 Health
0.025 Mbanila VDC 0.000 Kawinga ADC
0.012 Councilor 0.000 MOMS
0.000 Agriculture

Fisheries Integration of Society and Habitats (FISH) Project, Award no. AID-612-A-14-00004, December 2015 15
If connectivity within a network is dominated by a small number of nodes with a particularly
high between-ness score, then the network is considered to be vulnerable. The network is
likely to fragment if one or more of the bridge nodes leave. The centrality score is an index
score for the entire network, based on the between-ness scores of individual actors. Centrality
scores range from 0 to 1, and any score approaching or exceeding 0.3 describes a network
that is vulnerable. This network has a centralization score of 0.125, making it a less
vulnerable network.
4.3.2 Qualitative Discussion of Results from TA Kawinga
Table 12. Role of Institutions that Network at TA Kawinga on Fisheries Co-
Management Issues
Name of Institution Role of the Institution
WorldFish Had meeting at Namanja beach with Mtira BVC and Mtengo Umodzi to
coordinate Lake Chilwa management plans. Their main role is research on
fisheries and aquaculture currently they do not have a project in TA
Kawinga.
LEAD No contacts were done within the last six months. They have no activities
taking place at the moment.
Mtira BVC Mainly networks with Fisheries on co-management issues.
GVH Mtira Mainly networks with Fisheries on co-management issues.
Kawinga ADC Most of the institutions work in isolation they do not involve the ADC
members. They just involve the ADC at the initial stage of the project to
inform the ADC of their work in the area and continue working in
isolation.
Agriculture Provide extension services on improving food security in the area. It was
also noted that people in this area do not know that Fisheries Department
is under the Ministry of Agriculture.
MOMS This is a Management of Monitoring System under Parks and Wildlife.
They work with fishers around Lake Chilwa on different landing sites
helping fishermen in record keeping of the fish catches every day. They
provide measuring scales to track the number of fish caught on daily basis.
Health They work with fishers around the lake on good sanitation in the lakes
especially on the fishermen who stay in temporary shelters known as
Zimbowera on Lake Chilwa.
Forest Provide seedlings which they plant along the major rivers which drain into
Lake Chilwa and also permit to access the forest reserve areas to the
community. People collect firewood for fish processing and timber for
making fishing boats. Forest carries out similar activities.
4.4. Results of Fisheries ONA Plenary Discussions
The results of the plenary discussions are summarized in Table 13 and elaborated below:
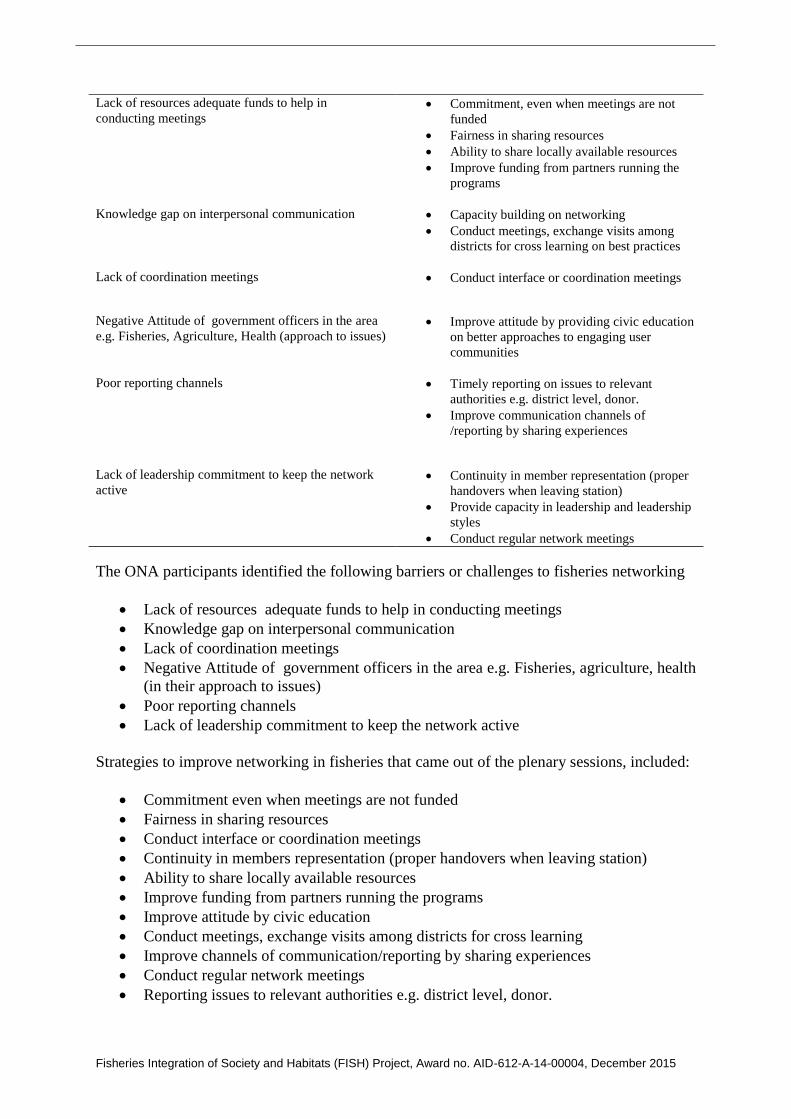
Table 13: Summary of Barriers and Solutions to Improve Co-management Networking in Fisheries
Challenges/Barriers Solutions
Fisheries Integration of Society and Habitats (FISH) Project, Award no. AID-612-A-14-00004, December 2015 16
Lack of resources adequate funds to help in
conducting meetings
Commitment, even when meetings are not
funded
Fairness in sharing resources
Ability to share locally available resources
Improve funding from partners running the
programs
Knowledge gap on interpersonal communication
Capacity building on networking
Conduct meetings, exchange visits among
districts for cross learning on best practices
Lack of coordination meetings
Conduct interface or coordination meetings
Negative Attitude of government officers in the area
e.g. Fisheries, Agriculture, Health (approach to issues)
Improve attitude by providing civic education
on better approaches to engaging user
communities
Poor reporting channels Timely reporting on issues to relevant
authorities e.g. district level, donor.
Improve communication channels of
/reporting by sharing experiences
Lack of leadership commitment to keep the network
active
Continuity in member representation (proper
handovers when leaving station)
Provide capacity in leadership and leadership
styles
Conduct regular network meetings
The ONA participants identified the following barriers or challenges to fisheries networking
Lack of resources adequate funds to help in conducting meetings
Knowledge gap on interpersonal communication
Lack of coordination meetings
Negative Attitude of government officers in the area e.g. Fisheries, agriculture, health
(in their approach to issues)
Poor reporting channels
Lack of leadership commitment to keep the network active
Strategies to improve networking in fisheries that came out of the plenary sessions, included:
Commitment even when meetings are not funded
Fairness in sharing resources
Conduct interface or coordination meetings
Continuity in members representation (proper handovers when leaving station)
Ability to share locally available resources
Improve funding from partners running the programs
Improve attitude by civic education
Conduct meetings, exchange visits among districts for cross learning
Improve channels of communication/reporting by sharing experiences
Conduct regular network meetings
Reporting issues to relevant authorities e.g. district level, donor.

Fisheries Integration of Society and Habitats (FISH) Project, Award no. AID-612-A-14-00004, December 2015 17
Capacity building on networking
More qualitative information from what came out during the feedback sessions has been
discussed in detail below under analysis of results for each TA.

Fisheries Integration of Society and Habitats (FISH) Project, Award no. AID-612-A-14-00004, December 2015 18
5. Summary of ONA Results from All Traditional Authorities
The results from all the three TAs shows that there is an average of 33% network density,
meaning that there is already more tangible coordination happening among the
community-level structures, which is advantageous to FISH. However, the network
density is low because there is no organization to coordinate meetings where successes
and challenges could be discussed.
Results have shown that Chiefs, both TAs and GVHs, have an important role in fisheries
co-management and this role must be taken note of. On the other hand there are also
structures and organizations working within the community which have more influence in
the fishing sector; BVC, VDC/ADC, Fisheries Department, Forestry Department, and
Agriculture Department. We have also noted that NGOs operating in these areas are
important stakeholders. Some stakeholders are health focused, though participants could
not clearly articulate their role, and commercial banks that provide capital in the fish
value chain.
Some BVCs understand their role in fisheries co-management, but there is need for more
civic education to cement their role and improve coordination with Chiefs and the
Fisheries department.
Stakeholders at the TA level understand the importance of coordinating their efforts in
fisheries co-management, but they require more support in terms of capacity development
and funding for this to be implemented.
6. Recommendations and Way Forward
The conclusions extracted from the ONA survey lead to the following recommendations.
FISH should take advantage of the fact that there is already low but tangible networking
and collaboration happening among the stakeholders at the TA level. It is important for
FISH to strengthen these linkages. This could include encouraging meetings between
these stakeholders monthly or quarterly. This should be linked to the organic meetings
that currently take place, such as at VDC and ADC or TA level. This process would help
stakeholders to tackle challenges they need to address, and FISH could act as a catalyst.
The same meetings may also be used for capacity building of the structures in fisheries
co-management, as well as for mainstreaming fisheries management in local development
planning. Meetings are the core activity, which ensures communication, coordination,
information exchange, and the like to enhance the functionality of a network.
One of the issues that came out of the feedback meetings from TA Mponda was that the
new BVC from Kela is not getting enough support from the Fisheries Department to curb
illegal fishing by trawlers in Area A of the eastern arm of the lake. This is just one of the
many challenges in coordinating and communicating among the stakeholders.

Fisheries Integration of Society and Habitats (FISH) Project, Award no. AID-612-A-14-00004, December 2015 19
Appendix 1. List of Organizations that Participated in the Survey, by Traditional Authority
No. Organization No. Organization No. Organization
TA Mponda TA Chowe TA Kawinga
1 Community Development 17 Agriculture 33 Bird Hunters Association
2 Emmanuel International 18 Chowe ADC 34 Councilor
3 FAO 19 Emmanuel International 35 Fisheries
4 Fisheries 20 Fisheries 36 Forest
5 Forest 21 Forest 37 GVH Khuzumba
6 GVH Kela 22 GVH Kadewere 38 GVH Mtira
7 GVH Michesi 23 Health 39 Health
8 Health 24 Malawi Lake Basin 40 Kawinga ADC
9 Kela BVC 25 Nalikolo BVC 41 MOMS
10 Kela VDC 26 Nalikolo VDC 42 Mbanila VDC
11 Koche ADC 27 Nkata ADC 43 Mtengo umodzi BVC
12 Koche VDC 28 Chowe VDC 44 Mtira BVC
13 Michesi BVC 29 Parks and Wild life 45 Agriculture
14 Michesi VDC 30 Sili BVC
15 Namiasi BVC 31 TA Chowe
16 Opportunity Bank 32 VNRM

Fisheries Integration of Society and Habitats (FISH) Project, Award no. AID-612-A-14-00004, December 2015 20
Appendix 2. ONA Survey Questionnaire
PACT FISH ONA SURVEY: MANGOCHI DISTRICT
Organization Name: _________________________________________________________
TA: _______________________________________________________________________
Name of Contact Person (filling form): _________________________________________
E-mail Address: ____________________________________________________________
Phone numbers: ____________________________________________________________
Type of Organization (Tick):
□ NGO □ CBO □ Government Office
***************************************************************************
In the past 6 months, how often have you exchanged information or resources related to
fisheries co-management with the organizations on the following list? Please enter a number
from the scale below to indicate the frequency with which you collaborated with each
organization (leave blank if there was no collaboration).
5: Daily/Several Times a Day
4: Weekly/Several Times a Week
3: Monthly/Several Times a Month
2: Several Times a Year
1: Once or Twice in a Year
# Name of Organization
Indicate frequency of collaboration
by inserting number from the scale
above (1 to 5).
1
2
3
4
5
6
7
8
9
10
11
12