Organizational effectiveness in the Navy: is participative ...
312
t>mmi w :;. •;..•') W$ ••«,.' Hip lai'vyfr
Transcript of Organizational effectiveness in the Navy: is participative ...

t>mmiw:;. •;..•') W$ ••«,.'
Hiplai'vyfr

'AL POSTGRADUATE SCHOOLMONTEP.EY. CA 93940


NAVAL POSTGRADUATE SCHOOL
Monterey, California
THESISORGANIZATIONAL EFFECTIVENESS INIS PARTICIPATIVE MANAGEMENT THE
THENAVY
NAVY:WAY?
by
Russell E. Tate
and
Michael E. Aston
December 1982
Thesis Advisor: Reube n Harris
Approved for public release; distribution unlimited
120 8807


SECURITY CLASSIFICATION OF THIS l»»Q| (Wham Pore (m««i
REPORT DOCUMENTATION PAGE2. GOVT ACCESSION NO
4. TITLE rene1
Sukfttfe)
Organizational Effectiveness in the Navy:Is Participative Management the Navy Way?
7. AuTHOMi'ij
Russell E. Tate andMichael E. Aston
» PERFORMING ORGANIZATION NAME ANO ADDRESS
Naval Postgraduate SchoolMonterey, California 93940
II. CONTROLLING OFFICE NAME ANO AOORESS
Naval Postgraduate SchoolMonterey, California 93940
TI MONITORING AGENCY NAME k AOORESSfl/ mnSmZi (torn Controlllne Office)
READ INSTRUCTIONSBEFORE COMPLETING FORM
» «Cl»llMT-SC»T»LOCMUM|f«
S TYRE OF REPOPT A P>EPIOO COVEPCOMaster's ThesisDecember 1982
S. PERFORMING ORG. D(»o«t numREP
S. CONTRACT OR GRANT H^mmtme,
10. program Element PROJECT taskAREA t WORK UNIT NUMBERS
12. RERORT DATE
December 1982II NUMBER OF PAGES
151IS. SECURITY CLASS, (ol ihit .»,„,
ISe. DECLASSIFICATION/ OOWnGAaOinGSCHEDULE
l«. DISTRIBUTION STATEMENT oi (Ala Aepero
Approved for public release; distribution unlimited
17. DISTRIBUTION STATEMENT (at frte mmmttmct mntmr^d In Sleek 20, /f different free* Report;
<• SURRLEMENTARY NOTES
*» KEY WORDS (Canilmim on reeeree ttoe II neceeaerr «"« lewntlfr ky Mock niaakeo
Organizational Effectiveness, Participative Management
20 ABSTRACT Cantlnu* on reverse aloe II neceeaerr •»« lwon»r> kr kleek nuaker;
This research study presents a comparative analysis of how a sam-ple representing ten different paygrades of U.S. Navy personnelview organizational effectiveness. The ten groups that were sur-veyed and interviewed include enlisted personnel E-5 through E9,and officer personnel 0-2 through 0-6. They came primarily fromEast Coast Surface, Aviation and Submarine commands. The instru-ment used to collect the data was a modified version of the Navy'sHuman Resource Management Survey (1977 FIppt- wr^innl. Th o
DO, *£n 1473 EDITION OF t MOV •• IS OBSOLETE
S/N 102-014- *60t |
SECURITY CLASSIFICATION OF TMIS RAGE ,'Bfcen Oere Entered


tutu**** CL*m>'C«Ttoii 90 Twit »>oac—1— n»$m <»«—»<
modifications allowed sample personnel to associate organizationalprocesses and managerial styles with organizational effectivenessusing Likert's four 'Systems of Management'. Comparative analyseswere made on the basis of rank, length of time in service, priorattendance at the Navy's Leadership Management Education andTraining course, primary location of Navy service, and type ofwarfare community. Interviews were used to provide both a con-textual framework for and a greater understanding of the surveyresponses.


Approved for public release; distribution unlimited
Organizational Effectiveness in the Navy:Is Participative Management the Navy Way?
by
Russell E. TateLieutenant Commander, United States NavyB.S., Northern Arizona University, 1971
and
Michael E. AstonCaptain, United States Army
B.A., Idaho State University, 1973
Submitted in partial fulfillment of therequirements for the degree of
MASTER OF SCIENCE IN MANAGEMENT
from the
NAVAL POSTGRADUATE SCHOOLDecember 1982

c>i

LIBRARY, NAVAL POSTGRADUATE SCH'
MONTEREY, CA 93940
ABSTRACT
This research study presents a comparative analysis of
how a sample representing ten different paygrades of U.S.
Navy personnel view organizational effectiveness. The ten
groups that were surveyed and interviewed include enlisted
personnel E-5 through E-9, and officer personnel 0-2 through
0-6. They came primarily from East Coast Surface, Aviation
and Submarine commands. The instrument used to collect the
data was a modified version of the Navy's Human Resource
Management Survey (1977 Fleet version). The modifications
allowed sample personnel to associate organizational
processes and managerial styles with organizational
effectiveness using Likert's four 'Systems of Management'.
Comparative analyses were made on the basis of rank, length
of time in service, prior attendance at the Navy's Leadership
Management Education and Training course, primary location of
Navy service, and type of warfare community. Interviews were
used to provide both a contextual framework for and a greater
understanding of the survey responses.


TABLE OF CONTENTS
I
.
INTRODUCTION 10
II
.
LITERATURE REVIEW 14
A. INTRODUCTION 14
B. DEFINITION OF OD 15
C ORGANIZATION UNIVERSALS 17
D. REVIEW OF MANAGEMENT THEORIES 18
1
.
Contingency Theor ies 18
2
.
Normative Theor ies 26
E
.
SUMMARY 29
III. BACKGROUND . ., 32
A. HISTORY OF OD IN THE NAVY 32
B. THE HRM CYCLE 45
C. SURVEY GUIDED DEVELOPMENT, SYSTEM FOUR ANDTHE U.S. NAVY 47
D. THE IMPACT OF SURVEY GUIDED DEVELOPMENTIN THE NAVY 51
E
.
SUMMARY 54
IV. METHODOLOGY 55
A. RESEARCH HYPOTHESIS 55
B. DATA COLLECTION METHODS 56
C
.
SAMPLE CHARACTERISTICS 59
D. SURVEY ANALYSIS PLAN 62


V. ANALYSIS AND CONCLUSIONS 64
A. SURVEY RETURN 64
B
.
GROUP MEAN DATA 71
1. Overall Sample Results 74
2
.
Mean Scores by Rank 75
3. Mean Scores by Time in Service 76
4
.
Mean Scores by LMET 77
5
.
Mean Scores by Area 78
6
.
Mean Scores by TYCOM 78
C. STATISTICAL ANALYSIS OF GROUP MEAN DATABY RANK 80
1. Junior Enlisted Versus Senior Enlisted .... 81
2. Junior Enlisted Versus Junior Officer 83
3. Junior Enlisted Versus Senior Officer 88
4. Senior Enlisted Versus Junior Officer 92
5. Senior Enlisted Versus Senior Officer 96
6. Junior Officer Versus Senior Officer 97
D. STATISTICAL ANALYSIS OF GROUP MEAN DATA BYTIME IN SERVICE 98
1. First Termers Versus Midgraders 98
2. First Termers Versus Careerists 100
3. First Termers Versus Careerists Plus 101
4. Midgraders Versus Careerists 103
5. Midgraders Versus Careerists Plus 103
4
6. Careerists Versus Careerists Plus 104
E. STATISTICAL ANALYSIS OF GROUP MEAN DATA BYLMET 104
6


F. STATISTICAL ANALYSIS OF GROUP MEAN DATA BYAREA 106
G. STATISTICAL ANALYSIS OF GROUP MEAN DATA BYTYCOM 107
1. Surface Versus Aviation 107
2. Surface Versus Other (Subsurface) 109
3. Aviation Versus Other (Subsurface) 109
H. SUMMARY OF GROUP MEAN DATA 110
I . INTERVIEW RESULTS 112
1. Morale and Welfare 114
2. Work Group Functioning and Supervision .... 115
3. Order and Discipline 116
4
.
Lower Level Influence 117
5
.
HRM Success 118
VI . CONCLUSIONS AND RECOMMENDATIONS 122
A. CONCLUSIONS 122
B. RECOMMENDATIONS 127
APPENDIX A: SURVEY 130
APPENDIX B: QUESTION SELECTION CRITERIA 134
APPENDIX C : INTERVIEW QUESTIONS 139
APPENDIX D: DATA CODE BOOK 14 2
LIST OF REFERENCES 146
INITIAL DISTRIBUTION LIST 150


LIST OF FIGURES
5.1 Distribution by Rank 67
5.2 Distribution of Rank in the Jet Trng Sqdn 68
5.3 Distribution by Sex 68
5.4 Distribution by Time in Service (TIS) 69
5.5 Distribution by Area 70
5.6 Distribution by Type of Command (TYCOM) 70
5.7 Distribution by Attendance at LMET 71
5.8 Distribution of Non-attenders at LMET by Rank .... 72
5.9 Index by Rank Subgroup Scores Using Likert'sDimensions Ill


LIST OF TABLES
I. Survey Distribution and Return Rate by Command .... 65
II. Return Rates and Sample Means by Command 66
III. Table of Means by Respondent Subgroup 73
IV. Index by Rank Subgroup Score 82
V. Index by Time in Service Subgroup Score 99
VI
.
Index by LMET and Area 105
VII. Index by Type of Community 108
VIII. Interviews by Rank and Station 112
IX. HRM Success Scores by Rank Subgroups 118


I. INTRODUCTION
The purpose of this paper is to investigate the
perceptions of Navy personnel as to what an effective Navy
organization should look like. The authors are continuing a
project started in 1981 directed at assisting in determining
where the Navy's Human Resource Management Program should be
headed in the future. We are continuing the work presented
in a thesis by Mark Gettys and Arthur Maxwell [Ref. 1] which
compared perceptions of Army and Navy officers as to what an
effective military organization should look like.
The research questions we are addressing are, "What are
the perceptions of experienced fleet personnel of what an
effective Naval organization should look like?" and "Are
these perceptions consistent with participative management?"
The Navy's HRM survey is grounded in the theories and
research that were developed over time in private industry.
The HRM survey presently being used by the Navy was developed
from the Survey of Organizations which is based on Rensis
Likert's systems of management, discussed later in this
paper. Likert theorized that organizations would be most
effective when they used a participative-group (System Four)
style of management.
10


Is participative management really the style of
management the Navy espouses or desires? Given constraints
established by the military culture such as the high value
placed on the integrity of the chain of command, emphasis on
communications, command and control, and the carrying of rank
on the shoulder, is participative management the best path in
seeking organizational effectiveness? Or, would a different
style of management such as Likert's 'System Three'
(consultative management) be a more accurate means of
achieving and measuring military organizational
effectiveness?
The purpose, then, of this study is to: (1) examine the
perceptions of experienced personnel to determine what an
effective Naval organization should look like; (2) suggest an
alternative to the current method of assessing the
effectiveness of Naval organizations; and (3) to provide a
preliminary assessment of whether there is a perceived
relationship between organizational effectiveness and styles
of management in the Navy.
Another relevant issue that will be addressed in this
study is the respondents' perceptions of the levels of past
success, present success, and the potential for success in
the future for the HRM program. It was interesting to note
that respondents in the Gettys-Maxwell study estimated future
potential for the Navy's HRM program success lower on the
11


average than present program satisfaction. Why would they
view the future potential for success as lower than the
present level of success? Is this an indication that they
perceived less importance being placed on the HRM program?
Is it an indication that HRM personnel need to do a better
job of selling their program? Or, possibly, are there no
longer any significant organizational problems in the Navy?
Through the use of interviews, we hope to be able to get a
better understanding of why respondents answered the way they
did.
We will also compare the perceptions of enlisted
personnel to those of officer personnel. This will help us
determine if there are any significant differences in the
perceptions of the two groups in reference to organizational
effectiveness and the style of management needed in the Navy.
We will also make comparisons between surface line and
aviation personnel and personnel assigned to west coast
commands versus east coast commands to see if there are any
significant differences in the perceptions of these groups. A
comparison will also be made between those who have attended
LMET and those who have not.
Chapter Two will review briefly some of the relevant
management and leadership theories that have been developed.
Chapter Three will then review the background and history
that has led the HRM program to the point that it is at at
12


the present. Chapter Four will present the hypothesis and
methodology of this study. Chapter Five will discuss the
analysis and results of the data. Finally, Chapter Six will
present the conclusions and recommendations of the study.
13


II. LITERATURE REVIEW
A. INTRODUCTION
From the beginning of history man has tried to deduce how
organizations might best be structured and how they could
best function to create the order and stability necessary for
the preservation of the organization. The trend has been to
develop a description of the "best" form of organization, as
illustrated clearly by Weber's early work on the theory of
bureaucracy. Following this work, many other administrators,
theorists, executives and scholars developed models, schemes,
principles and systems for the structure and functioning of
organizations, always aimed at describing how to operate an
effective and lasting system.
Some of the early theorists, such as Taylor, Gulick and
Urwick developed tightly defined, almost rigid, sets of
principles which supposedly created well-defined and
structured organizations. The shift to an emphasis on the
human side of organizations appeared as early as Mary Parker
Follett's "The Giving of Orders" in 1925 and broadened
considerably in the 1930's and 1940's with investigators such
as Roethlisberger and Dickson and executives such as Barnard.
More recently, a new focus of concern has been explored by
theorists and investigators such as Likert, Blake and Mouton,
14


Hersey and Blanchard, Tannenbaura and Schmidt, Fiedler, and
House. This focus is in the field of organizational change
or organizational development (OD)
.
This new field represents a trend toward change,
innovation, challenge, and development of organizational
functioning as compared to earlier concern for stability and
certainty. This shift in emphasis is not surprising given
the incredible rate of change that society has experienced
over the past hundred years and the continuous increase in
this rate of change.
B. DEFINITION OF OD
Before we consider these aforementioned theories, we want
to review briefly just what is meant by OD. Frohman and
Sashkin provide the following definition:
Operationally, organizational development is a plannedeffort to improve the functioning and effectiveness of anentire system through applications of behavioral scienceknowledge to the processes and structures of the system[Ref. 2].
This definition has several important elements to consider.
First of all, the change effort must be related to the total
organization. It may affect such areas as skills, attitudes
and knowledge but its primary emphasis will be on factors
such as leadership, group processes, roles, and inter-group
relations.
The second important element refers to the goal of OD,
that of improving the organizational functioning and
15


effectiveness. Organizational effectiveness can include such
criteria as the organization's ability to adapt to both
external and internal demands; the processes by which goals
are defined, the degree to which they are shared, and the
success of the system in attaining goals; the integration of
individuals and groups into the organization and the
communication process supporting such integration; and the
climate of the system in terras of the degree of support and
freedom provided to its members [Ref. 3].
The third element of the definition is that OD works on
the "processes and structures of the system". Processes are
the dynamic, on-going social and psychological factors by
means of which the organization actually functions.
Structures are a framework or configuration of the
organization's members relative to one another. Chain of
command, authority, and hierarchy are examples of structural
factors.
Finally, OD is a planned effort. It is a systematic
diagnosis of the organization, the development of a strategic
plan for improvement, and the mobilization of the necessary
resources to carry out the change. This effort must be
managed from the top, with top management actively
participating in the effort, and with both a knowledge of and
a commitment to the goals of the change effort [Ref. 4].
16


C. ORGANIZATION UNIVERSALS
Robert R. Blake and Jane S. Mouton discuss several
characteristics that seem to them to be universal to all
organizations. Effective management of these universals is
the condition of efficient production through sound
organizations [Ref. 5],
The first universal is purpose . Identifying the purpose
of the organization is not always an easy task. However,
those searchers who have tried to identify organizations that
do not have a purpose have not been successful. No matter
the type of organization, educational, governmental,
military, religious, family or industrial, all have a
purpose. Unfortunately, however, all too frequently the
purpose for which the organization exists is not the same
(and may be contradictory) to the purpose people experience
as a basis for joining or remaining in the organization.
Another universal is people . All organizations have them
and organization purpose cannot be accomplished without them.
Needing more than one person to achieve a result such as
production of a thing or providing a service is what leads to
the condition of organization.
The third universal is hierarchy . The process of
achieving organization purpose (the first universal) through
the efforts of several people (the second universal) results
in some people attaining authority to supervise others; that
17


is to exercise responsibility for planning, controlling, and
directing the activities of others through hierarchical
arrangement (the third universal) [Ref. 6]. Some people are
bossed and some are bosses. The foundation for understanding
management is in recognizing that the boss's actions are
based on his/her assumptions of how supervision should be
exercised [Ref. 7]. By necessity, organizations are
hierarchical and no matter how it is used, hierarchy is seen
as an essential condition of organization.
As mentioned earlier, the emphasis placed on the chain of
command, the wearing of rank on the shoulder and the idea of
communications, command and control in the military, describe
the hierarchical conditions so strongly set in the military
culture.
In the next section, we will review some of the theories
that have been presented as organizational development
methods to help organizations achieve their purpose
effectively through people by bosses.
D. REVIEW OF MANAGEMENT THEORIES
1. Contingency Theories
As early as 1925, theories were being presented that
espoused some form of participative management. In her paper
"The Giving of Orders", Mary Parker Follett summarizes
"...Integration being the basic law of life, orders shouldbe the composite conclusion of those who give them andthose who receive them; more than this, that they should be
18

the integration of the people concerned and the situation;more even than this, that they should be the integrationsinvolved in the evolving situation" [Ref. 8].
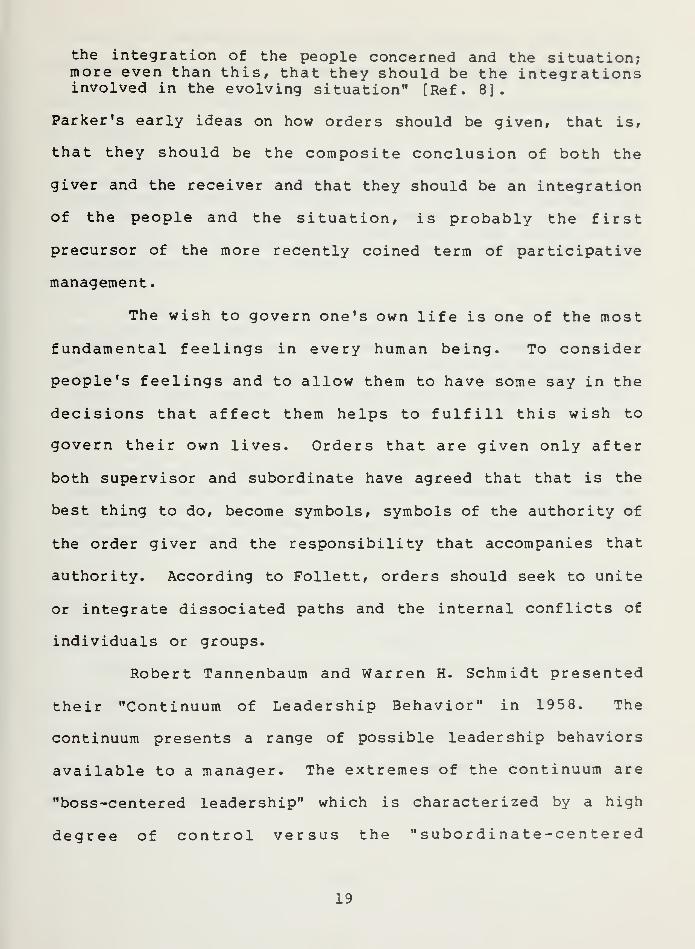
Parker's early ideas on how orders should be given, that is,
that they should be the composite conclusion of both the
giver and the receiver and that they should be an integration
of the people and the situation, is probably the first
precursor of the more recently coined term of participative
management.
The wish to govern one's own life is one of the most
fundamental feelings in every human being. To consider
people's feelings and to allow them to have some say in the
decisions that affect them helps to fulfill this wish to
govern their own lives. Orders that are given only after
both supervisor and subordinate have agreed that that is the
best thing to do, become symbols, symbols of the authority of
the order giver and the responsibility that accompanies that
authority. According to Follett, orders should seek to unite
or integrate dissociated paths and the internal conflicts of
individuals or groups.
Robert Tannenbaum and Warren H. Schmidt presented
their "Continuum of Leadership Behavior" in 1958. The
continuum presents a range of possible leadership behaviors
available to a manager. The extremes of the continuum are
"boss-centered leadership" which is characterized by a high
degree of control versus the "subordinate-centered
19


leadership" characterized by a high degree of subordinate
freedom. Using this continuum as a guide, the manager
considers three important factors or forces in deciding how
to manage.
(1) Forces in the manager. Among the important internalforces affecting the manager will be his value system, hisconfidence in his subordinates, his own leadershipinclinations and his feelings of security in an uncertainsituation. If the manager understands that these forcesinfluence his behaviors either consciously orunconsciously, he can often make himself or herself moreeffective.
(2) Forces in the subordinate. Some of the forces thatneed to be considered in the subordinate are the degree ofneed for independence, the degree of readiness to assumedecision making responsibility, the degree of tolerance forambiguity, and the degree of understanding and accepting oforganizational goals. The manager will generally find thata greater degree of freedom is allowed as the sum of theseforces rises within his subordinates.
(3) Forces in the situation. Certain characteristics ofthe general situation will also affect the manager'sbehavior. Among the more critical environmental pressuresthat surround him are those which stem from the type oforganization, work group effectiveness, the nature of theproblem and the pressures of time [Ref. 9].
The successful leader then is one who is aware of
these forces. He understands himself, the individuals in the
group he's dealing with and the organization and environment
in which he operates. More than this, he is one who is able
to assess the forces that should determine his behavior at
any given time. When direction is called for, he can direct
and when considerable participative freedom is called for, he
can allow such freedom.
20


The continuum of leadership behavior, then, is
situational, providing an excellent overview of numerous
factors that are relevant to effective leadership. Rather
than espousing a "one best way" of managing, it assists the
manager in determining the most appropriate style of
leadership in a given situation.
Another contingency approach to leadership is Paul
Hersey and Kenneth H. Blanchard's "life cycle theory". From
this perspective, the leadership style that would be most
effective varies with the maturity of subordinates. Here,
maturity is defined as the desire for achievement,
willingness to accept responsibility, and task-related
ability and experience.
Hersey and Blanchard believe that the relationship
between a manager and his subordinates moves through four
phases as the subordinates develop and "mature", and that
managers need to vary their leadership style with each phase.
In the initial phase, as subordinates first enter the
organization, for example, a high task orientation by the
manager is most appropriate because maturity is low.
Subordinates have to be instructed in their tasks and
familiarized with the organization's rules and procedures. A
non-directive manager at this point would only cause anxiety
and confusion among new employees.
21

As subordinates begin to learn their tasks, a task
orientation by the manager remains necessary but begins to
decrease. The manager will start to use an employee-oriented
leadership style as subordinates become more and more
familiar with the organizational rules and procedures.
As they move into the third phase, the subordinates'
ability and achievement motivation have increased and they
actively seek greater responsibility. The manager will no
longer need to be as directive but will continue to be
supportive and considerate in order to strengthen the
subordinates' resolve for greater responsibility.
In the last phase, the subordinates gradually become
confident, self-directing, and experienced and the manager
reduces the amount of support and encouragement provided.
Here, both task and relationship behaviors are low. The
subordinates are on their own and no longer need or expect a
close relationship with their manager.
This theory suggests that participation becomes more
effective as the task-related maturity of the subordinate
increases. The lower the task-related maturity, the more
effective an authoritarian style of leadership would be. Use
of the appropriate style will not only motivate subordinates
but will also help move them toward "maturity". As the
subordinates develop, the manager will constantly be shifting
his/her leadership style.
22


The contingency model of leadership was one of the
earliest and most articulated of the leadership theories.
According to this model developed by Fred E. Fiedler, the
effectiveness of a group depends on the interaction between
the leader and the situation. This requires matching the
leader's motivational structure as indicated by the goals
given the highest priority with the degree to which the
situation is favorable or unfavorable to the leader.
The leader may be task motivated or relationship
motivated. Leader motivation is measured by the least
preferred co-worker (LPC) scale which asks the individual to
describe, on the measuring scale, the one person, of all the
people with whom he or she has ever worked, with whom he or
she could work least well. An individual who described his
or her LPC in negative and rejecting terms is a low-LPC or
task-motivated person. Someone who described his or her LPC
in relatively positive terms is a high-LPC or relationship-
motivated person.
Fiedler's model presents three component dimensions
that affect the degree to which the situation provides the
leader with potential power and authority. These are leader-
member relations, task structure, and position power. The
leadership implications of the model are that
(1) Relationship-motivated (high-LPC) leaders generallyperform best in situations in which their relations withsubordinates are good but task structure and position power
23


are low or when relationships with subordinates are poorbut task and position power are high.
(2) Task-motivated leaders (low-LPC) perform best when allthree situational factors that define their control andinfluence are either high or low.
Fiedler's Theory is that group effectiveness can be improved
by either changing the leader's motivational structure (basic
goals) or by modifying the leadership situation. Because it
is difficult to change the motivation structure, which is a
part of the personality of the leader, Fiedler prefers the
modifying of the situation and believes it is relatively easy
to accomplish by selecting certain leaders for certain tasks,
giving less responsibility to certain leaders, or by
providing leadership training to increase the leader's power
and influence. This amounts to engineering the work
situation or the job to fit the manager [Ref. 10].
The last contingency theory of leadership that we
will consider is the "path-goal" theory presented by Robert
J. House. Here, the leader's function is seen as a
supplemental one. The leader provides subordinates with
coaching, guidance and rewards that are necessary for
effective performance. Also, the impact of the leader's
behavior is determined by the situation in which the leader
is operating and by dealing with the situation appropriately.
Two contingency variables that the leader must consider are
the characteristics of the subordinate and the environmental
pressures and demands with which subordinates must cope in
24


order to accomplish the work goals and to satisfy their own
needs.
With respect to the first class of contingency
factors, the characteristics of subordinates, path-goal
theory asserts that leader behavior will be acceptable to
subordinates to the extent that they see such behavior as
either an immediate source of satisfaction or instrumental
to future satisfaction; subordinates with high affiliation
needs would see a considerate leader as a source of
satisfaction. Those with high achievement needs would likely
see initiating structure or behavior that facilitates task
accomplishment as a source of satisfaction.
The characteristics of the environment of the
subordinate or task demands, with which the subordinate must
cope, also determine effective leader behavior.
Unstructured, nonroutine tasks can be effectively handled if
the leader initiates structure. However, if the work methods
are of a routine nature, the initiation of additional
structure or close supervision would be perceived as
unnecessary. Also, for unsatisfying tasks, consideration is
of great importance.
The idea that effective leadership behavior is
contingent on worker and task characteristics has been
generally supported by research [Ref. 11]. It not only
suggests what type of style may be most effective in a given
25


situation, but it also attempts to explain why it is most
effective. However, House cautions that because path-goal
theory is relatively new to the literature of organizational
behavior, it is offered more as a tool for directing research
and stimulating insight than as a proven guide for managerial
action [Ref . 12]
.
2. Normative Theories
In their thesis, Gettys and Maxwell discussed Rensis
Likert's Four Systems of Management and James Price's
Organizational Effectiveness Theories in great detail. As in
the previous section we will discuss only briefly the
normative leadership models of Rensis Likert and Robert R.
Blake and Jane S. Mouton.
The four management systems described by Likert are
(1) exploitive authoritarian, (2) benevolent authoritative,
(3) consultative, and (4) participative group [Ref. 13]. The
four management systems are based on differing attitudes of
trust and confidence in subordinates. For example, System
One is characterized by a lack of confidence and trust in
people, use of fear and punishment, little interaction
between superiors and subordinates, and centralized decision
making at the top. System Four, participative group, on the
other hand, is the opposite extreme, characterized by trust,
confidence, participation, extensive interaction, and so on.
Between Systems One and Four are varying degrees of these
26

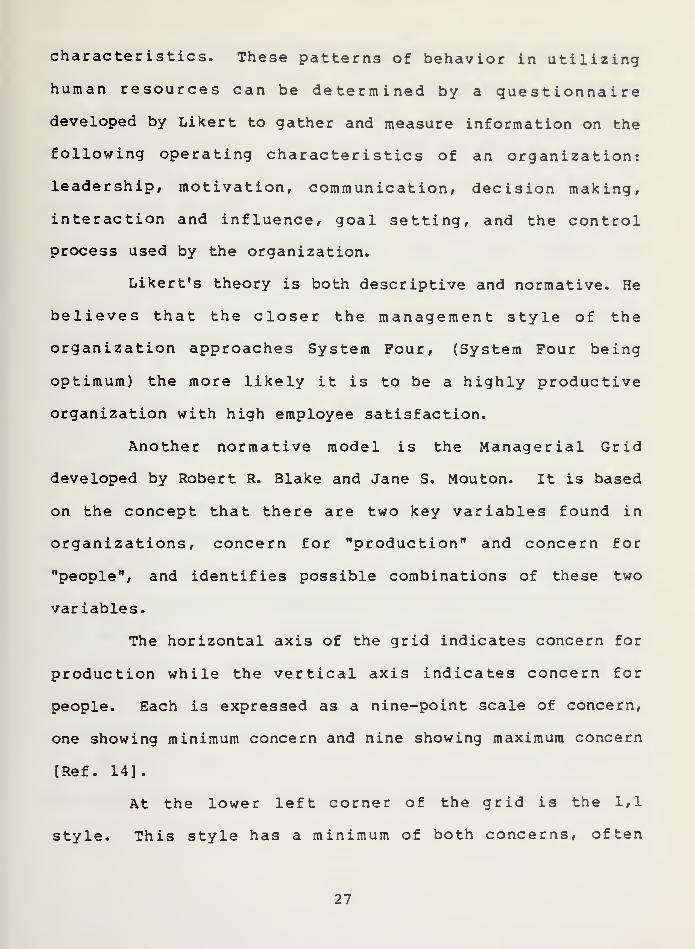
characteristics. These patterns of behavior in utilizing
human resources can be determined by a questionnaire
developed by Likert to gather and measure information on the
following operating characteristics of an organization:
leadership, motivation, communication, decision making,
interaction and influence, goal setting, and the control
process used by the organization.
Likert's theory is both descriptive and normative. He
believes that the closer the management style of the
organization approaches System Four, (System Four being
optimum) the more likely it is to be a highly productive
organization with high employee satisfaction.
Another normative model is the Managerial Grid
developed by Robert R. Blake and Jane S. Mouton. It is based
on the concept that there are two key variables found in
organizations, concern for "production" and concern for
"people", and identifies possible combinations of these two
variables.
The horizontal axis of the grid indicates concern for
production while the vertical axis indicates concern for
people. Each is expressed as a nine-point scale of concern,
one showing minimum concern and nine showing maximum concern
[Ref. 14].
At the lower left corner of the grid is the 1,1
style. This style has a minimum of both concerns, often
27

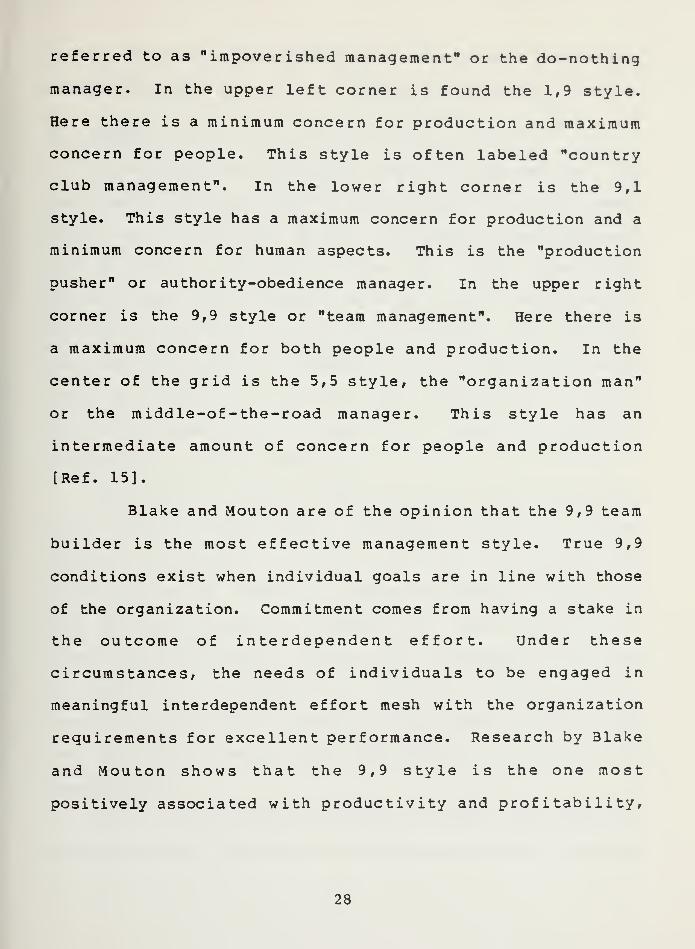
referred to as "impoverished management" or the do-nothing
manager. In the upper left corner is found the 1,9 style.
Here there is a minimum concern for production and maximum
concern for people. This style is often labeled "country
club management". In the lower right corner is the 9,1
style. This style has a maximum concern for production and a
minimum concern for human aspects. This is the "production
pusher" or authority-obedience manager. In the upper right
corner is the 9,9 style or "team management". Here there is
a maximum concern for both people and production. In the
center of the grid is the 5,5 style, the "organization man"
or the middle-of-the-road manager. This style has an
intermediate amount of concern for people and production
[Ref. 15].
Blake and Mouton are of the opinion that the 9,9 team
builder is the most effective management style. True 9,9
conditions exist when individual goals are in line with those
of the organization. Commitment comes from having a stake in
the outcome of interdependent effort. Under these
circumstances, the needs of individuals to be engaged in
meaningful interdependent effort mesh with the organization
requirements for excellent performance. Research by Blake
and Mouton shows that the 9,9 style is the one most
positively associated with productivity and profitability,
28


career success and satisfaction, and physical and mental
health [Ref. 16].
E. SUMMARY
In summary, the situational theories presented here, the
leadership continuum, the life cycle theory, the contingency
model, and the path-goal theory, all suggest that leadership
must be dynamic and flexible rather than static. Each model
requires that a set of factors such as ability and experience
of subordinates, the situation, the leader's personality,
etc., must constantly be assessed in order to determine which
style of leadership would be most appropriate. In other
words, the leader must be sensitive to himself or herself,
the workgroup and the situation.
Individuals in their roles as leaders will differ in
their ability to vary their leadership behavior or style.
Some may be limited to a single leadership style; others may
be quite flexible. Even the leadership situation itself will
make different demands on adaptability. Some situations are
stable and predictable, whereas other leadership situations
are dynamic and unpredictable. This will require careful
consideration in the selection, placement, training and
development of leaders and subordinates throughout the
organization.
As is true with the contingency theories, the normative
models of Likert and Blake and Mouton are generally supported
29


by research [Ref. 17, 18]. However, most of this research
has been done in the private and government sector with
little research in the purely military community. Given the
differences that exist between civilian culture and military
culture such as the emphasis on the integrity of the chain of
command, wearing of rank on the shoulder, and the emphasis on
communications, command and control, we question the validity
and applicability of this research to the Navy in its attempt
to determine which model would be the best to use. We agree
that the factors presented in these normative models are
important aspects to consider when trying to find an ideal
style of management for the Navy. However, we question
whether any one theory can provide a "best way" to follow.
The theoretical basis for much of the activity in the
Navy's Human Resource Management (HRM) program stems from a
group of assumptions about the nature of efficient
organizational systems, the characteristics of such systems,
and the method by which these characteristics can be measured
and enhanced. The objective of the HRM program could be
argued as the attainment of a "System Four" status by the
Navy and each of its constituent organizations by means of
"survey guided development" using the "Survey of
Organizations" which was developed from research in and for
non-military organizations.
30


In the next chapter, we will review the background of the
Navy's (HRM) birth and how it grew to what it is today. We
will also explore how participative management became the
basis of the HPM effort.
31


III. BACKGROUND
A. HISTORY OF OD IN THE NAVY
In his book, New Patterns of Managem ent , Rensis Likert
states,
"The validity of the newer theory of management and of itsderivations can be tested in two ways. Tests can beapplied experimentally in pilot plants to see whether thenewer system significantly improves all aspects ofperformance: productivity, quality, costs, employeesatisfaction, etc. ..The second kind of test is anexamination of the extent to which the methods andprocedures called for by the theory are associated withabove average performance in the current operations ofcompanies. ..results indicate ...that the newer theory,skillfully used, will produce an organization withimpressive performance characteristics" [Ref. 19].
The following quote was taken from a report contracted
for by the Department of the Navy in 1980 to Booz, Allen and
Hamilton consultants, on the organization and functioning of
the Navy's Human Resource Management system.
"Based on research to date and the perceptions of the fieldstaff, there is a general sense that HRM is a program ofvalue to the Navy, a program that has done 'some good' inimproving human resource management. At the same time,however, the research is not conclusive and does notdemonstrate actual impact and (sic) the barriers toachieving impact are substantial. As a result, even theindividuals responsible for the HRM program at all levelsseem to feel the potential for significant program impacthas not been fully realized. Clearly there are substantialobstacles to both achieving an impact as well as measuringwhat has occurred" [Ref. 20].
These two quotes represent both the promise that the
theory underlying the Navy's Human Management Resource (HRM)
program has held for improved management of its personnel and
32


the difficulties that the sponsors of the program have faced
in applying that theory in pragmatic terms to the United
States Navy,
The HRM program in the Navy is now fully
institutionalized, by directive, as a normally scheduled
segment of each command's regular operating cycle. OPNAV
5300. 6B, states in part:
"1. All commands shall:
a. Be scheduled for the HRM survey, a five day(consecutive) dedicated HRAV period and a six totwelve month follow-up visit, consistent with thecapability of existing HRMC/D resources.
b. Arrange with the assigned HRMC/D for feedback ofsurvey results and determine objectives for theassigned HRAV period consistent with the HRM systemgoals." [Ref. 21]
This chapter will outline why and by what process the
Navy consciously has altered its prescribed approach to
leadership and management away from a tradition of
'benevolent autocratism' toward 'participative group'
practices. It will highlight some of the main events and
people who contributed to this process, and it will conclude
with some assessments of this effort's impact on the Navy.
In tracing out the circumstances that led the Navy from
traditional leadership and management practices (what
seasoned veterans refer to as 'Rocks and Shoals') to the
present approach which blends behavioral science, the
computer, and institutionalized management consulting,
33


several names and events are readily identifiable as having
had an impact on shaping relevant events. These factors will
be mentioned briefly, and then considered in detail in a more
chronological order.
Rensis Likert, of the Institute for Social Research (ISR)
at the University of Michigan, is credited with the
theoretical base upon which the organizational effectiveness
and management practices section of the Navy's HRM survey is
based. His two most famous books, New Patterns of Management ,
and The Hum an Organization , actively promoted a normative
style of leadership and management based on work group
participative management practices which he labeled System
Four management.
Admiral Elmo Zumwalt, former Chief of Naval Operations
from 1970 to 1974, provided the direction to guide the Navy
toward programs to deal effectively with the real problems
that Navy personnel face, and the force to overcome the
roadblocks and dilutions that threatened his people programs
in their infancy.
The period of social unrest beginning during the second
half of the 1960's was especially intense at the end of the
decade and the beginning of the 1970's. The Navy, as a
microcosm, was in an especially vulnerable position. Not
only was the Navy catching its (no doubt deserved) share of
racial backlash after many years of repression of minorities
34


but the influx of new personnel recruited to help fight a
very unpopular conflict in Vietnam brought the views of
liberal, well-educated and minority sailors into head-on
conflict with their Navy superiors.
The spectre of the end of the draft forced top Naval
leaders to deal with the reality of competing with the
civilian job market for new, better educated personnel to
fill the ever more technical roles modern warfare created.
The convergence of these significant factors occurred
about the same time as Admiral Zumwalt took command of the
Navy and were significant throughout his tour as Chief of
Naval Operations (CNO) . Some of the long-standing problems
that the admiral inherited as he assumed "his watch" were
problems without any simple solutions. The problems of
racism, poor leadership and alcohol abuse were among the most
pressing he faced initially. Prom Zumwalt's book, On Watch ,
he is seen to be an early advocate of reform who voiced loud
concern over the eventual effects of the Navy's stagnated
views of authority, egali tar ianism and racism. In 1964, as
Executive Assistant to then Secretary of the Navy Paul Nitze,
Admiral Zumwalt remarked that, "my sense of urgency about
personnel reform led me to seek urgently for mechanisms that
would permit that reform to occur faster than the normal pace
of (Navy) bureaucracy permitted. In 1964 we (at SECNAV staff
level) set up a Personnel Retention Task Force. It produced
35


a set of dramatic recommendations along precisely the lines
of the ones I was planning to initiate as CNO" [Ref. 22].
Admiral Zumwalt identified several things the Navy could
do to make the service more attractive and satisfying. The
first was "to find ways to give bright and talented young men
and women more responsibility and greater opportunity for
advancement than they were getting, to increase 'job
satisfaction'." Another, and to him more important, "was to
throw overboard, once and for all, the Navy's silent but real
and persistent discrimination against minorities..."
[Ref. 23].
These personally held attitudes and values the admiral
espoused are the factors he credits for his being selected as
the CNO over the heads of many officers much more senior to
him.
The Department of Defense, under like-minded James
Schlesinger, issued its Human Goals Credo in mid-1969. In
addition to its intended purpose as serving as a model for
the individual services to strive towards in personnel
matters, it tended to head off any ambiguity concerning the
official policy position of the Department of Defense in
regards to their stance on minority and racial issues.
The war in Vietnam was as much a battlefield between the
traditions and customs of the career military personnel and
the more liberal ideologies of the recruit as it was between
36


East and West. As the Commander for the U.S. Navy Coastal
Forces in Vietnam, Admiral Zumwalt had numerous opportunities
to witness firsthand the kind of 'rules and regulations'
battles the younger officers and enlisted personnel fought in
addition to fighting the enemy. It was during this period
that long held ideas on effective leadership and personnel
management were in his mind fully confirmed. He only
required the opportunity to institute them. That opportunity
came in the summer of 1970, when he was picked to be CNO.
The rules and regulations that were earmarked for
excision by the Admiral and the early retention study groups
he convened resulted in many of the OPNAV directives known
throughout the fleet as 'Z-grams'. These NAVOPS often took
the form of guidance, suggestions, recommendations and were
not infrequently highly directive in nature. In Navy
parlance this practice is known as 'giving rudder orders',
and many unit commanders bridled, at least initially, under
the perceived close supervision of the top man.
On November 4, 1970, the CNO issued NAVOP Z-55 which
states in part:
"My deep belief that the Navy's greatest resource lies inour Human Assets has been previously stated and is thebackbone of my efforts in the personnel area to date.Feedback from recent field trips, two retention studygroups, and many other sources indicated the desirabilityof adapting some of the behavioral sciences to theeffective management of these vital assets. To this end, I
have directed the establishment of a pilot program,involving approximately 24 selected personnel, who will
37


develop and evaluate new techniques in the Human Relationsarea. My objective is to improve the management of ourHuman Resources by enhancing our understanding of andcommunications with people" [Ref. 24].
Of the 1200 plus applicants that responded to this
message, 13 officers and 11 enlisted personnel were selected
in December, 1970. In January, 1971, they reported to the
Naval Chaplain School in Newport, Rhode Island, to establish
the Human Resources Management Pilot Program, and begin eight
weeks of training. After completing training, they began
searching out existing and projected ideas. They were
presented strategies by some of the foremost behavioral
scientists in the private sector. After deliberation,
Organizational Development was selected as the most promising
strategy.
The pilot group found four individual methods of
Organizational Development of possible use to meet the CNO's
requirements. They were:
(1) The Instrumented Survey-Feedback method developed byBowers and Franklin at the Institute for Social Research.
(2) The Team Development method of Douglas McGregor and theMassachusetts Institute of Technology.
(3) The Grid Management Organizational Development Systemof Doctors Blake and Mouton.
(4) The Laboratory Learning Method as developed by Scheinand Bennis.
In April, 1971, the Pilot Program began to develop its
own organizational structure and define its own mission.
Concurrently in the Navy Department in Washington, the Human
38

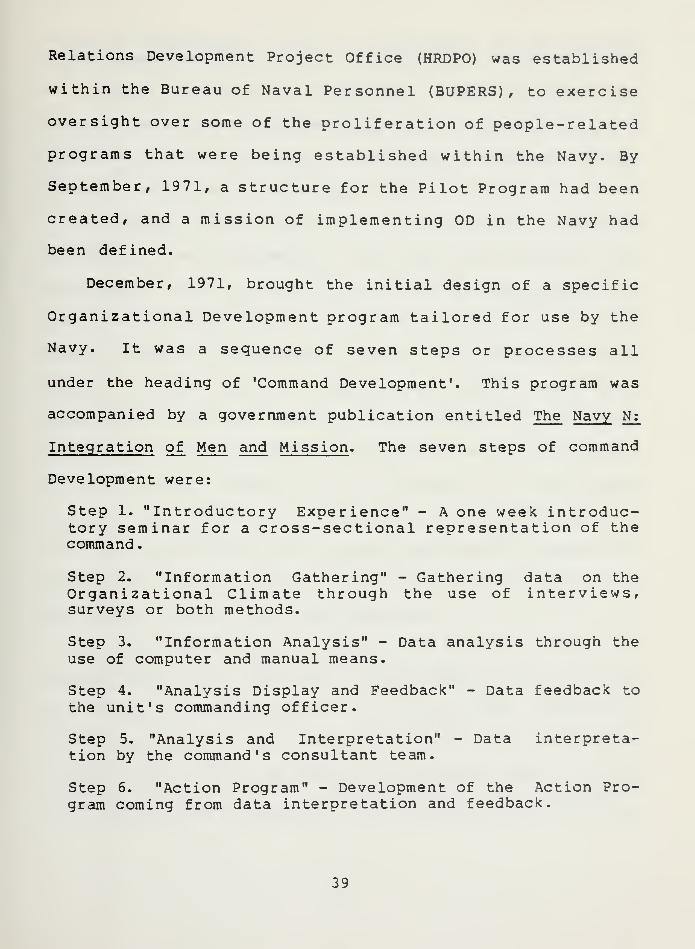
Relations Development Project Office (HRDPO) was established
within the Bureau of Naval Personnel (BUPERS) , to exercise
oversight over some of the proliferation of people-related
programs that were being established within the Navy. By
September, 1971, a structure for the Pilot Program had been
created, and a mission of implementing OD in the Navy had
been defined.
December, 1971, brought the initial design of a specific
Organizational Development program tailored for use by the
Navy. It was a sequence of seven steps or processes all
under the heading of 'Command Development'. This program was
accompanied by a government publication entitled The Navy N;
Integration of Men and Mission . The seven steps of command
Development were:
Step 1. "Introductory Experience" - A one week introduc-tory seminar for a cross-sectional representation of thecommand
.
Step 2. "Information Gathering" - Gathering data on theOrganizational Climate through the use of interviews,surveys or both methods.
Step 3. "Information Analysis" - Data analysis through theuse of computer and manual means.
Step 4. "Analysis Display and Feedback" - Data feedback tothe unit's commanding officer.
Step 5. "Analysis and Interpretation" - Data interpreta-tion by the command's consultant team.
Step 6. "Action Program" - Development of the Action Pro-gram coming from data interpretation and feedback.
39


Step 7. "Evaluation Program" - Assessment of the overalldevelopment effort.
Initial testing and evaluation of the steps of the
Command Development program began on a voluntary basis on
units of Cruiser Destroyer Group TWO in Newport, Rhode
Island, from January through May, 1972.
In March, 1972, while this field testing of Command
Development was proceeding, the HRM Pilot Program was
terminated, and utilizing a core group of the original 24
members, the HRM program was given command status as the
Human Resources Development Center (HRMC) Naval Station,
Newport, Rhode Island. Three other HRDC's were also
established during the summer and fall months of 1972. They
were established at Norfolk, San Diego and Pearl Harbor
utilizing other members of the original 24 in the pilot
program, plus another 100 officers and enlisted men. A
civilian consulting firm trained these early consultants
until their level of expertise and experience was such that
the Centers could do their own training.
In May, 1972, a more complete field testing effort of
Command Development was begun by HRDC Newport using six ships
and staffs of Cruiser Destroyer Flotilla TWO (CRUDESFLOT
TWO), which lasted until the close of 1972. The evaluation
report of the test of the Command Development cycle, written
by the Operational Commander, while generally favorable to
40

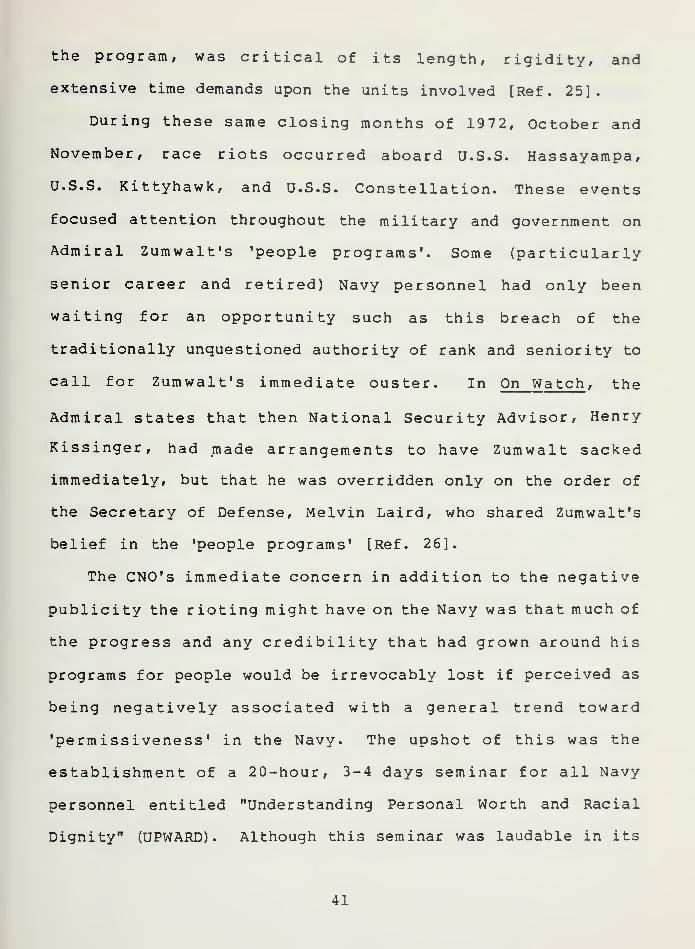
the program, was critical of its length, rigidity, and
extensive time demands upon the units involved [Ref. 25].
During these same closing months of 1972, October and
November, race riots occurred aboard U.S.S. Hassayampa,
U.S.S. Kittyhawk, and U.S.S. Constellation. These events
focused attention throughout the military and government on
Admiral Zumwalt's 'people programs'. Some (particularly
senior career and retired) Navy personnel had only been
waiting for an opportunity such as this breach of the
traditionally unquestioned authority of rank and seniority to
call for Zumwalt's immediate ouster. In On Watch , the
Admiral states that then National Security Advisor, Henry
Kissinger, had made arrangements to have Zumwalt sacked
immediately, but that he was overridden only on the order of
the Secretary of Defense, Melvin Laird, who shared Zumwalt's
belief in the 'people programs' [Ref. 26].
The CNO's immediate concern in addition to the negative
publicity the rioting might have on the Navy was that much of
the progress and any credibility that had grown around his
programs for people would be irrevocably lost if perceived as
being negatively associated with a general trend toward
'permissiveness' in the Navy. The upshot of this was the
establishment of a 20-hour, 3-4 days seminar for all Navy
personnel entitled "Understanding Personal Worth and Racial
Dignity" (UPWARD). Although this seminar was laudable in its
41


goals, its approach was to raise the level of awareness on
issues of racial discrimination by challenging the attitudes
and personal values of the attendees. It was felt that the
discrimination problem was so interwoven with the fabric of
the Navy that only by open challenge to the behaviors and
attitudes of Navy men and women would they see the
discriminatory practices for what they were. That the UPWARD
seminars were inflammatory undoubtably understates the case
by several orders of magnitude. "...many Navy people to this
day take a jaundiced view of a program designed to undermine
good order and discipline" [Ref. 27]. UPWARD seminars became
an appendage to a broader endeavor called PHASE I of Equal
Opportunity in the Navy. This was an attempt to point out
the general direction the Navy needed to go in to help itself
on the road to recovery in ,the areas of discrimination and
minority opportunity.
PHASE II of the Equal Opportunity effort which followed,
employed many of the same techniques and instruments later
used in the HRM cycle. It emphasized command responsibility
more than individual attitudes. The current trend toward
acceptance of the HRM programs and the recent surge of
voluntary unit participation is testimony to the effort that
Navy practitioners have made in overcoming the negative
attitude toward the entire HRM system that was,
unfortunately, the legacy of some of these earlier efforts.
42


In January, 1973, a Human Relations Management Team was
established in Washington, D.C., to work with all Naval shore
activities in the HRM area.
In March, 1973, the Human Goals Office was established
within the Navy Department with the Assistant Chief of Naval
Personnel for Human Goals as Pers-P and the Assistant Deputy
Chief of Naval Operations for Human Goals as 0P-01P. Under
the guidance of RADM Charles Rauch, Pers-P, the Human Goals
office began consolidating the Navy's programs in Equal
Opportunity, Race Relations, Organizational Development,
Drugs and Alcohol, Career Counselling and Intercultural
Relations into one comprehensive package.
The Human Goals Plan, OPNAV 5300.6 series, was first
promulgated in August, 1973. The objectives as
originally stated in OPNAV 5300.6 were:
"-To insure that the personnel of the Navy at every levelof command are informed of and understand the Human GoalsCredo and its importance as a basic tenet of Navy life.
-To implement leadership and management improvementprograms at every level in the chain of command to achieveincreased command excellence through the most effectiveutilization of human and physical resources.
-To ensure equal opportunity in the Navy by makingprejudice of any kind an unacceptable practice and toidentify and eliminate individual and institutional racism.
-To reemphasize the important role of middle management inimplementing policy and in giving strength to the chain ofcommand
.
-To ensure that Navy units operate as a positive andeffective instrument of overseas diplomacy and thatindividual personnel and their families live and work
43


productively and with satisfaction in an overseasenvironment.
-To eliminate the abuse of alcohol and drugs in the Navythrough education and action programs.
-To help all Navy personnel leaving the service to readjustto civilian life.
-To attract and retain in the Navy people with ability,dedication, and the capacity for growth [Ref. 28].
This OPNAV instruction accomplished numerous other
objectives besides just identifying the objectives of the
Human Resources Management Program. It also:
(1) Redesignated the HRDC's as Human Resource ManagementCenters (HRMC's)
.
(2) Called for the establishment of Human Resource Manage-ment Detachments (HRMD) , smaller commands responsible for asmaller region or number of commands (under an associatedHRMC)
.
(3) Provided a timetable for the institutionalization ofthe HRM program into the operational Navy bydisestablishment of the HRDPO and the transfer ofresponsibility for scheduling and maintenance of theHRMC's/D's to the various fleet commanders.
(4) Provided a timetable for the transfer of responsibilityfor the training of HRM specialists from BUPERS to Chief ofNaval Education and Training (CNET) , with the additionalrequirement for the establishment of a Human ResourcesBasic School.
(5) Established the Human Resources Management Cycle as thevehicle to assist commands in improving the overallperformance of personnel toward mission attainment, commandexcellence and Navy Human Goals achievement. In addition toidentifying the HRM cycle as the delivery mechanism forintegrating the various Navy Human Goals program areas intothe individual units, the plan defined the schedulingstructure for the cycle and named the responsibleimplementing authorities.
44

(6) Called for these transfers of authority and responsi-bility to commence in October, 1973, and to be completed by1 July, 1974. Personnel billets and program funds were tobe transferred to Fleet Commanders and CNET by that date.
In January, 1974, both fleet and shore units began
regularly scheduled HRM cycles.
B. THE HRM CYCLE
The Human Resources Management Cycle, as it is currently
practiced in the fleet (as outlined in OPNAVINST 5300. 6B) , is
an 18 to 24 month evolution. There are 9 steps to the HRM
Cycle:
Step 1. Initial visit-Outlines program to the CommandingOfficer as to steps and capabilities.
Step 2. Data Gathering-Administering the HRM Survey andinterviews (if required)
.
Step 3. Diagnosis-Organizing the raw survey results fromthe computer printout.
Step 4. Feedback-Provides to the unit commander and othershe designates the results of the surveys and interviews.
Step 5. Planning-Developing a schedule for the 5 day HRAVbased on areas of need identified in Steps 2-4.
Step 6. Human Resources Availability (HRAV) Week-Dedicatedweek of training, including workshops and other activitiesto:
a. Further command effectiveness through optimum manage-ment of Human Resources.
b. Develop a new or modify an existing Command ActionPlan (CAP)
.
Step 7. Unit Action-The unit's ongoing implementation andmonitoring of actions as set forth in the CAP.
Step 8. Follow On-Further assistance if required from theHRMC.
45


Step 9. Follow Up-Six to twelve months after HRAV todetermine if additional assistance to the unit is required[Ref . 29] .
The time and close involvement required for the
successful completion of the HRM cycle are extensive,
especially on the top management of the individual command.
LCDR Ray Forbes, a guiding force in the Navy's entry into the
HRM field, outlined the costs and benefits of the HRM cycle
as follows:
"What does it cost?
-The commanding officer's time and attention during theseveral pre-HRAV meetings, taking the survey, and hispossible participation in HRAV activities.
-The Executive Officer and Department Head's time fortaking the survey, analyzing and interpreting it, feedingdata back to immediate subordinates and their possibleparticipation in selected HRAV activities.
-Crew time in taking the survey (about an hour each) andselected participation in the HRAV; approximate averagepercentage of total crew involvement during HRAV is 15-40%for the 2 to 5-day period.
-About 30 minutes time for workshop participant group inthe week prior to the start of the HRAV for a prebriefingby HRMC/D staff and command representatives.
-Some increased workload for those persons who are notinvolved in HRAV week events.
-Scheduling priority for the involvement of key personnelfor designated HRAV sessions.
-Some reduction in the unit's ability to conduct routinelyscheduled events during the HRAV.
What is gained?
-A new or updated Command Action Plan (a required, writtendocument addressing significant organizational issues andthe planned means to resolve them).
46


-A data based picture of the current state of the humanside of the organization derived from a well tested surveyinstrument.
-An opportunity to identify and examine areas that couldresult in a strengthened chain of command and improvedorganizational functioning.
-Planning time to focus on and address critical issues ofpresent concern within the command.
-The specialized services of trained human resourcesconsultants acting as staff assistants to the commandingofficer
.
-Improved personal skills and knowledge of command membersin the human goals area.
-Development of a degree of internal capacity, throughconsultation" [Ref. 30],
C. SURVEY GUIDED DEVELOPMENT, SYSTEM FOUR AND THE U.S. NAVY
The approach that is used in the Human Resources
Management cycle to accomplish organizational development is
that of Survey Guided Development (SGD) . The instrument
involved is the 88 item HRM Survey. This survey, including
those parts of it dealing with management and leadership
practices is grounded in the theory of Rensis Likert. Likert
was actively engaged in researching, theorizing and testing
of hypothesis from the early 1940's. He and the organization
he directed for many years, ISR, have had a long mutually
productive arrangement with the Navy and the Office of Naval
Research. Two well known achievements of his are the
development of the so-called 'Likert' scale used on survey
47


instruments, and his theory of participative group
management.
Campbell, Bownas, Peterson, and Dunnette differentiate
two general models of organizational effectiveness— the goal
centered approach and the natural systems approach [Ref. 31].
The goal centered approach makes the assumption that the
organization is in the hands of a rational set of decision
makers who pursue a finite set of explicitly stated goals.
The management by objectives tradition as usually practiced
tends to fall into this category. The natural systems view
makes the assumption that organizational goals are so complex
that it is difficult to define a smaller subset of meaningful
goals. The focus is on basic systemic variables usually
involving "people" factors as measured by questionnaires and
not upon the state of the organization's technology or
physical structure. A natural systems approach that
incorporated a priori notions of what systems variables
should be addressed is the model utilized by the Institute
for Social Research. Likert theorizes that job satisfaction
and other end-result variables are the result of
organizational climate and leadership variables. Peer
leadership and emergent work group processes are theorized to
be intervening variables within the overall model of
organizational functioning. The emphasis of this model is
clearly upon groups rather than upon individuals, and Likert
48


states that "an organization will function best when its
personnel function not as individuals but as members of
highly effective work groups with high performance goals"
[Ref. 32]. The emphasis is upon employee participation in
decision making [Ref. 33].
Some of the basic tenents of Likert's System of
Management Theory are:
(1) There are four systems of management: System One ischaracterized as exploitative authoritative; System Two isbenevolent authoritative; System Three is consultative, andSystem Four is group participative.
(2) There is a "linking pin" function between heirarchiesin organizations. The leaders of groups at one levelwithin the organization will be the subordinates at thenext higher level. Thus, they act as linking pins betweenthe vertical levels.
(3) There are definite causal, intervening and end-resultvariables that comprise what Likert terms the 'causal flow 1
of events in management. By manipulating the causal(independent) variables the intervening and end-result(dependent) variables will be affected in more or lesspredictable ways. Likert identified the causal variablesin organizational management as organizational climate andleadership; the intervening variables as peer leadershipand work group processes; and the end-result variables asworker satisfaction and organizational performance. In theclassic theory, climate and leadership affect peerleadership which in turn affects work group processes, andthose affect the end-result variables.
In Likert's book, New Patterns of Management , Chapter 14
presents a table entitled: "Organizational and Performance
Characteristics of Different Management Systems Based on a
Comparable Analysis" [Ref. 34]. This table, based on
Likert's theory, is a model for the Survey of Organizations
(S00) developed by Bowers and Taylor (who present it in their
49


book Survey of Organizations; A Machine Scored Standardized
Questionnaire Instrument [Ref. 35].
The Navy's Z-55 group in Newport, Rhode Island, began the
initial search for suitable, valid methods to conduct OD in
the Navy. Since Survey Guided Development (SGD) was selected
as one of the four promising strategies that went on to make
up Command Development, it was normal for the Institute for
Social Research, who pioneered SGD, to become involved with
the Navy effort. This fact, taken together with the events
surrounding the race rioting onboard ships, prompted a
preliminary survey using the Survey of Organizations with a
sample of 2500 Navy personnel and 2200 civilians to compare
perceptions of attitudes toward their employers. The results
of the survey as reported by Bowers and Franklin were:
"-As one might expect, more civilians feel negatively abouttheir prospects for steady employment than do Navy men.
-More Navy men feel that, although their jobs require thatthey learn new skills, those jobs do not permit them to usethe skills and abilities which they have gained, and do notview their jobs as particularly prestigious.
-Although more Navy men than civilians described theirfringe benefits in favorable terms, many more Navy men thancivilians view their pay in negative terms.
-Although more Navy men feel their job offers them a chanceto serve their country, an even larger proportion feelsthat it doesn't allow them to stay in one place, andprovides them an insufficient opportunity to control theirpersonal lives. (This factor is probably the biggestnegative perception Navy personnel have about the service.)
-Navy men, in far greater proportion than civilians, feelenmeshed in a large bureaucracy, one in which they are
50


endlessly referred from person to person when they needhelp, must go through a great deal of 'red-tape' to getthings done, and are hemmed in by longstanding rules andregulations which no one seems able to explain" [Ref. 36].
The Survey of Organizations was accepted by the pilot
group as the vehicle for data gathering in that phase of the
Command Development program. It was modified for Navy use by
reducing the total number of questions dealing strictly with
management practices and including questions pertaining to
other aspects of interest to the HRM program: race
relations, equal opportunity, drug and alcohol abuse,
intercultural relations/overseas diplomacy and career
counseling
.
Drexler performed an in depth factor analysis of the HRM
survey in 1974, with recommendations for regrouping, deleting
and changing the wording of questions [Ref. 37].
An HRM conference that convened in 1981 resulted in the
revision of HRM survey into the 1982 version of the survey
currently in use.
D. THE IMPACT OF SURVEY GUIDED DEVELOPMENT IN THE NAVY
The Navy's Human Resources Management Support System
(HRMSS) was instituted in late 1973 under the sponsorship of
the Deputy Chief of Naval Operations for Human Resources
Management, 0P-01P. In July, 1974, the Navy Personnel
Research and Development Center, (NPRDC) San Diego,
California, established a research group to conduct studies
51


and analysis in support of HRMSS. The HRM studies group at
NPRDC has provided assistance in the following areas:
(1) Analysis of HRM survey data to determine the effective-ness of the instrument for diagnosing organizationalconditions within Naval commands as well as the survey'srelationship to accepted performance measures.
(2) Assessment of the HRM cycle impact. There were severalassessments of the impact of the HRM cycle and the HRAVperiod utilizing various effectiveness criteria.
First, Crawford and Thomas reported early in 1975 on a
test of the hypothesis that survey scores would be negatively
correlated with nonjudicial punishment rates aboard ships.
The results tended to support this hypothesis with correla-
tions (using the ships as units) of from .27 to .50 with a
median of .39. Second, in a later 1975 study, this time
using matched pairs of ships, one as a control ship which had
not received an HRAV, with the other ship as the treatment
ship, Crawford states: "the HRM cycle, per se, has no signi-
ficant impact upon unit level NJP (nonjudicial punishment)
rates". Crawford surmises that "Definite conclusions cannot
be reached as to the potential effectiveness of OD activities
as they relate to disciplinary problems" [Ref. 38].
Third, in 1976, Mumford studied the relationship between
HRM scores and the scores received by ships during refresher
training (REFTRA) . She concludes: "The results of this
analysis support the hypothesis that there is a positive
relationship between operational readiness as measured during
REFTRA and the Human Resource Management System within a
52


ship. This is particularly true in cases where peer leader-
ship and work group processes have produced both perceived
organizational effectiveness (high HRM survey scores) and
favorable performance outcomes (high REFTRA scores)"
[Ref. 39].
A systematic review of the impact of the HRM cycle on the
Navy was part of an overall HRM review conducted by Booz,
Allen and Hamilton. The report concludes that "The impact of
the HRM program, if any, has not been conclusively or
satisfactorily demonstrated" [Ref. 40],
The report goes on to state that although prior NPRDC
research indicated a positive correlation between HRM
services and operational effectiveness, particularly for
reenlistment, nonjudicial punishment, refresher training, and
status of Naval Forces (NAVFORSTAT) readiness ratings, "they
do not, however, necessarily imply causality". The following
paragraph sums up the major difficulty with accurately
assessing the impact of the HRM cycle within the Navy:
"Even at the theoretical level, the relationship betweenthe HRM program and operational readiness is an indirectone; the HRM program is designed to address the area ofcommand management of human resources issues and problems(e.g. command climate) which is but one of a number offactors which impact on operational effectiveness. Intrying to establish a direct impact on the basis of anindirect relationship, it is necessary to control for thelarge number of other factors which affect the situation.These other factors (e.g. operating schedules, spare parts,support, etc.) act as antecedent, bias or obscure therelationship between HRM services and operationaleffectiveness which might exist. Given that the Navy is anoperational rather than a laboratory environment, it is
53


extremely difficult to even measure the effect of outsidevariables, and almost impossible to control theirinfluence" [Ref. 41].
E . SUMMARY
The NPRDC reports tend to support the hypothesis that
there is a positive relationship between Naval organizational
effectiveness and participative group style of management.
Due to Likert's association of effective performance with
System Four management, there exists a bias in the wording of
the questions toward participative-group management in both
the Survey of Organizations and the Navy's HRM survey. In
theory, when the survey results are fed back to the command,
the command should automatically target for improvement all
areas that fail to score in the System Four range. In
practice, however, this is not always what happens. Command
results are often compared to fleet norms and areas which
fall below fleet norms are those that receive emphasis.
Likert's underlying theory is that the ideal state for
any organization is System Four (participative group). The
authors feel, however, that while participative group
management may work well in some organizations, such as in
the private sector, it may not work as well in other
organizations, such as in the military.
Chapter Four will discuss the hypothesis of this study
and present the methodology used.
54


IV. METHODOLOGY
A. RESEARCH HYPOTHESIS
This thesis is a continuation of a research effort
started in 1981 to provide assistance in defining where the
Navy's Human Resource Management Program should be headed in
the future. The first study completed in this effort was a
paper presented by Gettys and Maxwell in 1981 [Ref. 42].
Their purpose was to study organizational effectiveness in
the military, comparing Army and Navy officers. The purpose
of this paper is to continue this research effort by
implementing some of the recommendations suggested in the
Gettys-Maxwell thesis. We will discuss these recommendations
in appropriate sections of this chapter. However, we will be
focusing on the perceptions of just one of the groups used in
their thesis, that of operational Navy personnel.
The specific objective of this study is to examine the
perceptions of experienced Naval personnel as to how an
effective Naval organization "should" operate, rather than
how any specific unit is "currently" operating.
The hypothesis of this thesis is that perceptions of
experienced Naval personnel of what an effective Naval
organization should look like are not consistent with System
Pour (participative group) management. Given the opportunity
to describe an ideal effective Naval organization, on a
55

I

Likert scale, they will not select System Four as being the
most effective for the Navy. The rationale of this theory
lies in the values inherent in the military culture. Given
these values, such as the emphasis of the integrity of the
chain of command, the wearing of rank on the shoulder, and
the emphasis on command, communications and control, the
authors believe that the most effective style of management
will not be a purely participative group style of management,
but that it will tend toward a consultative (System Three)
style of management.
B. DATA COLLECTION METHODS
The data collection methods used to gather these
perceptions were interviews and a modified version of the
Navy's HRM survey. The major modification made to the survey
was to change the perspective of the questions. The HRM
survey is designed to measure the "current" command climate
of Naval organizations. The survey questions were modified
to measure an "ideal" command's climate by the addition, at
the beginning of each question, of the phrase, "In an
effective organization..." This modified format was used by
Gettys-Maxwell and the authors felt it would serve present
purposes equally well. The intent in modifying the questions
was to give the respondents the opportunity to describe their
56


perceptions of what "ideal" working conditions in an
organization would be like.
In addition to the modified question format, the number
of questions was reduced from that used in either the HRM
survey (88) or the Gettys-Maxwell paper (100). The authors
eliminated first the particularly Navy oriented questions not
originally related in any way to the Survey of Organizations
(e.g. EO, substance abuse, overseas duty support, career
transitioning)
.
Second, the questions from Fleishman's Leadership Profile
used by Gettys-Maxwell were eliminated.
The remaining questions were then individually evaluated
for the purpose of reducing the total number further since
one of the constraints of data gathering was that the survey
was administered on a voluntary basis, and it was felt that
the less time the questionnaire took to complete the more
likely were commands to agree to take it. The requirements
set were that there would be questions from the remaining
dimensions represented in the survey and at least one
question from each index in the different dimensions would be
included. The authors then chose questions that were of
interest or that were felt would shed additional information
on the working conditions found in "effective" organizations.
Appendix A is a copy of the questionnaire and Appendix B
lists the rationale behind the selection of each question.
57


In addition to the "climate" type survey questions used,
the results of the three "HRM Program Success" questions used
by Gettys-Maxwell were of particular interest. These
questions asked respondents' opinions regarding the success
of HRMC/D's over the past three years, the current potential
for success, and the expectation for success in the next
three years, in assisting commands in becoming effective
organizations. Why was the mean score of the question
concerning the future potential for HRM program success lower
than the mean score for present HRM program success? It was
important to explore this specific area further to see if the
same difference of means was displayed in a different study
sample. Therefore, the three HRM program success questions
were included.
In addition to administering surveys as data collection
devices, personal interviews were conducted for the purposes
of giving the authors a better understanding of why
respondents answered questions on the survey the way they
did, and to better understand their perceptions of different
management practices and how those practices affect working
conditions in an organization.
The authors had initially planned to analyze the survey
data first and then develop interview questions that
pertained to significant areas obtained from analysis of the
entire data set. However, due to time and geographical
58

constraints, the authors developed the interview questions
from the subset of the data available at the time interviews
were, out of necessity, to be conducted.
Using the available data, one hundred respondents, the
data were examined and questions were developed around survey
questions that displayed high or low mean scores and
significant differences in the distribution of answers
between officers and enlisted personnel. Based on this rough
form of analysis, we developed thirty questions to be used
for interviews. Appendix C shows the questions used for
interviews and the reasons they were chosen. In addition to
responding specifically to questions, the personnel being
interviewed were also asked "why'' they answered a question in
a particular way. The authors' hope was to establish the
contextual framework of the respondent in this manner.
C. SAMPLE CHARACTERISTICS
The hypothesis of this study concerns the perceptions of
experienced Naval personnel. One of the recommendations made
in the Gettys-Maxwell paper was that their study be expanded.
"While the data collected are valuable in evaluating the
perceptions of the military leadership regarding organiza-
tional effectiveness, the relative size of the sample is not
adequate" [Ref. 43]. To make data more meaningful, this
study intended to significantly enlarge the size of the
sample and to obtain a broader cross section of the Navy
59


operational population. It was critical to include in this
study senior petty officers to ascertain their perceptions
and philosophies regarding organizational effectiveness.
Because this research was concerned with obtaining informa-
tion about the perceptions of "fleet experienced" Naval
personnel, the sample included enlisted personnel in the
paygrades of E-5 to E-9 and officers in the paygrades of 0-2
to 0-6. The authors felt that by the time the enlisted
personnel reached the E-5 level their base of operational
experience would be such that they would have been exposed to
numerous naval organizations that would have practiced and/or
experienced a variety of leadership, management and decision
making styles. Similarly, officer personnel in the rank of
0-2 and above would have had sufficient opportunity to gain
comparable experience owing to both the increased time
required to advance in paygrade and the additional
educational background required initially.
Letters were sent to unit commanding officers, with whom
the authors had previous acquaintance, explaining both the
purpose of the survey research and the Navy policy on
surveying commands, and requesting their permission for and
assistance in administering a survey. We requested this
assistance from six commands and received a positive response
from five promising assistance in administering the survey to
personnel within their command. The survey sample was taken
60


from two helicopter squadrons (one operational and one
training), a jet aircraft training squadron, a helicopter
wing staff, and a surface vessel fleet training center.
Although this approach to the problem of obtaining a
sample of 'fleet experienced' Naval personnel overcame the
time and policy constraints, it limited the population
available for sampling. What was used was essentially a
sample of convenience, and, as such, the results of the
survey may be biased in unpredictable ways. Therefore, the
generalizability of the analysis of the research may be less
than what was desired by the authors.
Another constraint on the research was time and travel
funds for interviewing. Interviews were conducted in
conjunction with a previously scheduled and funded trip to
Charleston Naval Station. Several days were added to that
trip to allow time to conduct interviews at Naval Air Station
Jacksonville, Florida.
The interview sample consisted of personnel assigned to a
helicopter squadron located at NAS Jacksonville, and ranged
from E-5 to 0-5 in paygrade. The Charleston Naval Station
personnel interviewed ranged from E-5 to 0-6 and were made up
of personnel assigned to a Fleet Training Center.
61


D. SURVEY ANALYSIS PLAN
All responses to the questionnaires were coded and
entered onto the computer to be utilized with the Statistical
Package for the Social Sciences (SPSS). The analysis of the
survey data will be accomplished using the programs contained
in the SPSS package.
The plan for the analysis is as follows. The survey
sample will first be broken down demogr aphically to
investigate the distribution of the survey sample. The
overall sample mean and sample variance will be computed and
the sample mean will be discussed in relationship to
participative group management (Likert's System Four).
Following this, means for each group will be compared by
rank, time in service, community (aviation, surface, other),
geographic area of service (east coast, west coast), and
attendance at Leadership and Management Education Training
(LMET)
.
The statistical analysis will include the means of all
the indices, and questions, as appropriate. A criterion of
two-thirds of the original questions from each index was used
naming the indices. Indices that met this criterion,
retained their original index name. If the number of
questions in each index did not meet this criterion, the
indices were renamed to more accurately reflect the content
of the question used. As a result of this criterion, fifteen
62

of the original indices were renamed, thus creating a total
of twenty-one new indices. Because of the high number of
indices that were renamed, indices were not aggregated into
dimensions as in the HRM Survey. Appendix D is a code book
of how the data file is arranged and how questions were coded
into index or renamed.
The analysis will conclude with a discussion of the
differences of the various subgroups concerning trends or
patterns in conceptualizations personnel have of ideal Naval
organizations (as a function of rank, time in service, area,
type of community, and previous experience in management
education in the Navy).
The next chapter will discuss the results of the data
analysis.
63


V. ANALYSIS AND CONCLUSIONS
A. SURVEY RETURN
Five hundred (500) questionnaires were mailed out in
August, 1982 to the five commands that had previously
committed their support to this research project. All the
surveys returned had been received by the end of October,
1982. The number of surveys sent to each of the commands
varied with the size of the command, from as few as thirty to
as many as one hundred fifty. Of the 500 surveys sent out,
295 were eventually completed and returned, for an overall
return rate of 59%. In most instances, the return rate was
considerably lower than what had been anticipated (upwards of
80%) given the strategy of only sending surveys to commands
that had previously committed themselves to assist in the
administration of the survey. However, the overall return
rate is considered good for a survey of this type.
Table I shows the survey distribution and rates of return
by command surveyed. As can be seen, three of the commands
had fairly good return rates with the helo wing staff having
the highest at 97%. Two of the commands had fairly low
return rates, well below the 50% level, the lowest being the
jet training squadron with a 41% return rate.
64

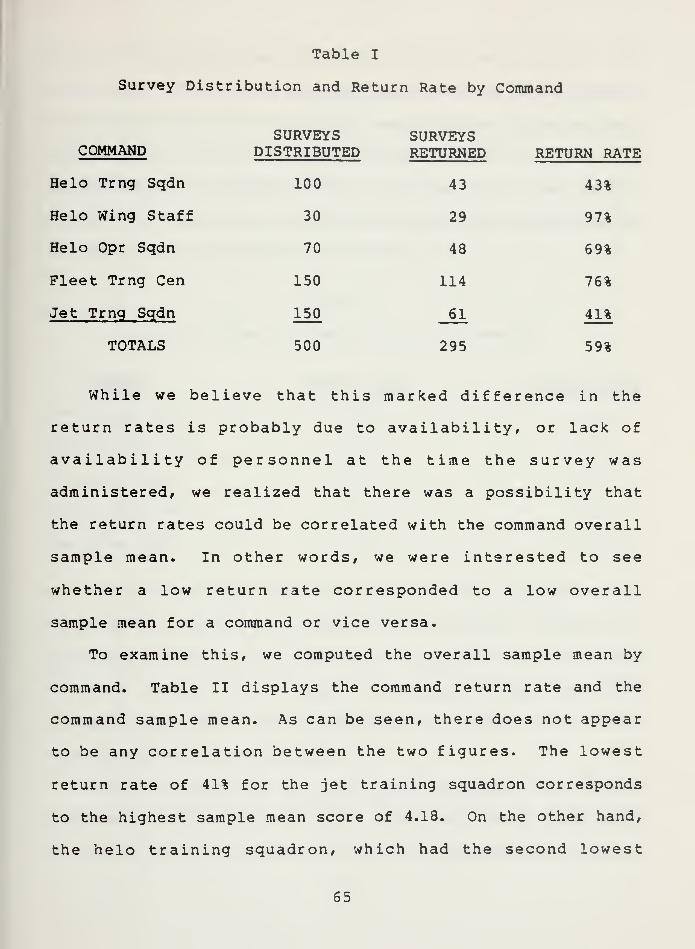
SURVEYS SURVEYSDISTRIBUTED RETURNED RETURN RATE
100 43 43%
30 29 97%
70 48 69%
150 114 76%
150 61 41%
Table I
Survey Distribution and Return Rate by Command
COMMAND
Helo Trng Sqdn
Helo Wing Staff
Helo Opr Sqdn
Fleet Trng Cen
Jet Trng Sqdn
TOTALS 500 295 59%
While we believe that this marked difference in the
return rates is probably due to availability, or lack of
availability of personnel at the time the survey was
administered, we realized that there was a possibility that
the return rates could be correlated with the command overall
sample mean. In other words, we were interested to see
whether a low return rate corresponded to a low overall
sample mean for a command or vice versa.
To examine this, we computed the overall sample mean by
command. Table II displays the command return rate and the
command sample mean. As can be seen, there does not appear
to be any correlation between the two figures. The lowest
return rate of 41% for the jet training squadron corresponds
to the highest sample mean score of 4.18. On the other hand,
the helo training squadron, which had the second lowest
65

return rate of 43% had the lowest sample mean score. The
helo wing staff had the highest return rate of 97% but had a
sample mean score of 4.11, which was also the median command
sample mean. The authors therefore believe that the
differences in command return rates were not due to the
command climate nor to the command personnel perceptions of
how naval organizations should operate.
Table II
Return Rates and Sample Means by Command
COMMAND RETURN RATE COMMAND MEAN
Helo Trng Sqdn 43%
Helo Wing Staff 97%
Helo Opn Sqdn 69%
Fleet Trng Cen 76%
Jet Trng Sqdn 41%
We next examined the distribution of the sample by the
demographic information requested in the survey. Figures 5.1
through 5.8 show how the sample was distributed by rank, sex,
time in service (TIS) , area of assignment (AREA), type of
command (TYCOM), and attendance at LMET and other
distributions, as appropriate.
The distribution by rank fell out much the way we
expected. Figure 5.1 shows that there were small numbers of
the most senior enlisted and officer personnel which was
66
3,.96
4..11
3,.99
4,.13
4..18


expected due to the length of time in service required to
attain these grades, and the small number of E-9, 0-5, and
0-6 positions in most commands. The distribution also showed
high numbers of the middle managers in both the enlisted and
officer ranks, presumably due to the fact that most commands
have more personnel positions in the E-6 and 0-3 grades.
Figure 5.2 also helps explain the high number of middle
managers in the sample. Some 54 of the 61 (88%) respondents
from the jet training squadron were in this category.
Rank
E-5
E-6
E-7
E-8
E-9
0-2
0-3
0-4
0-5 or0-6
****************************** (58)
*************************************
****************** (32)
********** (18)
******* (11)
********** (19)
******************************
********** (19)
**** (7)
(60)
(71)
20Frequency
40 60 80 100
Figure 5.1 Distribution by Rank
67


Rank
E-5
E-6
E-7
E-8
E-9
0-2
0-3
0-4
******************************************** {11)
************************ /<j\
*********** ^4j
**** (1)
**** M)
******************************* (12)
***************************************** (16)
**** M
J
4
Frequency8 12 16 20
Figure 5.2 Distribution of Rank in the Jet Trng Sqdn
The distribution by sex was heavily skewed toward males.
As shown in Figure 5.3, female respondents totaled only ten,
3.4%. With such a small female sample, it would be unlikely
that any valid statements could be made about the larger
population. Therefore, the authors did not include this
variable in the analysis.
Sex
Male
Female
***************************** (283)
** (10)
100Frequency
200 300 400 500
Figure 5.3 Distribution by Sex
68

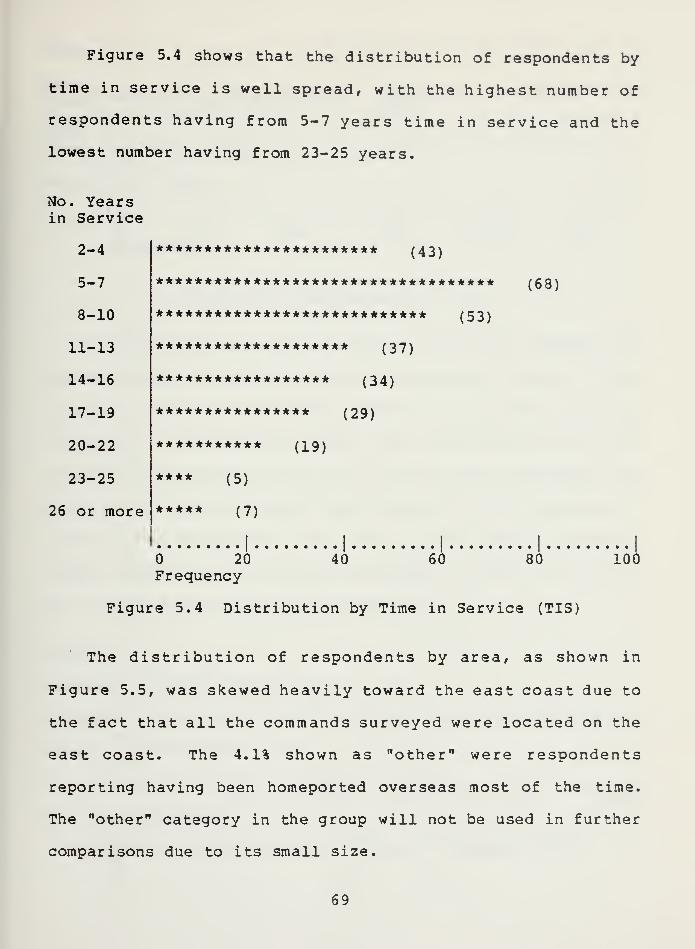
Figure 5.4 shows that the distribution of respondents by
time in service is well spread, with the highest number of
respondents having from 5-7 years time in service and the
lowest number having from 23-25 years.
No. Yearsin Service
2-4
5-7
8-10
11-13
14-16
17-19
20-22
23-25
26 or more
*********************** (43)
***********************************
**************************** (53)
******************** (37)
****************** (34)
(29)
(19)
(5)
***** (7)
(68)
****************
***********
****
20Frequency
40 60 80 100
Figure 5.4 Distribution by Time in Service (TIS)
The distribution of respondents by area, as shown in
Figure 5.5, was skewed heavily toward the east coast due to
the fact that all the commands surveyed were located on the
east coast. The 4.1% shown as "other" were respondents
reporting having been homeported overseas most of the time.
The "other" category in the group will not be used in further
comparisons due to its small size.
69

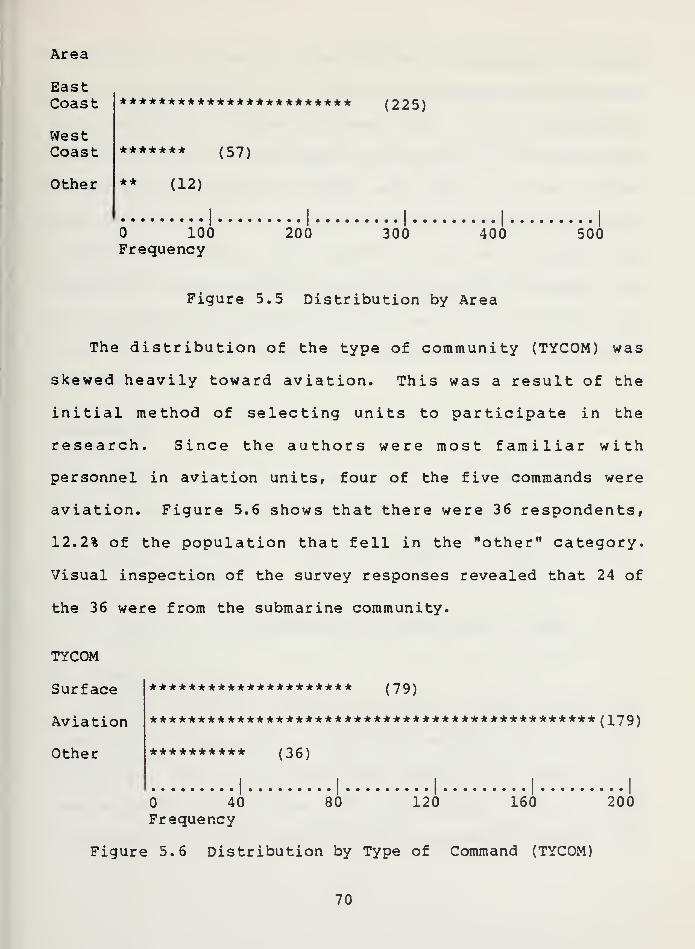
Area
EastCoast
WestCoast
Other
************************
******* (57)
** (12)
(225)
100Frequency
200 300 400 500
Figure 5.5 Distribution by Area
The distribution of the type of community (TYCOM) was
skewed heavily toward aviation. This was a result of the
initial method of selecting units to participate in the
research. Since the authors were most familiar with
personnel in aviation units, four of the five commands were
aviation. Figure 5.6 shows that there were 36 respondents,
12.2% of the population that fell in the "other" category.
Visual inspection of the survey responses revealed that 24 of
the 36 were from the submarine community.
TYCOM
Surface
Aviation
Other
********************* (79)
********************************************** (179)
********** (36)
40Frequency
80 120 160 200
Figure 5.6 Distribution by Type of Command (TYCOM)
70


Figure 5.7 shows the distribution by attendance at LMET.
It was surprising to see that so many personnel had not
received LMET. Figure 5.8 shows that of the one hundred
twenty that had not had LMET, sixty-nine (57.5%) were E-5's
or E-6's and thirty-nine (32.5%) were 0-2's or 0-3's. Broken
down by time in service, 78% of the non-attenders at LMET had
less than ten years in the service. This helps explain the
numbers of non-attenders at LMET as most Navy personnel are
sent to LMET after approximately ten years of service, at
which time it is fairly certain that they are career
oriented.
Attendanceat LMET
Yes
No
********************************************* (174)
******************************* (120)
40 80 120 160 200Frequency
Figure 5.7 Distribution by Attendance at LMET
B. GROUP MEAN DATA
The statistical analysis portion of the thesis will
consist of two sections. The first section will present a
statistical analysis of the survey results obtained for the
sample (n=295) and for the five subgroupings that were used.
A discussion of these results will be presented together with
71

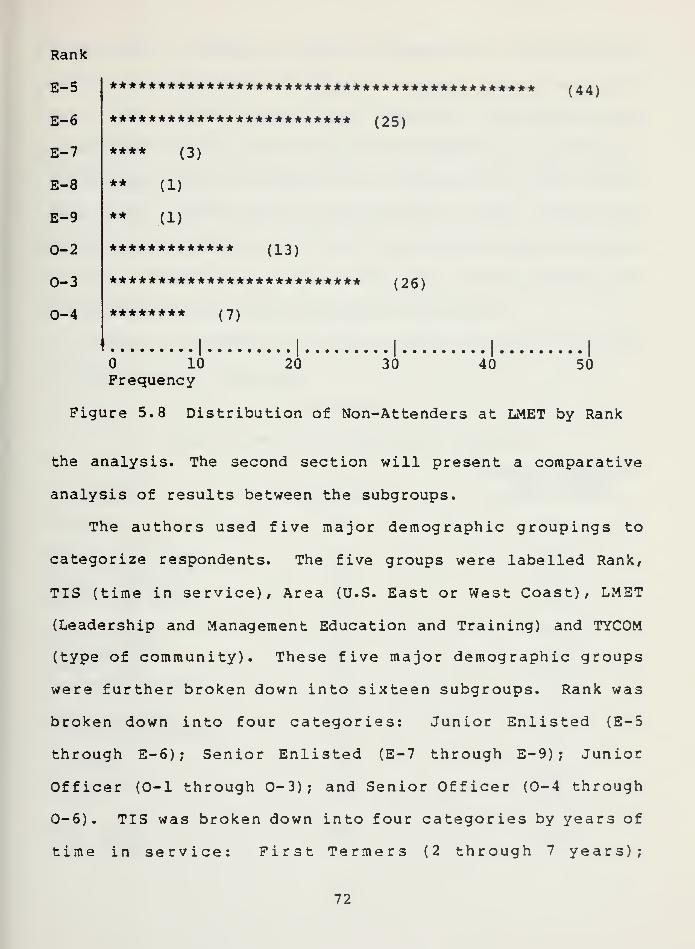
Rank
E-5
E-6
E-7
E-8
E-9
0-2
0-3
0-4
********************************************
************************* (25)
**** /3)
** (1)
** (1)
************* (13)
************************** (26)
******** r~j\
(44)
10Frequency
20 30 40 50
Figure 5.8 Distribution of Non-Attenders at LMET by Rank
the analysis. The second section will present a comparative
analysis of results between the subgroups.
The authors used five major demographic groupings to
categorize respondents. The five groups were labelled Rank,
TIS (time in service), Area (U.S. East or West Coast), LMET
(Leadership and Management Education and Training) and TYCOM
(type of community). These five major demographic groups
were further broken down into sixteen subgroups. Rank was
broken down into four categories: Junior Enlisted (E-5
through E-6); Senior Enlisted (E-7 through E-9); Junior
Officer (0-1 through 0-3); and Senior Officer (0-4 through
0-6). TIS was broken down into four categories by years of
time in service: First Termers (2 through 7 years);
72


Midgraders (8 through 13 years); Careerists (14 through 22
years); Careerists Plus (23 years or more). Area was broken
down into three categories, but only two had enough
respondents to use. Area categorized respondents according to
where they had been horaeported the majority of their active
duty time: (East Coast or West Coast). LMET categorized
personnel by whether or not they had attended LMET previously
or not. TYCOM was broken down into three categories:
(Surface, Aviation, Other-primarily Submarine).
Table III presents the overall sample mean and the means
from each of the subgroups.
Table III
Table of Means by Respondent Subgroup
GROUP
Sample
Junior EnlistedSenior EnlistedJunior OfficersSenior Officers
First TermersMidgradersCareeristsCareerists Plus
LMET AttendeeLMET Non-Attendee
SurfaceAviationOther
East CoastWest Coast
73
SIZE (N= )
OVERALL SUBGROUPMEAN SCORE
295 4.09
129617926
3.954.344.114.20
111908212
4.004.094.204.23
174120
4.144.03
7917936
4.114.074.17
22557
4.104.10

1. Overall Sample Results
The original hypothesis of this paper is that given
an opportunity to describe, through the medium of a modified
HRM questionnaire, and ideally effective naval organization,
experienced fleet personnel would not choose System Four
(participative group) management. In observing the overall
sample mean score, it would indeed appear that "fleet
experienced" personnel would not choose System Four
management as descriptive of the management system used in an
'ideally effective' naval organization. In the aggregate,
the sample population mean over all indices was 4.09. Thus,
the sample mean lies almost exactly on the breakpoint of 4.0
on the Likert scale separating his System Three management
(consultative) and System Four management, indicating an
association between effective naval organizations and
management methods that are partially consultative and
partially participative.
What is meant by consultative management or
participative-group management? It may be helpful to excerpt
briefly from Likert's New Patterns of M anage m ent . On
consultative management, Likert states, "In 'consultative 1
management, the higher echelon may discuss a problem with one
or all of the persons on the lower echelon(s), but the
decision is often made without any real participation by the
lower eschelons" [Ref. 44]. On participative management he
74


states, "Persons in organizations operating under the newer
(System Four) theory. ..exercise greater influence upon what
happens in the organization. This is true at every
heirarchical level from nonsupervisory personnel to the head
of the organization" [Ref. 45].
For the purposes of this study, the authors are
defining (at least numerically) System One as being indicated
by survey response scores of between 1 and 2, System Two
between 2 and 3, System Three between 3 and 4, and System
Four between 4 and 5. Additionally, although the authors
recognize that Likert uses consistent scores across most or
all survey indices as indicative of a particular approach or
"system" of management, for the purposes of the study the
authors will use subgroup scores on single indices or blocks
of indices to relate the subgroup to a particular system of
management.
Referring again to Table III, in all cases the
subgroup's mean scores were never more than .3 apart from the
overall sample mean, so in terms of the absolute scores of
the subgroups there seems to be agreement by all subgroups
that the consultative-participative method was associated
with the 'ideally effective' naval organization.
2. Mean Scores by Rank
The largest differences in the index scores occurred
in the Rank group. Within the Rank group, the largest
75


differences in the subgroup mean scores were between the
junior enlisted subgroup and the senior enlisted subgroup.
The junior enlisted subgroup, consisting of E-5 and E-6
personnel, had an overall mean on the questionnaire of 3.95.
The senior enlisted personnel subgroup, consisting of E-7,
E-8 and E-9 personnel, had an overall mean of 4.34. This
significant difference tends to indicate that there are real
differences between the philosophies espoused by these two
subgroups. It may show that the junior enlisted personnel
associated organizational effectiveness less with System Four
management than they did with System Three management. The
junior officer subgroup, consisting of 0-2 and 0-3 officers
had an overall mean of 4.11. The senior officer subgroup,
consisting of 0-4, 0-5 and 0-6 personnel, had a mean of 4.19.
Although this was not a significant difference at the .05
level, it may nonetheless indicate a shift toward greater
association of organizationally effective management methods
with System Four in the higher ranks. The correlation
coefficient between the overall mean score for the survey and
the independent variable Rank was .16, indicative of a
positive but relatively weak relationship between the two
variables.
3. Mean Scores by Time in Service
The four subgroups that composed the TIS group showed
a slight trend toward increases in mean scores as a function
76


of increases in time in service. The first subgroup, first
termers, consisting of personnel with from 2-7 years in
service, had a mean score on the questionnaire of 4.00. The
second subgroup, midgraders, consisting of personnel with
8-13 years, had a mean score of 4.08. The third subgroup,
careerists, consisting of personnel with from 14-22 years of
service, had a mean score of 4.20. The fourth subgroup,
careerists plus, consisting of personnel with 23 years of
service or more, had a mean score of 4.23. The correlation
coefficient between time in service and the overall sample
mean score was .16, indicating that time in service does
affect in some measure the way that respondents answered the
questionnaire. This trend may mean that the more
organizationally "good" or "bad" commands that an individual
has watched operate over the years, the more that the
individual associates effective organizations with System
Four management methods. It may also mean that individuals
with lots of time in service are also very senior persons and
if they routinely have to delegate a lot of responsibility
for decision making to lower levels, that they associate
participative methods and effectiveness more readily.
4. Mean Scores by LMET
The next group was LMET and was composed of the
subgroups of individuals who had previously attended LMET and
those that had not. It was expected that the theories
77


presented as part of the training on modern management
practices in the Navy would tend to drive the scores of the
attendees higher than the non-attendees. This was not found
to be the case at a level of significance of .92.
5. Mean Scores by Area
The fourth subgrouping was by the variable Area,
whether the respondent had spent the majority of their active
duty time in a command homeported on the East Coast, the West
Coast or 'other', primarily overseas. By subgrouping in this
manner any management biases resulting in some way from
having been associated mainly with the East Coast or West
Coast might be shown. Because of the small number of 'other'
respondents, this category was not included in the analysis.
On average, there was no discernable differences between the
two subgroup scores, with the East Coast subgroup having a
mean index score of 4.10 and the West Coast also 4.10. It is
possible that the subgroup sample size was not big enough to
reveal any differences that really are there in the total
population. It is equally possible that there are no
discernable differences in what type of management methods
are most associated with effective organizations on the basis
of area.
6. Mean Scores by TYCOM
The fifth independent variable that was used for
analyzing the data was TYCOM, the particular community the
78


respondent was from, surface, aviation or 'other' primarily
subsurface. It was expected that because of the
traditionally more technical orientation associated with
submarine and modern aircraft that personnel from these
communities might favor System Four type management to a
greater degree than their surface counterparts. The reasoning
was that in the more technical ratings, the influence of
personnel is more highly correlated with the level of
technical expertise. Since technical expertise is not solely
a function of seniority (although it is recognized that
greater experience can lead to greater expertise) it might be
reasonable for influence to be shared, for input into the
decision making process to be sought more widely by the
decision maker in the work group. The differences in the mean
scores across all indices did not reflect biases toward
management styles on the basis of community, however. The
aviation subgroup overall index score was lower than the
surface group which, in turn, was lower than the 'other'-
submarine group. The small range of the scores indicated,
more than anything else, that there is some consensus about
the management methods and style 'experienced' personnel
associated with effective organization, no matter which
community is queried.
As Maxwell-Gettys pointed out in their research on
Army and Navy offices, and as the authors of this research
79


have found, 'experienced' Navy personnel associate an
approach to management and decision making that falls between
Systems Three and Four with effective organizations in the
Navy.
C. STATISTICAL ANALYSIS OF GROUP MEAN DATA BY RANK
As explained in the previous chapter, we developed a
total of twenty-five indices from the thirty-eight questions
used in the survey. The three HRM success questions were left
as separate questions. The data were then broken down into
groups using the demographic information reported by the
respondents. A t-test was used to determine which group means
were statistically significantly different.
We first looked at the rank groups of junior enlisted,
senior enlisted, junior officer and senior officer. It
seemed to us that if there existed significant differences in
mean scores between groups, they would exist between
different combinations of the rank groups. We also felt that
these group comparisons would provide us with information
that would be of greater importance than the other
demographic groups as rank is emphasized throughout the Navy
and in all areas and types of commands.
This section is a discussion of the results of the
comparisons of the different groups.
80


1. Junior Enlisted Versus Senior Enlisted
Referring to Table IV, when we compared these two
groups, we found a significant difference in the overall
group mean score of 3.95 for junior enlisted personnel and
4.34 for senior enlisted personnel. We then looked at the
index mean scores to see where the differences were between
these two groups. The t-test showed a significant difference
in every index except two. Those indices showing no
significant difference in mean scores were command climate-
problem awareness and supervisory leadership-goal emphasis.
It hardly seems relevant to discuss all the indices
individually given the large quantity of indices that were
significantly different.
Every index showed a mean score considerably higher
for senior enlisteds, .39 higher on the average, than the
junior enlisted mean scores. Even with the t-test showing no
significant difference in the two aforementioned indices, the
senior enlisted mean was higher in each case. This would
appear to indicate that the senior enlisted personnel are
more oriented toward participative management than the junior
enlisted personnel. With the junior enlisted mean in the
consultative style range with a mean of 3.95, it appears that
they feel their level of participation should be slightly
lower than the participative group style. However, it
occurred to us that this lower mean score could also be a
31


Table IV
Index by Rank Subgroup Score
INDEX
1. Command Climate Communications Plow2. Command Climate Decision Making3. Command Climate Recognition4. Command Climate Personnel Welfare5. Command Climate Goals and Objectives6. Command Climate Problem Awareness7. Supervisory Leadership Support8. Supervisory Leadership Team Coord.9. Supervisory Leadership Team Emphasis10. Supervisory Leadership Goal Emphasis11. Supervisory Leadership Work Facilita.12. Peer Leadership Personal Problems13. Peer Leadership Team Coordination14. Peer Leadership Team Emphasis15. Peer Leadership Goal Emphasis16. Peer Leadership Problem Solving17. Work Group Coordination18. Work Group Decision Making19. Work Group Readiness20. Work Group Order and Discipline22. Lower Level Influence23. Leadership and Training24. Progress Satisfaction25. Promotion Satisfaction26. Grand Organization Style
JR ENL = JUNIOR ENLISTED SUBGROUPJR OFF = JUNIOR OFFICER SUBGROUP
JR ENL SR ENL JR OFF SR OFF
4.11 4.40 4.20 4.383.88 4.26 4.14 4.313.93 4.46 4.34 4.544.11 4.51 4.53 4.584.29 4.57 4.42 4.463.82 4.08 3.90 4.153.94 3.24 4.02 3.963.87 4.46 3.96 4.084.32 4.64 4.41 4.54
4.42 4.57 4.52 4.27, 3.98 4.34 4.00 4.193.64 4.03 3.80 3.773.79 4.26 3.75 3.924.01 4.49 4.18 4.234.02 4.48 4.14 4.193.92 4.30 4.09 4.193.73 4.25 3.87 4.233.91 4.21 4.08 4.153.76 4.25 3.87 3.924.12 4.61 4.37 4.503.31 3.61 3.61 3.383.98 4.31 4.05 4.003.87 4.39 4.19 4.233.87 4.38 4.22 4.543.95 4.34 4.11 4.19
SR ENL = SENIOR ENLISTED SUBGROUPSR OFF = SENIOR OFFICER SUBGROUP
82


reflection of the styles of management that they have
experienced throughout their career rather than their
perceptions of an ideal command. Even though the questions
were phrased "In an effective organization", it may be hard
for personnel to completely wipe out the past experiences and
imagine something different than they have ever experienced
in previous commands.
2. Junior Enlisted Versus Junior Officer
The overall group mean scores were closer together
for these two groups, with 3.95 for junior enlisteds and 4.11
for junior officers. This is an average difference of only
.171. It appears that these two groups have perceptions that
more closely parallel each other than the previous comparison
groups. This may be due to the relative short time in
service for both groups, again relying more on past
experience and management styles that they have experienced
than on their perceptions of an effective organization.
The comparison of indices showed fewer significant
differences in index mean scores between these two groups
than the previous comparison. The t-test showed significant
differences in six index mean scores; command climate-
decision making, command climate-recognition, command
climate-personnel welfare, lower level influence, progress
satisfaction and promotion satisfaction. In every index but
one, that of peer leadership-team coordination, the junior
83


officers recorded higher mean scores than did the junior
enlisted personnel/ but there was no significant differences
in the means of this index.
The command climate-decision making index is a
composite of three decision making related questions. Again,
we wondered if this might be a carry over of the past
experiences because of the low mean score (3.88) by junior
enlisted personnel. To investigate this index further, we
broke the index down by question and ran a student's T-test
to compare the question mean scores. Questions 4 and 5
consider decision making at the level where the most adequate
information is available and the sharing of information to
give decision makers access to all available know-how,
respectively. Question 6 refers to asking people for their
ideas when decisions are made. Questions 4 and 5 showed
significant differences while Question 6 showed no
significant difference. In both Questions 4 and 5, the
junior officers scored well into the participative group
range while the junior enlisteds were low participative group
or high consultative. This appears to indicate that junior
enlisteds feel that all levels of command should be consulted
to get information but that the decisions should be made at
higher levels in the command.
The mean scores for Question 6 were 3.67 for the
junior enlisted personnel and 3.86 for the junior officers.
34


While there was no significant difference between the two
group means, both were fairly well down into the consultative
range. It was surprising that these scores were so different
than the previous two questions. Again, the low mean scores
from both groups seems to indicate that they perceive their
role to be consultative rather than participative in the
decision making process.
A closely related index is that of lower level
influence. The group mean scores for this index were 3.31
for junior enlisteds and 3.61 for junior officers. These two
mean scores were the lowest index scores in this comparison.
This index shows that both groups are consultative in regards
to the amount of lower level influence that should exist in
the command. Again, it is surprising to us to see such a low
score for the junior enlisted personnel, as they are the
supervisors at the lower level referred to in the index.
Their score of 3.31 is low in the consultative range which
seems to indicate that they don't believe that they should
have much influence in what goes on in the command and that
they definitely should not participate in the command
decision making process.
By breaking this index down by the two questions that
comprise it, we found additional information that helps
explain the low score for both groups. Question 31
investigates the amount of influence that lower level
85


supervisors should have in the command. While there was a
significant difference in the scores in the two groups for
this question, the scores were in the upper range of the
consultative style with a score of 3.65 for junior enlisteds
and 3.94 for junior officers. This difference could be due
to the difference in the time the two groups have in the
service or the experience base of the junior enlisted
personnel who are really talking about themselves when they
say that lower level supervisors should be consulted rather
than participate. This difference could also be due to the
education of the average junior officer, that is, his liberal
arts background that suggests that everyone should have input
in decisions that affect them.
The scores for Question 32, which investigates the
amount of non-supervisory influence perceived, were really
low, lower than any other single question (with the exception
of the HRM program success questions) with scores of 2.97 for
junior enlisteds and 3.29 for junior officers. While the
score of 2.97 is close to the 3 mark, between consultative
and benevolent authoritative, it is still in the range of the
latter and has some indication that junior enlisteds feel
that non-supervisory personnel should be asked for opinions,
then told what to do. Junior officers are in the lower end
of the consultative range indicating that they feel that non-
supervisory personnel should at least be consulted and have
36


some influence in the decisions that affect their work group
or department.
The command climate-recognition index also showed a
significant difference in mean scores. The reported scores
were 3.93 for junior enlisteds and 4.34 for junior officers.
These scores seem to indicate that junior officers believe
that recognition for hard work is a bigger morale factor than
the junior enlisteds believe it to be. This was surprising
as it is the enlisted personnel that do the work and tend to
want recognition for the hard work they do. Again, this
difference may be due to the advanced education level of the
junior officers. However/ it may also be due to junior
enlisteds placing less emphasis on recognition because they
get satisfaction from just knowing that they have done a good
job.
The command climate-personnel welfare index showed
the greatest significant difference in this comparison with
scores of 4.2 and 4.5 for junior enlisteds and junior
officers, respectively. This is also surprising as this
question asks about the command interest in the welfare and
morale of assigned personnel. While both scores are into the
participative group range, we expected junior enlisteds to
score higher because they are down at the level where they
have to deal regularly with lack of command interest in the
morale and welfare of their personnel. Again, the only thing
87


we can think of that would account for this difference is the
fact that the junior enlisted responses may have been
affected more by experience than by their perceptions of the
ideal command.
The last two indices mentioned as having significant
differences in this comparison were progress satisfaction and
promotion satisfaction. Junior enlisted scores were
identical for both indices at 3.9 while junior officers
scored right at the 4.2 level for both indices. There is not
much doubt in our minds that this difference is due to the
difference in the promotion systems of the two rank groups.
Junior officer promotions are fairly automatic through the
junior officer ranks while junior enlisted personnel have to
be recommended for promotion and then pass the Navy
advancement examination in order to be promoted to the next
grade.
3. Junior Enlisted Versus Senior Officer
The overall mean scores for these two groups also
showed a significant difference. However, the difference was
less than the difference between the junior enlisted and
senior enlisted personnel. This was not surprising as we
expected senior enlisted personnel to be more participative
group oriented than senior officers as senior enlisteds seem
to be more aware of the needs of the personnel under them
than the senior officers are.
88


There were ten indices that showed significant
differences in mean scores at the .05 level of significance.
Five of these indices were in the command climate area;
communications flow, decision making, recognition, pesonnel
welfare and problem awareness. The other indices were peer
leadership-problem solving, work group-coordination, work
group-order and discipline, progress satisfaction, and
promotion satisfaction.
The biggest single difference in this comparison
appeared in the promotion satisfaction index which is not
surprising given that the senior officers have made their
promotions and do not have to worry about getting promoted to
be able to make the twenty year mark. The progress
satisfaction index has similar implications.
The other indices that showed a rather large
significant difference were in the command climate indices.
Command climate-recognition showed a big difference with the
junior enlisted personnel at 3.93 and senior officers at
4.54. It is somewhat surprising that senior officers would
score so much higher on this index than junior enlisteds who
are actually down there in the ranks doing the hard work. We
expected more the opposite scores, with junior enlisted
personnel scoring higher than the senior officers. However,
this may be due to a change in the attitudes of the officers
89


that has resulted from the increased HRM activities over the
past few years.
In the decision making index, the junior enlisteds
were solidly down in the consultative range at 3.88 while
senior officers were at 4.3, towards the middle of the
participative group range. When we examined this index by
question, we found a significant difference in all three
questions. This is not surprising as these questions talk
about the level at which decisions should be made and the
sharing of available know-how. We expected officers to score
high as they would think that they would have the most
adequate information with which to make decisions because of
having been kept informed of everything that goes on in the
command. However, we expected junior enlisteds to score
higher than they did, at least into the participative group
range, which would have indicated that they felt they should
participate in the decision making process at their level
when they have information affecting the decisions being
made. Their score, however, seems to indicate that they
perceive their role as a consultative one rather than a
participative one.
The command climate-communications flow index
questions are closely related to those of decision making.
There were significant differences in the scores of the first
two questions but not in the scores of the third question.
90


Even with the significant differences in reported scores, all
were in the participative group range. This seems to
indicate that both groups feel that communications flow is
very important for the organization to be an effective one.
The highest score of 4.6 came from the senior officers on
Question 2 which would appear to indicate that they feel that
the command should do a good job of putting out the word.
The difference here probably comes from the perspectives and
experiences of the two groups, the senior officers feeling
that it's extremely important and that they really do a good
job of putting out the word. Junior enlisted personnel also
feel that it is important but experience reflects that it
really doesn't happen the way it should. These same ideas
are probably the reasons for the differences in the scores of
the two groups in the personnel welfare and problem awareness
indices in the command climate area.
It was surprising to see scores of 3.92 and 3.73,
still in the consultative range, for junior enlisteds in the
peer leadership-problem solving and work group-coordination
indices, respectively. In both of these areas we would have
anticipated that junior enlisteds would have been up in the
participative group range. The differences in these two
indices can probably be explained due to the senior officers'
recognition of the importance of peer leadership and work
91


group coordination while junior enlisteds are still more
independent and self reliant.
The work group-order and discipline index also showed
a significant difference in the mean scores. While both
scores were well into the participative group range, the
senior officers' score of 4.5 reflects their emphasis on
order and discipline as a necessity from the command or
superior officer standpoint while junior enlisteds would cut
personnel a little more slack in the work group.
4. Senior Enlisted Versus Junior Officer
While there was a statistical significant difference
in the group scores of these two groups, both mean scores
were in the participative group range, the senior enlisteds
at 4.34 and the junior officers at 4.11. The fact that the
senior enlisteds scored higher is not surprising because of
their extended time of service compared to a relatively short
amount of service for the junior officers.
There were a total of twelve indices in this
comparison that showed a significant difference in the
index mean scores, more than any other comparison group.
These indices were command climate-communications flow,
supervisory leadership-support, supervisory leadership-team
coordination, supervisory leader ship- team emphasis,
supervisory leadership-work facilitation, peer leadership-
team coordination, peer leadership-team emphasis, peer
92


leadership-goal emphasis, work group-coordination, work
group-readiness, work group-order and discipline, and goal
integration. It was surprising that there were no significant
differences between these groups in the decision making or
lower level influence areas as we expected senior enlisteds
would score considerably higher in these indices, favoring
more participation in decision making and lower level
influence than the junior officers. The decision making
scores were very close and the lower level influence scores
were identical at 3.61.
In this comparison, unlike the previous comparisons,
there was only one index that was significantly different in
the command climate area, that of communications flow. When
examined by question, only Question 1 showed a significant
difference. While both scores were in the participative group
range, the senior enlisteds scored considerably higher at
4.47, than the junior officers.
In the supervisory leadership area, four of the five
indices were significantly different. It is not surprising
that the senior enlisted personnel would score higher in
those areas as these indices deal with supervisors' behavior
and increasing the group members' worth and dignity,
something that each senior enlisted person has had to deal
with personally as a supervisor. The junior officer would
not have had the opportunity to be a direct supervisor in
93


charge of lower ranking personnel and might not be as aware
of the importance of this aspect of supervision.
There were three peer leadership indices reporting
significant differences in mean scores between these two
groups. These indices deal with the behavior of the work
group members toward each other. The peer leadership- team
coordination index showed a junior officer score of 3.75,
well down in the consultative group. This index specifically
deals with the extent that work group members should take
responsibility for resolving disagreements and working out
acceptable solutions among themselves. The difference here
seems to be due to the junior officer feeling that the work
group members should not take the problem solving
responsibility upon themselves, but rather they should pass
it on up the chain to supervisors for resolution. Senior
enlisteds, on the other hand, realize the importance of
letting work group members take participative responsibility
for solving disagreements and problems within the group. The
other two peer leadership indices, team emphasis and goal
emphasis, reported significant differences for somewhat the
same reasons, that senior enlisteds recognize the importance
of working together as a team and putting forth their best
effort will result in better relationships between work group
members.
94


Three of the four work group indices showed
significant differences in mean scores with junior officers
scoring well down into the consultative range at 3.87 for
coordination and 3.88 for readiness. It was surprising that
the junior officers would score low in these two indices and
not in the other work group index, that of problem solving.
The low score in peer leadership-team coordination (3.75)
does not relate with a high score (4.08) in work group-
decision making. The difference in these two indices seems
to come from the different tense of the question, "take
responsibility" versus "expected to" make good decisions and
solve problems. It seems, then, that junior officers expect
work groups to make good decisions but don't really believe
that they do. The fact that junior officers scored low on
work group-readiness seems to indicate that they believe that
the work group should not be expected to handle emergency
situations without supervision.
The highest index mean score for senior enlisteds was
reported in the work group-order and discipline index.
Senior enlisteds reported a 4.61 mean for this index and
junior officers reported a 4.37. While both groups are close
to middle participative group, the higher score for senior
enlisteds indicates that they place more emphasis on good
order and discipline than junior officers do, probably
95


because of their extended length of service and many dealings
with the junior enlisted ranks.
5. Senior Enlisted Versus Senior Officer
There was no significant difference between the
overall group mean scores of these two groups. The overall
group means were 4.34 for senior enlisteds and 4.2 for senior
officers. There were only three indices that reported
significant differences, supervisory leadership-support,
supervisory leadership-team coordination, and peer
leadership-goal emphasis.
The differences in the supervisory leadership-support
index resulted from differences in Questions 11 and 12 of
this composite index. These questions deal with the
approachability of supervisors and their attentiveness to
what subordinates have to say. The lower scores on these
questions by senior officers seems to result from their
separation from the work group itself and the importance of
supervisors increasing the member's feelings of the self
worth and dignity. Senior enlisteds see this as more
important than senior officers because of their relative
closeness and their experience base. The other significantly
different index, peer leadership-goal emphasis, seems to be
the result of the circumstances just referred to.
96


6. Junior Officer Versus Senior Officer
The last groups compared by rank also showed no
significant difference in the overall group mean scores of
4.11 for junior officers and 4.2 for senior officers. Both
scores are in the lower range of participative group
management and their closeness appears to be due to the rank
position power possessed by both groups. The only
differences in index mean scores were in the work group-
coordination and promotion satisfaction indices. The scores
in the work group-coordination index were 3.87 and 4.23 for
junior and senior officers, respectively. This difference
appears to result from junior officers' perceptions that work
group members do not need to plan together and coordinate
individual actions because the work group is not at the
participative group level, that they take directions more
than participate in planning individual efforts.
The other index showing a significant difference in
mean scores was promotion satisfaction. While junior
officers are fairly satisfied with the promotion system for
officers, they still have to be concerned about making
promotions at the right time in their career. Senior
officers on the other hand, have made promotions to the point
that they are locked in for retirement and don't have to be
worried about being passed over for promotion and losing
their retirement.
97


In summary, the Rank subgroups comparisons revealed a
great number of statistically significant differences,
particularly between the Junior Enlisted subgroup and the
Senior Enlisted subgroup. The trend appears to be that with
increased seniority comes a shift in attitude of personnel
towards a more participative approach to management in some,
but not all, aspects.
D. STATISTICAL ANALYSIS OF GROUP MEAN DATA BY TIME IN
SERVICE
Referring to Table V, there were six indices which
displayed significant differences when the sample was grouped
according to the length of time in the Navy of the
respondent. The subgroups were labelled: First Termers (2-7
years); Midgraders (3-13 years); Careerists (14-22 years);
and Careerists Plus (23 or more years). Only the indices
that showed significant differences between at least two of
the subgroups will be discussed.
1. First Termers Versus Midgraders
The first two subgroups compared were First Termers
and Midgraders. There were two indices with significantly
different means between these subgroups: peer leadership
team emphasis and peer leadership goal emphasis. The First
Termers' mean scores were 4.03 and 4.01 respectively, with
the Midgraders scoring 4.26 and 4.27 respectively. These
indices refer to the degree personnel encourage their work
98


Table V
Index by Time in Service Subgroup Score
INDEX
1. Command Climate Ccmmunications Flow2. Command Climate Decision Making3. Command Climate Recognition4. Command Climate Personnel Welfare5. Command Climate Goals and Objectives6. Command Climate Problem Awareness7. Supervisory Leadership Support8. Supervisory leadership Team Coord.9. Supervisory Leadership Team Emphasis10. Supervisory Leadership Goal Emphasis11. Supervisory leadership Work Facilita.12. Peer Leadership Personal Problems13. Peer Leadership Team Coordination14. Peer Leadership Team Emphasis15. Peer Leadership Goal Emphasis16. Peer Leadership Problem Solving17. Work Group Coordination18. Work Group Decision Making19. Work Group Readiness20. Work Group Order and Discipline21. Goal Integration22. Lower Level Influence23. Leadership and Training24. Progress Satisfaction25. Promotion Satisfaction26. Grand Organization Style
FT MG CR CR PLUS
4.09 4.26 4.35 4.123.99 4.04 4.16 4.394.09 4.16 4.35 4.584.32 4.26 4.46 4.504.35 4.42 4.43 4.503.86 3.87 4.07 4.004.01 3.96 4.09 4.133.87 3.98 4.27 4.334.31 4.48 4.52 4.504.42 4.56 4.44 4.333.93 4.08 4.28 4.003.69 3.78 3.84 4.003.76 3.88 4.06 4.004.03 4.26 4.26 4.334.01 4.27 4.24 4.174.02 4.01 4.15 4.083.78 3.96 4.02 4.173.98 4.04 4.09 4.25
3.86 3.84 4.01 4.174.10 4.32 4.55 4.754.06 4.12 4.37 4.133.50 3.40 3.52 3.083.97 4.08 4.21 4.004.04 4.06 4.16 4.504.08 4.06 4.18 4.674.00 4.07 4.20 4.23
FT = First Termers, MG = Midgraders,CR = Careerists, CR PLUS = Careerists Plus
99


group peers to work cooperatively and maintain high
performance standards. These scores may indicate that the
personnel who enjoy a cooperative, high standards work group
environment, with members who encourage each other, tend to
stay in the Navy. Thus a relatively greater concentration of
such people with more time in service tends to drive these
indices up.
2. First Termers Versus Careerists
As might be expected, the comparison between First
Termers and Careerists yielded the greatest number of indices
with significantly different scores (9 out of 25). In every
index, the mean score of the Careerist was higher. These
indices included: command climate communications flow;
command climate recognition; supervisory leadership team
emphasis; supervisory leadership team coordination;
supervisory leadership work facilitation; peer leadership
team coordination; work group order and discipline; goal
integration and leadership training. The Careerists seemed
to attach a much greater importance to command wide two way
communication and recognition than did the First Termers.
This could be a result of having seen a work group perform
well or poorly because of the amount of attention and time
devoted to it by the work group supervisor. Careerists rated
the need for shared perceptions and expectations between work
group team members higher than did First Termers. The
100


Careerists scored mutual satisfaction of needs between
command and individual as more important than did First
Termers. This may be because those who do not feel that it is
important, that there should be a reciprocal and equitable
contribution toward the goals of the command and the goals of
individuals in the command, do not make the Navy a career.
Work group standards of good order and discipline (i.e. 'the
professional military work group*) was more emphasized by the
Careerists than by the First Termers. It is likely that
those who feel little motivation toward espousing Navy
standards do not become careerists. Careerists placed
greater emphasis on a unit's efforts to provide leadership
training than did the First Termers, as might be reasonably
expected. One index that was not significantly different,
surprisingly, was lower level influence. Careerists and
First Termers both scored almost the same. Both groups felt
that the lowest level supervisors (primarily E-4) should be
influential in decision making between 'to some extent' and
'to a great extent'. This was interpreted to be favoring a
consultative management approach to the subject of decision
making by lowest level supervisors.
3. First Termers Versus Careerists Plus
The type of indices significantly different between
First Termers and Careerists Plus subgroup were similar in
many instances to the careerist subgroup. Careerists
101


differed from First Termers on the command climate decision
making index, scoring significantly higher on this index than
the First Termers. This would tend to indicate that they
favored spreading the decision making down to the lower
levels. However, the Careerists Plus scored the lower level
influence index significantly lower than the First Termers.
This may mean that Careerists Plus favor delegating decision
making and are receptive to lower level input but only down
to a certain level. The work group order and discipline
index scores were even further apart for these two subgroups
than they were for the First Termers versus Careerists, with
the first Termers scoring a mean of 4.09 on this index, and
the Careerists Plus at 4.75. This may indicate among other
things that personnel who have been in the service a long
time (and are presumably senior) regard good order and disci-
pline in work groups as essential. Or it may show that they
have been away from work groups for a long time, since work
groups do not necessarily place good order and discipline at
the head of the list of priorities. Not surprisingly,
Careerists Plus rated their satisfaction with progress in the
service and satisfaction with promotions significantly higher
than did First Termers. One of the usual rewards the service
offers is steady progress and steady promotion. It is likely
that those personnel who value these rewards highly would end
up as Careerist Plus respondents.
102


4. Midgraders Versus Careerists
Only three indices were significantly different
between the Midgraders and the Careerists: supervisory
leadership team coordination; work group order and
discipline; and goal integration. In each index the
Careerists scored higher. Their score on goal integration may
reflect a more experience based perspective of the
requirement for satisfaction of mutual needs between the
command and the individual. The work group order and
discipline index went up for the Careerists as it did each
time the respondent group's seniority increased.
5. Midgraders Versus Careerists Plus
Between Midgraders and Careerists Plus almost exactly
the same set of indices were significantly different as
between First Termers and Careerists Plus. The only index
that was not significantly different in this comparison that
was significantly different between the First Termers and the
Careerists Plus was lower level influence. The Midgraders
and the Careerists Plus seemed to agree that lower level
influence should be in the System Three area. The Midgraders
seemed to be less prone to thinking that career progress and
promotion satisfaction were as important to effectiveness as
Careerists Plus did.
103


6. Careerists Versus Careerists Plus
Between the Careerists and the Careerist Plus
subgroups there were significant differences in subgroup mean
scores in three indices. Two of the three dealt with career
progress and promotion satisfaction. These scores differed
in that the Careerists rated these indices high and the
Careerists Plus rated the indices very high. The third index
was lower level influence. The Careerists associated lower
level influence with effectiveness to a much greater extent
than did Careerists Plus. This may indicate that the
personnel who have been in the service for the longest amount
of time simply do not come into contact with junior personnel
much, and are not much influenced in their decision by junior
personnel. It may be that when these senior people were
starting out in the Navy, lower level personnel were not
influential in the decision making process and their current
perspectives reflect this viewpoint.
E. STATISTICAL ANALYSIS OF GROUP MEAN DATA BY LMET
Referring to Table VI, the indices were analyzed on the
basis of whether or not the respondent had previously
attended LMET or not. Generally, the mean scores of all
indices were higher by one- or two-tenths of a point for LMET
attendees over non-attendees. There were, however, only four
indices where this difference was significant at the .05
level. These were: command climate recognition; supervisory
104

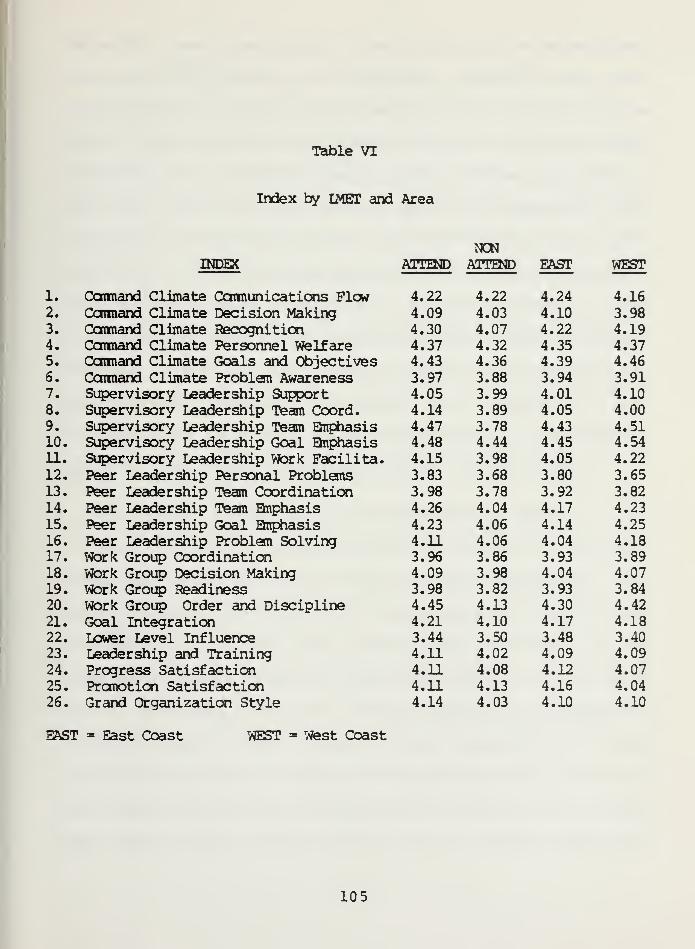
Table VI
Index by LMET and Area
INDEX
1. Command Climate Communications Flew2. Command Climate Decision Making3. Command Climate Recognition4. Command Climate Personnel Welfare5. Command Climate Goals and Objectives6. Command Climate Problem Awareness7. Supervisory Leadership Support8. Supervisory Leadership Team Coord.9. Supervisory Leadership Team Emphasis10. Supervisory Leadership Goal Emphasis11. Supervisory Leadership Work Facilita.12. Peer Leadership Personal Problems13. Peer Leadership Team Coordination14. Peer Leadership Team Emphasis15. Peer Leadership Goal Emphasis16. Peer Leadership Problem Solving17. Work Group Coordination18. Work Group Decision Making19. Work Group Readiness20. Work Group Order and Discipline21. Goal Integration22. Lower Level Influence23. Leadership and Training24. Progress Satisfaction25. Promotion Satisfaction26. Grand Organization Style
EAST = East Coast WEST = West Coast
NONATTEND ATTEND EAST WEST
4.22 4.22 4.24 4.164.09 4.03 4.10 3.984.30 4.07 4.22 4.194.37 4.32 4.35 4.374.43 4.36 4.39 4.463.97 3.88 3.94 3.914.05 3.99 4.01 4.104.14 3.89 4.05 4.004.47 3.78 4.43 4.514.48 4.44 4.45 4.544.15 3.98 4.05 4.223.83 3.68 3.80 3.653.98 3.78 3.92 3.82
4.26 4.04 4.17 4.23
4.23 4.06 4.14 4.254.11 4.06 4.04 4.183.96 3.86 3.93 3.894.09 3.98 4.04 4.073.98 3.82 3.93 3.844.45 4.13 4.30 4.424.21 4.10 4.17 4.183.44 3.50 3.48 3.404.11 4.02 4.09 4.094.11 4.08 4.12 4.074.11 4.13 4.16 4.04
4.14 4.03 4.10 4.10
105


leadership team coordination; peer leadership team emphasis
and work group order and discipline. Three of the four
indices pertain to work group functioning. All four of the
subject areas pertaining to these indices are covered in LMET
instruction with emphasis placed on the attendee improving in
each area. Since the questionnaire asked the respondent about
the extent to which each index was associated with an ideal
command, it is not surprising that LMET attendees answered
most indices higher, especially those that dealt in work
group functioning, one of the prime areas of LMET training.
However, based on the small number of indices with
significant differences, we conclude that attendance at LMET
does not have an effect on the perceptions of management
styles as they relate to organizational effectiveness.
F. STATISTICAL ANALYSIS OF GROUP MEAN DATA BY AREA
This section is included more for what it says about
similarities than what it says about differences. The
authors wanted to find out if there were any significant
differences in index mean scores on the basis of the
respondent having served in the Navy primarily on the East
Coast, the West Coast or 'other' (primarily homeported
overseas). There weren't enough 'other' respondents to study
so that category was dropped. The majority (4:1) of the 290
plus respondents had been homeported primarily on the East
Coast during their careers. There were no indices found that
106


had significant differences. Almost no variance was
accounted for by using area as an independent variable.
Referring again to Table VI, it was noted that although not
statistically significant, East Coast personnel scored higher
in career progress and promotion satisfaction than West Coast
personnel. The West Coast personnel scored higher in all the
indices related to work groups. The differences were never
very great, and the authors can only conclude that knowing
that an individual has a background on the West Coast or the
East Coast is not likely to bring much insight into what
he/she thinks an effective organization should look like, or
if he/she favors participative-group management or not.
G. STATISTICAL ANALYSIS OF GROUP MEAN DATA BY TYCOM
1. Surface Versus Aviation
Referring to Table VII, there were no significant
differences in any of the indices between the surface
respondents and the aviation respondents. Generally, the
aviation personnel had higher mean scores on the indices
related to the command as a whole, (Cl through C6) and the
surface respondents scored higher on the indices related to
the work group (C8 through C20). This may be indicative of
an attitude espousing greater top management involvement in
command wide issues in the aviation community and greater
emphasis on the integration of the individual work groups
into the total command structure. The aviation respondents
107


Table VII
Index by Type of Community
INDEX
1. Command Climate Communications Flow2. Command Climate Decision Making3. Command Climate Recognition4. Command Climate Personnel Welfare5. Command Climate Goals and Objectives6. Command Climate Problem Awareness7. Supervisory Leadership Support8. Supervisory Leadership Team Coord.9. Supervisory leadership Team Emphasis10. Supervisory Leadership Goal Emphasis11. Supervisory Leadership Work Facilita.12. Peer Leadership Personal Problems13. Peer Leadership Team Coordination14. Peer Leadership Team Emphasis15. Peer Leadership Goal Emphasis16. Peer Leadership Problem Solving17. Work Group Coordination18. Work Group Decision Making19. Work Group Readiness20. Work Group Order and Discipline21. Goal Integration22. Lower Level Influence23. Leadership and Training24. Progress Satisfaction25. Promotion Satisfaction
SURFACE AVIATION OTHER(SUB)
4.17 4.22 4.314.00 4.10 4.044.19 4.20 4.284.28 4.39 4.314.42 4.39 4.394.04 3.90 3.814.00 4.01 4.13
4.14 3.95 4.224.47 4.41 4.424.35 4.50 4.534.13 4.03 4.20
3.81 3.74 3.864.00 3.82 4.004.18 4.13 4.364.24 4.08 4.364.08 4.03 4.194.03 3.85 4.004.08 3.98 4.253.96 3.84 4.114.34 4.28 4.444.20 4.15 4.193.33 3.51 3.504.11 4.06 4.004.04 4.08 4.284.15 4.10 4.17
108

also scored higher in the index on lower level influence.
This may be as a result of dependence on aviation on the
technical expertise and judgment of lower ranked technicians
in aviation.
2. Surface Versus Other (Subsurface)
There were no significant differences in any of the
index means. All indices related to the command as a whole
were scored higher by the submarine subgroup. The work group
related indices were split about evenly between the two
subgroups. Lower level influence was scored higher by the
submarine respondents, perhaps for the same or similar
reasons as the aviation group scored higher than surface.
3. Aviation Versus Other (Subsurface)
The submarine respondents scored significantly higher
means in two of the work group related indices, peer
leadership goal emphasis and work group decision making. The
aviation subgroup scored higher (although not statistically
significantly higher) on the lower level influence index.
This was interpreted as indicating that the submarine work
group may be a little more self -di r ec t i ve in nature.
Although none of the other indices were significantly
different, it was interesting to note that the submarine
respondents scored higher means on every work related index
except lower level influence. The interpretation may be that
submarine respondents associated a stronger work group with a
109


more organizational effective command more strongly than did
the aviation respondents.
H. SUMMARY OF GROUP MEAN DATA
In summary, grouping the sample by rank and time in
service revealed the greatest variance between subgroups.
Figure 5.9 graphically presents the rank subgroup mean scores
for each index using Likert's dimensions. All the rank
subgroup mean scores fell between 3 and 5 on the scale,
therefore, that portion of the scale was expanded to better
show the relationship of the mean scores to each other and to
Likert's Systems of Management. As Figure 5.9 shows, there
was not much difference between the subgroups. Generally,
the more senior personnel were to the right tending toward
Likert's System Four (participative group) while the more
junior personnel were on the left, tending toward System
Three (consultative) management. Also, the lowest scores by
all subgroups were recorded in the lower level influence
index, revealing mean scores tending towards System Two
(benevolent authoritative) style of management.
The other three groupings, type of community, area and
LMET, revealed no significant differences between subgroup
mean scores.
110


Index Likert Scale
c<m - —Ul o u o
COMMAND CLIMATE COMMUNICATIONS FLOW
COMMAND CLIMATE DECISION MAKING
COMMAND CLIMATE RECOGNITION
COMMAND CLIMATE PERSONNEL WELFARE
COMMAND CLIMATE GOALS AND OBJECTIVES
COMMAND CLIMATE PROBLEM AWARENESS
SUPERVISORY LEADERSHIP SUPPORT
SUPERVISORY LEADERSHIP TEAM COORDINATION
SUPERVISORY LEADERSHIP TEAM EMPHASIS
SUPERVISORY LEADERSHIP GOAL EMPHASIS
SUPERVISORY LEADERSHIP WORK FACILITATION
PEER LEADERSHIP PERSONAL PROBLEMS
PEER LEADERSHIP TEAM COORDINATION
PEER LEADERSHIP TEAM EMPHASIS
PEER LEADERSHIP GOAL EMPHASIS
PEER LEADERSHIP PROBLEM SOLVING
WORK GROUP COORDINATION
WORK GROUP DECISION MAKING
WORK GROUP READINESS
WORK GROUP ORDER AND DISCIPLINE
GOAL INTEGRATION
LOWER LEVEL INFLUENCE
LEADERSHIP AND TRAINING
PROGRESS SATISFACTION
PROMOTION SATISFACTION
GRAND ORGANIZATION STYLE
JR ENL= JUNIOR ENLISTED SUBGROUP
JR OFF= JUNIOR OFFICER SUBGROUP
SR ENL= SENIOR ENLISTED SUBGROUP
SR OFF= SENIOR OFFICER SUBGROUP
Figure 5 . 9 Index by Rank Subgroup Scores
using Likert ' s Dimensions
111


I. INTERVIEW RESULTS
The interviews were conducted in the latter part of
September, 1982, while the authors were on a previously
scheduled HRM field trip. There was a total of thirty-four
Navy personnel interviewed. Table VIII shows the breakdown
of interviewees by rank and area.
Table VIII
Interviews by Rank and Station
RANK
E-5E-6E-7E-8E-90-30-40-50-6
TOTALS
NAVAL AIR STATIONJACKSONVILLE
3
2
4
1
10
NAVAL STATIONCHARLESTON
2
4
6
5
2
1
2
_2
24
The personnel from Naval Air Station, Jacksonville were
from an operational helicopter squadron and the personnel
from Naval Station Charleston were assigned to the Fleet and
Mine Warfare Training Center.
The interviews were recorded with each individual's
permission. Upon the authors ' return to the Naval
Postgraduate School, and after the other research data was
analyzed, the interview tapes were reviewed and the
112


information they contained was tabulated. In most cases,
specific quotes from several individuals were transcribed
that reflected perceptions of from some to many other
interviewees. Survey research data was used to generate the
questions for the interviews for the purpose of establishing
a contextual framework for the survey data. Thus, interview
information was gathered to gain a better understanding of
why survey respondents answered questions the way they did.
Interview data and quotes were identifiable by rank only. A
check was run on the distribution of survey responses as a
function of rank to see if there were any irregular or bi-
modal distributions. While there weren't any bi-modal
distributions, there were distributions of responses that
were spread over a larger range than other responses when
broken down by rank.
The key areas focused on in the interview questions
concerned morale and welfare of personnel, work group
functioning and supervision, lower level influence, order and
discipline, and HRM success.
The following is a discussion of some of the significant
perceptions revealed during the interviews and how they may
relate to the survey responses analyzed in the previous
section.
113


1. Morale and Welfare
The mean of the index dealing with recognition was
scored significantly lower for the Junior Enlisted subgroup
than for the other three subgroups. Personnel interviewed
were asked to respond to the question of how important they
felt recognition for hard work is to a unit and why. One E-6
explained his thoughts as, "It's very important, but there is
such a thing as overkill. Too much reward becomes nothing at
all". The Senior Enlisted subgroup mean score on this index
approximated the other subgroup's means. A Chief Petty
Officer related his personal views on the importance of
recognition, "As a First Class I didn't get all the
recognition I deserved. I think it affects my job. In the
job I'm doing right now, I could put forth a lot more effort
and do a much better job, but I keep looking back and I
didn't get the recognition or the programs that I was
interested in".
The mean score for the index referring to the degree
to which unit top management, the command, should be made
aware of problems at the respondent's level was higher for
both the two senior subgroups, enlisteds and officers.
Interviewees were asked to respond to the question of how an
effective naval organization acts in this regard. A
Lieutenant commented, "It's all contingent upon the magnitude
of the problem". A Second Class Petty Officer stated that
114


"It's not that important, particularly for an E-5 running a
work center. He needs to be able to solve problems on his
own to develop his leadership skills". A First Class from an
aviation squadron remarked, "It depends on the problem. If
later on it will embarrass the higher-ups then they should be
made aware of it. If it's just a personal problem, handle it
at lower levels. Some problems should go all the way up".
2. Work Group Functioning and Supervision
One index dealt with the degree that a supervisor
should be easy to approach when he should be told that things
are not going as well as they should be in a work center.
Although the mean scores for this index were between 3.8 and
4.0 for all four of the Rank subgroups, the interview
comments were worded more strongly. An E-6 commented, "It's
very important. If a guy comes unglued every time, people
aren't going to tell him things are all screwed up". Another
E-6, from the surface community, stated, "It's important
because the supervisor has blind spots. If the worker can't
approach the supervisor, then he will probably take things
into his own hands and try to correct them, and not handle
the problem as well as the supervisor could have".
The mean scores for all subgroups were low for the
index dealing with the degree to which work group members
should be willing to listen to each other's problems.
Personnel were asked for their perceptions. A Lieutenant
115


stated, "It depends on the problem. It's not necessary to
have work group members listen to your personal problems".
An aviation E-6 felt that, "You can talk about personal
problems better at the level of your own peers. It should
never go below the level of your peer group. Chiefs take care
of Chiefs and First Class take care of First Class." A
surface E-6 added, "Peers aren't always the best avenue for
dealing with personal problems. However, they can be very
effective for dealing with professional problems."
Three of the subgroups scored a much lower mean than
the authors' expected on the survey index asking to what
degree work groups should take responsibility for resolving
their own disagreements and working out acceptable solutions.
The authors thought this index would be scored very high when
referenced to the 'ideally effective' Naval organization.
One surface E-6 felt that, "Work groups should take
responsibility to resolve their own minor problems. The
major ones should go vertically. The responsibility for
major problem resolution is not on the workers. Your peers
can and will give you suggestions, but more often than not,
it's the chain of command that will solve the problem."
3. Order and Discipline
While all the subgroup scores were above four in the
index measuring the degree to which work groups should
maintain high standards of order and discipline, the Junior
116


Enlisted subgroup was the lowest and there was a significant
difference between their mean and the means of the other
subgroups. Most interviewees felt that high standards of
order and discipline were mandatory. However, comments by
two E-6's helps to explain the Junior Enlisted perspective.
One said, "It's not very important. Being well dressed and
maintained on the job is not necessarily to the
organization's benefit. The standards of order and
discipline should be matched to the job at hand, white collar
versus blue collar." Another E-6 comment was that, "It's
fairly important. ..but if rigid, no flexibility, it's more of
a detriment. There needs to be flexibility." The score and
comments by the Junior Enlisted personnel tend to indicate
that they feel order and discipline are not quite as
important to the effectiveness of the work group as their
superiors.
4. Lower Level Influence
The low scores of all subgroups on the index dealing
with lowest level supervisor influence may be attributable to
almost all personnel surveyed feeling that there is a limit
to the amount of influence that lower ranking supervisory
personnel should have. One E-5 stated, "He should have some,
but not a heck of a lot; he doesn't always have the big
picture." A Lieutenant stated he felt that, "If they have a
suggestion or something, it should be considered."
117


Concerning the influence non-supervisory (E-3 and below)
should have in the decision making process in the work group,
an E-5 stated that, "He should have input into his
supervisor. Everyone needs to feel his opinions are needed."
An E-8 surface type explained, "If you take his input, you'll
get more from him. You'll show him you are interested in
what he says." While all interviewees felt that personnel
should be consulted and listened to, most also felt that
influence from the lower ranks should be kept in persepctive
and conditioned on their skill and knowledge level.
5. HRM Success
As was mentioned in Chapter 4, the authors were
interested in the responses of personnel regarding their
perceptions of the success of the Navy's HRM program. Our
survey data paralleled that of the Maxwell-Gettys data.
Table IX shows the mean scores of the three indices that
dealt with HRM program satisfaction.
Table IX
HRM Success Scores by Rank Subgroups
PAST PRESENT FUTURESUBGROUP SUCCESS SUCCESS POTENTIAL
Junior Enlisted 2.96 3.34 3.10
Senior Enlisted 2.62 3.26 3.00
Junior Officer 2.41 2.90 2.80
Senior Officer 2.42 3.10 2.50
118


As can be seen, perceived HRM program success in the
past received the lowest scores. Interviews revealed that
there is potential perceived for HRM success in the present
and the future. In regards to the past, an E-6 commented, "It
doesn't have any power or any control over the situation. It
(HRM-presumably the HRAV) just makes recommendations that are
generally ignored." As one Senior Chief with 17 and a half
years put it, "The command doesn't see the feedback and
nothing is done even when the Chiefs and the Officers know
there are problems. The CO says everything is OK, so that's
it." The criticism was also raised by other personnel, that
when feedback was received by the command it was put on a
shelf and never used.
When asked to comment on why they thought future HRM
success would be lower than present program success, two 0-5
Officers both stated that the future potential for HRM
program success was probably lower because people were seeing
less emphasis placed on the HRM program from top Navy
management. This was in regards to both using the program and
placing successful people in the HRM program. One 0-5 stated
that, "HRM is a dead end job. Those in charge are there
because they couldn't make it in the fleet, so their
credibility is not good. There will not be any teeth in the
program until the perception is changed about the job and
good officers are in those jobs and receiving good fitness
119


reports." One E-7 echoed these feelings saying, "They're not
going to improve anything unless they try to improve the
program and the people in it and most people don't see them
doing that." An 0-6 HRM officer stated that the Navy is aware
of these perceptions and actions are underway to correct the
situation. About half of the Junior enlisted subgroup felt
that there is potential for future success for the HRM
program. One E-6 said, "It's becoming more and more effective
all the time". An E-7 stated that, "HRM can be a vital asset
if it gets some good backing from the admiral types, like
(them) telling the CO's to take the read outs and do
something with them". Several Petty Officers mentioned that
as more personnel go through LMET and realize where their
command is at and what their leadership and management
program is, that "they will more readily accept the HRM
programs"
.
To summarize the interviews, there were items which
all interviewed personnel agreed were positively associated
with organizational effectiveness. These questions dealt
with: vertical communications, which nearly everyone agreed
was vital; the supervisor having access to the best
information no matter at what eschelon that information might
be; the supervisor's having to be approachable with bad news
by his subordinates; the work group being able to work
effectively under pressure, which everyone agreed was
120


important and most personnel rated as a fundamental
requirement for a work group.
As indicated by interviewees, it was generally felt
that in an effective organization, non-supervisory personnel
should not have much influence in what goes on in the
command
.
The majority of questions, as might be expected, were
not agreed on by all the subgroups either for or against.
Questions that evoked a variety of opposing perceptions
between interviewees dealt with: command recognition;
command level awareness of lower level problems; peers in
work groups listening to each other's problems; work groups
being able to resolve successfully their own problems; work
group order and discipline; promotion and career progress
satisfaction; lower level supervisor influence in work group
decision making.
121


VI. CONCLUSIONS AND RECOMMENDATIONS
A. CONCLUSIONS
Based on the analysis and the discussion in the previous
chapter on the data obtained from the two hundred ninety-five
surveys and the thirty-four interviews, the authors offer the
following conclusions.
The overall sample mean score for all respondents was
4.09. This score is almost exactly between Likert's System
Three (Consultative) and System Four (Participative Group)
management styles. This result tends to indicate that naval
personnel, with at least some supervisory or management
experience, on the average, associated organizational
effectiveness with management styles that are receptive to
input from all levels of command in the decision making
process. The esteem in which this input is held tended to be
a function of the expertise and/or the experience of the
giver. Interview data supported the conclusion that once the
input had been received from all sources, the decision maker
tended to make the decision without further participation
from lower level personnel. This style of management is
consistent with a consultative management style, Likert's
System Three. This conclusion parallels Gettys and Maxwell's
conclusion that "...the appropriate management style for
122

today's officers might be consultative rather than
participative" [Ref. 46].
As was mentioned in Chapter V, the rank subgroup
comparisons revealed the greatest number of statistically
significant differences between subgroups on various indices.
More importantly, however, were the significant differences
between the subgroups themselves, indicating the differences
between subgroups on their perceptions of management styles
as they relate to effective naval organizations. There were
statistically significant differences in subgroup overall
mean scores between the junior enlisted personnel (3.95) and
each of the other three groups, senior enlisted personnel
(4.34), junior officer personnel (4.11) and senior officer
personnel (4.20). There was also a statistically significant
difference in the scores of senior enlisted personnel (4.34)
and junior officers (4.11). There were no significant
differences between subgroup overall mean scores of senior
enlisted personnel and senior officers nor between junior and
senior officers. These scores reveal the trend that the
junior personnel, both enlisted and officer, are less
oriented toward a participative group style of management
than their rank counterparts.
The time in service (TIS) subgroup comparisons supported
the trend developed by the rank subgroups. Personnel with
the least time in service were the least oriented toward
123


participative group with a mean score of 4.00, while the
personnel with the most time in service were moving into the
participative group range at 4.23. A conclusion drawn from
this is that as personnel gain rank and time in service, they
tend to move toward a System Four style of management.
We felt that the comparison of whether personnel had
attended LMET or not would reveal significant differences
between those who had attended and those who had not. It
seemed to us that after having attended the LMET course,
having been thus exposed to the various leadership and
management techniques taught in this course, that the
perceptions of personnel would have moved more toward a
participative group style of management than those who had
not been exposed to those same techniques. However, the data
did not reveal significant differences in the overall mean
scores between these groups. It might be concluded, then,
that it is time in service and not attendance at LMET that
moves personnel to associate increased organizational
effectiveness with a participative group style of management.
The other two subgroup comparisons, Type of community
(TYCOM) and area of assignment (Area) also revealed no
statistically significant differences in the subgroup overall
mean scores. While there were a few significant differences
in certain indices between different subgroups, there was not
enough of a difference to show that either TYCOM or Area had
124


any effect on the perceptions of how these subgroups felt an
effective naval organization should operate.
In addition to the conclusions drawn above regarding the
subgroup overall mean scores, which relate to systems
perceptions, using all indices, the following conclusions are
drawn from certain indices, which relate various aspects of
management styles with increased organizational
effectiveness.
First, in the area of communications. Mean scores for
rank subgroups in the communications index followed the trend
indicated by TIS. Communications flow scores tended to move
more toward System Four management as time in service
increased. Based on these scores and comments made by most
interviewees, the longer a person has been in the Navy, the
more strongly he feels communication flow is related to
organizational effectiveness. This indicates that personnel
become more aware of giving and receiving information that
pertains to them as time in service increases.
Second, the area of decision making also followed the
trend of increasing importance to organizational
effectiveness as time in service increases. In both indices,
command climate-decision making and work group-decision
making, senior enlisteds and senior officers scored higher
than their rank counterparts. With scores ranging from 3.88
for junior enlisteds to 4.31 for senior officers, a
125


reasonable conclusion is that input is important but that
full participation was not perceived to be strongly related
to increased organizational effectiveness.
Finally, the three program success related questions and
the interview data indicated that the HRM program remains
burdened with problems regarding its programs and image as
perceived by experienced fleet personnel. Chief among the
perceived problems were the following:
1. The HRM program has little power or influence tomake commands improve once problem areas have beenidentified. The HRAV data is either not believed orignored by commanders and put on the shelf with no furtheraction taken.
2. HRM program billets are perceived by fleetpersonnel as dead end jobs and not career enhancing,particularly for officer personnel. Therefore, thecredibility of those filling HRM billets is hurt and theyare perceived as not knowing what is going on in the fleet.
3. The HRM program in general, and the HRAV inparticular, are "leftovers" from the Zumwalt era,requirements that have to be complied with because they aremandatory. This seems to be a result of a lack of emphasisfrom the Navy heirarchy.
In summary, we believe that the conclusions reflect a
consensus response other than Likert's optimum of "5". The
overall mean score of 4.09 is in the System Four range, but
it is not even close to a "5". Rather, it tends very closely
to System Three, a consultative style of management. Although
the perceptions of experienced personnel, both officer and
enlisted, tended to move toward "5" as time in service and
rank increased, the scores remained in the lower range of
126


participative group management. These perceptions indicate
that experienced fleet personnel relate effectiveness in
naval organizations with a more consultative style of
management rather than a more participative group style of
management.
HRM program ineffectiveness in the past has created
perceived problems for the future. The potential at the
present was scored higher than the potential for the future,
possibly due to the perceived lack of support from the Navy
hierarchy. Interviewees felt that the future potential would
be better if HRM was made more attractive to personnel as a
career field.
While it is recognized that the sample was not a true
random sample, it is the authors' belief that it is not
biased in any way, for or against participative management or
the HRM program. We feel that the data from the sample are
accurate and representative of perceptions of experienced
naval personnel.
B. RECOMMENDATIONS
Based on the results obtained from the data collected by
both survey and interviews and the conclusions drawn from
this data, the following recommendations are offered.
(1) Program Success. All of the HRM program success
scores are low. Some possible explanations for these low
scores were pointed out in the interviews that were
127

conducted. These explanations, however, cannot be considered
conclusive. A further study should be undertaken to
investigate further the perceptions of personnel as to why
the program success scores are so low. Specifically, why the
expected success of the program for the next three years was
lower than the present success potential for program success.
(2) Expand the study of enlisted personnel. There were
some very significant differences between junior and senior
enlisted personnel. As was mentioned previously, in every
index, except for two, there was a statistically significant
difference. The study should be expanded to investigate
these differences further. With an expanded sample, different
rank groups or individual ranks could be used to study these
differences more closely, what they are and where they exist.
Specifically, where does the difference in the mean scores of
3.95 and 4.34 for junior and senior personnel, respectively,
really fall out and why? Why are the junior enlisted
personnel so much lower overall than the senior enlisted
personnel?
(3) Reassess the use of the survey. The responses that
were generated in this study were those of experienced naval
personnel. The overall mean score of 4.09 should be an
indication that experienced naval personnel do not feel that
"5", the maximum on the scale, is the ideal environment for
128


Navy organizations. The results tend to indicate that a
different norm may be appropriate. Based on the perceptions
of experienced personnel in this study, a participative style
of management may not be the ideal style of management for
the Navy. Some other style of management, such as
consultative management, may be more appropriate for naval
commands. While "5" is not perceived to be the best indicator
of organizational effectiveness, neither are the fleet norms
that commanders currently use to compare their command scores
with. Based on the perceptions of experienced fleet
personnel, fleet norms seem to be low while "5" seems to be
high, as a measure of organizational effectiveness in
naval organizations.
129


APPENDIX A
SURVEY
Note: Read these answer choices over carefully.Then answer each of the following questionsby placing an X in the numbered box underthe answer you want to give.
In an effective organization, to what extent is the amountof information shared among work groups adequate to meetjob requirements?
In an effective organization, to what extent does the com-mand do a good job in "putting out the word" to all hands?
2 *
* a
£ e2
c x
£
XV
%V
a >a 2
& e
1 2 3 u 5
a a
1 2 3 u 5
a a d a aIn an effective organization, to what extent is the chainof command receptive to ideas and suggestions from membersof the command?
12 3 4 5
a a a a
In an effective organization, to what extent are decisionsmade at the level of command where the most adequate inform-ation is available?
1 2 3 <* 5
n nIn an effective organization, to what extent is informationwidely shared so that those who make decisions have accessto available know-how? a a a a a
In an effective organization, when decisions are made, towhat extent are the people affected asked for their ideas?
1 2 3 u s
D D DIn an effective organization, to what extent do people whowork hard receive recognition from the command?
12 3 u 5
D D DIn an effective organization, to what extent does the com-mand have a real interest in the welfare and morale ofassigned personnel? n a a
9. In an effective organization, to what extent does the com-mand have clear-cut, reasonable goals and objectives thatcontribute to its mission accomplishment? n n n a d
LO. In an effective organization, to what extent are people athigher levels of command made aware of the problems at alllevels of command?
1 2 3 u. £
a a a a11. In an effective organization, to what extent are super-
visors friendly and easy to approach? d a a d12. In an effective organization, to what extent do super-
visors pay attention to what subordinates say?
13. In an effective organization, to what extent are super-visors willing to listen to subordinates' problems?
I 1*. In an effective organization when things are not goingas well as the supervisor expects, to what extent is iteasy for subrdinates to -ell him/her?
a a c a d
a d a d a
d d a d u
130


Note: Read these answer choices over carefully.Then answer each of the following questionsby placing an X in the numbered box underthe answer you want to give.
IS. In an effective organization, to what extent do super-visors encourage the people in their work group toexchange opinions and ideas?
e —
i 5
<u <-> Xg id «
V s 2** o 1*j X «J fl— V g X P•H 4) Vi-> V i
r* X w«»> 44 fl >M u VS 1 i I
fl <8 2 !0 Q
.o a a 2S- S- 6- F H
1 2 3 i* 5
a a15. In an effective organization, to what extent do super-
visors encourage the people in their work group towork as a team?
1 2 3 u 5
d a a a17. In an effective organization, to what extent do super-'
visors encourage the members of their work group togive their best efforts?
1 2 3 u 5
a a a a aIn an effective organization, to what extent do super-visors provide the assistance their subordinates need toplan, organize and schedule their work ahead of time?
1 2 3 U 3
Dia. In an effective organization, to what extent do super-
visors offer subordinates ideas to help solve job-"related oroblems?
12 3^3d a a a a
20. In an effective organization, to' what extent do workgroup members listen to each others' problems?
12 3 u 5
a21. In an effective organization, to what extent do work group
members take responsibility for resolving disagreementsamong themselves, working out acceptable solutions?
1 2 3 » S
D D22. In an effective organization, to what extent do work group
memoers encourage each other to work as a team?
2 3. In an effective organization, to what extent do work groupmembers encourage each other to give their best effort? n d d d a
2u. In an effective organization, to what extent do work groupmembers offer each other ideas for solving job-relatedproblems? DIn an effective organization, to what extent do work groupmembers plan togexher and coordinate their individual efforts? D D
25. In an effective organization, to what extent are work groupmembers expected to make good decisions and solve problemseffectively? D D D D D
2 7. In an effective organization, to what extent are work groupsexpected to handle non-routine or emergency situations?
1 2 3 * 5
D D D2 8. In an affective organization, to what extent are high
standards of order and discipline maintained within thecommand? d ri d g
131

Note: Read these answer choices over carefully.Then answer each of the following questionsby placing an X in the numbered box underthe answer you want to give.
29. In an effective organization, to what extent is thecommand affective in getting you to meet its needsand contribute to its effectiveness?
XV H X
gj w 11
-J VV >.
w X w aw V ~ X V•*H V V
5b—
1
V uX H> « V fl ;»
s•*4
1 i Im fl s 93 S
.0 a ,0 pe« f> r" H r-
] 2 3 U 5
a a a30. In an effective organization, to what extent does the
command do a good job of meeting the needs of itsmembe rs ?
1 2 3 u 5
31. In an effective organization, to what extent do lower-level supervisors influence what goes on in the command?
1 2 3 u 5
a32. In an effective organization, to what extent do non-super-
visory personnel influence what goes on in the command"?1 2 3 4 S
a d a a a33. In an effective organization, to what extent does the com-
mand emphasize training which helps personnel leadershipresponsibility?
Mote: These are different answer choices from theprevious choices. Read these answer choicesover carefully. Then answer each of the follow-ing questions by placing an X in the numberedbox under the answer you want to give.
34. In an affective organization, how satisfied are individualswith the progress that they have made in the military upto now?
12 3 4 3
D a a a-o •oV 11 V•«* •H •JOh IM na CO <u V•M •H a —**> fcl ~H lMIB M -JCO CO fl —*<a !0 9 ~>•** M 1TJ V "J > to
> a W - >>
V 3CO
Vz .13 >
a a g a a
3S . In an affective organization, how satisfied are memberswith their perceived chances of getting ahead in the militaryin the future?
a a
SUCCESS 3F HUMAN RESOURCE MANAGEMENT CHRM) IN THE NAVY
Note: These are different answer choices from theprevious choices. Read these answer choicesover care f'ally. Then answer each of the follow-ing questions by placing an X in the numberedbox under tne answer you want to give.
36. ?ver the oast three years , to what extent, in your opinion,fiave v -.^an Resource Management Centers /Detachments (HRMC/D' s )
been successful in assisting commands you've served in tobecome affective organizations?
37. In you opinion, to what extent do HRMC/D' 3 currently havethe potential tc be successful in assisting commands m
33.
becoming a Tractive organizations?
Over the nextHRMC/D' s to Si
what extent do you expectsuccessful in assisting commands in becoming
three ye ars
,
rective organizations
c1)
wid DXo id X
id yy i) 2
3 X .j j; Tid B c X 9
a aH =3
X^ *J V •3 >>
J
g 3 | 3) 3
a ig 2 o 3
a .0 .0 o .3
i2 i a ;
n D a a
a a g g c
a a g a a g132


ZEM0G3APHICS
39. What is your pay grade?
1
Q E-5
2
n s-6
3
n s- 7
D s- 9
D 0-2
D °- 3
3
0-4
9
|OS or OS
40. What is your sex?
Male
2
[Female
41. How aany years have you served enactive duty?
42. Mainly, -jhere have you been hone-ported?
Q U.S. East coast
U.S. West coast
3
] Otter (specify)
43. Which type of ccnuand have you mainlybeen assigned to?
1
PI Surface units (ships coroany)
2
™] Aviation units
3
Other (specify)
44. Have you attended LMET?
1
D Yes
2
(H 2-4 years
2
|
5-7 years
3-13 years
Q 11-13 years
5
[14-15 years
5
17-19 years
j
20-22 years
3
2 3-25 years
9
|25 years or nnore
133


APPENDIX B
QUESTION SELECTION CRITERIA
Selection criteria for the questions used was based on
one or more of the following criteria:
1. Of the original HRM survey questions/ we selectedthose questions that were from the Michigan survey. Weomitted those questions that were navy-peculiar.
2. Of the questions from the Michigan survey that wereused in the Gettys, Maxwell study, we selected those thatrevealed:
a. an extremely low mean score
b. a great difference of means between operationaland HRM personnel.
3. At least one question was selected from each index.
The following is a list of the reasons for choosing the
questions that we used to make up the survey.
QUESTION REASON
1. it is an important indicator of the amount
of lateral communications flow in the command.
2. important because it indicates the amount of
downward communications that should be in the
command
.
3. Important as an indicator of the amount of upward
communications that should be in the command and
the amount of participation allowed.
134


4. It is important to know if the decisions are made
at the level of command where the most adequate
information is available.
5. It is important to have available know-how shared
in the decision making process.
6. Low mean score from operational officers and a big
spread between the two means. This is an important
indicator of the amount of participation in the
decision making process.
7. Motivation indicator. Shows the degree of
decentralizing effect on the command.
8. Important as an indicator of the amount of concern
the command shows in their personnel.
9. It is important that all levels in the command have
knowledge and input in the goals and objectives of
the command so that all personnel know what the
command's mission is.
10. Both mean scores were low. We feel it is important
for managers to know if problems exist and what
they are.
11. Low mean score from operational personnel and wide
spread between mean scores for each group. This is
an indicator of how approachable supervisors should
be.
135


12. Indicator of the amount of participation by members
that should be allowed in the command.
13. Indicator of the amount of concern supervisors
should have for their personnel.
14. Important to know if supervisors should be willing
to listen to subordinates when they report that
something is not going right.
15. Good indicator of the amount of team coordination
and participation that should exist in the group.
16. Action oriented toward teamwork and participative
management climate in the command.
17. Important as an indicator of the amount that
supervisors encourage team work and participative
management.
18. Indicator that supervisors encourage participation
in the planning and decision-making process.
19. Low mean scores form both groups. Indicator of the
amount of supervisor direction versus subordinate
participation.
20. Low mean scores from both groups. Indicator of
amount of concern by command and individuals for
individual welfare and the morale of the command.
21. Indicator of the importance of a team being able to
work out its own problems rather than push them up
the chain of command.
136


22. Indicator of the amount of team work that should
exist in the command.
23. Low score from operational personnel. Indicator of
how much the command stands to gain from team
effort.
24. Indicator of the amount of team work and
participative management that should be allowed in
the command rather than requiring problems be
solved at higher levels.
25. Indicator of team work and less supervisor directed
planning and decision making.
26. Low score from operational personnel may indicate
that they expect supervisors/ not group members/ to
make decisions and solve problems.
27. Important indicator of the amount of decision
making allowed at the work group level.
28. Indicator of the amount of order and discipline
that should be maintained in an effective command.
29-30. Only index of question where operational personnel
had higher mean scores on both questions than HRM
personnel.
31. Very low mean scores indicate that officers don't
believe that lower level supervisors should
participate in the decision making process.
137


32. Extremely low mean scores indicates that officers
don't think that non-supervisory personnel should
have influence in the decision making process.
These results certainly are not participative
management oriented. Interesting to see how
enlisted personnel respond to this question.
33. The higher this score is, the greater potential for
members to participate in leadership/decision
making
.
34-35. Indicative of command concern for members' satis-
faction with their progress and advancement in the
military, and the retainability of its members.
36-38. Important to explore the perceptions of the future
potential of the HRM program success compared to
past and present success.
138

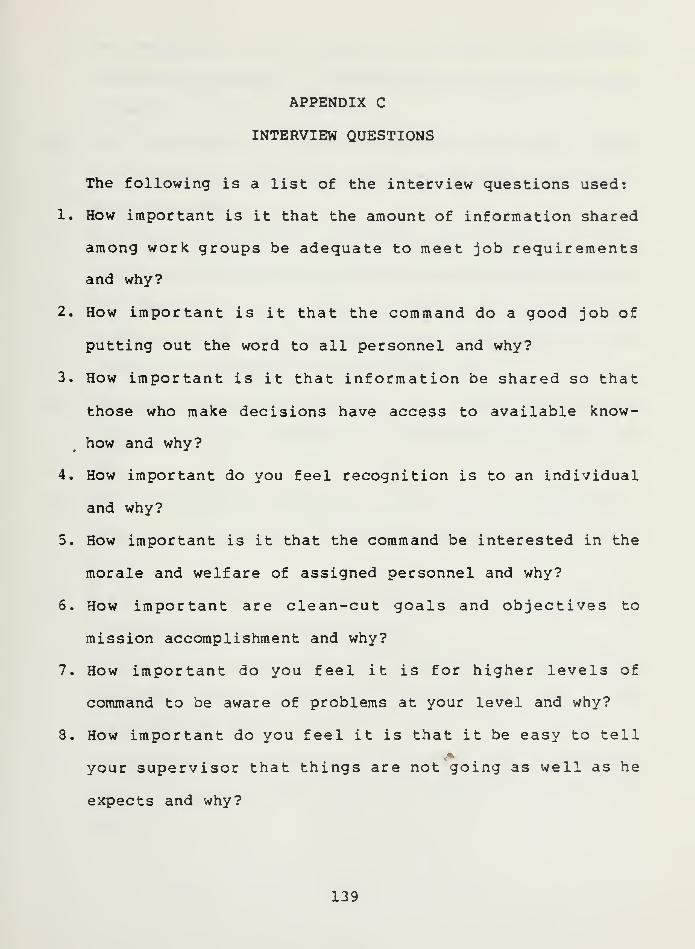
APPENDIX C
INTERVIEW QUESTIONS
The following is a list of the interview questions used:
1. How important is it that the amount of information shared
among work groups be adequate to meet job requirements
and why?
2. How important is it that the command do a good job of
putting out the word to all personnel and why?
3. How important is it that information be shared so that
those who make decisions have access to available know-
how and why?
4. How important do you feel recognition is to an individual
and why?
5. How important is it that the command be interested in the
morale and welfare of assigned personnel and why?
6. How important are clean-cut goals and objectives to
mission accomplishment and why?
7. How important do you feel it is for higher levels of
command to be aware of problems at your level and why?
8. How important do you feel it is that it be easy to tell
your supervisor that things are not going as well as he
expects and why?
139


9. How important do you feel it is that a supervisor
encourage the people in his work group to work as a team
and why?
10. How important is it that a supervisor of a work group
encourage his work group members to give their best
effort and why?
11. How important is it to you that other members of your
work group be willing to listen to your problems and why?
12. How important is it that the work group take the
responsibility for resolving its disagreements and
working out acceptable solutions and why?
13. How important is it for the work group to perform
effectively under pressure or in emergency situations and*
why?
14. How important do you feel it is that Navy standards of
order and discipline be maintained within your work group
and why?
15. How satisfied are you with your perceived chances of
getting ahead in the Navy and why?
16. Do you feel it is important that non-supervisory
personnel have influence in what goes on in the
department and why?
17. Do you feel it is important that lower level supervisors
have influence on what goes on in your department and
why?
140

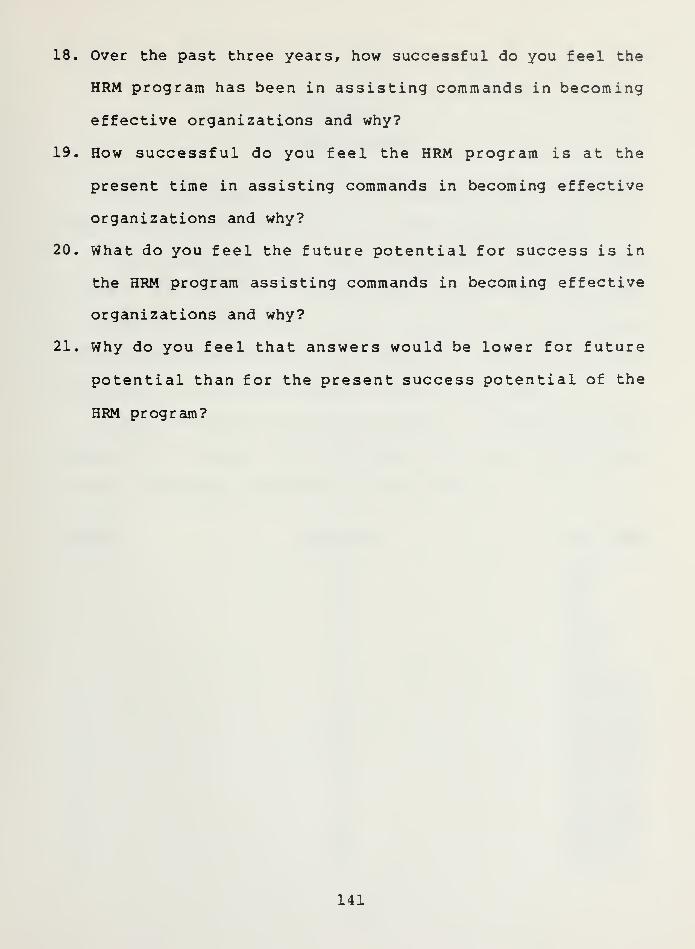
18. Over the past three years, how successful do you feel the
HRM program has been in assisting commands in becoming
effective organizations and why?
19. How successful do you feel the HRM program is at the
present time in assisting commands in becoming effective
organizations and why?
20. What do you feel the future potential for success is in
the HRM program assisting commands in becoming effective
organizations and why?
21. Why do you feel that answers would be lower for future
potential than for the present success potential of the
HRM program?
141


APPENDIX D
DATA CODE BOOK
1. The following gives a description of how the ques-
tionnaire was coded for use in the SPSS systems packet.
2. One computer card was utilized for entry into the
system. The variable, command, was entered after the data
file had been constructed. This was possible only because
the questionnaires had been kept separate by command and were
maintained in the order entered into the data base.
3. The following section provides a breakdown of the
coding of the survey. This procedure will permit easy coding
for any additional information in the future.
CARDCOL QUESTION VAR. NAME
1 — RANK2 — SEX3 — TIS4 — AREA5 — TYCOM6 — LMET7 — SPACE8 1 C0MCLCF19 2 C0MCLCF2
10 3 C0MCLCF311 4 COMCLDMl12 5 COMCLDM213 6 COMCLDM314 7 COMCLMT115 8 COMCLHRl16 9 COMCLHR217 10 COMCLHR318 11 SUPLDSI119 12 SUPLDSI2
142


CARDCOL QUESTION VAR. NAME
20 13 SUPLDSI321 14 SUPLDSI422 15 SUPLDTC123 16 SUPLDTE124 17 SUPLDGE125 18 SUPLDWFl26 19 SUPLDWF227 20 PEELDSIl28 21 PEELDTC129 22 PEELDTE130 23 PEELOGE131 24 PEELDWF132 25 WRKPRCI133 26 WRKPRCI234 27 WRKPRRI135 28 WRKPRDI136 29 ERMGOAL137 30 ERMGOAL238 31 ERMLLI139 32 ERMLLI240 33 ERMTRAl41 34 ERMSAT142 35 ERMSAT243 36 PGMSATl44 37 PGMSAT245 38 PGMSAT346 — SPACE47 — PERSON48 — PERSON49 — PERSON50 — SPACE51 — COMMAND
4. The following section provides the coding and method
of computation for the indices used for comparison in the
study. This information does not represent data placed on
cards, but rather a manipulation of section above.
143


VAR.NAME QUESTION VAR. LABEL
CI 1-3 COMMAND CLIMATE-COMMUNICATIONS FLOW
C2 4-6 COMMAND CLIMATE-DECISION MAKING
C3 7 COMMAND CLIMATE-RECOGNITION
C4 8 COMMAND CLIMATE-PERSONNEL WELFARE
C5 9 COMMAND CLIMATE-GOALS & OBJECTIVES
C6 10 COMMAND CLIMATE-PROBLEM AWARENESS
C7 11-14 SUPERVISORY LEADERSHIP-SUPPORT
C8 15 SUPERVISORY LEADERSHIP-TEAM COORDINATION
C9 16 SUPERVISORY LEADERSHIP-TEAM EMPHASIS
CIO 17 SUPERVISORY LEADERSHIP-GOAL EMPHASIS
Cll 18-19 SUPERVISORY LEADERSHIP-WORK FACILITATION
C12 20 PEER LEADERSHIPPERSONAL PROBLEMS
C13 21 PEER LEADERSHIPTEAM COORDINATION
C14 22 PEER LEADERSHIPTEAM EMPHASIS
C15 23 PEER LEADERSHIPGOAL EMPHASIS
C16 24 PEER LEADERSHIP
COMPUTATION
COMCLCF1+COMCLCF2+COMCLCF3/3
COMCLDM 1+COMCLDM 2 +
COMCLDM3/3
COMCLMI1
COMCLHRl
COMCLHR2
COMCLHR3
SUPLDSI1+SUPLDSI2+SUPLDSI3+SUPLDSI4/4
SUPLDTC1
SUPLDTEl
SUPLDGE1
SUPLDWF1+SUPLDWF2/2
PEELDSI1
PEELDTC2
PEELDTE1
PEELDGEl
PEELDWFlPROBLEM SOLVING
144


VAR.NAME
C17
C18
C19
C20
C21
C22
C23
C24
C25
C26
QUESTION VAR. LABEL
25 WORK GROUPCOORDINATION
26 WORK GROUPDECISION MAKING
27 WORK GROUPREADINESS
28 WORK GROUPORDER & DISCIPLINE
29-30 GOAL INTEGRATION
31-32 LOWER LEVELINFLUENCE
33 LEADERSHIP TRAINING
34 PROGRESS SATISFACTION
35 PROMOTION SATISFACTION
GRAND ORGANIZATIONSTYLE
COMPUTATION
WRKPRCI1
WRKPRCIl
WRKPRRIl
WRKPRDIl
ERMGOAL1+ERMGOAL2/2
ERMLLI1+ERMLLI2/2
ERMTRAl
ERMSATl
ERMSAT2
C1+C2+C3+C4+C5+C6+C7+C8+C9+C10+C11+C12+C13+C14+C15+C16+C17+C18+C19+C20+C21+C22+C23+C24+C25/25
145


LIST OF REFERENCES
1. Gettys, Mark and Maxwell, Arthur, Q.L2.*!lLL*t±onaIEffectiveness; A Comparative Study , Paper submitted atthe Naval Postgraduate School, Monterey, California,Dec. 1981.
2. Frohman, Mark A. and Saskin, Marshall, The Practice ofOrganization Development: A Selective Revie w, ResearchReport to the United States Office of Naval Research,1970, p. 3.
3. Ibid. , pp. 3-5.
4. Beckhard, Richard, Organizational Development '.Strategiesand Models , Addison-Wesley Publishing Company, 1969, pp.9-10.
5. 31ake, Robert R. and Mouton, Jane S., The ManagerialGrid , Houston, Texas, Gulf Publishing Company, 1964, pp.5-7.
6. Ibid. , pp. 5-7.
7. Appley, L. A., Management in Action , New York, AmericanManagement Association, 1956, pp. 20-22.
8. Follett, Mary Parker, "The Giving of Orders" in H.
C.Metcalf and L. Urwick (eds.) Dynam ic Adm inistration ,
Harper, 1941, p. 65.
9. Tannenbaum, Robert and Schmidt, Warren H., "How toChoose a Leadership Pattern", Harvard Business Revie w,
Vol. 51, No. 3, May-June, 1973, pp. 173-179.
10. Fiedler, Fred E., "Engineer the Job to Fit the Manager",Harvard Business Review , Vol. 43, No. 5, Sep-Oct, 1971,
pp. 115-122.
11. House, Robert J., "A Path-Goal Theory of LeaderEffectiveness", Administrative Science Quarterly , Vol.16, No. 3, Sep., 1971, pp. 321-338.
12. HoTheo
use, Robert J. and Mitchell, Terence R., "Path-Goaleory of Leadership", Journal of Contemporary Business ,
1. 3, No. 4, Autumn, 1974, pp. 81-94.Vol
146

13. Likert, Rensis, The Hum an Organization , New York,McGraw-Hill, 1967, pp. 3-10.
14. Blake, Robert R., Mouton, Jane S., The Managerial Grid ,
Houston, Texas, Gulf Publishing Company, 1964, pp. 8-9.
15. Blake, Robert R. and Mouton, Jane S., The New ManagerialGrid , Houston, Texas, Gulf Publishing Company, 1978,p. 11.
16. Ibid., pp. 10-12.
17. Marrow, A., Bowers, D., Seashore, S., M anagem ent byParticipation , New York, Harper and Row, 1967.
18. Blake, Robert R. , Mouton, Jane S., Barnes, L., Greiner,L., "Breakthrough in Organizational Development",Harvard Business Review , Vol. 42, Nov-Dec , 1964.
19. Likert, Rensis, Ne w Patterns of Management , New York,New York, McGraw-Hill Book Company, 1961, p. 221.
20. Booz, Allen and Hamilton Incorporated Technical Reportfor U.S. Navy, A System s Analysis of the Navy's HumanResource Management Program , by Sharon Bishop and PeterGaskin, 30 September 1979, p. 168.
21. Shear, ViceAdm H. E., "Navy Human Resource ManagementSupport System (OPNAVINST 5300. 6B)", U. S. NavyInstruction issued October 10, 1975.
22. Zumwalt, Elmo R., On_Watch, New York, New York,Quadrangle | The New York Times Book Company, 1976,p. 170.
"
23. Ibid., p. 168.
24. Zumwalt, Admiral Elmo R., "Human Resource Management",Chief of Naval Operations message (OPNAV Z-55),November 4, 1970.
25. Lyons, K. H., Command Development Task Force Report,"Letter to the Chief of Naval Operations", March 5,
1973.
26. Zumwalt, 1976, p. 241.
27. Butler, P. N., Engineering Social Change , Ph.D. Thesis,University of California, San Diego, 1981, p. 24
147


28. Weisner, ViceAdm M. P., "Navy Human Goals Plan(OPNAVINST 5300.6)", U. S. Navy Instruction issuedAugust 6, 1973.
29. Shear, 1975.
30. Forbes, Raymond L. Jr., A Cause Celebre: OrganizationDevelopm ent in the U.S. Navy , a paper presented to ajoint meeting of the Inter-University Seminar and TheAmerican Psychological Association, Washington, D.C.,September 6, 1976.
31. Naval Personnel and Research Development CenterTechnical Report 75-1, The Measurement of OrganizationalEffectiveness; A Review of Relevant Research andOpinion , by J. P. Campbell, D. A. Bownas, N. G. Petersonand M. D. Dunnette, July, 1974.
32. Likert, 1961, p. 105.
33. Naval Personnel and Research Development CenterTechnical Note 76 - Survey-Based Organizational Develop-m ent: Models and Efficiency , by Alan W. Lau, 1976,p~. 3.
34. Likert, 1961, p. 253.
35. Taylor, J.C. and Bowers, D.G., Survey of Organizations:A Machine-Scored Standardized Questionnaire Instrument ,
AnnArbor, Center for Research on Utilization ofScientific Knowledge, Institute for Social Research,1972.
36. Institute for Social Research, Ann Arbor, Michigan,U. S. Navy Technical Report, The Navy as a FunctioningOrganization: A Diagnosis , by david G. Bowers and JeromeL. Franklin, June, 1973, p. 18.
37. Institute for Social Research, Ann Arbor, Michigan, U.S.Navy Technical Report, The Hum an Resource M anage m entSurvey: An Item Analysis , by John A. Drexler, Jr.,July, 1974.
38. Naval Personnel and Research Development CenterTechnical Note 75- Hum an Resource M anage m ent and Non-judicial Punishm ent Rates on Navy Ships , by Kent 3.
Crawford, August, 1975.
148


39. Naval Personnel and Research Development CenterTechnical Note 76-32, Hum an Resource Manage m ent andOperational Readiness as Measured by Refresher Trainingon Navy Ships , by Sandara K. Mumford, February, 1976,p. 19.
40. Booz, Allen and Hamilton, 1979, p. 170.
41. Ibid., p. 142.
42. Gettys and Maxwell, 1981.
43. Gettys and Maxwell, 1981, p. 94.
44. Likert, 1961, p. 87.
45. Ibid., p. 239.
46. Gettys and Maxwell, 1981, p. 93.
149


INITIAL DISTRIBUTION LIST
No. Copies
1. Assistant for Analysis, Evaluation (NMPC-6C) 1
Human Resource Management & Personal AffairsDept.
Navy Military Personnel CommandWashington, D.C. 20370
2. Director, Human Resource Management Division 1
(NMPC-62)Human Resource Management & Personal Affairs
Dept.Navy Military Personnel CommandWashington, D.C. 20370
3. Director for HRM Plans and Policy (OP-150) 1
Human Resource Management DivisionDeputy Chief of Naval Operations (Manpower,
Personnel & Training)Washington, D.C. 20370
4. Commanding Officer 1
Human Resource Management SchoolNaval Air Station MemphisMillington, Tennessee 38054
5. Commanding Officer 1
Human Resource Management Center LondonBox 23FPO, New York 09510
6. Commanding Officer 1
Human Resource Management Center5621-23 Tidewater DriveNorfolk, Virginia 23509
7. Commanding Officer 1
Human Resource Management CenterPearl Harbor, Hawaii 96860
8. Commanding Officer 1
Human Resource Management CenterNaval Training CenterSan Diego, California 92133
150

9. Commanding OfficerOrganizational Effectiveness Center & SchoolFort Ord, California 93941
10. Commanding OfficerHuman Resource Management CenterCommonwealth Building, Room 11441300 Wilson Blvd.Arlington, Virginia 22209
11. Defense Technical Information CenterCameron StationAlexandria, Virginia 22314
12. Library, Code 0142Naval Postgraduate SchoolMonterey, California 93940
13. LCDR R. E. Tate1836 E. Blount StreetPensacola, Florida 32503
14. CPT Michael E. Aston, USARoute 4 Box 144Rupert, Idaho 83350
15. Professor Reuben T. Harris, Code 54HeNaval Postgraduate SchoolMonterey, California 93940
16. Professor Richard McGonigal, Code 54MBNaval Postgraduate SchoolMonterey, California 93940
151


0193
tOrganizational
effectiveness in thee
Navy: is particip-
ative management the.
Navy way.
18 APR 91
18 W
3 0-9956 7 65
3 6 7 6 5
Thesis
T1645cl
200T3T
TateOrganizational
effectiveness in the
Navy: is particip-
ative management the
Navy way?

S;SS 1
onaleffect,veness:
nlJeNavv
3 2768 002 05474 4
DUDLEY KNOX LIBRARY
&$
HPKM
$tttt6N£
ifml
9s •
'IV-'i/ ':•:'''" ^-'
IRHH','''.
/4' '•, '•'
> ,\ '<>'j'. Ssi .'•'
snmTOMK