Organization of ocular dominance and orientation columns ...
15
Visual Neuroscience (1995), 12, 589-603. Printed in the USA. Copyright © 1995 Cambridge University Press 0952-5238/95 $11.00 + .10 Organization of ocular dominance and orientation columns in the striate cortex of neonatal macaque monkeys GARY BLASDEL, 1 ' 2 KLAUS OBERMAYER, 3 - 4 AND LYNNE KIORPES 5 'Department of Physiology, University of Calgary, Calgary Alberta, Canada T2N-1N4 2 Department of Neurobiology, Harvard Medical School, Boston 3 The Salk Institute, La Jolla "The Rockefeller University, New York 'Center for Neural Science, New York University, New York (RECEIVED May 13, 1994; ACCEPTED November 30, 1994) Abstract Previous work has shown that small, stimulus-dependent changes in light absorption can be used to monitor cortical activity, and to provide detailed maps of ocular dominance and optimal stimulus orientation in the striate cortex of adult macaque monkeys (Blasdel & Salama, 1986; Ts'o et al., 1990). We now extend this approach to infant animals, in which we find many of the organizational features described previously in adults, including patch-like linear zones, singularities, and fractures (Blasdel, 19926), in animals as young as 3| weeks of age. Indeed, the similarities between infant and adult patterns are more compelling than expected. Patterns of ocular dominance and orientation, for example, show many of the correlations described previously in adults, including a tendency for orientation specificity to decrease in the centers of ocular dominance columns, and for iso-orientation contours to cross the borders of ocular dominance columns at angles of 90 deg. In spite of these similarities, there are differences, one of which entails the strength of ocular dominance signals, which appear weaker in the younger animals and which increase steadily with age. Another, more striking, difference concerns the widths of ocular dominance columns, which increase by 20% during the first 3 months of life. Since the cortical surface area increases by a comparable amount, during the same time, this 20% expansion implies that growth occurs anisotropically, perpendicular to the ocular dominance columns, as the cortical surface expands. Since the observed patterns of orientation preference expand more slowly, at approximately half this rate, these results also imply that ocular dominance and orientation patterns change their relationship, and may even drift past one another, as young animals mature. Keywords: Development, Primate striate cortex, Ocular dominance, Orientation selectivity Introduction Neurophysiological studies have shown that most neurons in striate cortex are binocular and selective for orientation (Hubel &Wiesel, 1962, 1968, 1972, 1974a,b). Their binocularity is fur- ther characterized by a preference for one eye, referred to as "ocular dominance," and their preference for orientation is fur- ther characterized by a degree of selectivity, which is frequently referred to as "orientation selectivity" or "orientation tuning." As numerous studies have shown, these response properties are not strewn about randomly, but are highly organized across the cortical surface. Cells preferring a particular eye, for example, Reprint requests to: Gary Blasdel, Department of Neurobiology, Harvard Medical School, 200 Longwood Avenue, Boston, MA 02115, USA. appear to be organized in slab-shaped regions, 0.25-0.5 mm wide, that run vertically between pia and white matter, that lie in register with bands of afferents from the appropriate eye in layer 4c, and that interdigitate with slabs dominated by the other eye (Hubel & Wiesel, 1972; LeVay et al., 1975; Hubel & Wiesel, 1977). Preferences for orientation also appear to be organized in slabs, but ones that are much narrower and shorter in length. The main reason these slabs are shorter is that they converge periodically in the centers of ocular dominance columns, at points, or singularities, which take on the appearance of "rosettes" or "pinwheels" when preferences for different ori- entations are illustrated in color, as they are in Fig. la (Blasdel & Salama, 1986; Blasdel, 19896, 1992; Ts'o et al., 1990; Bon- hoeffer & Grinvald, 1991). Because most orientation slabs extend between singularities in adjacent ocular dominance col- umns, they tend to cross their borders at right angles (Obermayer 589 https://www.cambridge.org/core/terms. https://doi.org/10.1017/S0952523800008476 Downloaded from https://www.cambridge.org/core. NYU Medical Center: Ehrman Medical Library, on 23 Feb 2018 at 18:59:26, subject to the Cambridge Core terms of use, available at
Transcript of Organization of ocular dominance and orientation columns ...

Visual Neuroscience (1995), 12, 589-603. Printed in the USA.Copyright © 1995 Cambridge University Press 0952-5238/95 $11.00 + .10
Organization of ocular dominance and orientationcolumns in the striate cortex of neonatalmacaque monkeys
GARY BLASDEL,1'2 KLAUS OBERMAYER,3-4 AND LYNNE KIORPES5
'Department of Physiology, University of Calgary, Calgary Alberta, Canada T2N-1N42Department of Neurobiology, Harvard Medical School, Boston3The Salk Institute, La Jolla"The Rockefeller University, New York'Center for Neural Science, New York University, New York
(RECEIVED May 13, 1994; ACCEPTED November 30, 1994)
Abstract
Previous work has shown that small, stimulus-dependent changes in light absorption can be used to monitorcortical activity, and to provide detailed maps of ocular dominance and optimal stimulus orientation in thestriate cortex of adult macaque monkeys (Blasdel & Salama, 1986; Ts'o et al., 1990). We now extend thisapproach to infant animals, in which we find many of the organizational features described previously inadults, including patch-like linear zones, singularities, and fractures (Blasdel, 19926), in animals as young as3 | weeks of age. Indeed, the similarities between infant and adult patterns are more compelling thanexpected. Patterns of ocular dominance and orientation, for example, show many of the correlationsdescribed previously in adults, including a tendency for orientation specificity to decrease in the centers ofocular dominance columns, and for iso-orientation contours to cross the borders of ocular dominancecolumns at angles of 90 deg. In spite of these similarities, there are differences, one of which entails thestrength of ocular dominance signals, which appear weaker in the younger animals and which increasesteadily with age. Another, more striking, difference concerns the widths of ocular dominance columns,which increase by 20% during the first 3 months of life. Since the cortical surface area increases by acomparable amount, during the same time, this 20% expansion implies that growth occurs anisotropically,perpendicular to the ocular dominance columns, as the cortical surface expands. Since the observed patternsof orientation preference expand more slowly, at approximately half this rate, these results also imply thatocular dominance and orientation patterns change their relationship, and may even drift past one another,as young animals mature.
Keywords: Development, Primate striate cortex, Ocular dominance, Orientation selectivity
Introduction
Neurophysiological studies have shown that most neurons instriate cortex are binocular and selective for orientation (Hubel&Wiesel, 1962, 1968, 1972, 1974a,b). Their binocularity is fur-ther characterized by a preference for one eye, referred to as"ocular dominance," and their preference for orientation is fur-ther characterized by a degree of selectivity, which is frequentlyreferred to as "orientation selectivity" or "orientation tuning."As numerous studies have shown, these response properties arenot strewn about randomly, but are highly organized across thecortical surface. Cells preferring a particular eye, for example,
Reprint requests to: Gary Blasdel, Department of Neurobiology,Harvard Medical School, 200 Longwood Avenue, Boston, MA 02115,USA.
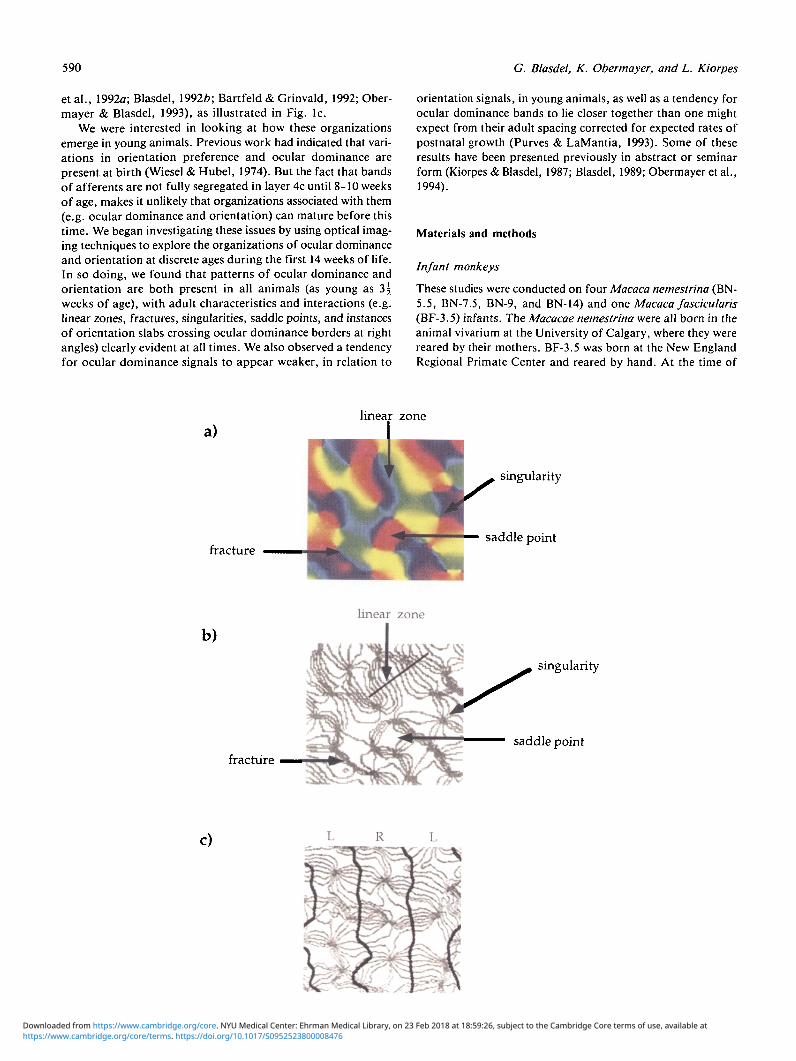
appear to be organized in slab-shaped regions, 0.25-0.5 mmwide, that run vertically between pia and white matter, that liein register with bands of afferents from the appropriate eye inlayer 4c, and that interdigitate with slabs dominated by the othereye (Hubel & Wiesel, 1972; LeVay et al., 1975; Hubel & Wiesel,1977). Preferences for orientation also appear to be organizedin slabs, but ones that are much narrower and shorter in length.The main reason these slabs are shorter is that they convergeperiodically in the centers of ocular dominance columns, atpoints, or singularities, which take on the appearance of"rosettes" or "pinwheels" when preferences for different ori-entations are illustrated in color, as they are in Fig. la (Blasdel& Salama, 1986; Blasdel, 19896, 1992; Ts'o et al., 1990; Bon-hoeffer & Grinvald, 1991). Because most orientation slabsextend between singularities in adjacent ocular dominance col-umns, they tend to cross their borders at right angles (Obermayer
589
https://www.cambridge.org/core/terms. https://doi.org/10.1017/S0952523800008476Downloaded from https://www.cambridge.org/core. NYU Medical Center: Ehrman Medical Library, on 23 Feb 2018 at 18:59:26, subject to the Cambridge Core terms of use, available at
590 C. Blasdel, K. Obermayer, and L. Kiorpes
et al., 1992a; Blasdel, 19926; Bartfeld & Grinvald, 1992; Ober-mayer & Blasdel, 1993), as illustrated in Fig. lc.
We were interested in looking at how these organizationsemerge in young animals. Previous work had indicated that vari-ations in orientation preference and ocular dominance arepresent at birth (Wiesel & Hubel, 1974). But the fact that bandsof afferents are not fully segregated in layer 4c until 8-10 weeksof age, makes it unlikely that organizations associated with them(e.g. ocular dominance and orientation) can mature before thistime. We began investigating these issues by using optical imag-ing techniques to explore the organizations of ocular dominanceand orientation at discrete ages during the first 14 weeks of life.In so doing, we found that patterns of ocular dominance andorientation are both present in all animals (as young as 3 |weeks of age), with adult characteristics and interactions (e.g.linear zones, fractures, singularities, saddle points, and instancesof orientation slabs crossing ocular dominance borders at rightangles) clearly evident at all times. We also observed a tendencyfor ocular dominance signals to appear weaker, in relation to
orientation signals, in young animals, as well as a tendency forocular dominance bands to lie closer together than one mightexpect from their adult spacing corrected for expected rates ofpostnatal growth (Purves & LaMantia, 1993). Some of theseresults have been presented previously in abstract or seminarform (Kiorpes & Blasdel, 1987; Blasdel, 1989; Obermayer et al.,1994).
Materials and methods
Infant monkeys
These studies were conducted on four Macaca nemestrina (BN-5.5, BN-7.5, BN-9, and BN-14) and one Macaca fascicularis(BF-3.5) infants. The Macacae nemestrina were all born in theanimal vivarium at the University of Calgary, where they werereared by their mothers. BF-3.5 was born at the New EnglandRegional Primate Center and reared by hand. At the time of
a)linear zone
fracture
singularity
saddle point
linear zone
b)
fracture
singularity
saddle point
C) L R L
https://www.cambridge.org/core/terms. https://doi.org/10.1017/S0952523800008476Downloaded from https://www.cambridge.org/core. NYU Medical Center: Ehrman Medical Library, on 23 Feb 2018 at 18:59:26, subject to the Cambridge Core terms of use, available at
Development of dominance and orientation preference 591
study, the mother was tranquilized with an intramuscular injec-tion of ketamine/xylazine, to facilitate removal of the infant,which was then anesthetized with halothane (0.5-1.5%) innitrous oxide/oxygen, and prepared for neurophysiological andoptical recording.
Experiments were limited to 18-h duration, after which theanimals were either allowed to recover and return to their moth-ers, or killed with an overdose of Pentobarbitol and perfusedthrough the heart with 4% paraformaldehyde in 0.1 M phos-phate buffer. Animals that were allowed to recover were firstweaned of drugs. After it became apparent they could breatheon their own, they were given supplemental doses of pyrido-stigmine, to reverse any residual effects of curariform drugs,and methamphetamine, to counteract the residual effects ofthiopental sodium administered during the experiment. Afteranimals had recovered fully, and demonstrated their ability tovocalize, they were returned to their mothers who on some, butnot all, occasions accepted them. Infants that were not acceptedwere reared in an incubator and nursed on a 1:1 mixture ofSimilac and water until the conclusion of the experiment, atwhich time they were killed with an overdose of barbiturate andperfused as outlined above.
Preparation
The results in this article are based on optical and single-unitrecordings from five infant macaque monkeys, that ranged inage between 3j and 14 weeks. The surgical preparation of eachone was similar to that described previously for adults (Bias-del, 1992a,b). For simplicity, the most important of these pro-cedures are described again, along with variations relevant tothe acquisition of optical recordings from infant animals.Instead of ketamine/xylazine, however, anesthesia was inducedwith halothane, delivered in a mixture of nitrous oxide and oxy-gen through a mask that was placed over the animal's face. Theanimal was then intubated and provided with an intravenous
catheter for the infusion of electrolytes and drugs. It was ven-tilated with a 2:1 mixture of nitrous oxide and oxygen, and anes-thesia was switched gradually to Pentothal (0.1-1.0 mg/kg/h,i.v.), as the residual halothane was expired.
Each animal was placed on a heated waterbed with its headin a stereotaxic frame. The scalp was then reflected and a tre-phine or dental drill used to bore a 25-mm hole in the craniumoverlying the opercular cortex, just behind the lunate sulcus,as close to the midline as possible. In some cases, especially forthe very young infants whose cranial sutures were immature,the cranial bones were additionally secured by an acrylic capconstructed from a thin layer of Grip Cement. After this, astainless-steel chamber suitable for either microelectrode oroptical recordings was inserted and cemented in place. For theelectrode recordings, this chamber was sealed by an O-ring sup-porting a large glass disk that was pressed against it by a micro-manipulator. The glass contained a guide tube that allowed anelectrode to be inserted and positioned anywhere on the corti-cal surface under visual guidance. For the optical recordings athreaded stainless-steel plug, equipped with an 18-mm glass win-dow, was inserted into the chamber and adjusted until the glassrested a millimeter above the cortical surface. A minimum sep-aration of 0.5-1.0 mm was maintained between glass and cor-tex to allow the dye solution (NK2367, 0.1% in saline) tocirculate.
After all surgical procedures had been completed the animalwas paralyzed partially with Vecuronium bromide or Tubocu-rarine to stabilize the eyes. The eyes were protected with hardgas-permeable contact lenses with curvatures chosen to bringthe eyes into focus on the screen of a 19-inch monitor placed2 m away. Anesthesia was maintained with Pentothal (0.1-1.0mg/kg/h) and verified to be adequate with frequent referenceto the electrocardiogram (EKG), blood pressure, and end-tidalcarbon dioxide (CO2), all of which were monitored continu-ously. The adequacy of anesthesia could also be verified fre-quently by the absence of reflexes (e.g. lateral canthal) since the
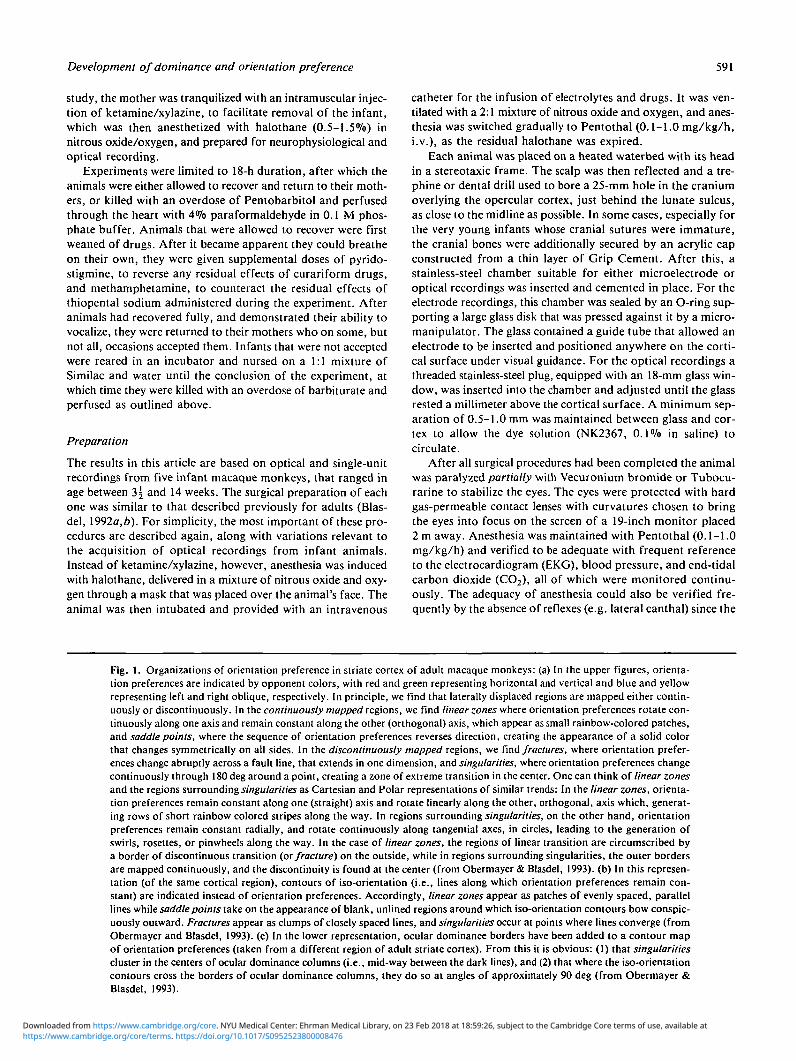
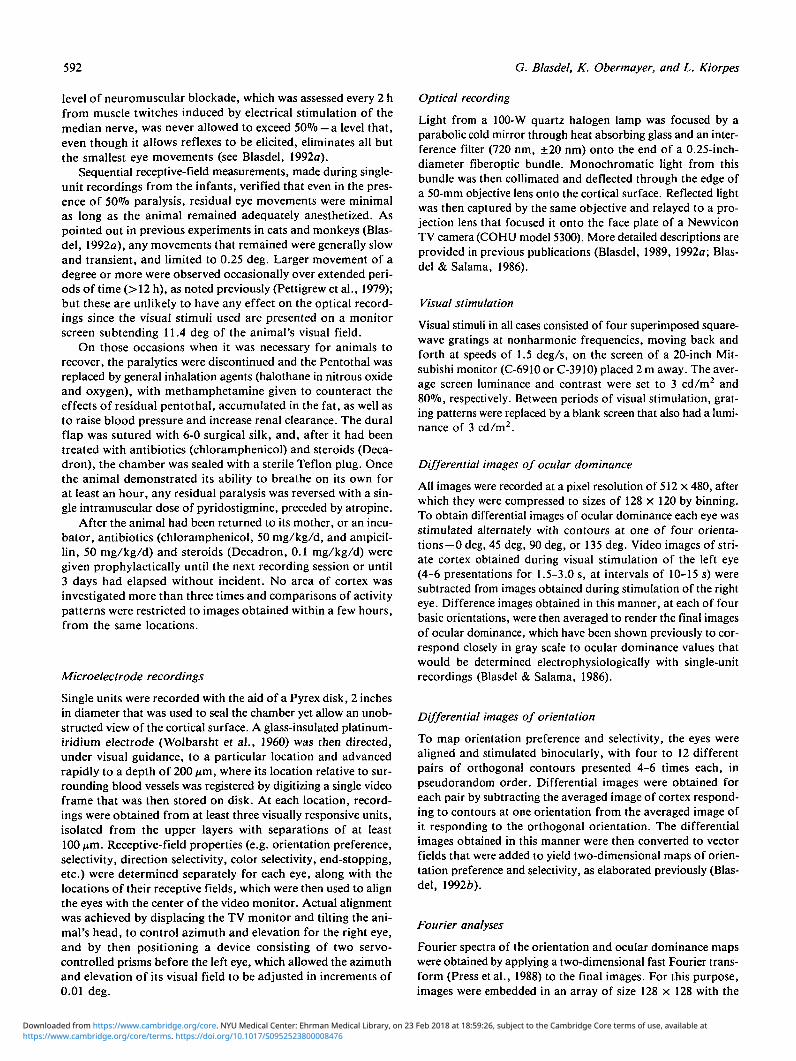
Fig. 1. Organizations of orientation preference in striate cortex of adult macaque monkeys: (a) In the upper figures, orienta-tion preferences are indicated by opponent colors, with red and green representing horizontal and vertical and blue and yellowrepresenting left and right oblique, respectively. In principle, we find that laterally displaced regions are mapped either contin-uously or discontinuously. In the continuously mapped regions, we find linear zones where orientation preferences rotate con-tinuously along one axis and remain constant along the other (orthogonal) axis, which appear as small rainbow-colored patches,and saddle points, where the sequence of orientation preferences reverses direction, creating the appearance of a solid colorthat changes symmetrically on all sides. In the discontinuously mapped regions, we find fractures, where orientation prefer-ences change abruptly across a fault line, that extends in one dimension, and singularities, where orientation preferences changecontinuously through 180 deg around a point, creating a zone of extreme transition in the center. One can think of linear zonesand the regions surrounding singularities as Cartesian and Polar representations of similar trends: In the linear zones, orienta-tion preferences remain constant along one (straight) axis and rotate linearly along the other, orthogonal, axis which, generat-ing rows of short rainbow colored stripes along the way. In regions surrounding singularities, on the other hand, orientationpreferences remain constant radially, and rotate continuously along tangential axes, in circles, leading to the generation ofswirls, rosettes, or pinwheels along the way. In the case of linear zones, the regions of linear transition are circumscribed bya border of discontinuous transition (ox fracture) on the outside, while in regions surrounding singularities, the outer bordersare mapped continuously, and the discontinuity is found at the center (from Obermayer & Blasdel, 1993). (b) In this represen-tation (of the same cortical region), contours of iso-orientation (i.e., lines along which orientation preferences remain con-stant) are indicated instead of orientation preferences. Accordingly, linear zones appear as patches of evenly spaced, parallellines while saddle points take on the appearance of blank, unlined regions around which iso-orientation contours bow conspic-uously outward. Fractures appear as clumps of closely spaced lines, and singularities occur at points where lines converge (fromObermayer and Blasdel, 1993). (c) In the lower representation, ocular dominance borders have been added to a contour mapof orientation preferences (taken from a different region of adult striate cortex). From this it is obvious: (1) that singularitiescluster in the centers of ocular dominance columns (i.e., mid-way between the dark lines), and (2) that where the iso-orientationcontours cross the borders of ocular dominance columns, they do so at angles of approximately 90 deg (from Obermayer &Blasdel, 1993).
https://www.cambridge.org/core/terms. https://doi.org/10.1017/S0952523800008476Downloaded from https://www.cambridge.org/core. NYU Medical Center: Ehrman Medical Library, on 23 Feb 2018 at 18:59:26, subject to the Cambridge Core terms of use, available at
592 G. Blasdel, K. Obermayer, and L. Kiorpes
level of neuromuscular blockade, which was assessed every 2 hfrom muscle twitches induced by electrical stimulation of themedian nerve, was never allowed to exceed 50% —a level that,even though it allows reflexes to be elicited, eliminates all butthe smallest eye movements (see Blasdel, 1992a).
Sequential receptive-field measurements, made during single-unit recordings from the infants, verified that even in the pres-ence of 50% paralysis, residual eye movements were minimalas long as the animal remained adequately anesthetized. Aspointed out in previous experiments in cats and monkeys (Bias-del, 1992a), any movements that remained were generally slowand transient, and limited to 0.25 deg. Larger movement of adegree or more were observed occasionally over extended peri-ods of time (> 12 h), as noted previously (Pettigrew et al., 1979);but these are unlikely to have any effect on the optical record-ings since the visual stimuli used are presented on a monitorscreen subtending 11.4 deg of the animal's visual field.
On those occasions when it was necessary for animals torecover, the paralytics were discontinued and the Pentothal wasreplaced by general inhalation agents (halothane in nitrous oxideand oxygen), with methamphetamine given to counteract theeffects of residual pentothal, accumulated in the fat, as well asto raise blood pressure and increase renal clearance. The duralflap was sutured with 6-0 surgical silk, and, after it had beentreated with antibiotics (chloramphenicol) and steroids (Deca-dron), the chamber was sealed with a sterile Teflon plug. Oncethe animal demonstrated its ability to breathe on its own forat least an hour, any residual paralysis was reversed with a sin-gle intramuscular dose of pyridostigmine, preceded by atropine.
After the animal had been returned to its mother, or an incu-bator, antibiotics (chloramphenicol, 50 mg/kg/d, and ampicil-lin, 50 mg/kg/d) and steroids (Decadron, 0.1 mg/kg/d) weregiven prophylactically until the next recording session or until3 days had elapsed without incident. No area of cortex wasinvestigated more than three times and comparisons of activitypatterns were restricted to images obtained within a few hours,from the same locations.
Microelectrode recordings
Single units were recorded with the aid of a Pyrex disk, 2 inchesin diameter that was used to seal the chamber yet allow an unob-structed view of the cortical surface. A glass-insulated platinum-iridium electrode (Wolbarsht et al., 1960) was then directed,under visual guidance, to a particular location and advancedrapidly to a depth of 200 jim, where its location relative to sur-rounding blood vessels was registered by digitizing a single videoframe that was then stored on disk. At each location, record-ings were obtained from at least three visually responsive units,isolated from the upper layers with separations of at least100 /*m. Receptive-field properties (e.g. orientation preference,selectivity, direction selectivity, color selectivity, end-stopping,etc.) were determined separately for each eye, along with thelocations of their receptive fields, which were then used to alignthe eyes with the center of the video monitor. Actual alignmentwas achieved by displacing the TV monitor and tilting the ani-mal's head, to control azimuth and elevation for the right eye,and by then positioning a device consisting of two servo-controlled prisms before the left eye, which allowed the azimuthand elevation of its visual field to be adjusted in increments of0.01 deg.
Optical recording
Light from a 100-W quartz halogen lamp was focused by aparabolic cold mirror through heat absorbing glass and an inter-ference filter (720 nm, ±20 nm) onto the end of a 0.25-inch-diameter fiberoptic bundle. Monochromatic light from thisbundle was then collimated and deflected through the edge ofa 50-mm objective lens onto the cortical surface. Reflected lightwas then captured by the same objective and relayed to a pro-jection lens that focused it onto the face plate of a NewviconTV camera (COHU model 5300). More detailed descriptions areprovided in previous publications (Blasdel, 1989, 1992a; Blas-del & Salama, 1986).
Visual stimulation
Visual stimuli in all cases consisted of four superimposed square-wave gratings at nonharmonic frequencies, moving back andforth at speeds of 1.5 deg/s, on the screen of a 20-inch Mit-subishi monitor (C-6910 or C-3910) placed 2 m away. The aver-age screen luminance and contrast were set to 3 cd/m2 and80%, respectively. Between periods of visual stimulation, grat-ing patterns were replaced by a blank screen that also had a lumi-nance of 3 cd/m2.
Differential images of ocular dominance
All images were recorded at a pixel resolution of 512 x 480, afterwhich they were compressed to sizes of 128 x 120 by binning.To obtain differential images of ocular dominance each eye wasstimulated alternately with contours at one of four orienta-tions—0 deg, 45 deg, 90 deg, or 135 deg. Video images of stri-ate cortex obtained during visual stimulation of the left eye(4-6 presentations for 1.5-3.0 s, at intervals of 10-15 s) weresubtracted from images obtained during stimulation of the righteye. Difference images obtained in this manner, at each of fourbasic orientations, were then averaged to render the final imagesof ocular dominance, which have been shown previously to cor-respond closely in gray scale to ocular dominance values thatwould be determined electrophysiologically with single-unitrecordings (Blasdel & Salama, 1986).
Differential images of orientation
To map orientation preference and selectivity, the eyes werealigned and stimulated binocularly, with four to 12 differentpairs of orthogonal contours presented 4-6 times each, inpseudorandom order. Differential images were obtained foreach pair by subtracting the averaged image of cortex respond-ing to contours at one orientation from the averaged image ofit responding to the orthogonal orientation. The differentialimages obtained in this manner were then converted to vectorfields that were added to yield two-dimensional maps of orien-tation preference and selectivity, as elaborated previously (Bias-del, 1992ft).
Fourier analyses
Fourier spectra of the orientation and ocular dominance mapswere obtained by applying a two-dimensional fast Fourier trans-form (Press et al., 1988) to the final images. For this purpose,images were embedded in an array of size 128 x 128 with the
https://www.cambridge.org/core/terms. https://doi.org/10.1017/S0952523800008476Downloaded from https://www.cambridge.org/core. NYU Medical Center: Ehrman Medical Library, on 23 Feb 2018 at 18:59:26, subject to the Cambridge Core terms of use, available at
Development of dominance and orientation preference 593
values of the additional pixels set to zero. Orientation vectorswere represented as complex quantities (Swindale, 1982), whoseamplitudes and phases denote orientation selectivity and pref-erence, respectively, while the strength of the ocular dominancedifference signal was represented by real values. After trans-formation, images were compressed to arrays of size 128 x 103in order to account for the different spacing of camera pixelsalong the horizontal and vertical directions. Power spectra andtypical wavelengths were then obtained from the Fourier trans-forms using procedures described in Obermayer and Blasdel, 1993.
Parallelism and intersection angle between orientationand ocular dominance bands
For a quantitative analysis of orientation preference and ocu-lar dominance, it is useful to have measures for the degree towhich regions of similar orientation preference and ocular dom-inance are aligned as parallel slabs. We call these measures ofparallelism and we abbreviate them by POP for orientation pref-erence and by POD for ocular dominance.
POP is derived by taking the gradient of orientation pref-erence (Obermayer & Blasdel, 1993) at every pixel location, nor-malizing its length, and multiplying its angular component bytwo. All unit vectors located in a circular region of radius sg
are then averaged producing a vector POP, whose lengthbecomes a measure Pop of parallelism. Values of 1.0 indicateregions where the iso-orientation lines are perfectly parallel; val-ues smaller than 1.0 indicate regions where the iso-orientationlines are less aligned, while values of 0.0 indicate a singularity.The radius sg was chosen to be 150 fim in order to match theapproximate radius of upper layer pyramidal dendrites. Themeasure POD for ocular dominance can be calculated in a sim-ilar way (Obermayer & Blasdel, 1993). Throughout this paper,we will call a region in monkey striate cortex a linear zone ifPOP exceeds a value of 0.6 for sg = 150 jtm.
The local angle d of intersection between lines of equal ori-entation preference and ocular dominance is given by the anglebetween the vectors POP and POD, divided by two. In regionswhere Pop and POD approach 1.0, contours of constant ori-entation preference and constant ocular dominance are defined,making it possible to calculate their local angles of intersection.In our calculations this local angle of intersection, denoted byd, is obtained by taking the angle of intersection between vec-tors Pop and POD and dividing by 2 (see Obermayer & Bias-del, 1993, for further details).
Results
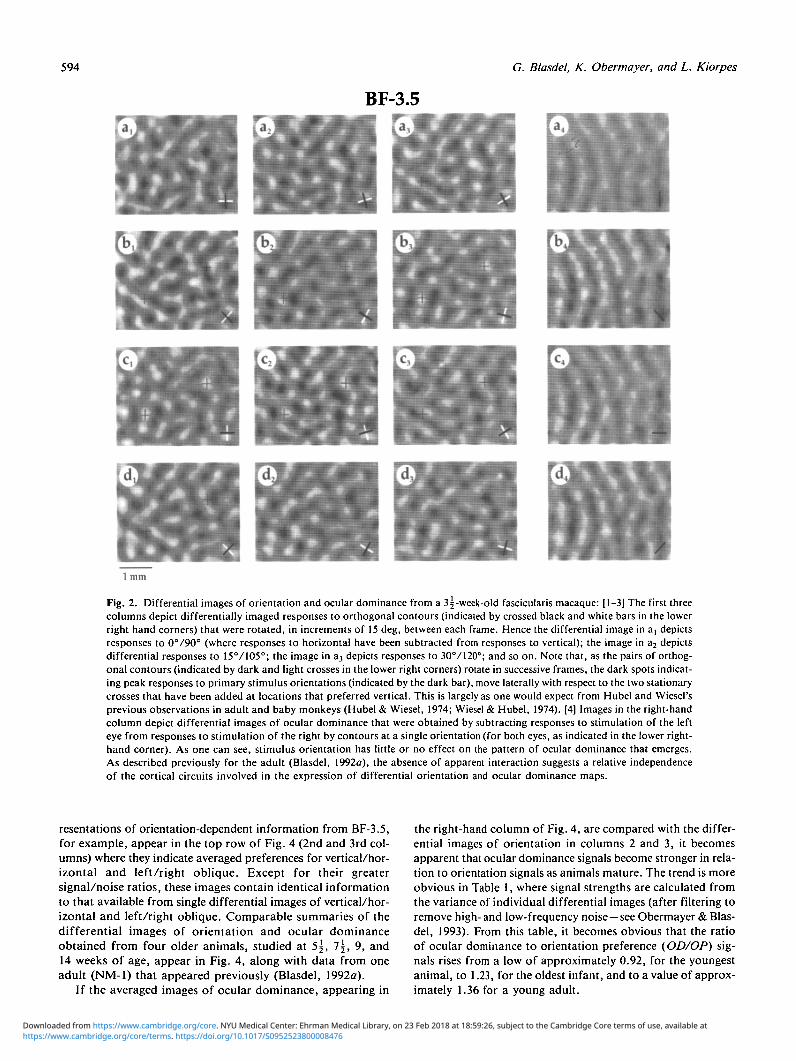
Fig. 2 depicts differential images of orientation and ocular dom-inance from the striate cortex of our youngest animal, who wasstudied at 3 | weeks of age. The orientation dependency of thedark and light regions can be verified easily in these images bycomparing values at similar locations. In Fig. 2a,, for exam-ple, where responses to vertical and horizontal have been com-pared, small crosses have been added at two locations havinga clear preference for vertical. As one can see in adjacent images,the dark regions which indicate preference peaks for the pri-mary stimulus orientation, represented by a black bar in thelower right-hand corner of each frame, move laterally as theorthogonal contours rotate counterclockwise in increments of15 deg (see Figs. 2a2 and 2a3). In Fig. 2b|, for example, wherethe contours have been rotated through 45 deg, the crosses lie
in neutral gray zones, as one would expect for regions prefer-ring vertical (or horizontal). As the stimulus contours rotategradually through another 45 deg, in Figs. 2b2, 2b3, and 2ci,moreover, the crosses shift gradually into the centers of whitezones, which also represent vertical since the image was obtainedby subtracting responses to vertical from responses to horizontal.For continued rotations through another 75 deg, in Figs. 2c2,2c3, 2d|, 2d2, and 2d3, the crosses move back towards the cen-ters of the dark zones in which they were drawn initially.
The right-hand column of Fig. 2 depicts differential imagesof ocular dominance, obtained with contours at different ori-entations. Since each of these images reflects the differencebetween activities generated by the right and left eyes (see Mate-rials and methods), regions dominated by the right and left eyesappear dark and light, while regions showing no particular pref-erence for either eye appear gray or neutral. As one can see,all the images in this column appear strikingly similar, eventhough they were obtained with different orientations. In theimage obtained with horizontal, for example, there are no obvi-ous neutral or pale regions, where the ocular dominance bandsfade out due to a preference for vertical. This is similar to find-ings reported earlier for images obtained from adult cortex(Blasdel, 1992a), which were interpreted to indicate separate andindependent circuits subserving patterns of ocular dominanceand orientation. The fact that such an independence is clearlyevident in even our youngest animal suggests that circuits suchas this are present and operational by 3^ weeks of age.
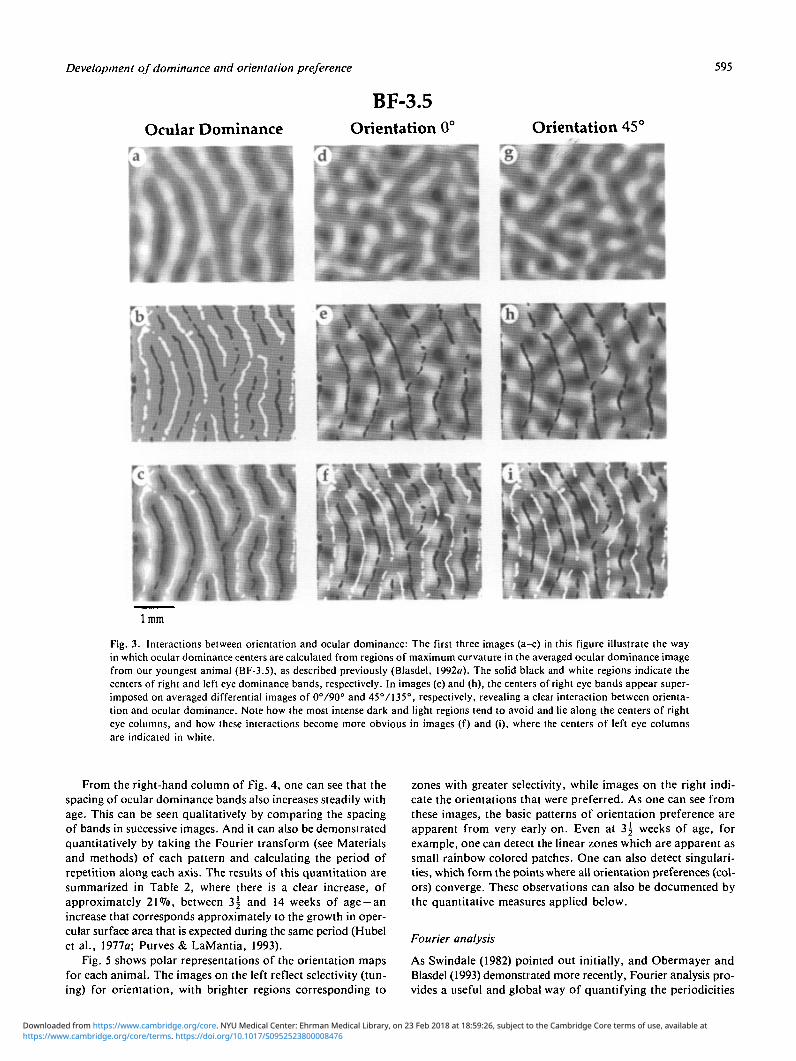
Even though ocular dominance patterns are not markedlysensitive to the orientation of stimuli used to drive activity (seeabove), differential images of orientation are sensitive to bin-ocularity. As one can see in Figs. 3e,f and 3h,i, where the cen-ters of right and left ocular dominance columns have beensuperimposed on summed differential images (see below) of ver-tical/horizontal and left/right oblique, differential images oforientation weaken periodically in the centers of ocular domi-nance columns, and appear strongest in the linear zones,between the centers of ocular dominance columns, where cellsare most binocular. The reason for this could be that neuronsin the linear zones are more selective for orientation or that theyare activated more strongly by binocular stimulation. In eithercase, these differences, which also characterize adults (see Bias-del, 1992a) are clearly evident by 3^ weeks of age.
As Blasdel and Salama(1986) showed initially, it is possibleto combine differential images of orientation by converting eachone to a field of vectors that are then summed at every loca-tion. In so doing the orientation of each vector is obtained bydoubling the positive stimulus orientation, so that similarresponses to orthogonal orientations cancel (see Blasdel, 19926for details). Once these are added, the orientations of the result-ing vector sums indicate the preferred orientation (multipliedby 2), while their lengths reflect the specificity of response. Inaddition to providing specific values for orientation preferenceand selectivity at every location, which are not available fromany differential image by itself (Blasdel, 1992a,b), this calcu-lation can be thought of as an example of orientation-dependentaveraging which improves the signal-to-noise ratio at every loca-tion. For an initial sample of 12 differential orientation images,for example, each of the two resulting vector fields have sig-nal/noise ratios that are approximately \[6 (= 2.45) timesgreater than that of any single differential image used as input.As noted previously (Blasdel, 19926), these vector fields can bedisplayed in either Cartesian or polar coordinates. Cartesian rep-
https://www.cambridge.org/core/terms. https://doi.org/10.1017/S0952523800008476Downloaded from https://www.cambridge.org/core. NYU Medical Center: Ehrman Medical Library, on 23 Feb 2018 at 18:59:26, subject to the Cambridge Core terms of use, available at
594 G. Blasdel, K. Obermayer, and L. Kiorpes
BF-3.5
1 mm
Fig. 2. Differential images of orientation and ocular dominance from a S -̂week-old fascicularis macaque: [1-3] The first threecolumns depict differentially imaged responses to orthogonal contours (indicated by crossed black and white bars in the lowerright hand corners) that were rotated, in increments of 15 deg, between each frame. Hence the differential image in a, depictsresponses to 0°/90° (where responses to horizontal have been subtracted from responses to vertical); the image in a2 depictsdifferential responses to 15°/1O5°; the image in a3 depicts responses to 30°/120°; and so on. Note that, as the pairs of orthog-onal contours (indicated by dark and light crosses in the lower right corners) rotate in successive frames, the dark spots indicat-ing peak responses to primary stimulus orientations (indicated by the dark bar), move laterally with respect to the two stationarycrosses that have been added at locations that preferred vertical. This is largely as one would expect from Hubel and Wiesel'sprevious observations in adult and baby monkeys (Hubel & Wiesel, 1974; Wiesel & Hubel, 1974). [4] Images in the right-handcolumn depict differential images of ocular dominance that were obtained by subtracting responses to stimulation of the lefteye from responses to stimulation of the right by contours at a single orientation (for both eyes, as indicated in the lower right-hand corner). As one can see, stimulus orientation has little or no effect on the pattern of ocular dominance that emerges.As described previously for the adult (Blasdel, 1992a), the absence of apparent interaction suggests a relative independenceof the cortical circuits involved in the expression of differential orientation and ocular dominance maps.
reservations of orientation-dependent information from BF-3.5,for example, appear in the top row of Fig. 4 (2nd and 3rd col-umns) where they indicate averaged preferences for vertical/hor-izontal and left/right oblique. Except for their greatersignal/noise ratios, these images contain identical informationto that available from single differential images of vertical/hor-izontal and left/right oblique. Comparable summaries of thedifferential images of orientation and ocular dominanceobtained from four older animals, studied at 5 | , 7 j , 9, and14 weeks of age, appear in Fig. 4, along with data from oneadult (NM-1) that appeared previously (Blasdel, 1992a).
If the averaged images of ocular dominance, appearing in
the right-hand column of Fig. 4, are compared with the differ-ential images of orientation in columns 2 and 3, it becomesapparent that ocular dominance signals become stronger in rela-tion to orientation signals as animals mature. The trend is moreobvious in Table 1, where signal strengths are calculated fromthe variance of individual differential images (after filtering toremove high- and low-frequency noise—see Obermayer & Blas-del, 1993). From this table, it becomes obvious that the ratioof ocular dominance to orientation preference (OD/OP) sig-nals rises from a low of approximately 0.92, for the youngestanimal, to 1.23, for the oldest infant, and to a value of approx-imately 1.36 for a young adult.
https://www.cambridge.org/core/terms. https://doi.org/10.1017/S0952523800008476Downloaded from https://www.cambridge.org/core. NYU Medical Center: Ehrman Medical Library, on 23 Feb 2018 at 18:59:26, subject to the Cambridge Core terms of use, available at
Development of dominance and orientation preference 595
Ocular Dominance
BF-3.5Orientation 0° Orientation 45c
1 mm
Fig. 3. Interactions between orientation and ocular dominance: The first three images (a-c) in this figure illustrate the wayin which ocular dominance centers are calculated from regions of maximum curvature in the averaged ocular dominance imagefrom our youngest animal (BF-3.5), as described previously (Blasdel, 1992a). The solid black and white regions indicate thecenters of right and left eye dominance bands, respectively. In images (e) and (h), the centers of right eye bands appear super-imposed on averaged differential images of 0°/90° and 45V135°, respectively, revealing a clear interaction between orienta-tion and ocular dominance. Note how the most intense dark and light regions tend to avoid and lie along the centers of righteye columns, and how these interactions become more obvious in images (f) and (i), where the centers of left eye columnsare indicated in white.
From the right-hand column of Fig. 4, one can see that thespacing of ocular dominance bands also increases steadily withage. This can be seen qualitatively by comparing the spacingof bands in successive images. And it can also be demonstratedquantitatively by taking the Fourier transform (see Materialsand methods) of each pattern and calculating the period ofrepetition along each axis. The results of this quantitation aresummarized in Table 2, where there is a clear increase, ofapproximately 21%, between 3 | and 14 weeks of age —anincrease that corresponds approximately to the growth in oper-cular surface area that is expected during the same period (Hubelet al., 1977a; Purves & LaMantia, 1993).
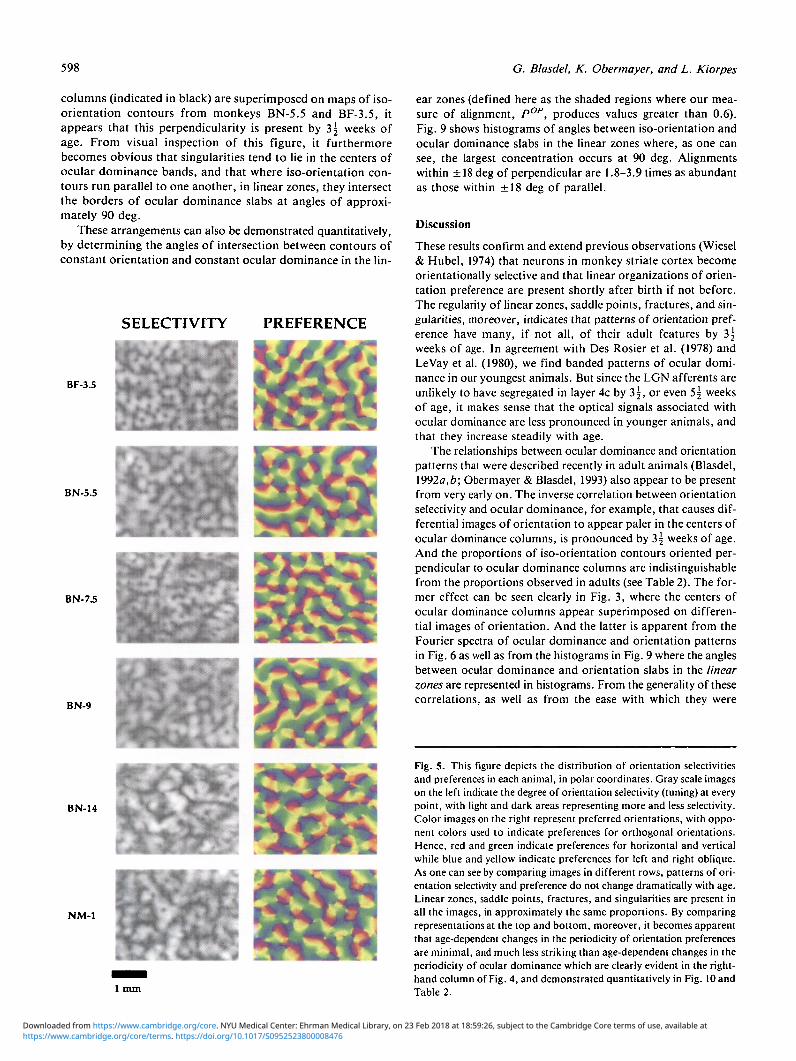
Fig. 5 shows polar representations of the orientation mapsfor each animal. The images on the left reflect selectivity (tun-ing) for orientation, with brighter regions corresponding to
zones with greater selectivity, while images on the right indi-cate the orientations that were preferred. As one can see fromthese images, the basic patterns of orientation preference areapparent from very early on. Even at 3 | weeks of age, forexample, one can detect the linear zones which are apparent assmall rainbow colored patches. One can also detect singulari-ties, which form the points where all orientation preferences (col-ors) converge. These observations can also be documented bythe quantitative measures applied below.
Fourier analysis
As Swindale (1982) pointed out initially, and Obermayer andBlasdel (1993) demonstrated more recently, Fourier analysis pro-vides a useful and global way of quantifying the periodicities
https://www.cambridge.org/core/terms. https://doi.org/10.1017/S0952523800008476Downloaded from https://www.cambridge.org/core. NYU Medical Center: Ehrman Medical Library, on 23 Feb 2018 at 18:59:26, subject to the Cambridge Core terms of use, available at

596
Vasculature 0° 45°
G. Blasdel, K. Obermayer, and L. Kiorpes
OD
BF-3.5
BN-5.5
BN-7.5
BN-9
BN-14
NM-1
1 mm
Fig. 4. Averaged orientation and ocular dominance patterns for all animals, in chronological order: For any particular row,the first image depicts the vascular pattern, which we photographed under green light (to maximize contrast) at the time ofimaging. The second and third images are combined vectorial representations of orientation selectivity, displayed in Cartesiancoordinates. As described previously (Blasdel, 1992ft), these representations are formally equivalent to the Polar representa-tions that appear in Fig. 5. As one can verify for BF-3.5 (see Fig. 2), the first of these (under the 0° heading) is equivalentto a single differential image of 0°/90° (see a], Fig. 2) while the second (under the 45° heading) is equivalent to a single dif-ferential image of 45°/135° (see bi, Fig. 2). The main difference between them arises from the higher signal/noise ratios ofthe images that are combined, which reflect the benefits of greater averaging. The right-hand image in each row depicts a com-bined image of ocular dominance that was obtained by averaging 4 separate ocular dominance images, obtained with contoursat four different orientations. As one can see by comparing combined images of orientation (columns 2 and 3) with combinedimages of ocular dominance (column 4), there is a steady, age-dependent increase in the strength of signals producing oculardominance patterns, relative to those producing orientation patterns, as neonatal animals mature. These are shown quantita-tively in Table 1. Even more pronounced is the steady increase in ocular dominance spacing that occurs with age. As one cansee in Table 2, this increases by nearly 21%, and is linearly correlated with age (with a correlation coefficient of 0.93), as onemight expect from the growth in surface area during this time (Purves & LaMantia, 1993). Since there is some, but much less,increase in the periodicity of orientation preferences (determined from the same cortical region), as one can see by comparingthe second and third images with the fourth image in different rows, there is a possibility that patterns of orientation prefer-ence are not coupled rigidly to patterns of ocular dominance, or even to particular cortical regions, and that ocular dominanceand orientation patterns may actually drift past one another as young animals mature.
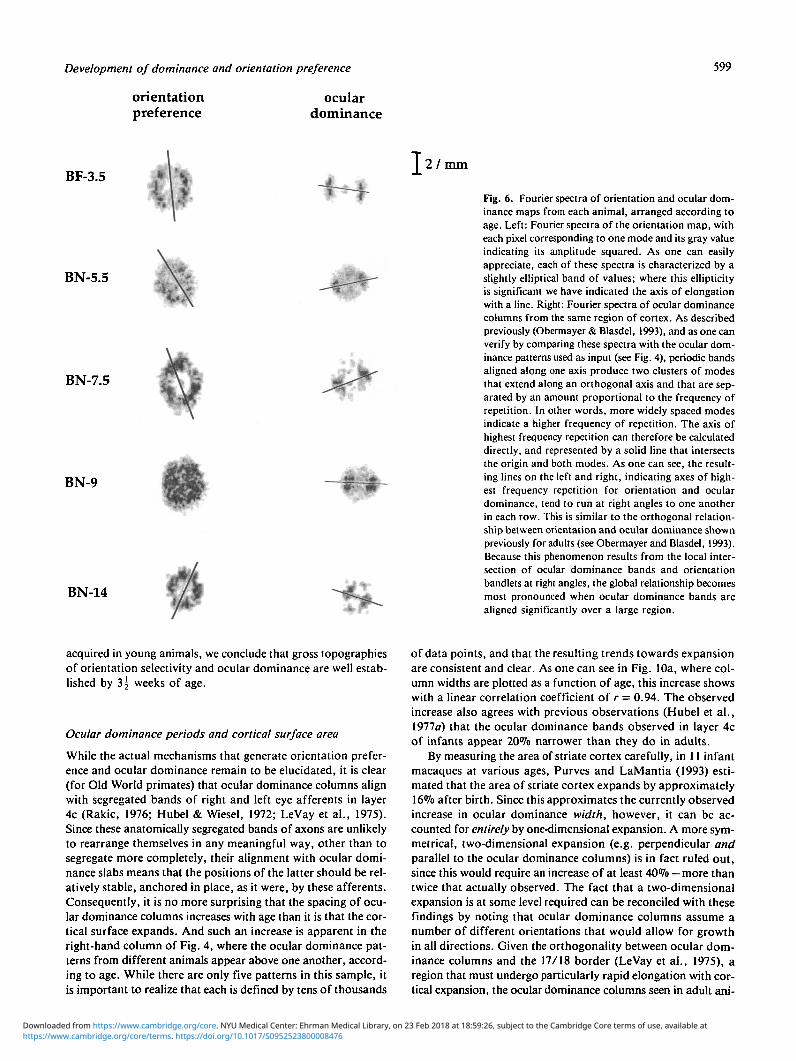
of orientation and ocular dominance patterns along differentaxes. When Fourier analysis is applied to ocular dominance pat-terns, for example, it generates spectra with two clusters ofmodes displaced perpendicular to the ocular dominance bands,
along the axis of repetition. The Fourier spectra of infant ocu-lar dominance patterns, which appear on the right of Fig. 6,resemble those shown previously for adults (Obermayer & Bias-del, 1993). The wavelength estimates (right-hand column of
https://www.cambridge.org/core/terms. https://doi.org/10.1017/S0952523800008476Downloaded from https://www.cambridge.org/core. NYU Medical Center: Ehrman Medical Library, on 23 Feb 2018 at 18:59:26, subject to the Cambridge Core terms of use, available at

Development of dominance and orientation preference 597
Table 1. Development of ocular dominancesignals with age"
Table 2. Characteristic wavelengths of orientation andocular dominance columns in microns"
Monkey
BF-3.5BN-5.5BN-7.5BN-9BN-14NM-1
Age(weeks/days)
3.5/255.5/397.5/53
9/6314/98
>52/365
OD (rms)
26.5422.9315.2923.6331.8427.00
OP (rms)
28.8524.0023.0123.7125.8119.89
OD/OP
0.920.960.661.001.231.36
Animal
BF-3.5BN-5.5BN-7.5BN-9BN-14Adult (nemestrina)Adult (fascicularis)
Age(weeks)
3.55.57.59
14
\°p
660714615658700682 ± 59662
\°D
724795817842875825 ± 52815
\OPj_
741772694800811776 + 89722
612664571695710642 ±612
i
57
aAs one can see in Fig. 4, the signals giving rise to ocular dominancepatterns (right-hand column) steadily increase with age. This is not aresult of averaging or vagaries of the imaging technique since a corre-sponding change is not evident for patterns associated with orientation(second and third columns). These correlations are quantified in theabove table where rms values of the ocular dominance patterns havebeen calculated for 10,302 points (out of 19,200) in the central portion,after convolving with a 0.25-mm diameter Gaussian to remove high-frequency noise. As one can see in the OD/OP column, the strengthof signals giving rise to the ocular dominance patterns increases steadilywith age, with a linear correlation coefficient of 0.75. This could reflectthe segregation of LGN afferents, which reaches completion during thefirst 8-10 weeks of age. Note that the OD/OP ratio appears surpris-ingly normal for BN9, even though this animal had a pronounced stra-bismus and no binocular units at the time of physiological recording.
Table 1) for young animals, however, reflect a nearly linear,age-dependent increase in bandwidth between 3 | and 14 weeksof age.
The Fourier spectra of orientation preferences in Fig. 6 (left-hand column) contain elliptical bands of modes that resemblespectra from older animals (Obermayer et al., 1991, I992a,b;Obermayer & Blasdel, 1993). The elliptical form of these modesindicates a variation in the average frequency of repetition alongdifferent axes. Accordingly, axes corresponding to the highestrates of repetition are indicated by solid black lines in each exam-ple. As one can see by comparing the inclinations of these linesfor the ocular dominance and orientation spectra from each ani-mal, these patterns repeat at shorter intervals along orthogo-nal axes. In other words, orientation preferences repeat morefrequently along axes parallel to the ocular dominance bands,which is what one would expect if the short iso-orientation slabsthat are observed intersect ocular dominance borders at rightangles. Such an arrangement was reported previously for adults(Obermayer & Blasdel, 1993). The intervals over which orien-tation preferences repeat along axes parallel and perpendicularto the ocular dominance bands are shown in the fifth and sixthcolumns of Table 2. Even in the youngest animal (BF-3.5), whichwas only 3^ weeks old at the time of study, there is a strongorthogonality between regions of constant orientation prefer-ence and regions of constant ocular dominance, which causethe iso-orientation regions to appear stretched and slab-likealong axes perpendicular to the ocular dominance bands. Sim-ilar findings were also reported previously for adults (Obermayer& Blasdel, 1993).
Local organizations of orientation preference
As mentioned above, the four different arrangements of ori-entation preference that are distinguished in striate cortex ofadult animals are present at even the earliest age. Hence, linear
aThe symbols XOP and XOD stand for the average wavelengths of ori-entation preferences and ocular dominance columns in the imagedregions of cortex, and may be taken to indicate average spacing. Thesymbols \op> and \op± denote the wavelength of orientation prefer-ences parallel and perpendicular to the ocular dominance bands, respec-tively. The estimated error for the wavelength measurements is ±50ftm.The wavelengths XOP| and \OPj- corresponding to animal BN-9 couldnot be estimated reliably from the Fourier spectrum, because a primaryaxis of elongation could not be defined. The values for "adult Macacanemestrina" are averages over four animals (with error margins derivedfrom standard deviations); the values for "adult Macaca fascicularis"are averages over two recording sites obtained from the same animal.Adult data are taken from Obermayer and Blasdel (1993). Note thatthe error margins indicated for adult data are likely to overstate thevariability (and understate the average values) since the combined pat-terns were obtained from several animals at a variety of locations andeccentricities, where the spacing of ocular dominance columns may wellbe different (LeVay et al., 1980). These factors are less likely to com-plicate the infant data, since all of these images were obtained fromapproximately the same cortical locations (immediately posterior to the17/18 border where the ocular dominance columns are most aligned).These data are therefore more reliable for inter-animal comparisons.
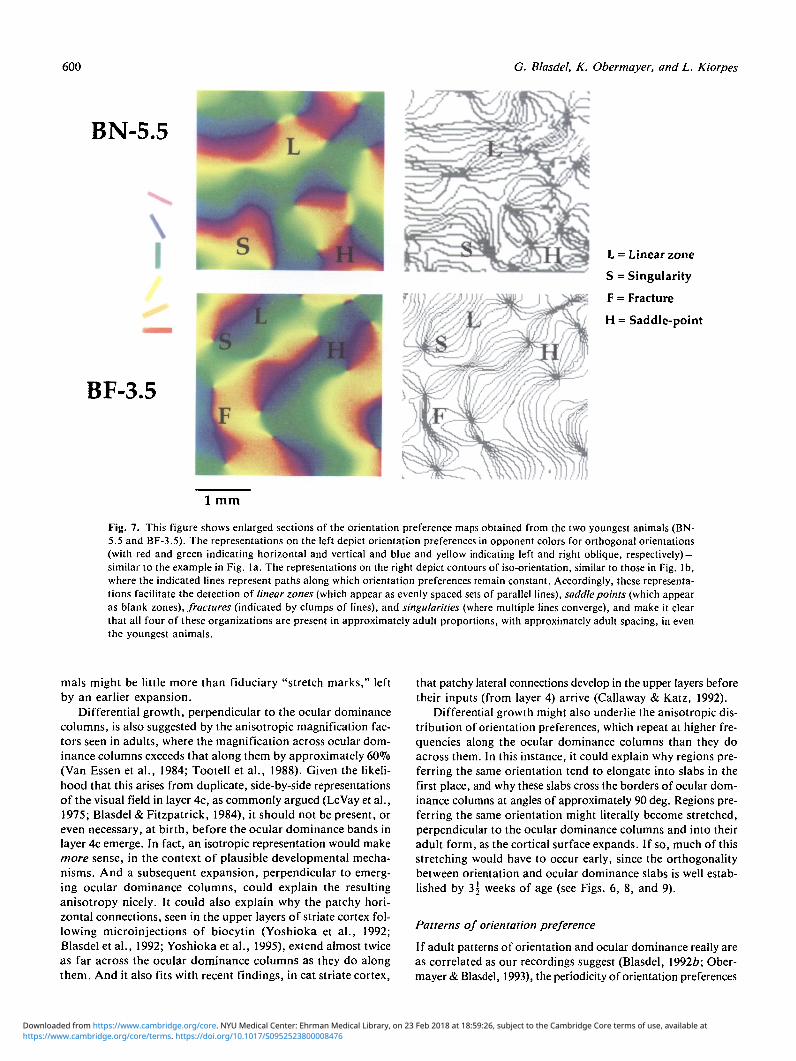
zones, saddle points, fractures, and singularities (see Fig. 1) canall be seen by 3^ weeks of age. Fig. 7 shows enlarged sectionsof the maps from BN-5.5 and BF-3.5, both of which containlinear zones, saddle points, singularities, and fractures. Thesketches in the right-hand column of Fig. 7 indicate sample loca-tions of these features in each map. To gain insight into theirdevelopment, it is necessary to evaluate their densities and dis-tributions at different ages, which can be done most easily bycalculating the degree of alignment, or parallelism, between iso-orientation contours in discrete regions, 300 ̂ m across. As onecan see in columns 4,5, and 6 of Table 3, the densities of posi-tive and negative singularities, as well as the relative areas oflinear zones (column 2), do not change markedly with age, whichis surprising since the spacing of ocular dominance bands andeven the cortical surface area increase steadily in an age-dependent fashion (Hubel et al., 1977a; Purves & LaMantia,1993).
Angles of intersection between bands of orientationand ocular dominance
Another observation made in adults was that singularities andfractures running parallel to ocular dominance columns tendto lie in their centers while fractures and iso-orientation bandscrossing the borders of ocular dominance columns tend to doso at right angles (Blasdel & Salama, 1986; Swindale, 1992;Obermayer et al., 1992a; Blasdel, 1992ft; Obermayer & Blas-del, 1993). From Fig. 8, where the borders of ocular dominance
https://www.cambridge.org/core/terms. https://doi.org/10.1017/S0952523800008476Downloaded from https://www.cambridge.org/core. NYU Medical Center: Ehrman Medical Library, on 23 Feb 2018 at 18:59:26, subject to the Cambridge Core terms of use, available at
598 G. Blasdel, K. Obermayer, and L. Kiorpes
columns (indicated in black) are superimposed on maps of iso-orientation contours from monkeys BN-5.5 and BF-3.5, itappears that this perpendicularity is present by 3^ weeks ofage. From visual inspection of this figure, it furthermorebecomes obvious that singularities tend to lie in the centers ofocular dominance bands, and that where iso-orientation con-tours run parallel to one another, in linear zones, they intersectthe borders of ocular dominance slabs at angles of approxi-mately 90 deg.
These arrangements can also be demonstrated quantitatively,by determining the angles of intersection between contours ofconstant orientation and constant ocular dominance in the lin-
SELECTIVITY PREFERENCE
BF-3.S
BN-5.5
BN-7.5
BN-9
BN-14
NM-1
1 mm
ear zones (defined here as the shaded regions where our mea-sure of alignment, POP, produces values greater than 0.6).Fig. 9 shows histograms of angles between iso-orientation andocular dominance slabs in the linear zones where, as one cansee, the largest concentration occurs at 90 deg. Alignmentswithin ±18 deg of perpendicular are 1.8-3.9 times as abundantas those within ±18 deg of parallel.
Discussion
These results confirm and extend previous observations (Wiesel& Hubel, 1974) that neurons in monkey striate cortex becomeorientationally selective and that linear organizations of orien-tation preference are present shortly after birth if not before.The regularity of linear zones, saddle points, fractures, and sin-gularities, moreover, indicates that patterns of orientation pref-erence have many, if not all, of their adult features by 3 |weeks of age. In agreement with Des Rosier et al. (1978) andLeVay et al. (1980), we find banded patterns of ocular domi-nance in our youngest animals. But since the LGN afferents areunlikely to have segregated in layer 4c by 35, or even 5\ weeksof age, it makes sense that the optical signals associated withocular dominance are less pronounced in younger animals, andthat they increase steadily with age.
The relationships between ocular dominance and orientationpatterns that were described recently in adult animals (Blasdel,1992a, 6; Obermayer & Blasdel, 1993) also appear to be presentfrom very early on. The inverse correlation between orientationselectivity and ocular dominance, for example, that causes dif-ferential images of orientation to appear paler in the centers ofocular dominance columns, is pronounced by 3 | weeks of age.And the proportions of iso-orientation contours oriented per-pendicular to ocular dominance columns are indistinguishablefrom the proportions observed in adults (see Table 2). The for-mer effect can be seen clearly in Fig. 3, where the centers ofocular dominance columns appear superimposed on differen-tial images of orientation. And the latter is apparent from theFourier spectra of ocular dominance and orientation patternsin Fig. 6 as well as from the histograms in Fig. 9 where the anglesbetween ocular dominance and orientation slabs in the linearzones are represented in histograms. From the generality of thesecorrelations, as well as from the ease with which they were
Fig. 5. This figure depicts the distribution of orientation selectivitiesand preferences in each animal, in polar coordinates. Gray scale imageson the left indicate the degree of orientation selectivity (tuning) at everypoint, with light and dark areas representing more and less selectivity.Color images on the right represent preferred orientations, with oppo-nent colors used to indicate preferences for orthogonal orientations.Hence, red and green indicate preferences for horizontal and verticalwhile blue and yellow indicate preferences for left and right oblique.As one can see by comparing images in different rows, patterns of ori-entation selectivity and preference do not change dramatically with age.Linear zones, saddle points, fractures, and singularities are present inall the images, in approximately the same proportions. By comparingrepresentations at the top and bottom, moreover, it becomes apparentthat age-dependent changes in the periodicity of orientation preferencesare minimal, and much less striking than age-dependent changes in theperiodicity of ocular dominance which are clearly evident in the right-hand column of Fig. 4, and demonstrated quantitatively in Fig. 10 andTable 2.
https://www.cambridge.org/core/terms. https://doi.org/10.1017/S0952523800008476Downloaded from https://www.cambridge.org/core. NYU Medical Center: Ehrman Medical Library, on 23 Feb 2018 at 18:59:26, subject to the Cambridge Core terms of use, available at
Development of dominance and orientation preference 599
orientationpreference
oculardominance
BF-3.5• * • * • * •
BN-5.5
BN-7.5
BN-9
BN-14
I 2/mm
Fig. 6. Fourier spectra of orientation and ocular dom-inance maps from each animal, arranged according toage. Left: Fourier spectra of the orientation map, witheach pixel corresponding to one mode and its gray valueindicating its amplitude squared. As one can easilyappreciate, each of these spectra is characterized by aslightly elliptical band of values; where this ellipticityis significant we have indicated the axis of elongationwith a line. Right: Fourier spectra of ocular dominancecolumns from the same region of cortex. As describedpreviously (Obermayer & Blasdel, 1993), and as one canverify by comparing these spectra with the ocular dom-inance patterns used as input (see Fig. 4), periodic bandsaligned along one axis produce two clusters of modesthat extend along an orthogonal axis and that are sep-arated by an amount proportional to the frequency ofrepetition. In other words, more widely spaced modesindicate a higher frequency of repetition. The axis ofhighest frequency repetition can therefore be calculateddirectly, and represented by a solid line that intersectsthe origin and both modes. As one can see, the result-ing lines on the left and right, indicating axes of high-est frequency repetition for orientation and oculardominance, tend to run at right angles to one anotherin each row. This is similar to the orthogonal relation-ship between orientation and ocular dominance shownpreviously for adults (see Obermayer and Blasdel, 1993).Because this phenomenon results from the local inter-section of ocular dominance bands and orientationbandlets at right angles, the global relationship becomesmost pronounced when ocular dominance bands arealigned significantly over a large region.
acquired in young animals, we conclude that gross topographiesof orientation selectivity and ocular dominance are well estab-lished by 3 5 weeks of age.
Ocular dominance periods and cortical surface area
While the actual mechanisms that generate orientation prefer-ence and ocular dominance remain to be elucidated, it is clear(for Old World primates) that ocular dominance columns alignwith segregated bands of right and left eye afferents in layer4c (Rakic, 1976; Hubel & Wiesel, 1972; LeVay et al., 1975).Since these anatomically segregated bands of axons are unlikelyto rearrange themselves in any meaningful way, other than tosegregate more completely, their alignment with ocular domi-nance slabs means that the positions of the latter should be rel-atively stable, anchored in place, as it were, by these afferents.Consequently, it is no more surprising that the spacing of ocu-lar dominance columns increases with age than it is that the cor-tical surface expands. And such an increase is apparent in theright-hand column of Fig. 4, where the ocular dominance pat-terns from different animals appear above one another, accord-ing to age. While there are only five patterns in this sample, itis important to realize that each is defined by tens of thousands
of data points, and that the resulting trends towards expansionare consistent and clear. As one can see in Fig. 10a, where col-umn widths are plotted as a function of age, this increase showswith a linear correlation coefficient of r = 0.94. The observedincrease also agrees with previous observations (Hubel et al.,1977a) that the ocular dominance bands observed in layer 4cof infants appear 20% narrower than they do in adults.
By measuring the area of striate cortex carefully, in 11 infantmacaques at various ages, Purves and LaMantia (1993) esti-mated that the area of striate cortex expands by approximately16% after birth. Since this approximates the currently observedincrease in ocular dominance width, however, it can be ac-counted for entirely by one-dimensional expansion. A more sym-metrical, two-dimensional expansion (e.g. perpendicular andparallel to the ocular dominance columns) is in fact ruled out,since this would require an increase of at least 40% — more thantwice that actually observed. The fact that a two-dimensionalexpansion is at some level required can be reconciled with thesefindings by noting that ocular dominance columns assume anumber of different orientations that would allow for growthin all directions. Given the orthogonality between ocular dom-inance columns and the 17/18 border (LeVay et al., 1975), aregion that must undergo particularly rapid elongation with cor-tical expansion, the ocular dominance columns seen in adult ani-
https://www.cambridge.org/core/terms. https://doi.org/10.1017/S0952523800008476Downloaded from https://www.cambridge.org/core. NYU Medical Center: Ehrman Medical Library, on 23 Feb 2018 at 18:59:26, subject to the Cambridge Core terms of use, available at
600 G. Blasdel, K. Obermayer, and L. Kiorpes
BN-5.5
BF-3.5
L = Linear zone
S = Singularity
F = Fracture
H = Saddle-point
1 mm
Fig. 7. This figure shows enlarged sections of the orientation preference maps obtained from the two youngest animals (BN-5.5 and BF-3.5). The representations on the left depict orientation preferences in opponent colors for orthogonal orientations(with red and green indicating horizontal and vertical and blue and yellow indicating left and right oblique, respectively) —similar to the example in Fig. la. The representations on the right depict contours of iso-orientation, similar to those in Fig. lb,where the indicated lines represent paths along which orientation preferences remain constant. Accordingly, these representa-tions facilitate the detection of linear zones (which appear as evenly spaced sets of parallel lines), saddle points (which appearas blank zones), fractures (indicated by clumps of lines), and singularities (where multiple lines converge), and make it clearthat all four of these organizations are present in approximately adult proportions, with approximately adult spacing, in eventhe youngest animals.
mals might be little more than fiduciary "stretch marks," leftby an earlier expansion.
Differential growth, perpendicular to the ocular dominancecolumns, is also suggested by the anisotropic magnification fac-tors seen in adults, where the magnification across ocular dom-inance columns exceeds that along them by approximately 60%(Van Essen et al., 1984; Tootell et al., 1988). Given the likeli-hood that this arises from duplicate, side-by-side representationsof the visual field in layer 4c, as commonly argued (LeVay et al.,1975; Blasdel & Fitzpatrick, 1984), it should not be present, oreven necessary, at birth, before the ocular dominance bands inlayer 4c emerge. In fact, an isotropic representation would makemore sense, in the context of plausible developmental mecha-nisms. And a subsequent expansion, perpendicular to emerg-ing ocular dominance columns, could explain the resultinganisotropy nicely. It could also explain why the patchy hori-zontal connections, seen in the upper layers of striate cortex fol-lowing microinjections of biocytin (Yoshioka et al., 1992;Blasdel et al., 1992; Yoshioka et al., 1995), extend almost twiceas far across the ocular dominance columns as they do alongthem. And it also fits with recent findings, in cat striate cortex,
that patchy lateral connections develop in the upper layers beforetheir inputs (from layer 4) arrive (Callaway & Katz, 1992).
Differential growth might also underlie the anisotropic dis-tribution of orientation preferences, which repeat at higher fre-quencies along the ocular dominance columns than they doacross them. In this instance, it could explain why regions pre-ferring the same orientation tend to elongate into slabs in thefirst place, and why these slabs cross the borders of ocular dom-inance columns at angles of approximately 90 deg. Regions pre-ferring the same orientation might literally become stretched,perpendicular to the ocular dominance columns and into theiradult form, as the cortical surface expands. If so, much of thisstretching would have to occur early, since the orthogonalitybetween orientation and ocular dominance slabs is well estab-lished by 3 | weeks of age (see Figs. 6, 8, and 9).
Patterns of orientation preference
If adult patterns of orientation and ocular dominance really areas correlated as our recordings suggest (Blasdel, \992b; Ober-mayer & Blasdel, 1993), the periodicity of orientation preferences
https://www.cambridge.org/core/terms. https://doi.org/10.1017/S0952523800008476Downloaded from https://www.cambridge.org/core. NYU Medical Center: Ehrman Medical Library, on 23 Feb 2018 at 18:59:26, subject to the Cambridge Core terms of use, available at

Development of dominance and orientation preference 601
BN-5.5
BF-3.5
1 mm
Fig. 8. When the borders of ocular dominance columns are added tothe iso-orientation contours from Figure 7, it becomes clear: (1) thatsingularities (indicated by lines converging to points) lie mostly in thecenters of ocular dominance columns; and (2) that where iso-orientationcontours cross the borders of ocular dominance columns, they do soat angles of approximately 90 deg, as observed previously in adults(Obermayer & Blasdel, 1993). Both of these tendencies are present androbust by 3j weeks of age.
also should expand with age. Yet it does not. From Table 2 andFig. 10b, one can see that even along axes perpendicular to theocular dominance columns, the periodicity of orientation pref-erences increases only half as fast as the periodicity of oculardominance. Since orientation and ocular dominance patternswere imaged from the same cortical regions at the same times,moreover, this discrepancy cannot be attributed to individualvariation or other experimental variables (e.g. swelling).
One possibility is that the periodicity of orientation prefer-ences does not correlate with the periodicity of ocular domi-nance. But other data (Obermayer & Blasdel, 1993) suggest thatit does —at least in adult animals. The fact that this relationappears not to hold across infants, recorded at different ages,might therefore reflect a changing relationship between orien-tation and ocular dominance as infant animals mature. This isalso the implication of Table 3, where it is clear that the den-sity of singularities (points where preferences for all orienta-tions converge) tends to remain the same as the cortical surfaceexpands. The only obvious way in which this can happen is ifnew singularities are added in pairs (e.g. one "+" singularity
22° 45° 67° 90°
BN - 5.5
22° 45° 67° 90°
BN - 7.5
22° 45° 67° 90°
16%
12%.
BN-9
0° 22° 45° 67° 90°
16%
12%.
BN-14
o%22° 45° 67° 90°
Fig. 9. When the angles of intersection, for iso-orientation contourscrossing lines of iso-ocular dominance, are tabulated in the linear zones(i.e. where the calculated value of alignment, POP, exceeds 0.6), astrong preponderance of 90-deg intersections becomes apparent, andis especially pronounced in the youngest animal, whose patterns of ocu-lar dominance and orientation were determined at 3j weeks of age.Hence, the orthogonality between ocular dominance and iso-orientationcontours described previously in adults (see Obermayer & Blasdel, 1993),is well entrenched by 3j weeks of age.
https://www.cambridge.org/core/terms. https://doi.org/10.1017/S0952523800008476Downloaded from https://www.cambridge.org/core. NYU Medical Center: Ehrman Medical Library, on 23 Feb 2018 at 18:59:26, subject to the Cambridge Core terms of use, available at

602 G. Blasdel, K. Obermayer, and L. Kiorpes
Table 3. Percentage of cortical area covered by linear zones, where our measure of alignment POP' exceeded 0.6,and the densities of different types of singularities0
Animal
BF-3.5BN-5.5BN-7.5BN-9BN-14Adult (nemestrina)Adult (fascicularis)
Age (weeks)
3.55.57.59
14
Linear zones(% of area)
474945543648 ± 749
Density of +180 degsingularities (mm~2)
3.93.74.53.73.94.0 ± 0.44.1
Density of -180 degsingularities (mm~2)
3.93.74.53.73.83.9 ± 0.54.2
Density ofsingularities
(mm-2)
7.87.49.07.47.77.9 ± 0.98.3
aThe values for adult Macaca nemestrina reflect averages of four animals (with error margins derived from standard deviations). The values foradult Macaca fascicularis are averages from two recording sites in the same animal. Note (right-hand column) that the density of singularities(the number per unit area) stays approximately the same as infant animals mature. This contrasts with the spacing of ocular dominance columns,which increases by at least 20%, and even the area of striate cortex, which is thought to increase by at least 16% (Purves & LaMantia, 1993),during the same period of time. Data for the adults were taken from Obermayer and Blasdel (1993).
and one "—" singularity; see Blasdel, 1992ft, for details), as thecortical surface expands.
These findings suggest the possibility that patterns of orien-tation preference may not be as stable or as hard wired as pat-terns of ocular dominance. And since they are not anchored inplace by anatomically segregated bands of afferents, somedegree of rearrangement may actually be possible. As startlingas this possibility may seem, reports of orientational plasticity
are not unprecedented (Hirsch & Spinelli, 1970, 1971; Blake-more & Cooper, 1972; Blasdel et al., 1977). And while someof these reports have been contested (see Stryker & Sherk, 1975,for example), recent descriptions of dynamic change in theresponse properties of adult neurons, including orientation pref-erences, receptive-field sizes, and positions (Gilbert & Wiesel,1992), suggest that developmental changes in these propertiesare not out of the question.
a)Correlation coefficient (r) = 0.939Slope = 13.031
950
600
Age
b)Correlation coefficient (r) = 0.576Slope = 6.85
950
900
600
O OP perpendicular
8 10
Age
12 14
Fig. 10. The spacing of ocular dominance columns and orientation preferences, as a function of age (indicated in weeks),(a) The strong correlation between age and the spacing of ocular dominance columns becomes especially apparent when oneis plotted as a function of the other. As one can see, the average spacing of ocular dominance columns increases by approxi-mately 12 pm per week between 3 | and 14 weeks of age, for a total increment of 20%, which agrees approximately with esti-mates derived from the earlier work of Hubel et al. (1977a) that seem to suggest a 25% increase during the first few monthsof life. If the calculations of Purves and LaMantia (1993) are correct, therefore, and the total surface area of striate cortexincreases only by 16% or so after birth, the observed 20% increase in the ocular dominance spacing suggests strongly thatmost of this growth occurs anisotropically, along one axis — perpendicular to the ocular dominance columns —as the neonatalcortex matures, (b) In this figure, where the average spacing of orientation preferences perpendicular to the ocular dominancecolumns is plotted as a function of age, it becomes apparent that the spacing of orientation preferences increases only halfas fast as the spacing of ocular dominance columns, measured along similar axes. This implies that the relationships betweenocular dominance and orientation preference that appear so prominent in adult cortex may not be rigid in young animals, andindeed may undergo some re-arrangement as infant animals mature. These studies clearly need to be replicated in greater detail,however, preferably by following the development of identified patterns of ocular dominance and orientation preference insingle animals over time.
16
https://www.cambridge.org/core/terms. https://doi.org/10.1017/S0952523800008476Downloaded from https://www.cambridge.org/core. NYU Medical Center: Ehrman Medical Library, on 23 Feb 2018 at 18:59:26, subject to the Cambridge Core terms of use, available at
Development of dominance and orientation preference 603
Conclusion
These results demonstrate that many, if not all, of the organi-zational features of adult striate cortex are well established by35 weeks of age. They also raise new questions about the sym-metry of cortical development, whether it expands uniformlyor perpendicular to the ocular dominance columns, and the sta-bility of relationships between orientation and ocular dominancepatterns, as infant animals mature. These questions may bestbe answered, it seems, by using similar methods to follow thedevelopment of ocular dominance and orientation patterns, aswell as cortical magnification, in single infant animals as theymature.
References
BARTFELD, E. & GRINVALD, A. (1992). Relationships betweenorientation-preference pin-wheels, cytochrome oxidase blobs, andocular-dominance columns in primate striate cortex. Proceedingsof the National Academy of the Sciences of the U.S.A. 89, 11905-11909.
BLAKEMORE, C. & COOPER, G.F. (1972). Development of the braindepends on the visual environment. Nature (London) 228, 477-478.
BLASDEL, G.G., MITCHELL, D.W., MUIR, D.W. & PETTIGREW, J.D.(1977). A physiological and behavioral study in cats of the effectof early visual experience with contours of a single orientation. Jour-nal of Physiology (London) 265, 615-635.
BLASDEL, G.G. (1989). Visualization of neuronal activity in monkey stri-ate cortex. Annual Review of Physiology 51, 561-581.
BLASDEL, G.G. (1992a). Differential imaging of ocular dominance andorientation selectivity in monkey striate cortex. Journal of Neuro-science 12, 3117-3138.
BLASDEL, G.G. (19926). Orientation selectivity, preference, and conti-nuity in monkey striate cortex. Journal of Neuroscience 12, 3139—3161.
BLASDEL, G.G. &.FITZPATRICK, D. (1984). Physiological organizationof layer 4 in macaque striate cortex. Journal of Neuroscience 4,880-895.
BLASDEL, G.G. & SALAMA, G. (1986). Voltage sensitive dyes reveal amodular organization in monkey striate cortex. Nature 321, 579-585.
BLASDEL, G.G., YOSHIOKA, T., LEVITT, J.B. & LUND, J.S. (1992). Cor-relation between patterns of lateral connectivity and patterns oforientation preference in monkey striate cortex. Society for Neuro-science Abstracts 18, 389.
BONHOEFFER, T. & GRINVALD, A. (1991). Orientation columns in catare organized in pin-wheel like patterns. Nature 353, 429-431.
CALLAWAY, E. & KATZ, L. (1992). Development of axonal arbors of layer4 spiny neurons in cat striate cortex. Journal of Neuroscience 12,570-582.
DESROSIERS, M.H., SAKURADA, O., JEHLE, J., SHINOHARA, M., KEN-NEDY, C. & SOKOLOFF, L. (1978). Functional plasticity in the imma-ture striate cortex of the monkey shown by the [I4C) deoxyglucosemethod. Science 200, 447-449.
GILBERT, CD. & WIESEL, T.N. (1992). Receptive field dynamics in adultprimary visual cortex. Nature 356, 150-152.
HIRSCH, H.V.B. & SPINELLI, D.N. (1970). Visual experience modifiesdistribution of horizontal and vertical oriented receptive fields incats. Science (N.Y.) 168, 869-871.
HIRSCH, H.V.B. & SPINELLI, D.N. (1971). Modification of the distri-bution of receptive-field orientation in cats by selected visual expe-riences during development. Experimental Brain Research 13,509-527.
HUBEL, D.H. & WIESEL, T. (1962). Receptive fields, binocular inter-action, and functional architecture of cat striate cortex. Journal ofPhysiology (London) 160, 106-154.
HUBEL, D.H. & WIESEL, T. (1968). Receptive fields and functional archi-tecture of monkey striate cortex. Journal of Physiology (London)195, 215-243.
HUBEL, D.H. & WIESEL, T.N. (1972). Laminar and columnar distribu-tion of geniculo-cortical fibers in the macaque monkey. Journal ofComparative Neurology 146, 421-450.
HUBEL, D.H. & WIESEL, T.N. (1974a). Sequence regularity and geom-etry of orientation columns in the monkey striate cortex. Journalof Comparative Neurology 158, 267-294.
HUBEL, D.H. & WIESEL, T.N. (19746). Uniformity of monkey striatecortex: A parallel relationship between field size, scatter, and mag-nification factor. Journal of Comparative Neurology 158, 295-306.
KIORPES, L. & BLASDEL, G.G. (1987). Optical studies of macaque stri-ate cortex during development. Neuroscience Abstract 13, 11243.
LEVAY, S., HUBEL, D.H. & WIESEL, T.N. (1975). The pattern of oculardominance columns in macaque striate cortex revealed by a reducedsilver stain. Journal of Comparative Neurology 159, 559-576.
LEVAY, S. WIESEL, T.N. & HUBEL, D.H. (1980). The development ofocular dominance columns in normal and visually deprived mon-keys. Journal of Comparative Neurology 191, 1-51.
OBERMAYER, K. & BLASDEL, G.G. (1993). Geometry of orientation andocular dominance columns in monkey striate cortex. Journal of Neu-roscience 13, 4114-4129.
OBERMAYER, K., BLASDEL, G.G. & SCHULTEN, K. (1991). A neural net-work model for the formation and for the spatial structure of ret-inotopic maps, orientation and ocular dominance columns. InArtificial Neural Networks, ed. KOHONEN, T., et al., pp. 505-511.Amsterdam, The Netherlands: Elsevier (North Holland).
OBERMAYER, K., BLASDEL, G.G. & SCHULTEN, K. (1992a). A statisticalmechanical analysis of self-organization and pattern formation dur-ing the development of visual maps. Physiological Reviews A 45,7568-7589.
OBERMAYER, K., SCHULTEN, K. & BLASDEL, G.G. (19926). A compari-son of a neural network model for the formation of brain maps withexperimental data. In Advance in Neural Information ProcessingSystems, ed. TOURETZKY, D.S. & LIPPMAN, R., pp. 83-90. SanMateo, CA: Morgan Kaufmann Publishers.
OBERMAYER, K., KIORPES, L. & BLASDEL, G.G. (1994). Developmentof orientation and ocular dominance columns in infant macaques.In Advances in Neural Information Processing Systems 6, ed.COWAN, J., TESAURO, G., & ALSPECTOR, J., pp. 543-550. SanMateo: CA: Morfan Kaufmann Publishers.
PETTET, M.W. & GILBERT, CD. (1992). Dynamic changes in receptivefield size in cat primary visual cortex. Proceedings of the NationalAcademy of the Sciences of the U.S.A. 89, 8366-8370.
PETTIGREW, J.D., COOPER, M.L. & BLASDEL, G.G. (1979). Improveduse of tapetal reflection for eye position monitoring. InvestigativeOphthalmology and Visual Science 18, 490-495.
PRESS, W.H., FLANNERY, B.P., TEUKOLSKY, S.A. & VETTERLING, W.T.(1988). Numerical Recipes in C. Cambridge, MA: Cambridge Uni-versity Press.
PURVES, D. & LAMANTIA, A. (1993). Development of blobs in the visualcortex of macaques. Journal of Comparative Neurology 332, 1-7.
RAKIC, P. (1976). Prenatal genesis of connections subserving oculardominance in the rhesus monkey. Nature (London) 261, 467-471.
STRYKER, M.P. & SHERK, H. (1975). Modification of cortical orientation-selectivity in the cat by restricted visual experience: A reexamina-tion. Science 190, 904-906.
SWINDALE, N.V. (1982). A model for the formation of orientation col-umns. Proceedings Royal Society B (London) 215, 211-230.
SWINDALE, N.V. (1992). A model for the coordinated development ofcolumnar systems in primate striate cortex. Biological Cybernetics66, 217-230.
TOOTELL, R.H. , SWITKES, E., SlLVERMAN, M.S . & HAMILTON, S.L.(1988). Functional anatomy of macaque striate cortex. II. Retino-topic organization. Journal of Neuroscience 8(5), 1531-1568.
T'so, D.Y., FROSTIG, R.D., LIEKE, E.E. & GRJNVALD, A. (1990). Func-tional organization of primate visual cortex revealed by high reso-lution optical imaging. Science 249, 417-420.
VAN ESSEN, D.C, NEWSOME, W.T. & MAUNSELL, H.R. (1984). The visualfield representation in striate cortex of the macaque monkey: Asym-metries, anisotropies, and individual variability. Vision Research 24,429-448.
WIESEL, T.N. & HUBEL, D.H. (1974). Ordered arrangement of orienta-tion columns in monkeys lacking visual experience. Journal of Com-parative Neurology 158, 307-318.
WOLBARSHT, M.L., MACNICHOL, E.F. & WAGNER, H.G. (1960). Glassinsulated platinum microelectrode. Science 132, 1309-1310.
YOSHIOKA, T, BLASDEL, G., LEVITT, J. & LUND, J.S. (1992). Patternsof lateral connections in macaque visual area VI revealed by biocy-tin histochemistry and functional imaging. Society for NeuroscienceAbstracts 18, 299.
YOSHIOKA, T., BLASDEL, G.G., LEVITT, J.B. & LUND, J.S. (1995). Rela-tion between patterns of intrinsic lateral connectivity, ocular domi-nance, and cytochrome oxidase-reactive regions in macaque monkeystriate cortex. Cerebral cortex (in press).
https://www.cambridge.org/core/terms. https://doi.org/10.1017/S0952523800008476Downloaded from https://www.cambridge.org/core. NYU Medical Center: Ehrman Medical Library, on 23 Feb 2018 at 18:59:26, subject to the Cambridge Core terms of use, available at