
Maternity Care Classification System: Maternity Model of ...
2019 www.kce.fgov.be
KCE REPORT 323Cs
SHORT REPORT
ORGANISATION OF MATERNITY SERVICES IN BELGIUM


2019 www.kce.fgov.be
KCE REPORT 323Cs HEALTH SERVICES RESEARCH
SHORT REPORT
ORGANISATION OF MATERNITY SERVICES IN BELGIUM
MÉLANIE LEFÈVRE, NICOLAS BOUCKAERT, CÉCILE CAMBERLIN, STEPHAN DEVRIESE, HILDE PINCÉ, CHRISTOPHE DE MEESTER, BENOÎT FRICHETEAU, CARINE VAN DE VOORDE


O
KCE Report 323Cs Organisation of maternity services in Belgium 1
■ FOREWORD
Looking at the organisation of maternity services from a perspective of efficiency – weighing the costs of an activity against its results – is an approach that can seem shocking. Is it acceptable to ask this question for such an ancient and vital care? Is it even ethically justified? First of all, let us make one thing clear: the work of healthcare providers is not examined here, but the organisation of maternity services. Can they achieve the same result at a lower cost? The KCE researchers have found that size matters: below a certain number of deliveries per year, maternity services appear to be less efficient. The cost of each delivery is higher than in larger maternity services. In a context of limited resources, it is therefore ethically justified to address this issue; we have to ensure the best possible use of public resources and to reinvest savings in other healthcare activities. Society as a whole will benefit from this; hospitals, healthcare providers and mothers being the privileged beneficiaries.
It is crucial that the recommended measures do not compromise the quality and accessibility of care. The scientific literature does not establish a clear link between the size of a maternity service and quality of care (in the case of low-risk pregnancies and deliveries at least). Safety in small maternity services is therefore not questioned. But what about accessibility, not financial, but geographic? The KCE researchers have addressed this issue carefully by investigating the accessibility with the possible closure of a number of maternity services. The conclusions are clear: parents-to-be can be reassured, the recommendations made in this report do not jeopardize timely access to a place where one can give birth in peace. At most, choice will be reduced, and some habits will have to be adjusted. And we return to ethics: does this reduction of choice conflict with respect for human freedom? This would separate individual ethics from social ethics, while they are closely intertwined. After all, it is not the intention to save money but to allocate public resources in the healthcare sector in the most efficient way. Hence, a small reduction in comfort is exchanged for social improvement. This, of course, without losing sight of the impact on employment and training needs. The necessary measures can be taken to anticipate this, and to ensure that the legitimate expectations of the concerned care providers are respected.
Marijke EYSSEN
Deputy general director a.i.
Christian LÉONARD
General director a.i.
2 Organisation of maternity services in Belgium KCE Report 323Cs
■ SHORT REPORT TABLE OF CONTENTS
■ FOREWORD ......................................................................................................................................... 1 ■ SHORT REPORT .................................................................................................................................. 2 1. BACKGROUND .................................................................................................................................... 5
1.1. THE HOSPITAL LANDSCAPE: FIRST STEPS TOWARDS RATIONALISATION ............................... 5 1.2. SCOPE AND OBJECTIVE OF THE REPORT ...................................................................................... 6 1.3. METHODS ............................................................................................................................................. 7 2. CURRENT ORGANISATION AND ACTIVITY PROFILE OF MATERNITY AND NEONATAL CARE
SERVICES IN BELGIUM .................................................................................................................... 10
2.1. THE SYSTEM OF PERINATAL CARE IN BELGIAN HOSPITALS ..................................................... 10 2.2. A HIGH DENSITY OF MAINLY SMALL MATERNITY SERVICES ..................................................... 12 2.3. OBSTETRIC PATIENTS IN MATERNITY SERVICES ....................................................................... 13
2.3.1. Clinical profile of obstetric patients ....................................................................................... 13 2.3.2. National average bed occupancy rate below 50% but large regional differences ................ 18
2.4. NEWBORNS IN MATERNITY AND NEONATAL CARE SERVICES ................................................. 19 2.4.1. Clinical profile of newborns ................................................................................................... 19
3. CAN THE EFFICIENCY OF BELGIAN MATERNITY SERVICES BE IMPROVED BY INCREASING THEIR SIZE? ....................................................................................................................................... 21
3.1. SEARCH FOR THE MINIMUM EFFICIENT SIZE OF MATERNITY SERVICES ............................... 21 3.2. DATA ENVELOPMENT ANALYSIS (DEA) TO MEASURE THE EFFICIENCY OF MATERNITY
SERVICES........................................................................................................................................... 22 3.2.1. Choice of method .................................................................................................................. 22 3.2.2. Data ....................................................................................................................................... 24 3.2.3. Can Belgian maternity services gain from economies of scale through expansion?............ 26 3.2.4. Do efficiency scores depend on specific characteristics of maternity sites? ........................ 31

O
KCE Report 323Cs Organisation of maternity services in Belgium 3
4. GEOGRAPHIC ACCESSIBILITY OF MATERNITY SERVICES ........................................................ 33
4.1. TRADE-OFF BETWEEN EFFICIENCY AND ACCESSIBILITY .......................................................... 33 4.2. GEOGRAPHIC INFORMATION SYSTEM TO MEASURE TRAVEL TIME TO MATERNITY
SERVICES........................................................................................................................................... 34 4.3. ALMOST ALL WOMEN OF CHILDBEARING AGE HAVE ACCESS TO AT LEAST ONE
MATERNITY SERVICE WITHIN 30 MINUTES IN THE CURRENT LANDSCAPE ............................ 35 4.4. EFFICIENCY GAINS, ACCESSIBILITY AND PATIENT CHOICE AFTER A RATIONALISATION OF
MATERNITY SERVICES ..................................................................................................................... 37 5. HOW MANY MATERNITY BEDS ARE NEEDED TO AVOID EXCESS CAPACITY AND
GUARANTEE TIMELY ACCESS? ..................................................................................................... 39
5.1. QUEUEING SYSTEMS TO DETERMINE THE REQUIRED BED CAPACITY IN BELGIAN MATERNITY SERVICES ..................................................................................................................... 39 5.1.1. Patient flow and queues ........................................................................................................ 40
5.2. MODELLING PATIENT FLOW TO UNDERSTAND BED CAPACITY NEEDS IN BELGIAN MATERNITY SERVICES ..................................................................................................................... 41 5.2.1. Admissions differ by patient group, by season, by day of the week and hour of the day ..... 43 5.2.2. Length of stay differs by maternity service, patient group and arrival time ........................... 45 5.2.3. Validation of the model .......................................................................................................... 45
5.3. BED CAPACITY NEEDS AND WAITING TIME WITH THE CURRENT NUMBER OF MATERNITY SERVICES........................................................................................................................................... 46 5.3.1. Association between bed capacity, occupancy rate and probability of delay ....................... 46 5.3.2. Bed capacity needs ............................................................................................................... 48 5.3.3. Waiting times ......................................................................................................................... 48
5.4. IMPACT OF A RATIONALISATION OF MATERNITY SERVICES ON CAPACITY NEEDS AND TIMELY ACCESS ................................................................................................................................ 50
6. TOWARDS AN ACCESSIBLE GEOGRAPHIC ALLOCATION OF EFFICIENT MATERNITY SERVICES IN BELGIUM .................................................................................................................... 53

4 Organisation of maternity services in Belgium KCE Report 323Cs
6.1. INCREASE THE MINIMUM STANDARD OF 400 DELIVERIES PER YEAR TO ACHIEVE ECONOMIES OF SCALE .................................................................................................................... 53
6.2. ENSURE A MAXIMUM COVERAGE OF MATERNITY SERVICES ACROSS THE TERRITORY .... 55 6.3. ANALYSE THE ABSORPTION CAPACITY OF THE REMAINING MATERNITY SERVICES ........... 55 6.4. DETERMINE A BED DELAY TARGET ............................................................................................... 56 6.5. CREATE THE NECESSARY PRECONDITIONS FOR A REFORM .................................................. 56
6.5.1. Invest efficiency gains in the hospital sector ......................................................................... 56 6.5.2. Take accompanying measures for the staff .......................................................................... 57 6.5.3. Take accompanying measures for the costs of hospital infrastructure ................................. 57 6.5.4. Re-activate the staffing registration in the MZG – RHM ....................................................... 57
■ REFERENCES .................................................................................................................................... 58 ■ RECOMMENDATIONS ....................................................................................................................... 62

O
KCE Report 323Cs Organisation of maternity services in Belgium 5
1. BACKGROUND 1.1. The hospital landscape: first steps towards
rationalisation Internationally, some large-scale trends in health services design are emerging, that respond to demand (demographic pressures, expectations, multi-morbidity, etc.) and supply (workforce shortages, new technologies, increasing costs, etc.) pressures: care is becoming more specialised and concentrated, but is also delivered closer to home.1 Although there is no commonly accepted list of criteria to classify hospital activities in terms of where they should be provided (close to the patient or more centralised), the following criteria are found in literature and practice abroad:1 interventions for time-critical conditions; capital intensity (expensive equipment or infrastructure); size and composition of the target population; degree of specialisation or complexity; availability of workforce; and frequency of the intervention (per patient). Healthcare provision also becomes increasingly integrated, with traditional community, primary, secondary and specialist/tertiary services becoming better linked. And hospitals have increased their reliance on partnerships with other hospitals and deliver care through clinical networks.
Until now, Belgian hospitals have mainly been operating as stand-alone organisations providing the full range of services, including very specialised and complex services.1 Although the number of collaborations between Belgian hospitals has increased during the last decade, the reason for collaboration was in most cases not task distribution.2 However, some recent reform plans and reforms were designed following international trends. The Act of 28 February 2019,3 amending some provisions of the Hospital Act of 10 July 2008 and entering into force no later than 1 January 2020 introduced clinical networks for hospitals (see Box 1 for the definition of a loco-regional clinical network and of a care assignment in the Act of 28 February 2019).
Box 1 – Core elements of the Act of 28 February 2019 on hospital networks
Loco-regional clinical network
• A maximum of 25 loco-regional clinical hospital networks will be established for the country (with a maximum of 13 networks in the Flemish Region, 8 in the Walloon Region and 4 in the Brussels Capital Region).
• Each general hospital is obliged to join one and only one such network.
• Collaboration is within a contiguous geographic area (except in large cities) and hospitals in the network must offer care assignments that are complementary to each other.
Care assignments
• A distinction is made between loco-regional and supraregional care assignments. A care assignment includes all activities of hospitals related to a hospital service, a hospital function, a hospital department, a heavy medical device, a medical service, a medical-technical service or a care programme. Loco-regional care assignments must be provided within each loco-regional network while supraregional care assignments may not be offered within each loco-regional network.
• Regarding the activities that can be offered within each loco-regional network, the Act of 28 February 2019 makes a distinction between general and specialised care assignments. The difference between both types is that general care assignments can be provided in each hospital of the loco-regional network while specialised care assignments only in a limited number of hospitals within the network.
• Patients have free choice of provider.
Source: Act of 28 February 20193

6 Organisation of maternity services in Belgium KCE Report 323Cs
The present report focuses on the organisation of maternity services in Belgium. In the reform plans of the minister, maternity services are one of the prime examples to rationalise hospital supply. In the Act of 28 February 2019 it is stipulated (Article 8) that the distinction between loco-regional and supraregional, and between general and specialised care assignments can be made by Royal Decree. At this moment (December 2019) no decision has been taken on the classification into general and specialised care assignments. However, in policy documents maternity services are considered to be specialised care assignments, hence to be provided by a limited number of hospitals within a network (see Box 1).4
1.2. Scope and objective of the report
Recommendations of KCE Report 289 In 2017, KCE published a report (Report 289) on the required hospital capacity in 2025, at the macro level as well as for a selection of care assignments.1 The report was commissioned by the Federal minister of Social Affairs and Public Health (minister De Block) and fits in the reform plans of the hospital sector - more specifically in the capacity planning and programming part of the reform. KCE Report 289 (Chapter 8) includes a detailed description of the organisation, capacity and activity profile of maternity services in Belgium for the year 2014 as well as a description of reforms in England, France and Sweden.
On the basis of the results for Belgium and an international trend of less and larger maternity services, it was recommended to adapt (periodically) programming standards for maternity beds. However, limiting the capacity reduction to only a reduction in the number of maternity beds will not result in large budgetary gains for public authorities. Therefore, as is the case in other countries, a capacity reduction could also envisage a reduction in the number of maternity services, resulting in larger number of deliveries per maternity service. A main driver of reforms abroad are economies of scale, which means that average care costs are lower when the size, measured in terms of the number of deliveries, is larger. Cost containment and efficiency gains are to be expected from closing maternity services with low activity levels. However, rationalisation efforts of maternity services abroad tried to
balance the societal goals of efficiency (concentrating maternity care and closing small services) and accessibility for patients.
Therefore, in addition to the recommendation to adapt programming standards for maternity beds, KCE Report 289 also recommended further research to evaluate the efficiency of Belgian maternity services: “Increasing the minimum standard of 400 deliveries per maternity service seems, based on literature and international practice, necessary to achieve economies of scale. To determine a specific threshold research into the relationship between the number of deliveries and (staff) costs should be set up.”
Objective and research questions of the current report The ultimate goal of the current report, which has also been commissioned by minister De Block and can be considered as a follow-up study to KCE Report 289 (Chapter 8), is to provide recommendations on the organisation and capacity of maternity services in Belgian hospitals in terms of the number, size and geographical distribution.
The general aim of the report can be detailed into the following research questions:
• Is the size of a maternity service, measured in terms of the number of deliveries, related to its efficiency?
• Which geographic distribution of maternity services across the Belgian territory guarantees access within a specified time limit?
• How many maternity beds are needed given the trade-off between an efficient use of scarce resources and the needed timely access to appropriate care?
Scope of the report In Belgium there are two levels of maternity services: the general maternity services and the ‘maternal intensive care (MIC)’ departments (with MIC-beds). The terminology ‘maternal intensive care’ is, however, confusing since it does not concern ‘intensive care’ but the ‘intensive monitoring’ of high-risk pregnancies and deliveries.1, 5 Therefore, it would be better to use ‘maternal intermediate care’ instead. While activity in general maternity

O
KCE Report 323Cs Organisation of maternity services in Belgium 7
services and maternity intensive services is studied in this report, an evaluation of care for high-risk pregnancies and deliveries as well as the availability and appropriate use of MIC-beds is out of scope. Because neonatal care services are included in the efficiency analysis (see section 3), we also briefly describe the organisation and activity performed at these services.
1.3. Methods The study applies a mixed-method approach. The main steps are summarised in Table 1. The content of Chapter 2 and the methods used in Chapters 4 and 6 of the scientific report were reviewed by experts in the field.
Table 1 – Mixed-method approach What? (Chapter in scientific report) Method?
Factual description of the organisation of maternity and neonatal care services (Chapter 2)
• Review of legal documents; • Analysis of administrative database: the Minimal Hospital Data (MZG – RHM), collected by the
Federal Public Service (FOD – SPF) Public Health
Analysis of the activity profile of maternity and neonatal care services (Chapter 3)
• Analysis of administrative database: the Minimal Hospital Data (MZG – RHM)
Efficiency analysis, to assess whether the size of maternity services in Belgian hospitals, measured in terms of the number of deliveries, is related to its efficiency (Chapter 4)
• Data Envelopment Analysis (DEA)
Analysis of geographic accessibility to assess travel times to the nearest maternity service in the current situation and in case of a concentration of maternity services (Chapter 5)
• Spatial analysis based on Geographic Information Systems (GIS)
Estimation of the required number of beds in the current situation (2016) and in case of a concentration of maternity services, based on current patient flow (Chapter 6)
• Simulation model based on queueing theory
Solution elements for a more efficient but accessible organisation of maternity services in Belgium
• Consultation of experts, stakeholders and key decision makers on the proposed model.
Scientific validation • Review of this report by three independent scientific experts (see colophon).
8 Organisation of maternity services in Belgium KCE Report 323Cs
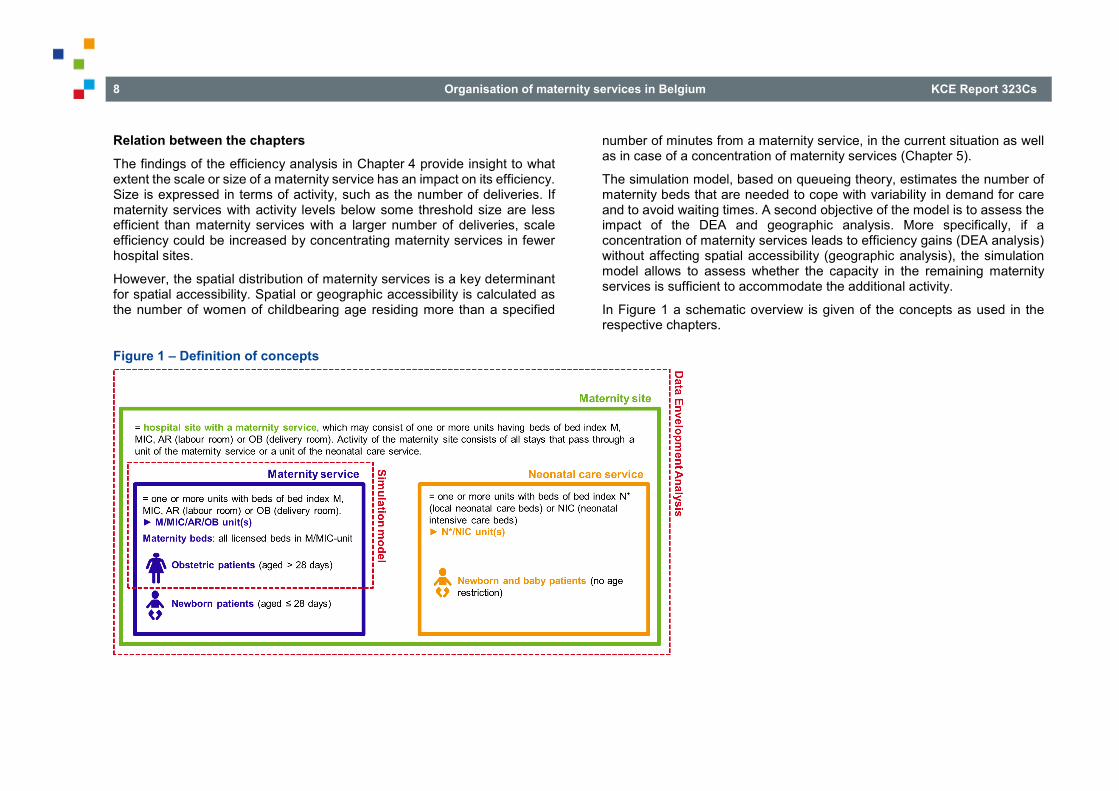
Relation between the chapters The findings of the efficiency analysis in Chapter 4 provide insight to what extent the scale or size of a maternity service has an impact on its efficiency. Size is expressed in terms of activity, such as the number of deliveries. If maternity services with activity levels below some threshold size are less efficient than maternity services with a larger number of deliveries, scale efficiency could be increased by concentrating maternity services in fewer hospital sites.
However, the spatial distribution of maternity services is a key determinant for spatial accessibility. Spatial or geographic accessibility is calculated as the number of women of childbearing age residing more than a specified
number of minutes from a maternity service, in the current situation as well as in case of a concentration of maternity services (Chapter 5).
The simulation model, based on queueing theory, estimates the number of maternity beds that are needed to cope with variability in demand for care and to avoid waiting times. A second objective of the model is to assess the impact of the DEA and geographic analysis. More specifically, if a concentration of maternity services leads to efficiency gains (DEA analysis) without affecting spatial accessibility (geographic analysis), the simulation model allows to assess whether the capacity in the remaining maternity services is sufficient to accommodate the additional activity.
In Figure 1 a schematic overview is given of the concepts as used in the respective chapters.
Figure 1 – Definition of concepts

O
KCE Report 323Cs Organisation of maternity services in Belgium 9
Data sources The analyses in Chapters 2-4 and Chapter 6 of the scientific report are based on the Minimal Hospital Data (MZG – RHM) for 2016. The MZG – RHM contains the following information for each inpatient and day-care stay: stay information (such as patient characteristics, length and type of the stay, involved nursing units and bed types); medical information (diagnoses and procedures) and information on pathology group (APR-DRG and severity of illness – see Box 2. In each of the chapters, a specific selection of observations and variables was made. More information can be found in the Data Manual, which is available on request. The spatial analysis in Chapter 5 is based on the results of the previous chapters, on population statistics of Statistics Belgium (Federal Public Service Economy) and on TomTom historical traffic data.
The unit of analysis in this report is a hospital site with a maternity service. One hospital can have more than one site with a maternity service. Each maternity service consists of one or more units (‘verpleegeenheid’/ ’unité de soins’). However, no analyses are performed at the unit level.
Box 2 – APR-DRG classification system
Belgium imported the 3MTM APR-DRG (All Patient Refined-Diagnosis Related Group) grouper to assign hospital stays an APR-DRG. The basic DRG structure is extended by adding two sets of subclasses to each APR-DRG, namely severity of illness (SOI) and risk of mortality (ROM).
Patients are allocated to an APR-DRG-SOI group by the 3MTM DRG software on the basis of principal diagnosis, secondary diagnoses and procedures (coded in ICD-10-BE in the MZG – RHM), age and sex of the patient, and for some APR-DRGs (e.g. burns) type of discharge or birthweight (for neonates).
Severity of illness is defined as the extent of physiologic decompensation or organ system loss of function and introduces four categories for SOI: 1=minor, 2=moderate, 3=major, 4=extreme.
Hospital stays are classified into one of 318 APR-DRGs (version 34), each with 4 SOI-classes, and two ‘residual’ APR-DRGs grouping hospital stays whose medical record abstracts contain clinically atypical or invalid information, thus rendering SOI classification irrelevant (APR-DRG 955 – Invalid principal diagnosis and 956 – Ungroupable stay). Hence, the number of distinct groups amounts to 1 274.
Source: Devriese et al. (2016)6, Averill, et al. (2016)7

10 Organisation of maternity services in Belgium KCE Report 323Cs
2. CURRENT ORGANISATION AND ACTIVITY PROFILE OF MATERNITY AND NEONATAL CARE SERVICES IN BELGIUM
2.1. The system of perinatal care in Belgian hospitals Perinatal hospital care consists of maternity services (M-service), maternal intensive care departments (MIC-department), local neonatal care functions (N*-function) and units (N*-unit), neonatal intensive care services (NIC-service) and regional perinatal care functions (P*-function). Chapter 2 in the scientific report describes the legal context of these services, departments and functions, with a focus on programming standards (determined by the federal authorities) and licensing standards (determined by the federated authorities).
Interdependency between maternity and other services Figure 2 illustrates the interdependencies between the maternity service and other hospital services (where service is a generic term for service, department, function or care programme). Figure 2 also shows the link with the paediatric (E-) service and the care programme for children, but both are out of scope of the current report.
A maternity service must belong to a hospital that includes:
• at least a service where surgery and internal medicine are practiced (services C and D) (RD of 21 January 1998, art. 3)8
• a licensed neonatal care function (N*-function) (RD of 20 August 1996, art. 1)9
• a licensed care programme for children (RD of 2 April 2014, art. 1)10.
a There is one hospital in Brussels that has MIC-beds but no NIC-beds, but this
hospital works in close collaboration with a hospital that has NIC-beds.
Every maternity service with MIC-beds must also have NIC-bedsa. There is no legal requirement for a hospital with NIC-beds to also have MIC-beds.
The regional perinatal care function (P*-function) consists of a licensed MIC-department and a licensed NIC-service on the same hospital site. Hospitals with a P*-function act as a reference centre that has to make collaboration agreements with hospitals with a licensed M-service and N*-function. Together, these hospitals must have at least 5 000 deliveries per year (RD of 20 August 1996, art 6).11
Minimum activity requirements Minimum activity requirements are defined for maternity services. They apply to each hospital site with a maternity service.12 The annual number of deliveries in a maternity service must be at least 400 on average during three consecutive years (RD of 30 January 1989, art. 17).13 It is possible to deviate from these minimum standards in the following cases (RD of 30 January 1989, art. 18 and RD of 21 January 1998, art. 16):8, 13
• in the area where the service is established, the closest similar service is located at a distance of at least 25 km;
• the service is established in a municipality of at least 20 000 inhabitants where the closest similar service is located at a distance of at least 15 km;
• the closest maternity service in the same Community (‘Gemeenschap’/‘Communauté’) is located at a distance of at least 50 km.

O
KCE Report 323Cs Organisation of maternity services in Belgium 11
Figure 2 – Interdependencies between the maternity service and other hospital services
Note: Hospital services are depicted in blue, hospital functions in orange and hospital departments in green. Each arrow stands for ‘… belongs to a hospital that also includes…’; for instance, a maternity service must belong to a hospital that also includes a surgery and internal medicine department. If the concerned services must be co-located on the same site, it is mentioned above the arrow. Except otherwise stated, the requirements are defined at the hospital level. Although the N*-function is required for each hospital with a maternity service, the N*-unit must be located within or adjacent to the maternity service, which explains the ‘site’ above the arrow. The Royal Decree of 2 April 2014 regulating the care programme for children was annulled in December 2016. Care for children is therefore organised by a previous RD (13 July 2006).14 Source: art 2 of RD of 30 January 1989,13, art 1 and 20 of RD of 20 August 19969, art N5 and art N6 of RD of 23 October 196415, and RD of 20 August 199611
Programming standards and minimum number of beds Programming standards only apply to maternity services and NIC-services. The national programming standards are 32 M-beds per 1 000 births and 6 NIC-beds per 1 000 births.16 For NIC- and MIC-services also a minimum number of beds per service is defined: 15 beds for a NIC-service and 8 beds for a MIC-service.

12 Organisation of maternity services in Belgium KCE Report 323Cs
2.2. A high density of mainly small maternity services
Regional differences in the organisation of maternity services In December 2016 there were 108 maternity services in Belgium (62 in Flanders, 35 in Wallonia and 11 in Brussels). At the hospital level, 96 out of 102 acute hospitals had at least one maternity service (see Table 2). The 108 maternity services represent 3 082 licensed M/MIC-beds, of which 192 are MIC-beds. This corresponds to 25.4 beds per 1 000 births, which is far below the programming standard of 32 M-beds per 1 000 births which dates back to the 1970’s.16
The results of Brussels are different from those of Flanders and Wallonia. The number of M/MIC-beds per 1 000 women aged 15-49 is higher in Brussels than in the two other regions, but when expressed per 1 000 births it is lower than in Flanders and Wallonia because of a higher number of births in Brussels. Brussels is also differently organised regarding the share of maternity services with MIC-beds: more than half of the maternity services have MIC-beds in Brussels, while for the other two regions this share is less than 15%.
Since every hospital with a maternity service must also have an N*-function, the distribution of the N*-function across regions is the same as for maternity services.
Table 2 – Hospitals and hospital sites with M/MIC-beds in Belgium, December 2016 Brussels Flanders Wallonia Belgium
Hospitals with M-beds (total number of hospitals*) 10 (12) 54 (54) 33 (37) 96 (102)** Hospital sites with M-beds (total number of hospital sites*) 11 (17) 62 (79) 35 (54) 108 (150) Hospital sites with MIC-beds (total number of hospital sites with M-beds) 6 (11) 7 (62) 5 (35) 18 (108) Number of M-beds (except MIC-beds) 346 1636 908 2890 Number of MIC-beds 72 70 50 192 Number of M/MIC-beds 418 1 706 958 3 082 Number of M/MIC-beds per 1 000 women aged 15-49 1.37 1.22 1.20 1.23 Number of M/MIC-beds per 1 000 births 23.32 25.85 25.72 25.44
* with at least one C, D, CD, E or M-bed. ** Centre Hospitalier Interrégional Edith Cavell is counted once in the Belgium column but has one maternity service in Brussels and another in Wallonia. Source for population midyear 2016 and births 2016: Statbel (Statistics Belgium). Source for hospitals and beds: Minimal Hospital Data (MZG – RHM).

O
KCE Report 323Cs Organisation of maternity services in Belgium 13
Majority of maternity services in Flanders and Wallonia have less than 25 licensed M/MIC-beds The smallest maternity services (with less than 25 licensed beds) are concentrated in Flanders and Wallonia (see Table 3). The share of maternity services with less than 25 M/MIC-beds amounts to 65% in Flanders and 69% in Wallonia, while this share is only 18% in Brussels. The median number of beds for the country is 24 compared to 36 for Brussels.
Table 3 – Size of maternity services, December 2016 Brussels Flanders Wallonia Belgium
Number of maternity services* with ≤ 15 M/MIC-beds
0 14 8 22
Number of maternity services* from 16 to 25 M/MIC-beds
2 26 16 44
Number of maternity services* with 26 to 40 M/MIC-beds
5 12 7 24
Number of maternity services* with > 40 M/MIC-beds
4 10 4 18
Median number of M/MIC-beds per maternity service*
36 22 22 24
*Hospital sites with M-beds. Source: Minimal Hospital Data (MZG – RHM)
2.3. Obstetric patients in maternity services The description of the activity profile in maternity services is based on the Minimal Hospital Data (MZG – RHM) for 2016. In Belgium, all newborns have their stays recorded in the MZG – RHM as soon as they are born (including stillborn babies) or are admitted to the hospital, even if they stay in the room of the mother. The activity profile of newborns is discussed in section 2.4. All other patients in a maternity service are called obstetric patients.
2.3.1. Clinical profile of obstetric patients
Selection of stays The selection consists of obstetric patients who were at any time of their hospitalisation admitted in a maternity service, i.e. in any unit including a bed index M, MIC, AR (labour room) or OB (delivery room) in the MZG – RHM. These patients are mainly pregnant women, labouring women, women having delivered and a few patients admitted for care unrelated to pregnancy or delivery.
APR-DRGs are grouped into Major Diagnostic Categories (MDCs). We use the level of the MDCs to categorise the selected stays and describe the activity in maternity services. For the purpose of the present study, we divide MDC 14 ‘Pregnancy, Childbirth and Puerperium’ into deliveries (henceforth called MDC 14A) and other APR-DRGs related to pregnancy and the puerperium (henceforth called MDC 14B) (see Box 3).
Stays in day care that are assigned a so-called APR-DRG MMM are excluded because of a large variability in (coding) practice between hospitals (see section 3.1.2 in the scientific report).

14 Organisation of maternity services in Belgium KCE Report 323Cs
Box 3 – Definition of selected MDCs and APR-DRGs
MDC 13 ‘Diseases and disorders of the female reproductive system’
MDC 14 ‘Pregnancy, Childbirth and Puerperium’
MDC 14A: Deliveries
APR-DRG 540 ‘Caesarean Delivery’
APR-DRG 541 ‘Vaginal Delivery with Sterilization and/or Dilatation and Curettage’
APR-DRG 542 ‘Vaginal Delivery with Complicating Procedure except Sterilisation and/or Dilatation and Curettage’
APR-DRG 560 ‘Vaginal Delivery’
MDC 14B: Other APR-DRGs related to pregnancy and the puerperium (APR-DRGs 544-546 and 561-566)
MDC 15 ‘Newborns & other neonates with conditions originating in the perinatal period’
Source: Averill, et al. (2016)7. The division of MDC 14 into MDC 14A and MDC 14B was made for this study only.
Almost 75% of activity are deliveries but large differences between regions and maternity services The total number of selected stays for obstetric patients in 2016 amounts to 163 166 (see Table 4). The vast majority of these stays are assigned to MDC 14 (89.0%), of which 121 180 deliveries (74.3%). The most common MDC outside MDC 14 is the gynaecological MDC 13 (4.0%).
The percentage of deliveries is particularly high in Brussels (82.7%) compared to Flanders (70.5%) and Wallonia (75.9%). The share of MDC 14B is similar (13.5% in Brussels, 14.2% in Flanders and 16.4% in Wallonia). Maternity services in Flanders have more stays outside MDC 14: 5.8% in MDC 13 and 9.4% in other MDCs versus 1.1% and 2.7% in Brussels and 2.6% and 5% in Wallonia, respectively. Figure 3 depicts the percentage of nursing days dedicated to deliveries and to the remaining activity by maternity service, ranked by region and number of deliveries. The share of the remaining activity beyond deliveries in nursing days is highly variable between maternity services, ranging from 3.4% to 61.7% (mean: 17.8%, median: 15.3%). This share is smaller in Brussels than in the two other regions. Brussels knows a higher fertility rate than the two other regions (1.82 children per woman in 2016 versus 1.66) and its higher concentration of MIC-beds and university hospitals attracts women from outside Brussels.

O
KCE Report 323Cs Organisation of maternity services in Belgium 15
Table 4 – Number (percentage) of stays in maternity services by region and MDC, without APR-DRG MMM and newborns (2016)
Major Diagnostic Category
Number of stays (Percentage)
Brussels Flanders Wallonia Belgium
MDC 14A
Vaginal deliveries 19 966 (65.9%)
48 842 (55.7%)
26 776 (59.3%)
95 584 (58.6%)
Caesarean deliveries 5 089 (16.8%)
13 005 (14.8%)
7 502 (16.6%)
25 596 (15.7%)
Subtotal deliveries 25 055 (82.7%)
61 847 (70.5%)
34 278 (75.9%)
121 180 (74.3%)
MDC 14B Pregnancy and puerperium 4 100 (13.5%)
12 495 (14.2%)
7 431 (16.4%)
24 026 (14.7%)
MDC 14 Pregnancy, childbirth and puerperium 29 155 (96.3%)
74 342 (84.8%)
41 709 (92.3%)
145 206 (89.0%)
MDC 13 Diseases and disorders of the female reproductive system
329 (1.1%)
5 076 (5.8%)
1 196 (2.6%)
6 601 (4.0%)
Others All stays outside MDC 13 and MDC 14 803 (2.7%)
8 286 (9.4%)
2 270 (5.0%)
11 359 (7.0%)
Other MDCs All stays outside MDC 14 1 132 (3.7%)
13 362 (15.2%)
3 466 (7.7%)
17 960 (11.0%)
Total All stays, MMMs excluded 30 287 (100%)
87 704 (100%)
45 175 (100%)
163 166 (100%)
Source: Minimal Hospital Data (MZG – RHM)

16 Organisation of maternity services in Belgium KCE Report 323Cs
Figure 3 – Activity related and unrelated to deliveries in maternity services in Belgium, newborns excluded (2016)
Activity in maternity services (inpatient setting). Source: Minimal Hospital Data (MZG – RHM).
The number of deliveries per maternity service is highly variable The median number of deliveries per maternity service was 876, varying from 119 to 3 519 deliveries between sites (see Figure 4). The median number of deliveries in Brussels is much higher than in the two other regions:
2 172 deliveries against 790 for the Flemish services and 785.5 for the Walloon services. The ‘smallest’ service in Brussels had 1 118 deliveries in 2016. Eight maternity services had less than 400 deliveries.

O
KCE Report 323Cs Organisation of maternity services in Belgium 17
Figure 4 – Number of deliveries per maternity service by region in Belgium (2016)
Deliveries in maternity services (inpatient and day-care settings). Source: Minimal Hospital Data (MZG – RHM).

18 Organisation of maternity services in Belgium KCE Report 323Cs
Caesarean deliveries have the most severe case mix To compare the case mix of different types of activity, we use two methods. First, we weight each inpatient stay by the national average length of stay per APR-DRG-SOI and each day-care stay by 0.81 (which is the length of stay used in the payment system for surgical day-care stays). Second, we weight stays by the relative weight per APR-DRG-SOI developed by 3M.17 Caesarean deliveries present the most severe case mix in both methods, followed by vaginal deliveries and the stays in MDC 14B.
The length of stay continues to decrease but at an accelerated pace in recent years The average length of stay was 3.4 days for a vaginal delivery and 5.3 days for a caesarean delivery in 2016. Between 2003 and 2016, the average length of stay for a vaginal delivery was shortened by 1.3 days and by 2 days in case of a caesarean delivery. The trend was most likely accelerated by the announcement and the launch of seven two-year pilot projects that aim to optimise the organisation of care before, during and after delivery at the hospital stay.18 The decreasing trend is in line with international observations.19
2.3.2. National average bed occupancy rate below 50% but large regional differences
The national annual occupancy rate (see Box 4) in 2016 was 48.2% for Belgium, 66.6% for Brussels, 47.1% for Flanders and 44.3% for Wallonia. The national and regional occupancy rate hides a high variability among maternity services. Figure 5 shows the annual occupancy rate of each maternity service in Belgium, ranked by region and number of deliveries. The average rate per maternity service given by the dots hide days with very low or very high activity. This is depicted by the light blue band ranging from the daily minima to the maxima reached by maternity services in the course of 2016. Annual occupancy rates range from 42.0 to 95.2% in Brussels, 23.3% to 79.3% in Flanders and 19.6% to 88.4% in Wallonia.
Box 4 – Definition of bed occupancy rate
The daily occupancy rate is defined as the time spent in a maternity service by all inpatients present in the service on a particular day divided by the number of licensed maternity beds available in the service that same day. This ratio is expressed as a percentage. The numerator concerns all obstetric inpatient activity in a maternity service, including stays with another MDC than MDC 14. The denominator includes all licensed beds of the service, irrespective of the bed index. The MZG – RHM database does not allow to determine the time spent in a specific bed index. Note that the number of licensed beds can be larger than the number of operational beds, but no data on operational beds are available.
The annual occupancy rate by maternity service is the average of daily rates. The national annual occupancy rate is the average of annual occupancy rates of all maternity services.

O
KCE Report 323Cs Organisation of maternity services in Belgium 19
Figure 5 – Average annual occupancy rate for each maternity service in Belgium (2016)
Activity in maternity services (inpatient setting). The light blue band gives per maternity service the range from the lowest to the highest value of the daily occupancy rate. Source: Minimal Hospital Data (MZG – RHM).
2.4. Newborns in maternity and neonatal care services
2.4.1. Clinical profile of newborns
Selection of stays The selection consists of all stays of patients aged 28 days and below who were at any time of their hospitalisation admitted in a maternity service, and all patients admitted in an N*- or a NIC-unit. Stays in day care that are assigned a so-called APR-DRG MMM are excluded because of a large variability in (coding) practice between hospitals.
Hospitals differ in the way newborns are admitted or recorded The total number of stays for newborns amounts to 126 994 in 2016. The vast majority of newborns were assigned to MDC 15 ‘Newborns & other neonates with conditions originating in the perinatal period’ (98.5%).
To study the inter-hospital variability of N* admission policy, the number of newborns in each bed index group is represented per hospital in Figure 6, ranking hospitals by region and total number of newborn stays. The proportion of newborns admitted to N* varies from 0% to 100% between hospitals. The median percentage of newborns admitted in an N*-bed (and not in a NIC-bed) reaches 5% in hospitals with NIC-beds and 14.6% in hospitals without NIC-beds, without any notable regional difference. Neonatal care services were included in the efficiency analysis of Belgian maternity services to take this variability into account.

20 Organisation of maternity services in Belgium KCE Report 323Cs
Figure 6 – Number of newborn stays per hospital, by bed index group (2016)
Newborns at the maternity and neonatal care services (inpatient and day-care settings). Newborn stays spent only in an M/MIC-bed are depicted in blue, stays in an N*-bed (and M/MIC-bed) in orange and stays in a NIC-bed (and possibly in an N*-bed and/or M/MIC bed) are represented in red. Source: Minimal Hospital Data (MZG – RHM).

O
KCE Report 323Cs Organisation of maternity services in Belgium 21
3. CAN THE EFFICIENCY OF BELGIAN MATERNITY SERVICES BE IMPROVED BY INCREASING THEIR SIZE?
3.1. Search for the minimum efficient size of maternity services
The current international trend is to move away from small maternity services towards larger units. The underlying assumption is that an increase in scale or size will increase efficiency. The explanation for being more efficient is that the costs of minimum staff and equipment requirements are fixed, also for maternity services with low activity levels. Hence, maternity services with more deliveries can operate at a lower cost per delivery compared to maternity services with a low activity level. Increasing the scale of maternity services reduces the use of public resources for inefficient activity.
The results of section 2 can be summarised as a landscape with a high density of small maternity services with, on average, low occupancy rates of maternity beds and a large variability in caseload between maternity services. These characteristics, combined with minimum staff and equipment requirements, suggest that efficiency gains could be realised by following the international trend of a concentration of maternity care. Hence, the central question of this section is: Is the size of maternity services related to their efficiency?
Introduction of concepts The method of efficiency analysis used in this study has a background in production theory and heavily relies on economic concepts, which are introduced in Box 5.
Box 5 – Definition of concepts
Economies of scale A hospital or service experiences economies of scale when the average costs decline as the volume of activity increases. Economies of scale are most likely to be found when fixed costs are high relative to variable costs. As the activity increases (for example by increasing the number of deliveries), the fixed costs of personnel and equipment are spread over a larger volume. Hence, for maternity services with a higher number of deliveries, the total cost per delivery gets lower. When the optimal scale is reached, no gain can be made by increasing the number of deliveries further. At some point, when the maternity service becomes too large, diseconomies of scale can appear: expanding the scale further increases the average costs per delivery.
Returns to scale While economies of scale measure the relationship between costs (for example personnel and equipment costs) and outputs (for example deliveries), returns to scale refer to the relation between inputs (resources) and outputs. More specifically, returns to scale tell us how outputs change in response to an increase in all inputs in the long run.
Suppose a maternity service produces one output (vaginal deliveries) with two inputs (personnel and beds):
• The service exhibits constant returns to scale (CRS) if for any positive factor a holds that when both inputs are multiplied by a, the output is multiplied by the same factor a. In a perfectly competitive input market, CRS imply that the long run average cost is constant.
• The service exhibits increasing returns to scale (IRS) if for any positive factor a holds that when both inputs are multiplied by a, the output is multiplied by more than a. In a perfectly competitive input market, IRS imply that the long run average cost is decreasing (economies of scale).

22 Organisation of maternity services in Belgium KCE Report 323Cs
• The service exhibits decreasing returns to scale (DRS) if for any positive factor a holds that when both inputs are multiplied by a, the output is multiplied by less than a. In a perfectly competitive input market, DRS imply that the long run average cost is increasing (diseconomies of scale).
• When the service exhibits variable returns to scale (VRS) no rescaling is possible.
3.2. Data Envelopment Analysis (DEA) to measure the efficiency of maternity services
3.2.1. Choice of method There is a vast literature on the measurement of (scale) efficiency in different sectors, including the healthcare sector such as hospitals.20 Most studies use Data Envelopment Analysis (DEA), which is a non-parametric technique that requires no functional relationship between inputs and outputs. Section 3.4 in the scientific report provides an extensive description of the DEA method and its underlying assumptions, as well as graphs showing the one input-one output case. Box 6 gives a short description of the DEA method.
Box 6 – DEA explained
A DEA model first estimates the technology, which is the set of combinations of feasible inputs and outputs, from observed data. The model evaluates the efficiency of entities of similar nature, called decision making units (DMUs). In our application the maternity services are the DMUs. These DMUs use the same multiple inputs (i.e. resources, such as staff or beds) and produce the same multiple outputs (i.e. activity, such as deliveries).
Efficient frontier and relative efficiency score The combinations of inputs and outputs that cannot be improved, are called the efficient subset DMUs. They constitute the efficient frontier (the production possibility frontier) which may be used as a benchmark for non-efficient DMUs. These DMUs get a score of 1. Non-frontier units get a score between 0 and 1, according to their distance to the efficient frontier. Hence, the method converts multiple inputs and multiple outputs into one efficiency score. The frontier is for the non-efficient DMUs a goal that can be reached by a reduction in their inputs or an increase in their outputs. The efficiency score is a relative efficiency score: the score is relative to other DMUs included in the analysis. For example, a DMU with a score of 0.6 means that this DMU could save 40% of its resources compared to a DMU with a score equal to 1.
Input versus output efficiency Input efficiency measures by how much inputs can be reduced to attain the efficiency frontier at a fixed output level. Output efficiency measures the maximum increase in outputs that is feasible with the same inputs. Input efficiency can be denoted by E=x*/x with x the input level of a service and x* the input level to which x can be reduced without decreasing the output level.

O
KCE Report 323Cs Organisation of maternity services in Belgium 23
Optimal operating size: the minimum efficient scale size In the CRS model, the returns to scale are fixed by assumption, which is not the case in the VRS model. In a graphical representation of a single input and single output case, the quantity of output produced per unit of input first increases, then is constant and finally decreases (see Figure 7). Stated differently, returns to scale are increasing for small quantities of inputs, then they are constant and finally they are decreasing for large quantities of inputs. The minimum efficient scale or most productive scale size (MPSS) is the lowest output (number of deliveries) that minimises the long run average cost; that is the level of output where returns to scale become constant.
Relation between overall, technical and scale efficiency Most DEA models assume constant (CRS) or variable returns to scale (VRS). The CRS model yields an evaluation of overall efficiency, the VRS model estimates technical efficiency (ability to use best practices, i.e. it reflects the ability to obtain maximal output from a given set of inputs) at the real scale of the DMU. The ratio between the overall efficiency and the technical efficiency gives the scale efficiency (SE= x*CRS/x and x*VRS/x or SE= ECRS/EVRS). A measure of scale efficiency (SE) shows how close a maternity service is to its most productive scale size. The ratio ranges between zero and one, and is precisely one when the CRS and VRS technologies coincide, that is when the firm is operating at the most productive scale size (see Figure 8).
Source: Ozcan (2014)21, Bogetoft and Otto (2010)22
Figure 7 – Most productive scale size
Figure 8 – Scale efficiency

24 Organisation of maternity services in Belgium KCE Report 323Cs
DEA applied to Belgian maternity services DEA measures of efficiency are based on estimates of the degree to which a DMU (the maternity service) could have produced more outputs for its input levels (output efficiency) or the degree to which it could have used less input for its output levels (input efficiency). The orientation (input versus output) in which we measure efficiency can have an impact on the results. The choice is mainly based on whether there is control over input or output levels. In this study, we want to find out whether the same level of activity (i.e. number of deliveries) could be realised with less inputs (staff, beds), which is a measure of input efficiency.
To measure the impact of a change in inputs on the change in outputs, we use two extreme assumptions: constant and variable returns to scale, which includes both decreasing and increasing returns to scale. The choice of returns to scale has an impact on the efficiency score. It can be demonstrated that the efficiency score in the CRS model is smaller than or equal to the efficiency score in the VRS model. Hence, less maternity services will have an efficiency score equal to 1 in the CRS model compared to the VRS model.
3.2.2. Data All analyses are performed at the level of a hospital site with a maternity service for the year 2016. Staff and beds are the inputs in the DEA model, outputs relate to clinical activity. Clinical activity and staff-related data concern the sum of all activity and working time taking place in M/MIC/AR/OB-units as well as in N*/NIC-units. The main reason for not distinguishing between maternity service units and neonatal care units are
the observed inconsistencies in staff data registrations. In particular, staff from the N*-unit is for some maternity services recorded in the N*-unit, but for other services in the M/MIC/AR/OB-unit or in the NIC-unit, which makes it impossible to correctly assign staff working time to the respective units. Similarly, care for newborns is registered across different units (see section 2.4.1).
Staff-related data only concern midwives, nurses, healthcare assistants, and support staff and not medical staff because no data were available on the working time for this professional group.
Staff working time Staff working time is registered in the personnel data in the MZG – RHM. In one file, called ‘EMPLODAY’, the number of hours and minutes worked is registered during four periods of the year: the first fifteen days of March, June, September and December. Since 2017, the registration is not mandatory anymore. Worked hours and minutes for staff members who actually provide nursing care or support are recorded. If a staff member is absent for a period of more than half a day (e.g. for training), his/her hours of work are not recorded. An absence of less than half a day (e.g. for a meeting) is recorded as working time. Hours worked by nurses and healthcare assistants in floating teams are also registered when this staff replaces or reinforces the nursing team of the care unit (i.e. not if they only perform punctual acts such as sample collection, ECG or social services). Working times are recoded by categories. Descriptive statistics are provided in Table 5. Data are aggregated by registration period.

O
KCE Report 323Cs Organisation of maternity services in Belgium 25
Table 5 – Daily staff registration: summary statistics (2016) Mean (sd) Period 1 Period 2 Period 3 Period 4 Average**
Number of hours worked over the period (15 days)
CAT1: Nurse or midwife with university degree 46.93 (91.9)
47.4 (84.8)
45.8 (92.8)
48.2 (91.3)
46.3 (86.4)
CAT2: Nurse or midwife with higher education degree 2 478.0 (1 978.9)
2 442.0 (1 996.3)
2 455.4 (1 950.8)
2 396.8 (1 894.2)
2 464.1 (1 943.4)
CAT3: Nurse with secondary education degree 32.0 (68.3)
31.0 (65.9)
30.3 (62.5)
28.3 (53.0)
29.9 (59.6)
CAT4: Healthcare assistants 61.1 (99.3)
54.1 (95.3)
55.9 (86.8)
53.3 (84.4)
55.1 (87.7)
CAT5: Support staff 108.2 (168.6)
102.6 (170.6)
98.5 (153.3)
98.0 (152.7)
106.3 (165.0)
CAT6: Students 242.8 (310.9)
134.6 (209.3)
56.0 (93.4)
221.9 (313.5)
162.5 (194.6)
N (number of maternity sites*) 108 106 106 106 109 Period 1: from 1 to 15 March 2016, Period 2: from 1 to 15 June 2016, Period 3: from 1 to 15 September 2016, Period 4: from 1 to 15 December 2016. * The number of maternity sites (109 in periods 1, 2 and 3; 108 in period 4) is reduced because daily staff registration for the maternity service is not available for 1 site in period 1, 3 sites in period 2, 3 sites in period 3 and 2 sites in period 4. **Average over the available periods.
Clinical activity The MZG – RHM also contain the clinical activity data (see section 1.3). These data are available on a daily basis, but we focus on the four periods of registration of daily staff data. Also clinical activity data are aggregated by registration period.
b For each period, stays that start within the period as well as stays starting
before the period with part of the stay occurring during the period are included.
Clinical activity for obstetric patients is measured by the number of staysb for five groups: vaginal deliveries, caesarean deliveries, other activity related to pregnancy (MDC 14B), activity in MDC 13 and activity in other MDCs. All stays for newborns are taken together in a sixth group. No distinction is made between inpatient and day-care stays.

26 Organisation of maternity services in Belgium KCE Report 323Cs
Number of beds Capital input is approximated by the number of licensed M/MIC-beds available in the maternity service during the period of interest. Note that the number of licensed M-beds may differ from the number of operational beds.
3.2.3. Can Belgian maternity services gain from economies of scale through expansion?
The efficiency score depends on the choice of inputs and outputs and of the type of returns to scale. Therefore, the robustness of the results of a base model is assessed by comparing its results with those of alternative model specifications. For the base model, we first describe the selected input and output variables (see Table 6). Next, we show the results for efficiency scores and the minimum efficient scale.
Selected input and output variables in the base model Staff categories CAT1 to CAT5 are taken as one group because the available data do not allow to assess whether different staff categories contribute differently to clinical activity. Hence, although we can assume that logistics or administrative assistants (CAT5), healthcare assistants (CAT4) and to a smaller extent nurses with secondary education degree (CAT3) do not contribute directly or less directly to clinical activity than midwives or nurses in CAT1 and CAT2, their number of hours worked cannot be linked directly to their ‘outputs’. Nurses and midwives with a higher education degree (CAT2) represent by far the largest group of staff within maternity services and therefore the input of this group will dominate the results of the analysis. Hours worked by students are not included because a priori it is
not clear whether students ‘produce’ or rather ‘consume’ resources (for teaching or monitoring) that is not translated into larger clinical activity.
Clinical activity in the base model is restricted to vaginal deliveries, caesarean deliveries, other activity related to pregnancy (MDC 14B) and activity related to newborns (mainly MDC 15). All stays are weighted by the national average length of stay to account for differences in case mix between maternity services. For obstetric patients, we exclude activity outside MDC 14 in the base model because the magnitude and composition of this activity is very heterogeneous among maternity services and is likely to depend on organisational choices within the hospitals. It is not clear whether these activities require the same type and quantity of resources as activities related to pregnancy or newborns. Including this extra activity in the base model could lead to underestimating (technical) efficiency scores for maternity sites that focus their activities on pregnancy, delivery and care of the newborns. Nevertheless, we verify the impact of omitting this part of the activity in a subsequent model (see further).
For each maternity site, information for each of the periods for daily staff records, number of maternity beds and clinical activity is averaged over the available periods (four for most of the maternity sites, less for maternity sites that either closed or opened in 2016, or did not provide daily staff records for some periods). Table 6 shows summary statistics (over the 109 maternity sites) of the variables used in the base model.

O
KCE Report 323Cs Organisation of maternity services in Belgium 27
Table 6 – Variables in the base DEA model Average over the available periods* By maternity site (N=109)
Mean Standard deviation Minimum Maximum Number of hours worked (CAT1, CAT2, CAT3, CAT4 and CAT5) 2 701.7 2 187.6 591.5 11 166.1 Number of licensed M-beds (including MIC-beds) 28.6 16.1 10.0 105.0 Number of vaginal deliveries** 151.8 103.8 15.6 509.2 Number of caesarean deliveries** 67.7 53.2 4.8 272.4 Number of stays in MDC 14B** 26.5 18.0 2.9 92.7 Number of newborn stays** 370.0 449.0 24.0 2 218.0
* For most of the maternity sites, data are available for 4 periods. In some cases, less periods are available because the maternity site either closed or opened in 2016, or did not provide daily staff records for some periods. ** Inpatient and day-care stays, weighted by average length of stay per APR-DRG-SOI
Efficiency scores: some maternity services are more successful in converting inputs to outputs than others The mean overall, technical and scale efficiency scores of the base DEA model are equal to 0.77, 0.88 and 0.87 respectively (see Table 7). The mean value of the technical efficiency score (0.88) means that, on average, 12% of the resources could be saved. About one third of the sample (36/109) is technically efficient. However, this does not imply that these maternity sites are overall efficient, as under- and over-sized services are not scale efficient. Indeed, on average, the input of resources could be reduced by 23% to reach overall efficiency, as shown by the mean overall efficiency score (0.77).
The mean scale inefficiency level is 13%. However, 12 maternity sites experience constant returns to scale (scale efficiency score equal to 1) and are considered scale efficient. Actually most sites are close to the constant returns to scale frontier (median of scale efficiency score is 0.89, third quartile is 0.97, not far from 1), but some are further from this frontier (minimum scale efficiency score is 0.44).
Table 7 – Efficiency score in the base DEA model Overall
efficiency score (ECRS)
Technical efficiency score
(EVRS)
Scale efficiency score
(SE=ECRS/EVRS)
Mean 0.77 0.88 0.87 Standard deviation
0.16 0.12 0.13
Minimum 0.37 0.46 0.44 Q1 0.66 0.79 0.81 Median 0.79 0.91 0.89 Q3 0.87 1 0.97 Maximum 1 1 1 Number of efficient units (score=1)
12 36 12
N=109.

28 Organisation of maternity services in Belgium KCE Report 323Cs
About 23% of maternity services do not reach the minimum efficient scale Figure 9 shows the scale efficiency score of each maternity site with maternity sites ranked from the smallest to largest, in terms of annual number of deliveries. In line with economic theory (see also Box 5), Figure 9 presents an inverse U-shape with increasing returns to scale for small services, constant returns to scale for middle-sized services, and decreasing returns to scale for the largest services, although the conclusion regarding
the latter group should be interpreted with caution as very few maternity services in Belgium operate at such large scale.
The minimum efficient scale is 557 deliveries. This corresponds to the smallest maternity site – in terms of the number of deliveries – that has constant returns to scale, i.e. with a scale efficiency score equal to 1. Amongst the 25 out of 109 maternity sites with less than 557 deliveries in 2016, the average scale efficiency score is 0.72, while it is 0.92 on average for maternity sites with 557 or more deliveries in 2016 (see Table 8).
Figure 9 – Base DEA model: scale efficiency scores
Each dot represents an observation (a maternity site). The red line represents a Gaussian Kernel smoothing (see the legend to Figure 24 in the scientific report for more details) and the black dashed lines represent the upper and lower bound of a 95% confidence interval.

O
KCE Report 323Cs Organisation of maternity services in Belgium 29
Table 8 – Minimum efficient scale Minimum efficiency scale and score measures
Minimum efficient scale (annual number of deliveries) 557 Number of maternity sites with scale efficiency score < 1 97 Number of maternity sites smaller than the minimum efficient scale (in terms of annual number of deliveries) 25
Average scale efficiency score for maternity sites smaller than the minimum efficient scale 0.72
Average scale efficiency score for maternity sites larger than or equal to the minimum efficient scale 0.92
N=109
Maternity sites with more than 557 deliveries per year still can obtain economies of scale Above the minimum efficient scale of 557 deliveries, a significant number of maternity sites still has a relatively low scale efficiency score and economies of scale can be achieved. When summarizing the scale efficiency score of maternity sites in shifting ranges of 500 deliveries, we observe an increasing average scale efficiency score up to the range of 900-1 400 deliveries where it stabilizes at 0.95. The opposite evolution holds for the variability (coefficient of variation) of the scores (Figure 10).
The percentage of maternity sites with a high scale efficiency score (above 0.80, 0.90 or 0.95) also increases as the range of annual deliveries increases (see Figure 11). In the group of maternity sites with 400 to 900 deliveries per year, only 15% (resp. 23% and 69%) have a scale efficiency score above 0.95 (resp. 0.90 and 0.80). This proportion is 64% (resp. 84% and 96%) for the group of maternity sites performing 900 to 1 400 deliveries per year. Figure 11 shows that the proportion of maternity sites with a scale efficiency score above 0.80 (resp. 0.90) starts stabilising in the range of 700-1 200 (resp. 1 100-1 600) deliveries per year. The maximum proportion of maternity sites with a scale efficiency score above 0.95 is found in maternity sites with 1 200-1 700 deliveries per year.
Therefore, although the minimum efficient scale is 557 in the base model, maternity sites may still benefit from large economies of scale by increasing their scale above this threshold, at least up to 900-1 000 deliveries per year.
Figure 10 – Scale efficiency score: average and coefficient of variation for groups of maternity sites according to the annual number of deliveries
The coefficient of variation for the scale efficiency score is defined as the ratio between standard deviation and mean.

30 Organisation of maternity services in Belgium KCE Report 323Cs
Figure 11 – Percentage of maternity sites with high scale efficiency scores for groups of maternity sites according to the annual number of deliveries
SE= scale efficiency score.
Results are robust to model specification As mentioned before, DEA is a non-parametric technique. One of the main drawbacks of such approach is that efficient scores might be contaminated by omitted variables or measurement errors of inputs and outputs. There are no parametric tests to check the validity of the model. Therefore, to determine the robustness of the efficiency scores, the sensitivity of results to specification changes is assessed. These specification changes relate to both the definition of input (staff and beds) and output (clinical activity) variables and the selection of maternity sites. A total of 11 alternative DEA models were developed by altering the original DEA model specifications. These alternative models involve:
• The exclusion of licensed beds (model 1)
• The selection of staff categories (CAT1-CAT2 in model 2; CAT1-CAT3 in model 3)
• The definition of clinical activity (inpatient stays only in model 4; + stays in MDC 13 in model 5; + stays in all MDCs in model 6; alternative weight for case mix in model 7; unweighted stays in model 8)
• The selection of units (only obstetric stays in M/MIC/AR/OB-units in model 9)
• The selection of maternity sites (exclusion of sites with MIC- or NIC-beds in model 10; exclusion of sites with a large share of clinical activity outside MDC 14 in model 11).
Descriptive statistics and results for efficiency scores and the minimum efficient scale in the alternative models can be found in section 3.2.5 of the scientific report. The minimum efficient scale is invariant to the model specification, except for models 5 (446 deliveries), 6 (453 deliveries) and 9 (612 deliveries).
Compared to the base model, more outputs are included for the same staff level in models 5 and 6. For maternity sites that have a large part of their activity outside MDC 14 and newborns, it is likely that part of the resources (staff) accounted for in the base model are dedicated to activity that is not accounted for in the base model. Including this extra activity in the alternative models increases the scale efficiency score for some maternity sites. Hence the smallest maternity site that is scale efficient is situated at the left of the one of the base model. However, the results of models 5 and 6 should be interpreted with caution. In model 11 (subset of maternity sites with no extreme share of clinical activity outside MDC 14) the minimum efficient scale is 557 deliveries per year, as in the base model. This indicates that results of model 5 and 6 are driven by a few outliers (i.e. with a particularly large share of clinical activity outside MDC 14) that may not be representative of other maternity sites in Belgium.

O
KCE Report 323Cs Organisation of maternity services in Belgium 31
When the DEA model is restricted to maternity care (model 9 – excluding neonatal care), the minimum efficient scale is larger (612 deliveries per year instead of 557 in the base model) but one must keep in mind that inconsistencies in the staff and clinical activity data may bias the results.
3.2.4. Do efficiency scores depend on specific characteristics of maternity sites?
Two-stage analysis In most applications of DEA, the DEA methodology follows a two-stage analysis. The first stage involves the measurement of relative efficiency scores, as described in section 3.2.3. However, factors that are not inputs to the production process might also influence the efficiency of a maternity service. These factors are called contextual or environmental variables. For example, in none of the models MIC-beds are a separate input variable. However, it could be that the presence or not of MIC-beds has an impact on efficiency scores. Therefore, in a second stage the efficiency scores from the DEA model are regressed on selected contextual variables to measure the impact characteristics of maternity services that are not included in the initial DEA model. These contextual variables are assumed to be outside the control of the maternity service.
Selection of contextual variables In most studies either ordinary least squares (OLS) or Tobit regression is used in the second stage. We applied a Tobit model (see Box 11 in the scientific report), which is the most common approach used in literature. Table 9 provides an overview of the selected contextual variables. The selection is based on the availability of data and expert opinion from midwife staff in Belgian maternity services.
Table 9 – Second stage analysis: explanatory variables in the Tobit model
Explanatory variables
University hospital (N) 7
Presence of MIC-beds (N) 18
Score (x100) for B8-budget for patients with a low socioeconomic status* (mean (sd))
9.6 (3.0)
B8-budget for intercultural mediation and communication* (N) 30
‘Baby Friendly Hospital Initiative’ label (N) 24
Percentage of vaginal deliveries with epidural injection (mean (sd))
66.2 (12.7)
N=109. *N=107 (missing data for 2 maternity sites)
Apart from variables identifying university hospitals and maternity services with MIC-beds, other variables need some further explanation. Because of low socioeconomic status (that translates into a more extensive use of the social services of the hospital and a longer length of stay because of lack of support at home), some patients require a higher use of resources that is not accounted for in the APR-DRG system. Maternity sites with a larger share of such patients could appear as technically inefficient in the DEA analysis. To take this into account, we use data from the B8-part of the Belgian hospital budget, which is a closed budget distributed among hospitals according to the socioeconomic status of patients. The B8-part also distributes a separate budget to take account of specific language problems or cultural characteristics of patients. These variables are of course only a crude proxy of the socioeconomic status of patients in a maternity service because the socioeconomic status of patients for the hospital as a whole might diverge from the socioeconomic patient profile of the maternity service in particular. In that case, the above proxies do not capture the specific socioeconomic profile and corresponding input of resources of the maternity service. There is, however, no other measure available in routinely registered data.

32 Organisation of maternity services in Belgium KCE Report 323Cs
As breastfeeding counselling during the postpartum period is an activity that may be time consuming for the midwives, maternity sites that put more effort in this activity (that is not registered per se in the clinical activity as we measured it here) may appear to be less (technically) efficient. No reliable data are available on the breastfeeding rate by maternity site. However, since 2008, maternity services can receive a label ’Baby Friendly Hospital Initiative’ if their breastfeeding encouragement policy fulfils certain conditions.23 We use this label as a proxy to measure the efforts and resources a maternity site dedicates to encourage breastfeeding.
In the DEA model, no distinction is made between vaginal deliveries with or without epidural injection. The effect of providing an epidural injection is however not clear a priori. It may be argued that providing care during labour and delivery to a woman who did not receive an epidural injection is more time consuming for the midwives and nurses. On the other hand, postpartum care is likely to require more resources when the delivery has taken place under epidural anaesthesia. If the former effect dominates, maternity sites where a larger proportion of deliveries take place without epidural injection may appear less (technically) efficient. If the latter effect dominates, the technical efficiency scores would be overestimated for these maternity sites.
Sections 4.4.3.1 and 4.4.3.2 in the scientific report give the results of univariate analyses that study the impact of each selected variable on efficiency scores in the base DEA model. Here we only report the results of the multivariate analysis (Tobit model).
Specific characteristics of maternity services have an impact on overall and technical efficiency but not on scale efficiency Results from the Tobit regression models are presented in Table 10. The dependent variable is the efficiency score (overall efficiency score ECRS, technical efficiency score EVRS or scale efficiency score SE) obtained from the base DEA model. We are mainly interested in results concerning scale efficiency, but present technical and overall efficiencies for completeness. A first group of variables are pure contextual variables, namely the type of hospital (university or not) and the presence or not of MIC-beds. Although the results must be interpreted with caution due to the small number of observations, university hospitals tend to have a larger technical (and
overall) efficiency score than the other hospitals but are not different regarding scale efficiency. Maternity sites with MIC-beds also tend to have a larger technical efficiency score but do not present differences with other maternity sites for the overall efficiency score.
A second group of variables are related to the socioeconomic patient profile of the hospital. Maternity sites belonging to a hospital that receives a B8-budget for intercultural mediation and communication have a significantly lower technical efficiency score, although the effect is not strong enough to significantly reduce overall efficiency. Socioeconomic context, as measured here, does not have a significant impact on the efficiency scores.
A last group of variables represent clinical activity that is not measured by the APR-DRG classification. One may expect the ’Baby Friendly Hospital Initiative‘ label to have a negative impact on efficiency scores, as breastfeeding counselling takes time, but the results show no impact. An explanation might be that all maternity services are now involved in breastfeeding encouragement policy and the label is not a distinguishing measure to assess the additional resources required by these policies. A higher percentage of epidural injections has a negative impact on the technical efficiency score. However, this impact is not strong enough to translate into a significantly different overall efficiency score.

O
KCE Report 323Cs Organisation of maternity services in Belgium 33
Table 10 – Second stage analysis: results from the Tobit model Overall
efficiency score (ECRS)
Technical efficiency score
(EVRS)
Scale efficiency score
(SE=ECRS/EVRS)
University hospital
0.176** 0.226** 0.077
(0.080) (0.091) (0.065) MIC-beds 0.047 0.131** -0.032
(0.056) (0.053) (0.046) B8 score (socioeconomic)
0.011 0.808 -0.419
(0.596) (0.639) (0.485) B8 budget (intercultural)
-0.021 -0.079** 0.046
(0.043) (0.040) (0.035)
‘Baby Friendly’ label
0.030 -0.031 0.039
(0.042) (0.039) (0.034) Epidural injections
-0.192 -0.413*** 0.068
(0.135) (0.129) (0.110) Constant 0.885*** 1.107*** 0.856***
(0.106) (0.104) (0.086) Observations 107 107 107 Log Likelihood 23.210 8.124 44.098
Note: *p<0.1; **p<0.05; ***p<0.01. Standard errors are presented between parentheses.
None of the explanatory variables taken into account in the second stage of the DEA analysis has a significant impact on the scale efficiency score. From this we can conclude that the scale efficiency scores calculated in the base model are not over- or under-estimated for a particular group of maternity sites. The inverse U-shape relationship observed between scale efficiency score and size (measured by the annual number of deliveries) is not affected by the external factors included in the second stage.
4. GEOGRAPHIC ACCESSIBILITY OF MATERNITY SERVICES
4.1. Trade-off between efficiency and accessibility
What is a reasonable travel time to a maternity service? The previous chapter clearly demonstrated that for efficiency reasons small maternity services should close or increase their activity. This is pre-eminently the case for maternity services with less than 557 deliveries per year (which is the minimum efficient scale), but also for maternity services with less than 900-1 000 deliveries per year. Although the landscape of maternity services is dense in most areas in Belgium, in some parts maternity services are not in close proximity of other maternity services. Therefore, an assessment of the allocation of hospital services across the country should not only be based on efficiency arguments, but should certainly also take accessibility into account and it should be avoided that with the closure of maternity services travel time or travel distance becomes too long.
Although no firm conclusions can be drawn from the literature about the association between travel time or distance and patient outcomes (such as perinatal mortality), travel time or distance should be kept reasonable. There is, however, no existing guidance that states what a reasonable distance or travel time is. A travel time of 30 minutes has been used in previous analyses in several countries, including France, England and the Netherlands. In 2010 this threshold was not met in France for 22.7% of the deliveries while in the Netherlands in 2011 it was not met for 2.1% of the women between 15 and 45 year old.24, 25 In England 8% of the women of childbearing age have no obstetric unit within a 30 minute drive.26
Geographic access can be measured in either distance or travel time. Given the dense road network in Belgium, mainly but not only in large cities, a measure in terms of travel time was preferred. We used 30 minutes by car as time limit. However, because it was not possible to make a distinction between peak and off-peak hours, other time limits were used as well. This

34 Organisation of maternity services in Belgium KCE Report 323Cs
analysis was conducted in collaboration with the National Geographical Institute (NGI – IGN).
4.2. Geographic Information System to measure travel time to maternity services
The possibility to reach a maternity service within time is defined as the possibility for a woman between 15 and 49 years old to reach one or more maternity services within 30 minutes. We analysed this question with a Geographic Information System (GIS) in several steps (see Box 7).
The method can be explained in a non-technical way as follows. For each maternity service that was open in April 2019 (N=104), the area that allows to reach the maternity service within 30 minutes is defined, with car drive time based on TomTom data. Next, the Belgian territory is divided into grids of 1km² and for each grid and each maternity service, it is determined if the grid falls within the 30 minutes area. Some grids belong to the area of 1, 2 or more maternity services, while for others no mapping with an area is possible. In this last case, this would mean that the population (women of between 15 and 49 years old) of this grid has no access to a maternity service within 30 minutes.
We defined maternity services that are the only one reachable within 30 minutes in two ways:
• Strict: there is at least one grid cell (even with only 1 woman between 15 and 49 years old) that can reach only this maternity service.
• Threshold: there is at least one grid cell with a summed population of at least 21 women between 15 and 49 years old that can reach only this maternity service. We calculated ‘21’ as the ratio of women between 15 and 49 years old and the number of deliveries in 2016, estimating the average number of women for at least one delivery. The subsequent analysis is based on the results for the ‘threshold’ definition, which makes our results less prone to small population fluctuations over the years. However, determining this threshold is a policy decision as there is no hard criterion to guide such a choice.
Box 7 – Geographic Information System explained
A GIS is a computerised information system that allows for the capture, storage, manipulation, analysis, display and reporting of geographically referenced data. Although primarily applied for spatial analysis, a GIS also allows the analysis of temporal information. To analyse which maternity services can be reached within 30 minutes, the following steps were taken:
• Geocoding of 104 maternity services in April 2019 to the latitude and longitude of the official site address.
• Calculation of the area within an isochrone using the Network Analysis module of ArcGIS.27 This area comprises all streets or street segments around a maternity service that can reach the service within 30 minutes. Travel time is based on TomTom traffic data for cars for the last 2 years for a normal traffic situation in Belgium on an average weekday. Peak and off-peak moments are not separately available.
• Mapping of grid cells to isochrones. Grid cells subdivide Belgium geographically in cells with a certain resolution. For our analysis, the European Environment Agency (EEA) reference grid cell was used, which have a resolution of 1km². For each grid cell, the number of Belgian women between 15 and 49 years old in 2016 was available (Statbel data). For grid cells that are partly falling out the isochrones, two scenarios were developed:
o within area: the cell needs to be contained entirely within the area to count. In this definition, the number of women that can reach a maternity service within the time limit can be underestimated.
o intersects area: the cell needs to be contained entirely or partially within the area to count. In this definition, the number of women that can reach a maternity service within the time limit can be overestimated.

O
KCE Report 323Cs Organisation of maternity services in Belgium 35
• Calculation of the number of areas within an isochrone containing the grid cell for the following categories:
o No women between 15 and 49 years old and not contained in any of the areas within an isochrone.
o No women between 15 and 49 years old but contained in at least one area within an isochrone.
o A population of women between 15 and 49 years old but not contained in any of the areas within an isochrone.
o A population of women between 15 and 49 years old and contained in x areas within an isochrone (with x ≥ 1).
For each of these categories, we calculated the proportion of the population of women between 15 and 49 years old that fall into the category.
4.3. Almost all women of childbearing age have access to at least one maternity service within 30 minutes in the current landscape
Based on the 2016 population, 99.8% of women between 15 and 49 years old can reach one or more maternity services within 30 minutes, given normal traffic conditions (see Figure 12). The other 0.2% of women between 15 and 49 years live mostly near the border and in the south of the country (no information is available on women living in these areas actually traveling across the borders to deliver).
16 maternity services are the only service that can be reached within 30 minutes A large part of Flanders, Brussels and the northern part of Wallonia have access to eight or more maternity services within 30 minutes, given normal traffic conditions. 16 maternity services (15.4%) are the only service reachable within 30 minutes (1 service within 30’ in Figure 12). In total, 1.7% of the women between 15 and 49 years old live in areas where only one maternity service can be reached.

36 Organisation of maternity services in Belgium KCE Report 323Cs
Figure 12 – Maternity services reachable within 30 minutes
Intersects area definition; orange dots represent maternity services in April 2019

O
KCE Report 323Cs Organisation of maternity services in Belgium 37
4.4. Efficiency gains, accessibility and patient choice after a rationalisation of maternity services
According to the efficiency analysis in section 3, 25 maternity services had an activity level below the minimum efficient scale of 557 deliveries in 2016. The accessibility analysis applies to the 104 maternity services that were open in April 2019. From these, 21 maternity services had less than 557 deliveries in 2016 (from the initial 25 maternity services below the minimum efficient scale, three were closed, and one increased its activity above the minimum efficient scale after a merger with one of the closed sites).
For the remaining 21 maternity services with less than 557 deliveries, the activity can be transferred to larger services, except if they belong to the 16 maternity services that are the only service that can be reached within 30 minutes. In total, 17 maternity services are below the minimum efficient scale and are not the only service reachable within 30 minutes (red squares in Figure 13). These findings suggest that efficiency gains can be achieved by transferring activity from small to larger maternity services, without jeopardizing patient access.
A possible adverse implication of the provision of inpatient maternity care in a reduced number of services might be a reduction in the choice of birth location. For about half of the women between 15 and 49 years old (52.6%), nothing changes: they can reach the same (number of) maternity services as before. Hence, a second conclusion is that a reduction in the number of maternity services entails a reduction in choice for 47.4% of the women between 15 and 49 years old, but almost all of these still have the choice between at least 2 maternity services (see Figure 13).

38 Organisation of maternity services in Belgium KCE Report 323Cs
Figure 13 – Maternity services reachable within 30 minutes following scale efficiency
Intersects area definition; there is a transfer of activity following scale efficiency only for the red squares

O
KCE Report 323Cs Organisation of maternity services in Belgium 39
5. HOW MANY MATERNITY BEDS ARE NEEDED TO AVOID EXCESS CAPACITY AND GUARANTEE TIMELY ACCESS?
5.1. Queueing systems to determine the required bed capacity in Belgian maternity services
The central questions of section 5 can be stated as follows:
1. What is the need for maternity beds in Belgium given the trade-off between an efficient use of scarce resources and the needed timely access to appropriate care for obstetric patients?
2. If a reduction in the number of maternity services currently operating would be pursued to increase the efficiency without affecting the ability to reach a maternity service within a certain time, would it be possible to accommodate the activity in the remaining maternity services?
A challenge in hospital capacity planning is to reconcile health needs and available resources.1 Ideally, the societal goals of quality, efficiency and accessibility are realised as much as possible in hospital capacity planning. However, different judgements and methodologies exist for the assessment of how many beds are needed to avoid excess or shortage in capacity and guarantee timely access. The focus in this section is on the evaluation of capacity needs for maternity beds and not on capacity needs for other resources. While other resources, such as operating theatres, delivery beds, operating theatres or staff, may act as a bottleneck and effectively hinder timely access to care,28 there is insufficient information to evaluate them in a reliable way.
Capacity planning based on target occupancy rates does not guarantee timely access to a maternity bed Hospital capacity decisions traditionally have been made based on target occupancy levels. From the analysis in section 2.3.2 we know that the occupancy rate for most maternity services in Belgium is (very) low for most days of the year. From this we might conclude that the number of maternity beds could be reduced to a number that coincides with a specific, higher occupancy rate. For example, when we compare the target occupancy rate of maternity services that is applied in the calculation of the hospital budget (70%) with actual occupancy rates, then only 9 of the 110 maternity services had an annual occupancy rate of 70% or more in 2016, suggesting an important excess capacity. One important caveat in this comparison is that we use licensed beds because hospitals are not obliged to register the number of operational beds.
Although reducing excess capacity is necessary to enhance efficiency, insufficient bed capacity and delays in access to maternity care should be avoided. Hence, in addition to reducing a waste of resources, also timely access should be taken into account in an assessment of the necessary bed capacity. We can draw a number of lessons from the literature on patient flow. First, there is an important association between capacity (e.g. number of beds), occupancy rate and the probability of delay for a resource. This means that maternity services with lower activity and capacity need to work at a lower occupancy rate compared to services with a larger activity and capacity while attaining the same levels of delay in order to cope with the inherent variability in demand. There are economies of scale in the use of resources and applying one occupancy rate irrespective of the bed capacity can lead to undesirable levels of access for patients.29, 30 Second, a larger variability in the number of patients that can arrive on a given day and in their length of stay, necessitates more capacity to achieve the same level of timely access.31 Third, at ‘high’ occupancy rates even small increases in demand can disturb the normal functioning of a maternity service and lead to important delays.31

40 Organisation of maternity services in Belgium KCE Report 323Cs
5.1.1. Patient flow and queues
Queueing analysis as a tool for hospital capacity planning An alternative approach to capacity planning is based on queueing systems. Queueing theory is the mathematical theory of waiting lines, or queues. A queueing system makes explicit the trade-off between an efficient allocation and use of resources (bed, staff, and/or equipment) and the timely access to these resources.32 Queueing theory provides a methodology to calculate the necessary capacity and corresponding occupancy rate satisfying a chosen performance indicator for timely access. Queueing theory has been applied extensively for hospital care and is particularly useful to model patient flow. Patient flow models are used to identify appropriate levels of staff, beds, rooms and equipment as well as guide decisions on resource allocations in existing and new healthcare services.
Most research on patient flow in maternity services is focused on one specific hospital.28, 29, 33-42 The paper closest to our research objective – Green and Liu (2015) –, however, takes a public health perspective and studies the need for beds in maternity services across New York City in relation to timely access.33 More specifically, for each maternity service, queueing theory is used to determine the minimum number of beds required that guarantees that no more than 5% of the patients encounter a delay to access a maternity bed (irrespective of the waiting time).
Building blocks of a queueing system All queueing systems follow the same process (see Figure 14): customers arrive (to request a service), wait (in the queue if necessary) for a server to become available to provide the required service, and then leave.43 The customer is the person or thing that waits for a service; in our setting it is an obstetric patient admitted in the maternity service. The server is the person or the thing providing the service; in our setting the server is a maternity bed (and the care received while occupying the bed). The queue is the group of customers waiting to be served; in our setting these are obstetric patients in the maternity service for whom no bed is available at the time of admission (baseline scenario, see below) or at the time of delivery (alternative scenario, see below). The service time is in our setting the length of stay in
a maternity bed. More detailed information on queueing systems can be found in Box 11 in the scientific report.
Figure 14 – Queueing system applied to maternity setting
Modelling method We use a discrete event simulation (DES) model to recreate the patient flow of obstetric patients and model their use of inpatient services in each of the Belgian maternity services and solve the corresponding queueing system. Section 6.2.1.2 in the scientific report compares the DES model with a queueing analytic approach and motivates the choice for the DES model.
Data from the Minimal Hospital Data (MZG – RHM) for 2016 are used both to build as well as to validate the model.
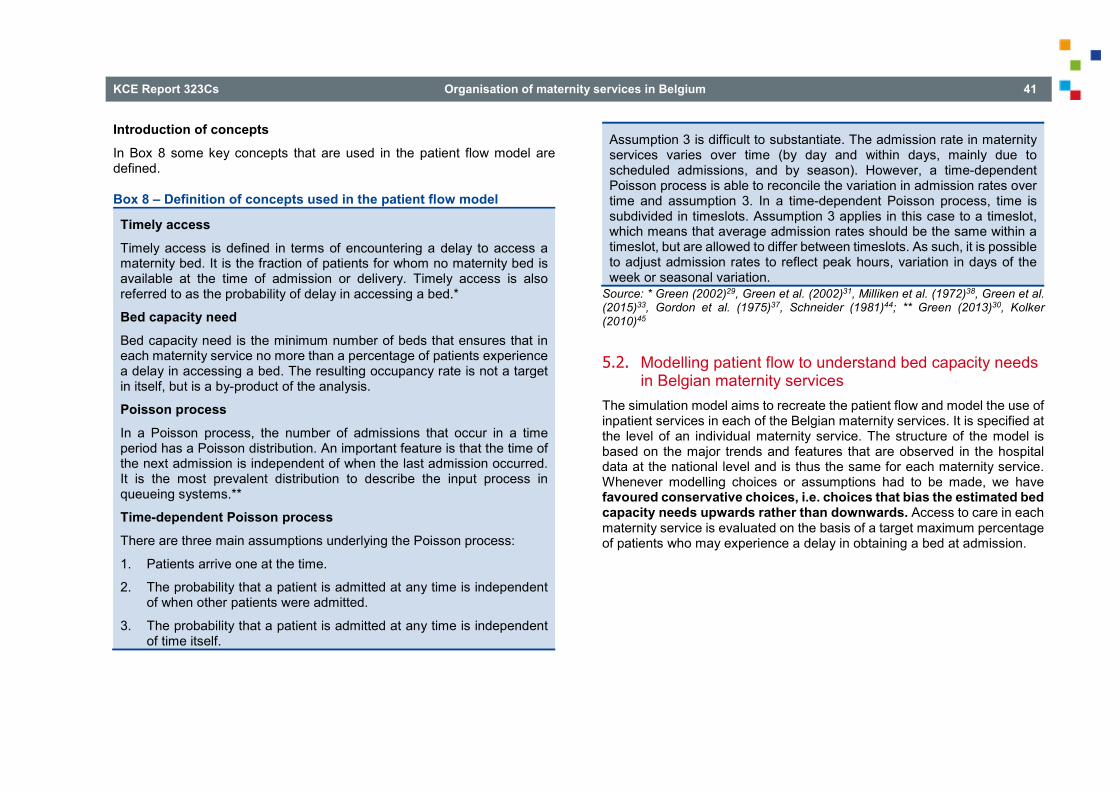
O
KCE Report 323Cs Organisation of maternity services in Belgium 41
Introduction of concepts In Box 8 some key concepts that are used in the patient flow model are defined.
Box 8 – Definition of concepts used in the patient flow model
Timely access Timely access is defined in terms of encountering a delay to access a maternity bed. It is the fraction of patients for whom no maternity bed is available at the time of admission or delivery. Timely access is also referred to as the probability of delay in accessing a bed.*
Bed capacity need Bed capacity need is the minimum number of beds that ensures that in each maternity service no more than a percentage of patients experience a delay in accessing a bed. The resulting occupancy rate is not a target in itself, but is a by-product of the analysis.
Poisson process In a Poisson process, the number of admissions that occur in a time period has a Poisson distribution. An important feature is that the time of the next admission is independent of when the last admission occurred. It is the most prevalent distribution to describe the input process in queueing systems.**
Time-dependent Poisson process There are three main assumptions underlying the Poisson process:
1. Patients arrive one at the time.
2. The probability that a patient is admitted at any time is independent of when other patients were admitted.
3. The probability that a patient is admitted at any time is independent of time itself.
Assumption 3 is difficult to substantiate. The admission rate in maternity services varies over time (by day and within days, mainly due to scheduled admissions, and by season). However, a time-dependent Poisson process is able to reconcile the variation in admission rates over time and assumption 3. In a time-dependent Poisson process, time is subdivided in timeslots. Assumption 3 applies in this case to a timeslot, which means that average admission rates should be the same within a timeslot, but are allowed to differ between timeslots. As such, it is possible to adjust admission rates to reflect peak hours, variation in days of the week or seasonal variation.
Source: * Green (2002)29, Green et al. (2002)31, Milliken et al. (1972)38, Green et al. (2015)33, Gordon et al. (1975)37, Schneider (1981)44; ** Green (2013)30, Kolker (2010)45
5.2. Modelling patient flow to understand bed capacity needs in Belgian maternity services
The simulation model aims to recreate the patient flow and model the use of inpatient services in each of the Belgian maternity services. It is specified at the level of an individual maternity service. The structure of the model is based on the major trends and features that are observed in the hospital data at the national level and is thus the same for each maternity service. Whenever modelling choices or assumptions had to be made, we have favoured conservative choices, i.e. choices that bias the estimated bed capacity needs upwards rather than downwards. Access to care in each maternity service is evaluated on the basis of a target maximum percentage of patients who may experience a delay in obtaining a bed at admission.

42 Organisation of maternity services in Belgium KCE Report 323Cs
The following modelling choices were made for the 108 maternity services (with 3 141c maternity beds) that were open in December 2016:
• Timely access: We use target values for the probability of delay of 1%, 5% and 10%, as found in the literature on capacity planning in maternity services.
• Bed capacity need: In the baseline scenario, a maternity bed is reserved for a new patient at admission, which results in an upper bound on bed capacity need because not every patient needs a postpartum bed at admission. In the alternative scenario a bed is reserved only post-delivery, which results in a lower bound on bed capacity need. In both scenarios, a bed is provided to patients in the queue based on the first-come first-served principle without priority between patient types.
The need for other resources than bed capacity, such as physicians, midwives, operating theatres, various types of equipment is out of scope. Also, the need for beds in the labour, delivery and operating units has not been studied mainly because they are not systematically registered.
Although the basic structure of the model (classification of days of the week, hours of the day, etc.) is the same for all maternity services, nearly all parameters that specify the admission process (section 5.2.1) or length of stay (section 5.2.2) are fitted at the level of the individual maternity service (see Table 11).
c This number includes all beds at the maternity services, irrespective of the
bed index.
Table 11 – Summary of patient flow model Structure of the model: defined at national level
Estimation of the parameters: at level of maternity service
Patient groups (3 groups)
Classification of days of the week (4 groups)
Admission rates per patient group, season, group of days of the week and period in a day.
Classification of periods in a day (maximum 5 groups)
Classification of seasons (2 groups)
Probability of delay computed for entire year and for summer separately, most stringent of both is used.
Decomposition of length of stay (3 parts: LOS on day of admission; LOS on day of discharge; and the number of days in between admission and discharge, with a main and tail distribution)
LOS per patient group day of the week, and period in a day. Main distribution is estimated at maternity level, tail distribution at the national level.
LOS = length of stay

O
KCE Report 323Cs Organisation of maternity services in Belgium 43
5.2.1. Admissions differ by patient group, by season, by day of the week and hour of the day
Admissions for each patient group in the maternity service occur according to a time-dependent Poisson process (see Box 8). The admission time is defined as the moment (minute) when the patient enters the maternity service for the first time. The admission time is used as a proxy for scheduled deliveries (planned caesarean deliveries and induced deliveries).
By patient group All inpatient activity for obstetric patients that (partly) passes through the maternity service is used to build the model; newborn patients, day-care and ambulatory activity are excluded. A distinction is made between three patient groups: vaginal deliveries, caesarean deliveries, and all other activity (in MDC 14 and in other MDCs).
Admission patterns differ between the three patient groups in number of admissions per day, over days of the week and within days. Also the fraction of scheduled admissions (planned caesarean deliveries and induced deliveries) differs by method of delivery.
By day of the week For all patient groups, Chi-square tests indicate significant differences in the number of daily admissions at the national level between four groups of days: Monday to Thursday (group 1); Friday and weekdays in school holidaysd (group 2); Saturday (group 3); Sunday and public holidayse (group 4). In the simulation model, separate admission rates are estimated (by maternity service) for each group of days.
Of course, the conclusions drawn at the national level might not apply to a specific maternity service, i.e. a maternity service can choose to plan all scheduled admissions on Tuesday and Thursday and therefore the
d School holidays do not include the summer holiday, which lasts two months,
because it is considered unrealistic to significantly alter the activity level through hospital policy for such an extensive period.
admission rates can be quite different between Monday and Wednesday on the one hand and Tuesday and Thursday on the other hand, the four days in group 1. While there may be organisational or other reasons for this admission policy, it is not necessarily optimal from a public health policy perspective, and hence, we have decided not to accommodate these differences, and adjust the model structure only to differences in admission patterns discernible at the national level.
By hour of the day From the differences in hourly admission rates, three conclusions are drawn. First, peak periods occur on weekdays, but not on weekend days, indicating that the peak in activity is caused by scheduled admissions. Second, there are two peak moments, in the morning (from 6h up to 10h) and at midnight (from 0h up to 1h). The morning peak applies to all patient groups, whereas the midnight peak is especially pronounced for vaginal deliveries and to a lesser extent for caesarean deliveries. Third, there is a drop in admissions for vaginal deliveries in the afternoon (10h up to 18h), after the morning peak. Based on these findings, a day can be subdivided in multiple periods (maximally 5) which accommodate intraday variation in admission rates.
Figure 15 illustrates the variability in hourly admission rates at the national level for vaginal deliveries for group of days 1 (Monday to Thursday) (panel a) and for caesarean deliveries for group of days 3 (Saturday) (panel b). Since the hourly admission rates on a Saturday for caesarean deliveries (panel b) are quite similar throughout the day, only one admission rate is estimated. For vaginal deliveries on Monday to Thursday the picture is completely different. Colours are used to depict five different periods (from midnight to 1h; from 1h to 6h; from 6h to 10h; from 10h to 18h; and from 18h to midnight). For each of these four intraday periods a separate maternity-specific admission rate is estimated.
e Public holidays include legal holidays and bridge days of the federal government as well as the days of Flemish, French and German communities.

44 Organisation of maternity services in Belgium KCE Report 323Cs
Figure 15 – Admissions per hour by activity type and type of day (a) Vaginal deliveries: number of admissions per hour from
Monday to Thursday (b) Caesarean deliveries: number of admissions per hour
Saturday
By season The summer (June to September) is a period of sustained higher activity in maternity services at the national level, which can affect occupancy rates, waiting time and probability of delay in an important way. The seasonal effect is accounted for in two ways. First, the admission rates are specified by season (summer or not).
Second, for each maternity service, a double calculation of the probability of delay is performed, once over the entire year and once limited to the summer months. The more stringent of both – i.e. the highest probability of delay – is used to evaluate timely access and compute the bed capacity need in the maternity service.

O
KCE Report 323Cs Organisation of maternity services in Belgium 45
5.2.2. Length of stay differs by maternity service, patient group and arrival time
The length of stay is defined as all time spent in the maternity service. The length of stay in the maternity service is extended in two cases. First, for caesarean deliveries, all time spent in the operating theatre and recovery room is added to the length of stay. Second, if an obstetric patient leaves the maternity service for another service and returns within 24 hours to the maternity service, it is assumed that her bed remains reserved within the maternity service and hence the time in the other services is added to the length of stay. For deliveries, the length of stay can be further subdivided in a pre-delivery time and post-delivery time.
In the baseline scenario, the time that a patient occupies a maternity bed equals the length of stay (LOS) throughout the maternity service. In the alternative scenario, it is assumed that patients who are admitted for a delivery, first spend some time in the labour and delivery unit or operating theatre. Hence, the time that a patient occupies a maternity bed equals the postpartum part of the LOS. On average women spend about 10 hours and 38 minutes in labour and delivery for a caesarean delivery, although the median is less than 7 hours (6h44m). The distribution is skewed, implying that an important fraction of caesarean deliveries remain only a short time in labour and delivery units or operating theatres, whereas other caesarean deliveries take more time. They might start as a vaginal delivery and the mode of delivery is switched in the process. Vaginal deliveries have a median (mean) time of about 10 hours and 4 minutes (11h50m) in labour and delivery units.
Decomposition of length of stay for a better fit with real discharge hour In its most simplified conceptualisation, the length of stay is the time between admission and discharge. However, the moment of discharge is not random, but is largely determined by hospital policy. The majority of maternity services have a peak in discharges at one particular (or a limited number of) hour(s) in the day. Moreover, the hour of admission and the hour of discharge appear to be driven independently from each other. To make the LOS more accurate and bed occupancy more in accordance with the observed activity, total LOS was decomposed in three parts: (i) LOS on the
day of admission (from the time of admission to midnight); (ii) LOS on the day of discharge (from midnight to the hour of discharge); and (iii) the days between admission and discharge (in what follows denominated ‘intermediary days’).
In the estimation of LOS, variability in LOS between patient groups (for example, caesarean deliveries have on average a longer length of stay than vaginal deliveries) and between maternity services (to reflect differences in case mix) is taken up in the model. Moreover, the distribution of intermediary days is skewed to the right for all three patient groups, meaning that there is a small group of patients with a long length of stay that form a long right tail in the distribution. Therefore, the distribution was split in the main distribution and the tail distribution. Given that in the baseline scenario a bed is assigned at admission while a maternity bed is not yet needed for a patient admitted for delivery, we do not additionally account for the bed turnover time, i.e. the time that is needed to make a bed available for the next patient after discharge. We assume that the bed turnover can be realised between admission and delivery.
5.2.3. Validation of the model A validation is performed to evaluate the functioning of the model and assess whether or not the DES model is able to generate simulation results that closely match the observed data. This is a necessary first step, before the model can be used to answer the research questions.
For each maternity service, the baseline model is run with the current capacity of maternity beds. The admission rates, LOS and discharge policy are defined at the maternity level using the observed activity in 2016. The average daily occupancy rate, the total number of arrivals by patient group, the average LOS by patient group and the average midnight census (a count of the number of inpatient obstetric patients present in the maternity service at midnight) are compared with actual observations. Also the simulated and observed distributions of the number of arrivals per day, the daily occupancy rate, the daily midnight census, the intermediary days and the discharge hour are compared.

46 Organisation of maternity services in Belgium KCE Report 323Cs
The results of the match between real-life values and simulated results can be found in section 6.3.2 and Figure 49 in the scientific report. Overall we can conclude that the validation of the model is satisfactory and that the DES model is able to simulate the activity in the Belgian maternity services.
5.3. Bed capacity needs and waiting time with the current number of maternity services
5.3.1. Association between bed capacity, occupancy rate and probability of delay
One of the key lessons of the literature on patient flow is that there is an important association between bed capacity, occupancy rate and probability of delay. This association invalidates the use of target occupancy rates to determine bed capacity needs. When a target value for timely access is used as main criterion to determine bed capacity needs, one needs to accept differences in occupancy rates which are a function of the number of beds. Larger maternity services can cope more efficiently with variability in demand than smaller ones and can therefore operate at higher occupancy rates.
The association is also found in this study and is visualised in Figure 16 for both the baseline scenario and the alternative scenario. Figure 16 shows the occupancy rate on the vertical axis, the bed capacity (number of licensed beds) on the horizontal axis and contour lines that have a constant probability of delay (from 1% to 10%). The grey dots indicate for each
maternity service the currently observed capacity (number of licensed beds) – occupancy rate combination.
When we keep the number of beds fixed (for example, we consider all maternity services with 20 licensed beds) and move along the vertical axis from low to high occupancy, the probability of delay increases (moves from 1% towards 10% curve). However, the distance between the contour lines decreases when occupancy rates increase. When we keep the occupancy rate fixed (for example at 70%) and increase the number of beds, it can be seen that larger maternity services can guarantee a lower probability of delay. Smaller maternity services operate at a higher risk of delay.
From the perspective of timely access, it might be in fact preferable not to operate at a 70% occupancy rate imposed on all maternity services. If for example both a target occupancy rate of at least 70% and a probability of delay of maximum 5% are combined, this would imply that the bed capacity should be at least 34 maternity beds in the baseline scenario (corresponding to about 2 000 deliveries per yearf) and 20 maternity beds in the alternative scenario (corresponding to about 1 000 deliveries per yearf).
Given our definition of daily occupancy rates (see Box 4), occupancy rates are the same in the baseline and alternative scenario. However, as bed use is different, timely access at a given capacity level differs from the baseline scenario. This explains the different association between bed capacity, occupancy rate and probability of delay in the baseline and alternative scenario. In the alternative scenario, the probability of delay is lower for a given number of beds because a maternity bed must not be available upon arrival but only post-delivery.
f The number of deliveries is determined by exploring the association between
number of deliveries, occupancy rate and probability of delay in a similar way as was done for bed capacity, occupancy rate and probability of delay.

O
KCE Report 323Cs Organisation of maternity services in Belgium 47
Figure 16 – Relation between occupancy rate and bed capacity of maternity services specified by probability of delay Baseline scenario Alternative scenario
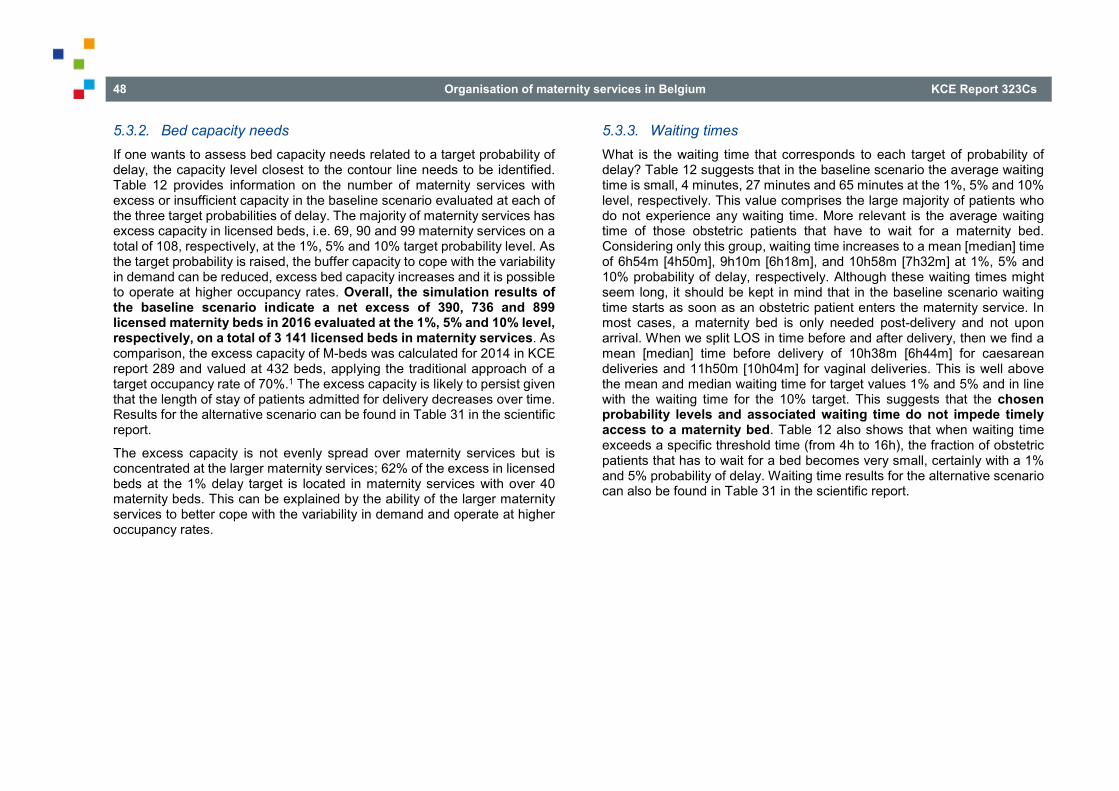
48 Organisation of maternity services in Belgium KCE Report 323Cs
5.3.2. Bed capacity needs If one wants to assess bed capacity needs related to a target probability of delay, the capacity level closest to the contour line needs to be identified. Table 12 provides information on the number of maternity services with excess or insufficient capacity in the baseline scenario evaluated at each of the three target probabilities of delay. The majority of maternity services has excess capacity in licensed beds, i.e. 69, 90 and 99 maternity services on a total of 108, respectively, at the 1%, 5% and 10% target probability level. As the target probability is raised, the buffer capacity to cope with the variability in demand can be reduced, excess bed capacity increases and it is possible to operate at higher occupancy rates. Overall, the simulation results of the baseline scenario indicate a net excess of 390, 736 and 899 licensed maternity beds in 2016 evaluated at the 1%, 5% and 10% level, respectively, on a total of 3 141 licensed beds in maternity services. As comparison, the excess capacity of M-beds was calculated for 2014 in KCE report 289 and valued at 432 beds, applying the traditional approach of a target occupancy rate of 70%.1 The excess capacity is likely to persist given that the length of stay of patients admitted for delivery decreases over time. Results for the alternative scenario can be found in Table 31 in the scientific report.
The excess capacity is not evenly spread over maternity services but is concentrated at the larger maternity services; 62% of the excess in licensed beds at the 1% delay target is located in maternity services with over 40 maternity beds. This can be explained by the ability of the larger maternity services to better cope with the variability in demand and operate at higher occupancy rates.
5.3.3. Waiting times What is the waiting time that corresponds to each target of probability of delay? Table 12 suggests that in the baseline scenario the average waiting time is small, 4 minutes, 27 minutes and 65 minutes at the 1%, 5% and 10% level, respectively. This value comprises the large majority of patients who do not experience any waiting time. More relevant is the average waiting time of those obstetric patients that have to wait for a maternity bed. Considering only this group, waiting time increases to a mean [median] time of 6h54m [4h50m], 9h10m [6h18m], and 10h58m [7h32m] at 1%, 5% and 10% probability of delay, respectively. Although these waiting times might seem long, it should be kept in mind that in the baseline scenario waiting time starts as soon as an obstetric patient enters the maternity service. In most cases, a maternity bed is only needed post-delivery and not upon arrival. When we split LOS in time before and after delivery, then we find a mean [median] time before delivery of 10h38m [6h44m] for caesarean deliveries and 11h50m [10h04m] for vaginal deliveries. This is well above the mean and median waiting time for target values 1% and 5% and in line with the waiting time for the 10% target. This suggests that the chosen probability levels and associated waiting time do not impede timely access to a maternity bed. Table 12 also shows that when waiting time exceeds a specific threshold time (from 4h to 16h), the fraction of obstetric patients that has to wait for a bed becomes very small, certainly with a 1% and 5% probability of delay. Waiting time results for the alternative scenario can also be found in Table 31 in the scientific report.
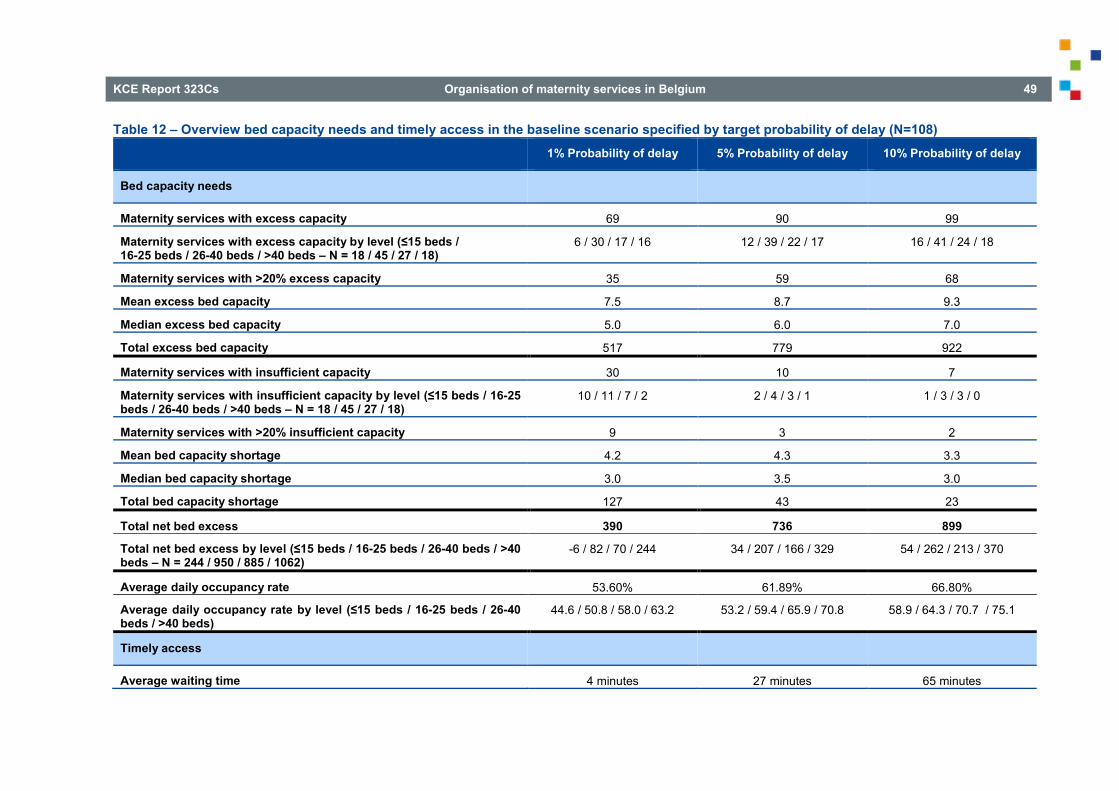
O
KCE Report 323Cs Organisation of maternity services in Belgium 49
Table 12 – Overview bed capacity needs and timely access in the baseline scenario specified by target probability of delay (N=108) 1% Probability of delay 5% Probability of delay 10% Probability of delay
Bed capacity needs
Maternity services with excess capacity 69 90 99
Maternity services with excess capacity by level (≤15 beds / 16-25 beds / 26-40 beds / >40 beds – N = 18 / 45 / 27 / 18)
6 / 30 / 17 / 16 12 / 39 / 22 / 17 16 / 41 / 24 / 18
Maternity services with >20% excess capacity 35 59 68
Mean excess bed capacity 7.5 8.7 9.3
Median excess bed capacity 5.0 6.0 7.0
Total excess bed capacity 517 779 922
Maternity services with insufficient capacity 30 10 7
Maternity services with insufficient capacity by level (≤15 beds / 16-25 beds / 26-40 beds / >40 beds – N = 18 / 45 / 27 / 18)
10 / 11 / 7 / 2 2 / 4 / 3 / 1 1 / 3 / 3 / 0
Maternity services with >20% insufficient capacity 9 3 2
Mean bed capacity shortage 4.2 4.3 3.3
Median bed capacity shortage 3.0 3.5 3.0
Total bed capacity shortage 127 43 23
Total net bed excess 390 736 899
Total net bed excess by level (≤15 beds / 16-25 beds / 26-40 beds / >40 beds – N = 244 / 950 / 885 / 1062)
-6 / 82 / 70 / 244 34 / 207 / 166 / 329 54 / 262 / 213 / 370
Average daily occupancy rate 53.60% 61.89% 66.80%
Average daily occupancy rate by level (≤15 beds / 16-25 beds / 26-40 beds / >40 beds)
44.6 / 50.8 / 58.0 / 63.2 53.2 / 59.4 / 65.9 / 70.8 58.9 / 64.3 / 70.7 / 75.1
Timely access
Average waiting time 4 minutes 27 minutes 65 minutes

50 Organisation of maternity services in Belgium KCE Report 323Cs
Average waiting time when waiting 6 hours 54 minutes 9 hours 10 minutes 10 hours 58 minutes
Median waiting time when waiting 4 hours 50 minutes 6 hours 18 minutes 7 hours 32 minutes
Probability of delay > 4h 0.56% 3.36% 7.17%
Probability of delay > 8h 0.28% 2.03% 4.73%
Probability of delay > 12h 0.17% 1.37% 3.38%
Probability of delay > 16h 0.09% 0.85% 2.28%
5.4. Impact of a rationalisation of maternity services on capacity needs and timely access
A scenario is developed for a reduction in the number of maternity services in Belgium, where maternity services with an activity level in 2016 below the minimum efficient scale (see section 3.2.3) and whose closure does not affect the number of women who can reach at least one maternity service within 30 minutes (see section 4.4), are closed. This concerns 17 maternity services (red squares in Figure 13).
In this scenario, the activity in the closed maternity services is transferred to other services. It is assessed whether or not the number of maternity beds in the remaining maternity services is sufficient to achieve timely access while absorbing the activity from the maternity services that are simulated to close. Moreover, we assess whether the closure of maternity services with activity levels below the minimum efficient scale allows for a further reduction in the required bed capacity while ensuring timely access, compared to the baseline scenario. Three target values for probability of delay are used (1%, 5%, and 10%) and the target has to be achieved in every remaining maternity service. The analysis is performed in two steps. First, the 2016 baseline scenario is updated to take into account closures and reorganisations of maternity services that occurred between January 2017 and April 2019 (for the results of this first step, we refer to section 6.3.4.1 in the scientific report). Then, starting from the updated 2019 baseline, we simulate the closure of 17 maternity services.
Section 6.3.4.1 in the scientific report gives a detailed description of the patient flow method to allocate activity from the 17 closed maternity services to the remaining maternity services. A short description is provided in Box 9. An important assumption of the patient flow model is that the reallocation of activity will follow the currently observed flow of obstetric patients. Of course, other criteria are possible, such as a transfer of (part of the) activity to the closest maternity service, to the closest maternity services within the same loco-regional network or the closest maternity service within the same hospital.
Box 9 – Patient flow algorithm explained
The objective of the patient flow algorithm is to generate a data-driven proposal for the reallocation of the activity in the closed maternity services to other maternity services. This is done using data for 2016 on all inpatient stays of obstetric patients in maternity services.
Market shares of maternity services in municipalities determine the reallocation of activity Each inpatient stay is assigned a patient group (caesarean delivery, vaginal delivery, other activity), a municipality (based on the zip code of the patient) and a maternity service. A distribution by patient group is made for each municipality, showing the number and fraction of admissions in the municipality that can be attributed to a particular maternity service. In the same way, for each maternity service, a

O
KCE Report 323Cs Organisation of maternity services in Belgium 51
distribution by patient group is made showing the number and fraction of admissions in the maternity service that can be attributed to a particular municipality.
It is possible that a combination of maternity service and municipality is infrequent. In order to limit the dispersion of activity over the entire country, two thresholds are imposed to the observed admissions and fractions: one to be included in the municipality distribution (minimum of 5 admissions or a fraction of 2.5%) and one to be included in the maternity service distribution (minimum of 10 admissions or a fraction of 5%). If the threshold is not met, the combination of municipality – maternity service is removed (set to 0). The fraction of admissions in the municipality and in the maternity service are scaled up proportionally so that the relevant sum equals 100%.
Based on the adjusted distributions, we calculate for each maternity service that is simulated to close, the number of admissions that come from each municipality and distribute these admissions among the maternity services which remain active within that municipality. The admissions within the municipality are allocated using the adjusted distribution of admissions in that municipality (but without the closed services) as distribution key.
Change in bed capacity needs when closing 17 maternity services When closing 17 maternity services and applying the patient flow algorithm to reallocate their activity to the remaining maternity services, 41 maternity services are projected to have an increase in activity. The reallocation is visualised in Figure 17. The left panel shows the expected additional number of deliveries, whereas the right panel shows the additional number of deliveries as a percentage of the number of deliveries already performed in the impacted maternity service. Figure 17 clearly shows that the closures as well as the reallocation of activity is concentrated in the provinces of West-
Flanders, Hainaut, Liège and East-Flanders. The reallocation in activity is substantial, with an average increase in the expected number of deliveries by 16.7% and a peak in activity growth up to 70%.
The simulation results indicate that an additional reduction of 76, 44 and 36 maternity beds is possible, evaluated at the 1%, 5% and 10% level, respectively. The net excess reflects two opposite effects: the excess of maternity beds in the closed services and the additional bed capacity required in the surrounding maternity services to accommodate the additional activity while ensuring timely access.
Out of the 41 impacted maternity services, the majority of services has sufficient or excess capacity to accommodate the additional activity at all target values. Nonetheless, 20 maternity services do not have sufficient bed capacity at the 1% target level. This number reduces to 10 and 9 maternity services at the 5% and 10% target level, respectively. At all target levels, the number of maternity services that are confronted with a shortage in maternity beds is doubled compared to the 2019 baseline results. This demonstrates that for a number of maternity services, there is currently not sufficient capacity to accommodate the increase in activity in the closure scenario. Other solutions will be needed, such as a redirection of the patient flow to other maternity services with excess capacity, a capacity expansion for a limited number maternity services, or an expansion of the activity in a number of smaller maternity services so that their activity level exceeds at least the minimum efficient scale.
The increase in activity and required bed capacity in the impacted maternity services contributes to an improvement of the occupancy rate by 1.2 to 1.7 percentage points. Moreover, mean [median] waiting time reduces by 30 to 40 [20] minutes.
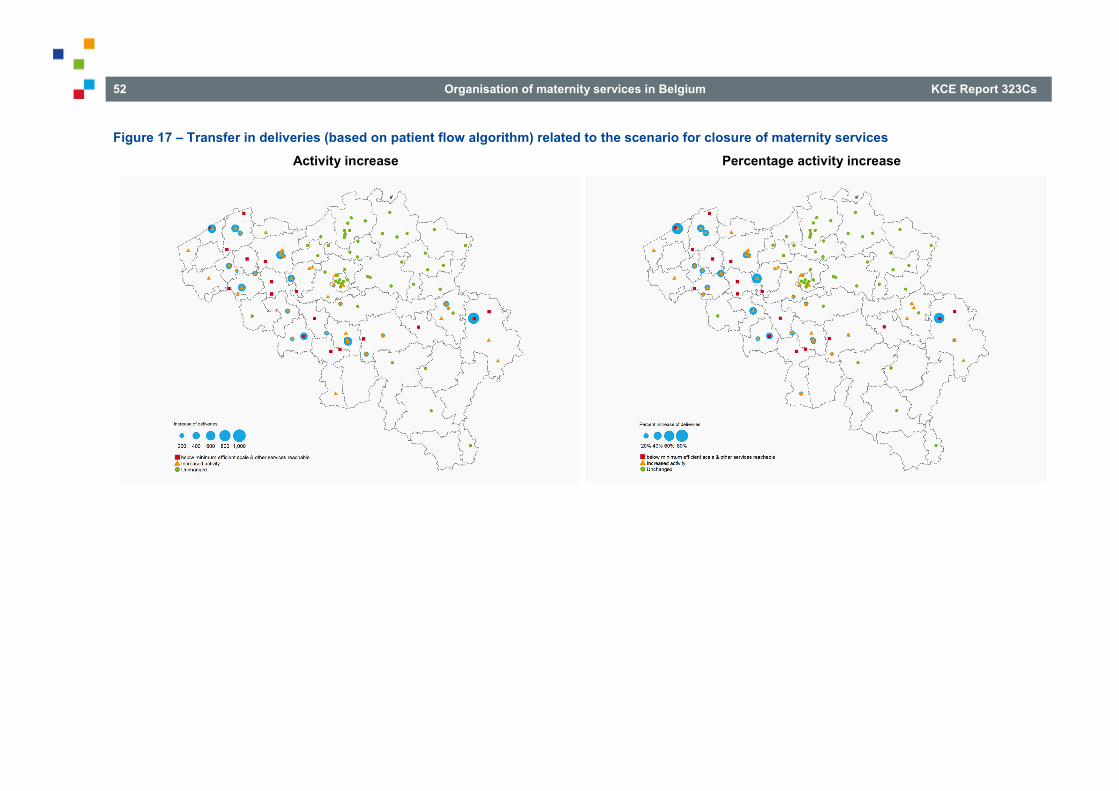
52 Organisation of maternity services in Belgium KCE Report 323Cs
Figure 17 – Transfer in deliveries (based on patient flow algorithm) related to the scenario for closure of maternity services Activity increase Percentage activity increase

O
KCE Report 323Cs Organisation of maternity services in Belgium 53
6. TOWARDS AN ACCESSIBLE GEOGRAPHIC ALLOCATION OF EFFICIENT MATERNITY SERVICES IN BELGIUM
Evidence-informed decision making should shape the number, size and location of maternity services As mentioned before, there is no commonly accepted list of criteria to classify hospital activities in terms of where they should be provided nor an optimal spread or mix of hospital services. Societal goals of increasing efficiency or reducing costs must be balanced against other goals such as ensuring timely (sufficient number of beds) and geographic (in terms of travel distance or time) access.
A transformation of the current organisation of maternity services in Belgium towards more efficiency while ensuring accessibility requires a careful analysis of the available evidence. Indeed, although there is not one optimal (re)configuration of services, reform decisions should be based as much as possible on reliable data, international good practice, literature and input from experts and stakeholders.
In the current report an attempt was made to make explicit the trade-offs between efficiency and access. There is no separate analysis dedicated to the objective of quality because for low-risk pregnancies and deliveries no evidence of a relation between the volume of activity and outcomes was found in the literature.1
Interdependencies between the maternity service and other services A maternity service is not an island within a hospital. A closure or scaling up of a maternity service impacts other services, such as paediatric services. However, the potential role of a paediatric service or another organisational form on a hospital site without a maternity service was beyond the scope of this study.
Both in the efficiency analysis and in the calculation of the required bed capacity to guarantee timely access, outpatient consultations of midwives are excluded due to different practices between hospitals. In some hospitals these consultations take place in the maternity service, in other hospitals in the outpatient clinic. An assessment of the activity (for inpatient and day-care admissions) that may or may not belong to a maternity service also fell outside the scope of this study.
6.1. Increase the minimum standard of 400 deliveries per year to achieve economies of scale
• In order to increase efficiency and achieve economies of scale, the current minimum standard of 400 deliveries per year per maternity service should be increased by the responsible public authorities. We calculated a minimum efficient scale of 557 deliveries per year.
• The license of maternity services that do not meet the new minimum standard should be withdrawn.
• Further efficiency gains are possible when the minimum scale is increased to at least 900 deliveries per year. Hospital networks should take this number into consideration when allocating care assignments to the individual hospitals of the network. Hospital networks should be financed for this reorganisation once they are operational.
Economies of scale are the main driver of reforms abroad … Despite differences in the organisation of maternity care between countries, the international trend is to increase volume to achieve economies of scale and improve efficiency. The concept of efficiency does not refer to the way an individual midwife, nurse, healthcare assistant, etc. organises his or her work, but is measured at the level of a maternity service. More specifically, the main objective was to assess whether the size of a maternity service, measured in terms of the number of deliveries, is related to the input of staff and infrastructure. In international terms, Belgian maternity services are small, whether size is measured in terms of beds or in terms of the number

54 Organisation of maternity services in Belgium KCE Report 323Cs
of deliveries. Also the literature on economies of scale in maternity services reports a minimum efficient scale which is above the current median number of deliveries in Belgium (i.e. 876 deliveries).
… and they are also found in Belgian maternity services The efficiency analysis has demonstrated that increasing the size of small maternity services allows realising economies of scale and increasing efficiency. The minimum efficient scale that was obtained from the analysis equals 557 deliveries. Hence, in maternity services with less than 557 deliveries per year average costs per delivery are higher compared to maternity services with more deliveries, because the fixed costs of staff and infrastructure (which have to be paid, irrespective of the level of activity) can be spread over fewer deliveries. This was the case for 25 (23%) maternity services in 2016.
Application of the minimum standard is necessary Multiple strategies are possible to achieve the threshold of 557 deliveries per year in all maternity services. One strategy is that all maternity services with less than 557 deliveries are closed. Another strategy is that some of these maternity services are closed, while others continue to be open but increase the number of deliveries by means of a transfer of activity from other services which will be closed or from larger maternity services in the same loco-regional network. In such case, the efficiency of the low-volume maternity services will improve. A drawback of this approach is that the efficiency of the larger maternity services might decrease due to a lower activity and hence larger average costs per delivery.
Therefore, only raising the minimum standard from 400 to 557 deliveries will not be sufficient for hospitals to give up their maternity service. Also now maternity services with less than 400 deliveries exist (and which do not meet the exception criteria). Hence, a reform aimed at achieving economies of scale will have to include the withdrawal of the license of maternity services with an insufficient number of deliveries. After all, public resources should be spent as efficiently as possible.
A rounding up or down of the number of deliveries in order to implement a minimum standard will change the number of maternity services that are above or below the minimum efficient scale. The number of deliveries could also be calculated as an average for a period of 2 or 3 years.
A further increase of the scale to at least 900 deliveries per year for maximum efficiency gains A considerable number of maternity services with more than 557 deliveries in 2016 have a low efficiency score. The proportion of maternity services with high efficiency scores, as well as the dispersion of scores, stabilise for a higher number of deliveries, at about 900 to 1 000 deliveries per year. This means that further economies of scale can be achieved when the minimum scale is increased to at least 900 deliveries. Hence, a strict interpretation of the results of the efficiency analysis implies a minimum standard of 557 deliveries per year, but a scale of at least 900 deliveries should be aimed at in hospital network negotiations. These negotiations can be started simultaneously with the adjustment of the minimum standard. Once the networks are operational, they should be financed for this reorganisation. The practical implementation of this financing depends on future financing modalities of the networks.
A hospital that closes its maternity service might also lose its license to operate as a hospital. Necessary conditions for a hospital are the presence of an internal medicine and surgical service, as well as another service such as a maternity service. A reform of maternity services should take this into account. The scenario that was analysed in this report, in which maternity services are closed, had no direct impact on the license of hospitals.
Diseconomies of scale are possible when maternity services become too large. Due to the limited number of (very) large maternity services it was not possible to determine at which number of deliveries diseconomies of scale would occur.

O
KCE Report 323Cs Organisation of maternity services in Belgium 55
6.2. Ensure a maximum coverage of maternity services across the territory
• A maximum travel time to the closest maternity service should be determined. The impact of a closure of maternity services on patient choice should be monitored on the basis of this maximum travel time. A travel time of 30 minutes is an arbitrary but safe limit, without a large restriction of patient choice.
• Maternity services that do not meet the minimum standard, but which are, according to the maximum travel time, the only accessible maternity service for a part of the population should not lose their license.
A closure of low-volume maternity services to increase efficiency may lead to a longer distance or travel time to the closest maternity service. Although no firm conclusions can be drawn from the literature about the association between distance or travel time and patient outcomes, travel times should be kept reasonable. Therefore, a travel time of 30 minutes by car places to a certain extent an arbitrary limit on proximity. It is, however, in accordance with the travel time limit used in studies in other countries, such as France, the Netherlands and England. Given the dense road network in Belgium, travel time is preferable to distance to evaluate accessibility.
Currently, travel time to the nearest maternity service is more than 30 minutes for 0.2% of women of childbearing age. 1.7% of women of childbearing age lives in areas where only one maternity service can be reached, 80% has access to 8 or more maternity services within 30 minutes, given normal traffic conditions. We have not investigated travel times with public transport.
Accessibility comes first and overrules efficiency arguments Ensuring an accessible provision of maternity services, with travel time within 30 minutes, might conflict with an efficient provision of these services. Of the 25 scale inefficient maternity services in 2016 (fewer than 557 deliveries), 21 were still active in 2019. It was found that for 4 of these 21 services, the 30 minutes limit could not be guaranteed anymore. For 17
maternity services, a closure would not result in a travel time of more than 30 minutes.
The importance of patient choice Patient choice is an important policy goal in many healthcare systems. However, reducing the number of maternity services might have an impact on patient choice of location of birth. The impact of the potential closure of 17 maternity services is limited. For 52.6% of women between 15 and 49 years old the current options remain possible. The majority of the remaining 47.4% still can choose between at least 2 maternity services, accessible within 30 minutes.
6.3. Analyse the absorption capacity of the remaining maternity services
• The absorption capacity of the maternity services in the neighbourhood of the maternity services with less deliveries than the minimum efficient scale should be analysed. Hospital networks should take account of the absorption capacity in case of a closure of maternity services in the own network or in adjacent networks when allocating care assignments.
When a maternity service is closed, women have to choose another maternity service. In this report we have assumed that this will be a maternity service in the neighbourhood. Of course, other options are possible, such as a maternity service further away that belongs to the same hospital. In any case, the activity of the remaining maternity services will increase. The maternity services close to the low-volume maternity services appear to have a considerable absorption capacity. Hence, there is room for expansion without major investment costs. In some cases the increase in activity can be considerable. Therefore, networks play an important role in taking account of the available and required absorption capacity when allocating care assignments to the hospitals in the network.

56 Organisation of maternity services in Belgium KCE Report 323Cs
An analysis of the required absorption capacity not only applies to beds in the maternity service, but also to beds in the labour and delivery room and to the number of operating rooms. However, this analysis was beyond the scope of this study.
6.4. Determine a bed delay target
• A target value for the probability of waiting for a bed on the maternity service should be determined and the required bed capacity of an individual maternity service should be based on this target value instead of on a target occupancy rate.
• Capacity planning at the level of the networks should be based on timely access to a bed instead of on a target occupancy rate.
• The assessment of bed capacity needs should be revised periodically and adjusted when necessary. For example, when a new minimum standard for the yearly number of deliveries is implemented, the absorption capacity of the remaining maternity services should be estimated to guarantee timely access. The simulation model that was developed in this study can be used to explore the impact on bed capacity needs of a closure of hospital services.
A difficulty of planning hospital services such as a maternity service is that the demand for resources is mainly unscheduled while timely care is important. We know from the literature and from the analysis of bed capacity needs in this report that maternity services with a smaller activity level and capacity need to work at a lower occupancy rate compared to larger services to realise the same levels of delay. Indeed, larger units can better deal with variability in demand than smaller ones and can therefore operate at higher occupancy rates. Combining timely access to a maternity bed and high occupancy rates (>70%) for an efficient use of resources is only possible in medium-sized and large maternity services. For example, for a maternity service with 900 deliveries per year 21, 19 and 17 beds are required respectively for a probability of delay of 1%, 5% and 10%.
The simulation model developed in this study is suited for bed capacity planning by hospitals as well as by public authorities. For example, in
Flanders the model could be used for the care strategic plans hospitals have to submit to receive investment subsidies or for the regional care strategic plans of the networks.
6.5. Create the necessary preconditions for a reform
6.5.1. Invest efficiency gains in the hospital sector
• Efficiency gains are achieved by closing smaller maternity services and by transferring their activities to larger maternity services. At the national level, the same number of deliveries can be achieved with less staff and beds. The cost savings that are realised in this way can be invested in higher nursing staff levels in other services.
• A shift of justified activity between maternity services has no impact on the hospital budget at the macro level. The scale increase can lead to a lower number of maternity services with less than 1 000 deliveries per year. The decrease in the number of points for the N*-function should be invested in the hospital sector by maintaining the hospital budget.
A maternity service with less than 1 000 deliveries per year receives 15 points for the N*-function and a maternity unit with at least 1 000 deliveries per year receives 17 points for the first 1 000 deliveries and an additional 3 points for every additional 150 deliveries. Closing maternity services with less deliveries than the minimum efficient scale will result at a macro level in a decrease in the number of points for all N*-services. The decrease in the number of points for the N*-function should be invested in the hospital sector by maintaining the hospital budget. This could be achieved, for example, by applying a higher point value to all hospital activity currently funded on the basis of justified activity.
An analysis of the financial impact for the maternity services, by comparing the operating costs of a maternity service with the revenue through the hospital budget or other sources of income, was beyond the scope of this study.

O
KCE Report 323Cs Organisation of maternity services in Belgium 57
6.5.2. Take accompanying measures for the staff
• The proposed reform of the maternity services has important implications for all staff. When a hospital closes its maternity service, this also has consequences for other services and staff members. Measures should be taken to re-employ the excess staff. However, an analysis of the social impact of such a reform was beyond the scope of this study.
Closing maternity services will inevitably be accompanied by a redundancy or reorientation of staff. Redeployment strategies for (mainly) midwives, nurses, support staff and doctors should be worked out by public authorities. A (limited) part of excess staff can be redeployed to the remaining maternity services in the neighbourhood, but additional efforts will be needed for a part of excess staff. Another measure for midwives could be, for example, an in-service training to become a nurse in order to be able to work in other hospital services with currently a shortage of nursing staff. In this way the number of patients per nurse can decrease.
For some midwives retraining to work as nurses in other hospital services will be necessary, certainly for midwives that recently graduated. Indeed, midwives graduated after 1 October 2018 are no longer allowed to provide nursing activities outside the areas specific to midwives. The number of students entering midwifery education programmes could be restricted and educational institutions could focus on bridging programmes for midwives to become a nurse.46
It is also likely that an expansion in the midwifery workforce will be needed in outpatient care settings, following a decrease in the hospital length of stay. Results from a horizon scanning exercise to build alternative scenarios for the forecasting of midwifery workforce show that a shift from salaried (in hospitals) to independent (or mixed-status) workforce is plausible, even in a model that remains hospital-centred. This enhanced autonomy inevitably requires a reinforcement and an extension of the training, so that midwives can acquire more skills in organisational and coordinating abilities.47
Accompanying measures are also needed for other professional groups. Closing a maternity service implies that the activity will also decrease for gynaecologists, paediatricians or anaesthesiologists, among others.
A possible revision of the licensing and financing standards for staff, for example due to a decrease in the length of stay and a possible increase in the intensity of care, was beyond the scope of this study.
6.5.3. Take accompanying measures for the costs of hospital infrastructure
• When a maternity service is closed, there are costs associated with the reallocation or temporary maintenance of the (empty) space. These costs should be taken into account in the financing system of hospital infrastructure by the federated authorities.
Closing a maternity service does not imply that costs are no longer incurred. Empty spaces must be maintained or can be reallocated to another service or function. As an accompanying measure, the financing system of hospital infrastructure of the federated authorities should (temporarily) finance these costs. The actual elaboration of this depends on the financing mechanism in the respective federated authorities. It is recommended to only finance those reallocations that currently fall within the scope of the infrastructure financing.
6.5.4. Re-activate the staffing registration in the MZG – RHM
• Evidence-informed decision making involves integrating the best available research evidence into decision making. The availability of up to date and accurate data is part of that research evidence. The daily staffing registration in the MZG – RHM (EMPLODAY), which was compulsory up to 2016, is an important source of information for efficiency analyses and allows policymakers to define and revise evidence-informed minimum activity standards. Therefore, this registration should be re-activated.
• In order to evaluate the efficient use of resources, such as hospital beds, operational beds as well as licensed beds should be registered by bed index in the MZG – RHM.

58 Organisation of maternity services in Belgium KCE Report 323Cs
■ REFERENCES
1. Van de Voorde C, Van den Heede K, Beguin C, Bouckaert N, Camberlin C, de Bekker P, et al. Required hospital capacity in 2025 and criteria for rationalisation of complex cancer surgery, radiotherapy and maternity services. Health Services Research (HSR). Brussel: Belgian Health Care Knowledge Centre (KCE); 2017 06/2017. KCE Reports 289 (D/2017/10.273/45) Available from: https://kce.fgov.be/sites/default/files/atoms/files/Download%20the%20report%20in%20English%20%28550%20p.%29.pdf
2. De Pourcq K, De Regge M, Callens S, Coëffé M, Gemmel P, Van den Heede K, et al. Governance models for hospital collaborations. Health Services Research (HSR). Brussels: Belgian Health Care Knowledge Centre (KCE); 2016 12/2016. KCE Reports 277 (D/2016/10.273/92) Available from: http://kce.fgov.be/sites/default/files/page_documents/KCE_277_Governance_models_hospital_collaborations_Report.pdf
3. Wet van 28 februari 2019 tot wijziging van de gecoördineerde wet van 10 juli 2008 op de ziekenhuizen en andere verzorgingsinrichtingen, wat de klinische netwerking tussen ziekenhuizen betreft, B.S. 28 maart 2019.
4. Minister van Sociale Zaken en Volksgezondheid. Klinische ziekenhuisnetwerken. Conceptnota in het kader van de ziekenhuishervorming. 2016.
5. Van Parys A-S, Lucet C, Remacle A, Di Zinno T, Verstraelen H, Mambourg F, et al. Maternal intensive Care in Belgium. Health Services Research (HSR). Brussels: Belgian Health Care Knowledge Centre (KCE); 2008 21/11/2008. KCE Reports 94 Available from: https://kce.fgov.be/publication/report/maternal-intensive-care-in-belgium
6. Devriese S, Van de Voorde C. Clustering pathology groups on hospital stay similarity. Health Services Research (HSR). Brussel: Belgian Health Care Knowledge Centre (KCE); 2016 06/2016. KCE Reports 270 (D/2016/10.273/62) Available from:

O
KCE Report 323Cs Organisation of maternity services in Belgium 59
http://kce.fgov.be/sites/default/files/page_documents/KCE_270C_Clustering_pathology_groups_Report.pdf
7. Averill R F, McCullough E C, Goldfield N, Hughes J S, Muldoon J, Bonazelli J, et al. 3MTM All Patient Refined Diagnosis Related Groups (APR DRG) Classification System, v34.0, Definitions Manual (volume 1). Wallingford, USA; 2016.
8. Koninklijk besluit van 21 januari 1998 tot wijziging van het koninklijk besluit van 30 januari 1989 houdende vaststelling van aanvullende normen voor de erkenning van ziekenhuizen en ziekenhuisdiensten alsmede tot nadere omschrijving van de ziekenhuisgroeperingen en van de bijzondere normen waaraan deze moeten voldoen, B.S. 7 maart 1998.
9. Koninklijk besluit van 20 augustus 1996 houdende vaststelling van de normen waaraan een functie van lokale neonatale zorg (N*-functie) moet voldoen om te worden erkend, B.S. 1 oktober 1996.
10. Koninklijk besluit van 2 april 2014 tot wijziging van het koninklijk besluit van 23 oktober 1964 tot bepaling van de normen die door de ziekenhuizen en hun diensten moeten worden nageleefd, B.S. 18 april 2014.
11. Koninklijk besluit van 20 augustus 1996 houdende vaststelling van de normen waaraan een functie van regionale perinatale zorg (P*-functie) moet voldoen om te worden erkend, B.S. 1 oktober 1996.
12. Gecoördineerde wet van 10 juli 2008 op de ziekenhuizen en andere verzorgingsinrichtingen, B.S. 7 november 2008.
13. Koninklijk besluit van 30 januari 1989 houdende vaststelling van aanvullende normen voor de erkenning van ziekenhuizen en ziekenhuisdiensten alsmede tot nadere omschrijving van de ziekenhuisgroeperingen en van de bijzondere normen waaraan deze moeten voldoen, B.S. 21 februari 1989.
14. Koninklijk besluit van 13 juli 2006 houdende vaststelling van de normen waaraan het zorgprogramma voor kinderen moet voldoen om erkend te worden en tot wijziging van het koninklijk besluit van 25 november 1997 houdende vaststelling van de normen waaraan
de functie "chirurgische daghospitalisatie" moet voldoen om te worden erkend, B.S. 16 augustus 2006.
15. Koninklijk besluit van 23 oktober 1964 tot bepaling van de normen die door de ziekenhuizen en hun diensten moeten worden nageleefd, B.S. 7 november 1964.
16. Koninklijk besluit van 21 maart 1977 tot vaststelling van de criteria die van toepassing zijn voor de programmatie van verschillende soorten ziekenhuisdiensten, B.S. 30 april 1977.
17. Centers for Medicare & Medicaid Services. Case Mix Index [Web page].Baltimore, USA [cited 10 February]. Available from: https://www.cms.gov/Medicare/Medicare-Fee-for-Service-Payment/AcuteInpatientPPS/Acute-Inpatient-Files-for-Download-Items/CMS022630.html
18. Pilootproject verkort verblijf op de materniteit [Web page].Brussels: FOD Volksgezondheid, veiligheid van de voedselketen en leefmilieu;2019 [cited 4 September 2019]. Available from: https://www.health.belgium.be/nl/news/pilootproject-verkort-verblijf-op-de-materniteit
19. Devos C, Cordon A, Lefèvre M, Obyn C, Renard F, Bouckaert N, et al. Performance of the Belgian health system – Report 2019. Health Services Research (HSR). Brussels: Belgian Health Care Knowledge Centre (KCE); 2019 04/2019. KCE Reports 313 Available from: https://kce.fgov.be/sites/default/files/atoms/files/KCE_313C_Performance_Belgian_health_system_Report.pdf
20. Giancotti M, Guglielmo A, Mauro M. Efficiency and optimal size of hospitals: Results of a systematic search. PloS one. 2017;12(3):e0174533.
21. Ozcan YA. Health Care Benchmarking and Performance Evaluation. International Series in Operations Research and Management Science. 2014.
22. Bogetoft P, Otto L. Benchmarking with DEA, SFA, and R, Springer Science & Business Media. 2010;157.

60 Organisation of maternity services in Belgium KCE Report 323Cs
23. Guide pratique pour la mise en œuvre des critères de l’IHAB et l’obtention du label. SPF Santé publique, Sécurité de la Chaîne alimentaire et Environnement; 2017. Available from: https://www.health.belgium.be/sites/default/files/uploads/fields/fpshealth_theme_file/2017_-_ihab_-_guide_pratique_last_version.pdf
24. Baillot A, Evain F. Les maternités: un temps d’accès stable malgré les fermetures. DREES Etudes et Résultats. 2012(814).
25. Rijksinstituut voor Volksgezondheid en Milieu. Zorgbalans 2014. De prestaties van de Nederlandse gezondheidszorg. RIVM; 2014. 2014-0038
26. National Audit Office. Maternity services in England. 2013.
27. ESRI. ArcGIS Service Area Analysis. 2019.
28. Allios M, Cozzi E, McBride T, Palmer W. Modelling of maternity services in England. London: National Audit Office; 2014. Available from: https://www.nao.org.uk/wp-content/uploads/2013/11/Modelling-of-maternity-services-in-England.pdf
29. Green LV. How many hospital beds? Inquiry. 2002;39(4):400-12.
30. Green L. Queueing Analysis in Health Care. In: Hall R, editor. Patient Flow: Reducing Delay in Healthcare Delivery. Boston, MA: Springer US; 2013. p. 361-84. Available from: https://doi.org/10.1007/978-1-4614-9512-3_15
31. Green LV, Nguyen V. Strategies for cutting hospital beds: the impact on patient service. Health services research. 2001;36(2):421-42.
32. Jacobson SH, Hall SN, Swisher JR. Discrete-Event Simulation of Health care Systems. In: Hall R, editor. Patient Flow: Reducing Delay in Healthcare Delivery. Boston, MA: Springer US; 2013. p. 273-309. Available from: https://doi.org/10.1007/978-1-4614-9512-3_12
33. Green LV, Liu N. A study of New York City obstetrics units demonstrates the potential for reducing hospital inpatient capacity. Med Care Res Rev. 2015;72(2):168-86.
34. Griffin J, Xia S, Peng S, Keskinocak P. Improving patient flow in an obstetric unit. Health Care Manag Sci. 2012;15(1):1-14.
35. Gombolay M, Golen T, Shah N, Shah J. Queueing theoretic analysis of labor and delivery : Understanding management styles and C-section rates. Health Care Manag Sci. 2019;22(1):16-33.
36. Takagi H, Kanai Y, Misue K. Queueing network model for obstetric patient flow in a hospital. Health Care Manag Sci. 2017;20(3):433-51.
37. Gordon GR, Pressman I, Milliken RA. Planning urban health facilities: A computer simulation approach to delivery room utilization. Computers & Urban Society. 1975;1(2):169-78.
38. Milliken RA, Rosenberg L, Milliken GM. A queuing theory model for the prediction of delivery room utilization. American Journal of Obstetrics and Gynecology. 1972;114(5):691-9.
39. Allen M, Thornton S. Providing one-to-one care in labour. Analysis of ‘Birthrate Plus’ labour ward staffing in real and simulated labour ward environments. BJOG: An International Journal of Obstetrics & Gynaecology. 2013;120(1):100-7.
40. Fetter RB, Thompson JD. The Simulation of Hospital Systems. Operations Research. 1965;13(5):689-711.
41. Cochran JK, Bharti A. Stochastic bed balancing of an obstetrics hospital. Health Care Manag Sci. 2006;9(1):31-45.
42. Ferraro NM, Reamer CB, Reynolds TA, Howell LJ, Moldenhauer JS, Day TE. Capacity planning for maternal-fetal medicine using discrete event simulation. Am J Perinatol. 2015;32(8):761-70.
43. Cooper RB. Queueing theory. Encyclopedia of Computer Science: John Wiley and Sons Ltd.; 2000. p. 1496-8.
44. Schneider D. A Methodology for the Analysis of Comparability of Services and Financial Impact of Closure of Obstetrics Services. Medical Care. 1981;19(4):393-409.
O
KCE Report 323Cs Organisation of maternity services in Belgium 61
45. Kolker A. Queuing Theory and Discrete Events Simulation for Health Care: From Basic Processes to Complex Systems with Interdependencies. In: Joel JPCR, editor. Health Information Systems: Concepts, Methodologies, Tools, and Applications. Hershey, PA, USA: IGI Global; 2010. p. 1874-915. Available from: http://services.igi-global.com/resolvedoi/resolve.aspx?doi=10.4018/978-1-60566-988-5.ch121
46. Zorgstrategisch plan Vlaanderen. Basis-specialistische zorg. DEEL II: Eindnota. 2019.
47. Benahmed N, Lefèvre M, Vinck I, Stordeur S. Alternative scenarios for the forecasting of the midwifery workforce: horizon scanning and quantification model. Health Services Research (HSR). Brussels: Belgian Health Care Knowledge Centre (KCE); 2019 04/2019. KCE Reports 312 Available from: https://kce.fgov.be/sites/default/files/atoms/files/KCE_312Cs_Horizon_Scanning_and_quantification_model_midwifery_Synthesis.pdf
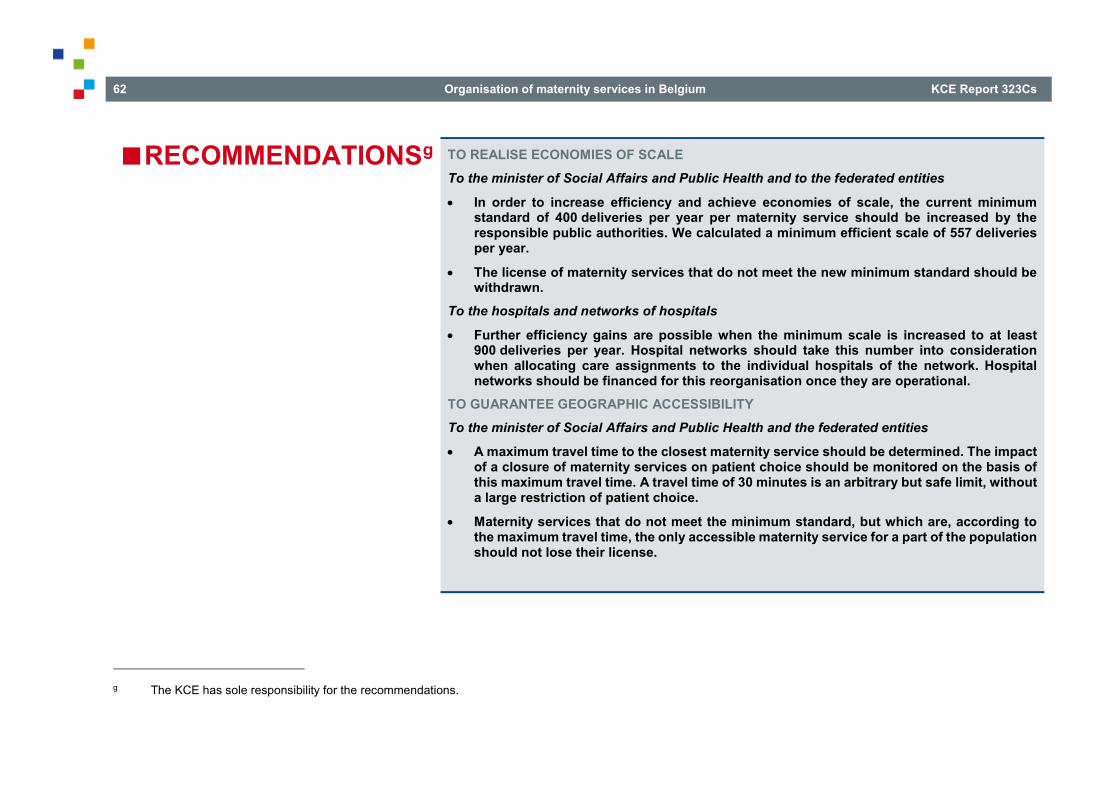
62 Organisation of maternity services in Belgium KCE Report 323Cs
■ RECOMMENDATIONSg
TO REALISE ECONOMIES OF SCALE To the minister of Social Affairs and Public Health and to the federated entities
• In order to increase efficiency and achieve economies of scale, the current minimum standard of 400 deliveries per year per maternity service should be increased by the responsible public authorities. We calculated a minimum efficient scale of 557 deliveries per year.
• The license of maternity services that do not meet the new minimum standard should be withdrawn.
To the hospitals and networks of hospitals
• Further efficiency gains are possible when the minimum scale is increased to at least 900 deliveries per year. Hospital networks should take this number into consideration when allocating care assignments to the individual hospitals of the network. Hospital networks should be financed for this reorganisation once they are operational.
TO GUARANTEE GEOGRAPHIC ACCESSIBILITY To the minister of Social Affairs and Public Health and the federated entities
• A maximum travel time to the closest maternity service should be determined. The impact of a closure of maternity services on patient choice should be monitored on the basis of this maximum travel time. A travel time of 30 minutes is an arbitrary but safe limit, without a large restriction of patient choice.
• Maternity services that do not meet the minimum standard, but which are, according to the maximum travel time, the only accessible maternity service for a part of the population should not lose their license.
g The KCE has sole responsibility for the recommendations.

O
KCE Report 323Cs Organisation of maternity services in Belgium 63
TO GUARANTEE THE REQUIRED BED CAPACITY To the minister of Social Affairs and Public Health, the hospitals and networks of hospitals
• The absorption capacity of the maternity services in the neighbourhood of the maternity services with less deliveries than the minimum efficient scale should be analysed. Hospital networks should take account of the absorption capacity in case of a closure of maternity services in the own network or in adjacent networks when allocating care assignments.
• A target value for the probability of waiting for a bed on the maternity service should be determined and the required bed capacity of an individual maternity service should be based on this target value instead of on a target occupancy rate.
• Capacity planning at the level of the networks should be based on timely access to a bed instead of on a target occupancy rate.
• The assessment of bed capacity needs should be revised periodically and adjusted when necessary. For example, when a new minimum standard for the yearly number of deliveries is implemented, the absorption capacity of the remaining maternity services should be estimated to guarantee timely access. The simulation model that was developed in this study can be used to explore the impact on bed capacity needs of a closure of hospital services.
TO CREATE THE NEEDED PRECONDITIONS To the hospitals and networks of hospitals
• Efficiency gains are achieved by closing smaller maternity services and by transferring their activities to larger maternity services. At the national level, the same number of deliveries can be achieved with less staff and beds. The cost savings that are realised in this way can be invested in higher nursing staff levels in other services.
To the minister of Social Affairs and Public Health
• A shift of justified activity between maternity services has no impact on the hospital budget at the macro level. The scale increase can lead to a lower number of maternity services with less than 1 000 deliveries per year. The decrease in the number of points for the N*-function should be invested in the hospital sector by maintaining the hospital budget.

64 Organisation of maternity services in Belgium KCE Report 323Cs
To the minister of Social Affairs and Public Health and the federated entities
• The proposed reform of the maternity services has important implications for all staff. When a hospital closes its maternity service, this also has consequences for other services and staff members. Measures should be taken to re-employ the excess staff. However, an analysis of the social impact of such a reform was beyond the scope of this study.
To the federated entities
• When a maternity service is closed, there are costs associated with the reallocation or temporary maintenance of the (empty) space. These costs should be taken into account in the financing system of hospital infrastructure by the federated authorities.
To the Federal Public Service of Public Health
• Evidence-informed decision making involves integrating the best available research evidence into decision making. The availability of up to date and accurate data is part of that research evidence. The daily staffing registration in the MZG – RHM (EMPLODAY), which was compulsory up to 2016, is an important source of information for efficiency analyses and allows policymakers to define and revise evidence-informed minimum activity standards. Therefore, this registration should be re-activated.
• In order to evaluate the efficient use of resources, such as hospital beds, operational beds as well as licensed beds should be registered by bed index in the MZG – RHM.

COLOPHON Title: Organisation of maternity services in Belgium – Short report
Authors: Mélanie Lefèvre (KCE), Nicolas Bouckaert (KCE), Cécile Camberlin (KCE), Stephan Devriese (KCE), Hilde Pincé (UZ Leuven), Christophe de Meester (KCE), Benoît Fricheteau (Institut Géographique National – Nationaal Geografisch Instituut), Carine Van de Voorde (KCE)
Project facilitator: Nathalie Swartenbroekx (KCE)
External experts: Leen Adriaenssens (GasthuisZusters Antwerpen (GZA)), Renilde Bastaens (Imeldaziekenhuis Bonheiden), Anne Batter (Vivalia IFAC Marche-en-Famenne), Yves Baukens (Europa Ziekenhuizen), Marion Boriau (Onze-Lieve-Vrouwziekenhuis Aalst), Carole Brakmeyn (Centre Hospitalier Bois de l’Abbaye Seraing), Laurens Cherchye (KU Leuven), Karin Debrouwer (AZ Groeninge Kortrijk), Erik Demeulemeester (KU Leuven), Katelijne De Koster (Federale Raad voor de Vroedvrouwen), Tracy De Weirdt (AZ Alma Eeklo), Hilde Fevery (AZ Sint-Lucas Gent), Bénédicte Goubau (CHU Saint-Pierre Bruxelles), Katrien Geusens (AZ Glorieux Ronse), Mélanie Homburg (CHR Huy), Anne Huygevelt (UZ Gent), Géraldine Jacques (CHC Clinique Saint-Vincent Rocourt), Annelies Mattheus (Heilig Hart Leuven), Betty Mervilde (O.L.V. van Lourdes Ziekenhuis Waregem), Lief Meulemans (AZ Turnhout), Pascale Neirynck (Hôpitaux Iris Sud Ixelles), Anne Niset (Association Francophone des Sages-femmes Catholiques (AFSFC)), Martine Paquet (CHIREC Hospital Braine L'Alleud-Waterloo), Honestina Perez Menendez (CHR de la Citadelle Liége), Marie-Claude Pierret (Vivalia CHA Libramont), Lisa Smans (ZNA), Katrien Theetaert (UZ Leuven), Delphine Thomas (CHR de Namur), Sabine Van de Vyver (Sint-Vincentiusziekenhuis Deinze), Sofie Verschoore (Jan Yperman Ziekenhuis Ieper), Lore Vanlangenakker (Ziekenhuis Oost-Limburg)
Stakeholders: Sophie Alexander (Groupement des Gynécologues Obstétriciens de Langue Française de Belgique (GGOLFB)), Koen Balcaen (Beroepsorganisatie voor verpleegkundigen (NVKVV)) en Algemene Unie van Verpleegkundigen van België (AUVB)), Joëlle Belpaire (AVIQ), Natascha Beugnier (COCOM – GGC), Tom Bovyn (Vlaamse Vereniging voor Obstetrie en Gynaecologie (VVOG)), Bernard Ceriez (Belgische Vereniging van Ziekenhuisdirecteurs (BVZD)), Emmanuelle Ceysens (Santhea), Benoît Collin (INAMI – RIZIV), Fréderic Debiève (Gezondheidsinstellingen Brussel Bruxelles Institutions de Santé (GIBBIS)), Isabelle Dehaene (UZ Gent), Paul d’Otreppe (Association Belge des Directeurs d'Hôpitaux (ABDH)), Luc De Catte (UZ Leuven), Katrien De Clippel (Gezondheidsinstellingen Brussel Bruxelles Institutions de Santé (GIBBIS)), Bart De Keersmaecker (Vlaamse Vereniging voor Obstetrie en Gynaecologie (VVOG)), Katelijne De Koster (Federale Raad voor de Vroedvrouwen), Hilde Fevery (AZ Sint-Lucas Gent), Marc Geboers (Zorgnet-Icuro), Marijke Ghijsels (FOD Volksgezondheid – SPF Santé Publique), Benoît Hallet (Union en Soins de Santé (UNESSA)), Bertrand Heymans (COCOM – GGC), Aline Hotterbeex (Union en Soins de Santé (UNESSA)), Anne Huygevelt (UZ Gent), Bernard Landtmeters (Landsbond Christelijke Mutualiteit (LCM)), Murielle Lona (Mutualités Libres (MLOZ)), Jan Mortier (Algemeen Christelijk Vakverbond (ACV)), Christian Moulart (Association Belge des Syndicats Médicaux (ABSYM)), Jacqueline Orban (Union Générale des Infirmiers de Belgique (UGIB)), Geert Peuskens (Vlaams Agentschap Zorg en Gezondheid),

Robert Rutsaert (Algemeen Syndicaat van Geneeskundigen van België (ASGB/Kartel), Katrien Scheerlinck (FOD Volksgezondheid – SPF Santé Publique), Caroline Sitarz (FOD Volksgezondheid – SPF Santé Publique), Stijn Vanholle (Domus Medica), Isabelle Van der Brempt (SPF Santé Publique – FOD Volksgezondheid), Johan Van Wiemeersch (Vlaamse Vereniging voor Obstetrie en Gynaecologie (VVOG)), Katrien Verschoren (Zorgnet-Icuro), Guillaume Westenbohm (Ministerium der Deutschsprachigen Gemeinschaft)
External validators: Geert Jan Kommer (Rijksinstituut voor Volksgezondheid en Milieu (RIVM), Nederland), Jon Magnussen (Norwegian University of Science and Technology, Norway), William Palmer (Nuffield Trust, England)
Acknowledgements: Ine Alaerts (FOD Volksgezondheid – SPF Santé Publique), Patrick Bruynseels (RIZIV – INAMI), Ellen De Wandeler (Beroepsorganisatie voor verpleegkundigen (NVKVV)), Ingrid Mertens (FOD Volksgezondheid – SPF Santé Publique), Koen Schoonjans (FOD Volksgezondheid – SPF Santé Publique), Nathalie Terryn (SPF Santé Publique – FOD Volksgezondheid), Siska Van Damme (Vlaamse Beroepsorganisatie van Vroedvrouwen (VBOV)), Katrien Verschoren (Zorgnet-Icuro), Vanessa Wittvrouw (Union Professionnelle des Sages-Femmes Belges (UPSfB))
Reported interests: All experts and stakeholders consulted within this report were selected because of their involvement in the organisation of maternity services in Belgium. Therefore, by definition, each of them might have a certain degree of conflict of interest to the main topic of this report.
Layout: Ine Verhulst
Disclaimer: ● The external experts were consulted about a (preliminary) version of the scientific report. Their comments were discussed during meetings. They did not co-author the scientific report and did not necessarily agree with its content.
● Subsequently, a (final) version was submitted to the validators. The validation of the report results from a consensus or a voting process between the validators. The validators did not co-author the scientific report and did not necessarily all three agree with its content.
● Finally, this report has been approved by common assent by the Executive Board (see http://kce.fgov.be/content/the-board).
● Only the KCE is responsible for errors or omissions that could persist. The policy recommendations are also under the full responsibility of the KCE.
Publication date: 16 January 2020
Domain: Health Services Research (HSR)

MeSH: Health Care Reform; Hospital Bed Capacity; Health Services Geographic Accessibility; Organizational Efficiency
NLM Classification: WX 100
Language: English
Format: Adobe® PDF™ (A4)
Legal depot: D/2019/10.273/67
ISSN: 2466-6459
Copyright: KCE reports are published under a “by/nc/nd” Creative Commons Licence http://kce.fgov.be/content/about-copyrights-for-kce-publications.
How to refer to this document? Lefèvre M, Bouckaert N, Camberlin C, Devriese S, Pincé H, de Meester C, Fricheteau B, Van de Voorde C. Organisation of maternity services in Belgium – Short report. Health Services Research (HSR) Brussels: Belgian Health Care Knowledge Centre (KCE). 2019. KCE Reports 323Cs. D/2019/10.273/67.
This document is available on the website of the Belgian Health Care Knowledge Centre.