ORGANISATION OF CONSULTANCY SERVICES -...
31
Chapter - 4 ORGANISATION OF CONSULTANCY SERVICES A well-conceived internal organisation design is absolutely necessary for achieving organisational objectives and delivering quality services to clients. Against this backdrop an indepth analysis is made of the socio-economic conditions of consultancy service firms in Kerala which would give an insight into the strengths and weaknesses of these firms. 4.1 Nature of Organisation - A consultancy organisation exists for making profits, achieving growth - by excelling competition and adding value to-- the clients. It may be organised like any other business as sole proprietorship, partnership, private limited company or public limited company. Table T2 shows the nature of organisation of consultancy services: Table T2 Nature of Consultancy Organisations Source : Research Data Nature of Organisation Sole Proprietorship Partnership Private Limited Company Public Limited Company Total No. of firms 78 38 69 15 200 Percentage 39 19 34.5 7.5 100
Transcript of ORGANISATION OF CONSULTANCY SERVICES -...

Chapter - 4
ORGANISATION OF CONSULTANCY SERVICES
A well-conceived internal organisation design is absolutely necessary
for achieving organisational objectives and delivering quality services to clients.
Against this backdrop a n indepth analysis is made of the socio-economic
conditions of consultancy service firms in Kerala which would give an insight
into the strengths and weaknesses of these firms.
4.1 Nature of Organisation
- A consultancy organisation exists for making profits, achieving growth -
by excelling competition and adding value to-- the clients. It may be organised
like any other business as sole proprietorship, partnership, private limited
company or public limited company. Table T2 shows the nature of organisation
of consultancy services:
Table T2
Nature of Consultancy Organisations
Source : Research Data
Nature of Organisation
Sole Proprietorship
Partnership
Private Limited Company
Public Limited Company
Total
No. of firms
78
38
69
15
200
Percentage
39
19
34.5
7.5
100

The table reveals that out of 200 consultancy firms studied, 78 firms
(39 per cent) are organised as sole proprietorship, 69 firms (34.5 per cent) are
private limited companies, 38 firms (19 per cent) are partnerships and the
remaining 15 firms (7.5 per cent) are public limited companies. It is evident
that sole proprietorship is the dominant form of organisation for consultancy
services. This is because of the fact that most of the consultancy firms are
organised on a small scale basis and they prefer to be self-employed. Architects,
tax consultants, engineering and project consultants mainly organise their
services as sole proprietorship. However, a good number of consultancy firms,
for example, software and human resources consultancy firms are now organised
as private limited companies.
Public Limited Company
7.5%
Private Limited M e Proprietorship
company 39.0%
34.5%
Partnership 1 9. P/o
Soie Proprietorship
I Private Lktlited Ccmpny
Fig. F8 Nature of Consultancy Organisations

4.2 Age of Consultancy Organisation
Table T3 shows the distribution of consultancy firms on the basis of
the number of years of their existence since their inception.
Table T3
Age of Consultancy Organisations
Source : Research Data
Age in Years
Less than 5 years
Between 5 and 10 years
Above 10 years
Total
The study reveals that the majority of the consultancy firms
(68.5 per cent) have been in existence for less than ten years. The average age
No. of firms
57
80
63
200
of consultancy firms is approximately 7.65 years. Therefore, it is concluded
Percentage
28.5 .
40
31.5
100
that organised consultancy services in the State are of recent origin and are still
in their developing stage. It is realised that it is only of late that the economic
scenario became more complex and diversified in the State of Kerala and
clients felt the need for expert advice on their business matters.
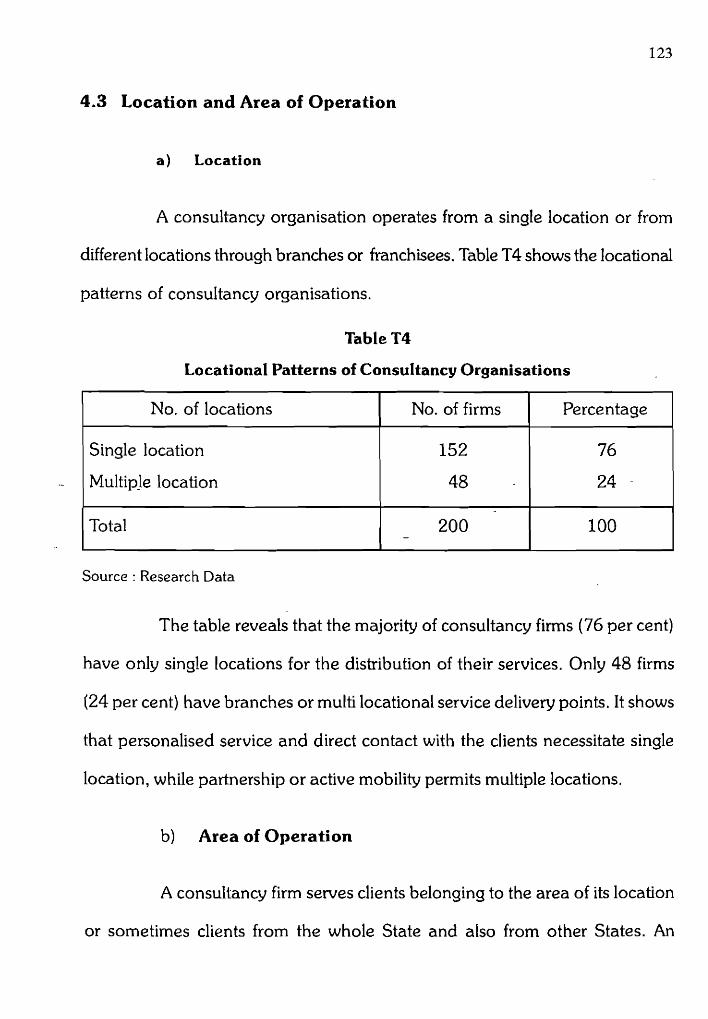
4.3 Location and Area of Operation
a) Location
A consultancy organisation operates from a single location or from
different locations through branches or franchisees. Table T4 shows the locational
patterns of consultancy organisations.
Table T4
Locational Patterns of Consultancy Organisations
Source : Research Data
No. of locations
Single location
Multiple location
Total
The table reveals that the majority of consultancy firms (76 per cent)
have only single locations for the distribution of their services. Only 48 firms
(24 per cent) have branches or multi locational service delivery points. It shows
that personalised service and direct contact with the clients necessitate single
location, while partnership or active mobility permits multiple locations.
b) Area of Operation
No. of firms
152
48
200 -
A consultancy firm serves clients belonging to the area of its location
or sometimes clients from the whole State and also from other States. An
Percentage
76
24 -
100

analysis of the nature of area of operation of consultancy firms is presented in
Table T5.
Table T5
Area of Operation of Consultancy Organisations
Within the District
Within the State
Outside the State also
-
Source : Research Data
,-
~ h e table shows that the majority of the consultancy firms
(84 per cent) serve clients belonging to the same District or State in which they
are located. It indicates the regional nature of the area of operation. Only 32
firms (16 per cent) have operations outside the State and few respondents,
most of them software consultancy firms, have clients from overseas. It reveals
that consultancy firms mainly focus on satisfying the needs of local clients,
thereby ensuring quality of services.
4.4 Areas of Consultancy Sewices
The areas of consultancy services are vast and wide. These are
grouped under eight broad categories for the purpose of the study. Many

125
consultancy organisations offer more than one line of consultancy services.
Management consultants simultaneously offer tax consultancy, investment
consultancy, project consultancy etc. Similarly some software consultancy firms
also carry out computer training and education. Therefore, consultancy firms
are classified on the basis of their important service in the service product line.
Table T6 gives the composition of respondents from different areas of consultancy
services.
Table T6
Distribution of Consultancy firms based on Nature of Consultancy Services
Source : Research Data
Area of Consultancy Services -
Management Consultancy
Investment Consultancy
ProjectIEngineering Consultancy
Software Consultancy
Employment/Educational Consultancy
Architechts / Interior Design Consultancy
Tax Consultancy
Others
Total
No. of firms
48
2 0
32
24
14
30
24
8
200
Percentage
24 -
10
16
12
7
15
12
4
100
The table reveals that management consultancy, projecvengineering
consultancy and architecture /interior design consultancy together come to
55 per cent of the total consultancy services in the State. This shows that these
three are the major consultancy services commonly practiced in the State. Of
these management consultancy occupies 24 per cent of the total consultancy
services. This is owing to the fact that it is an area having wider scope of
services like organisational restructuring, capital reorganisation, financial
collaboration, amalgamation, takeovers, rehabilitation, cost management,
quahty control, marketing research, protection of patent rights and trade marks etc.
The table also indicates that other consultancy services like investment --
consultancy, software consultancy and tax consultancy are also actively
- practised in the Sate since they share 34 per cent of the total consultancy
services in the State.
The category of 'others' in the table includes consultancies in the
areas of event management, travel and tourism, advertising and immigration
services.
4.5 Number of Consultants Employed
Table T7 shows the number of consultants employed by consultancy
organisations.
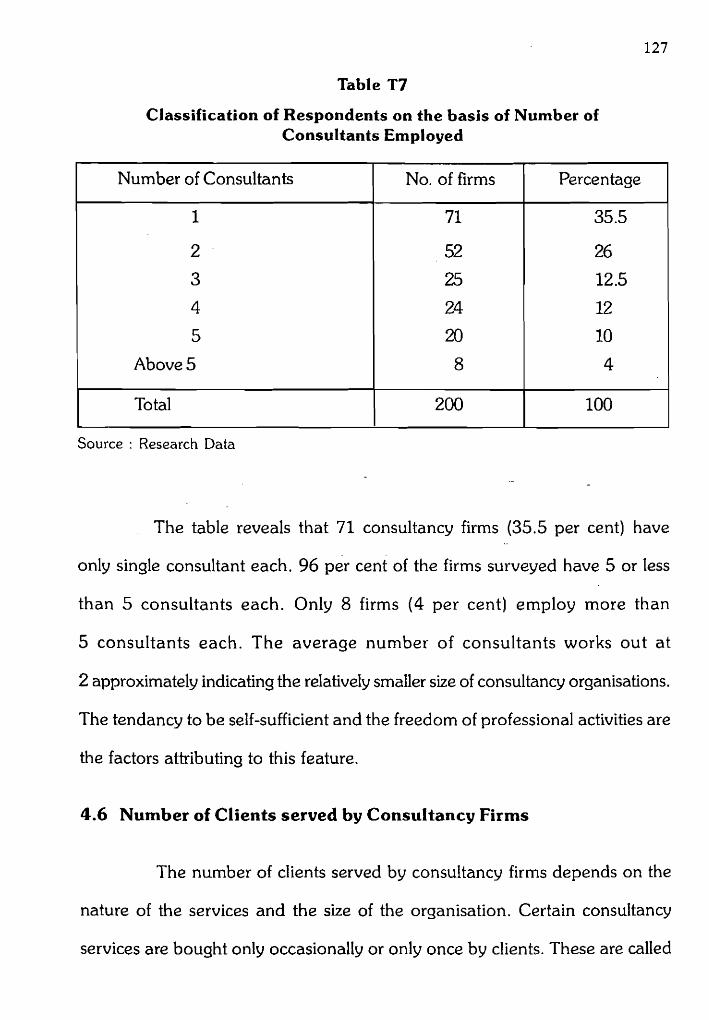
Table T7
Classification of Respondents on the basis of Number of Consultants Employed
Source : Research Data
Number of Consultants
1
2
3
4
5
Above 5
Total
- The table reveals that 71 consultancy firms (35.5 per cent) have
only single consultant each. 96 per cent of the firms surveyed have 5 or less
than 5 consultants each. Only 8 firms (4 per cent) employ more than
5 consultants each. The average number of consultants works out at
2 approximately indicating the relatively smaller size of consultancy organisations.
The tendancy to be self-sufficient and the freedom of professional activities are
the factors attributing to this feature.
4.6 Number of Clients served by Consultancy Firms
No. of firms
71
52
25
24
20 8
The number of clients served by consultancy firms depends on the
nature of the services and the size of the organisation. Certain consultancy
services are bought only occasionally or only once by clients. These are called
Percentage
35.5
26
12.5
12
10
4
F I 200 100
new buys, for example, services of architects, interior decorators, project
consultancies etc. While some other services are frequently demanded by
clients. These are termed as repeated buys or modified rebuys. These include
services like investment consultancy, tax consultancy, human resources
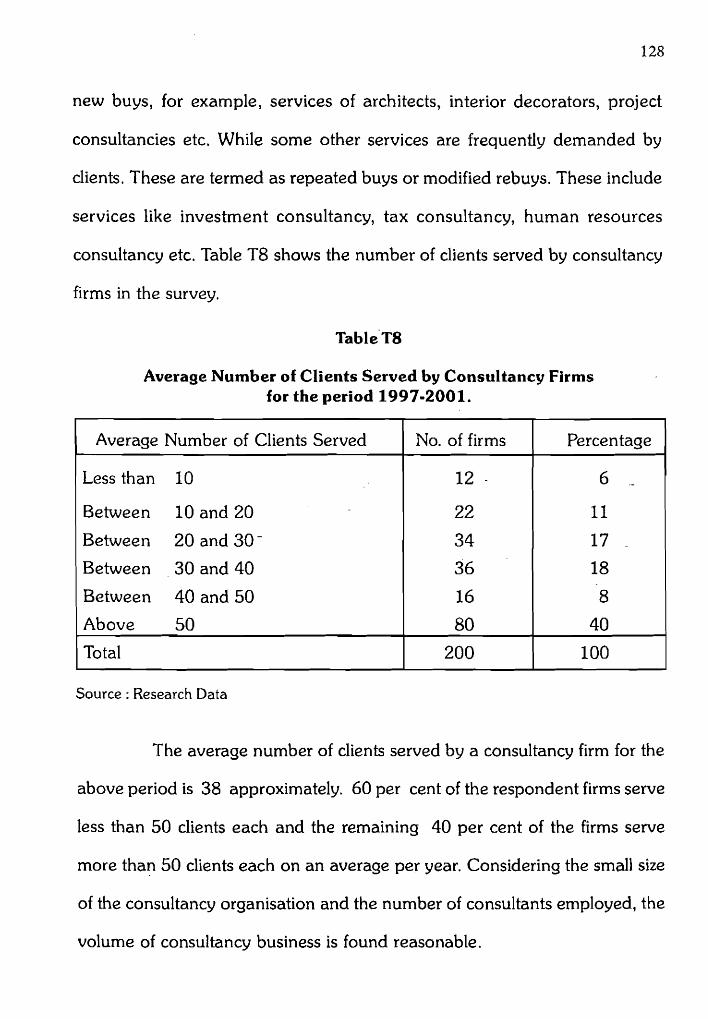
consultancy etc. Table T8 shows the number of clients served by consultancy
firms in the survey.
Table T8
Average Number of Clients Served by Consultancy Firms for the period 1997=2001.
Source : Research Data
Average Number of Clients Served
Less than 10
Between 10 and 20
Between 20 and 30-
Between 3 0 and 40
Between 40 and 50
Above 50
Total
The average number of clients served by a consultancy firm for the
above period is 38 approximately. 60 per cent of the respondent firms serve
less than 50 clients each and the remaining 40 per cent of the firms serve
more than 50 clients each on an average per year. Considering the small size
of the consultancy organisation and the number of consultants employed, the
volume of consultancy business is found reasonable.
No. of firms
12 -
22
34
36
16
80
200
Percentage
6 .-
11
17 ..
18
8
40
100

4.7 Capital Investment in Consultancy Firms
Table T9 gives the classification of consultancy firms on the basis of
capital investments as on the date of the survey.
Table T9
Capital investment in Consultancy Firms
Source : Research Data -
Investments (Rs. in lakhs)
Less than 2
Between 2 and 5
Between 5 and 10
Above 10
Total -
The average investment (median) in consultancy firm is
approximately Rs. 4.46 lakhs. It indicates the relatively low investment required
by consultancy organisations.
It is found in the study that capital investment in consultancy service
firms includes cost of office building, equipments, furniture and other
infrastructure for delivering the services. Capital investment again depends on
the nature of services offered and the size of operation. Consultancy
organisations like that of tax consultants, architects, placement services etc.
require as little investpent as Rs. 50,000 or so. There are also firms having
investment ranging into crores of rupees in the consultancy services.
No, of firms
45
67
42
46
200
Percentage
22.5
33.5
21
23 100

4.8 Number of Employees in the Organisation
Consultancy services are highly people-oriented. There is high degree
of personal contact in the service delivery process. Table TI0 shows the number
of persons employed in consultancy organisation as on the date of the
survey.
Table TI0
Table Showing Number of Employees in Consultancy Organisations
Source : Research Data
Number of Employees
Less than 5
Between 5 and 10
Between 10-and 15 -
Between 15 and 20
20 and above
Total
The table reveals that out of 200 firms studied 79 firms (39.5 per
cent) have less than 5 employees in their organisations. 84.5 per cent of the
consultancy firms have less than 20 employees in their organisations. The
average number of persons employed is approximately 10. This clearly indicates
the lean structure of consultancy organisations. The number of service personnel
employed is low on account of the small size of consultancy firms.
No. of firms
79
45
20
25
31
200
Percentage
39.5
22.5
10
12.5
15.5
100

4.9 Revenue Earned by Consultancy Organisations
Fees charged from clients for consultancy services constitute- the
source of revenue of consultancy firms. Income from sale of products supporting
the services and also from other lines of services are not considered under
revenue. Table TI 1 gives the average revenue earned by consultancy firms
for the period 1997-2001.
Table TI1
Average Revenue Earned by Consultancy Organisations
Source : Research Data
Average Revenue (Rs. in lakhs)
Less than 5 - -
Between 5 and 10
Between 10 and 15
Between 15 and 20
20 and above
Total
The average revenue earned by a consultancy organisation for the
above period is Rs. 9,70,000. 34 per cent of the firms are earning revenue
below Rs. 5 lakhs and 60 per cent of the firms are earning revenue below
Rs.10 lakhs. It is realised that the present revenue earned by the consultancy
firms under survey are sufficient to recover fully all the costs of operations,
leaving a reasonable amount of surplus.
No. of firms
- 68
52
30
24
26
200
Percentage
34
26
15
12
13
100

4.10 Factors Contributing to the Growth of Consultancy Services
Several factors contribute to the growth of consultancy services.
Sophistication in human life, complexities of modern business, increasing
opportunities, changes in economic/technological environment are the
important factors contributing to the development of consultancy services.
The respondents evaluation of these factors is presented in Table T12.
Factors Contributing to the Growth of Consultancy Services
Source : Research Data
Total
200
200
200
200
Factors
Sophistication in human life
Complexities of problems
Increasing opportunities
Environmental/ Technologica. changes
Total
No. of Respondents
Ran king I
30
141
18
I1
200
11
135 ..
19
6
40
200
- III.
15
30
124
31
200
- IV
20
10
52
118
200

Table T12A
Ranking of the Factors Contributing to the Growth of Consultancy Services
Source : Research Data
Factors
Sophistication in human life
Complexities of problems
Increasing opportunities
Environmental/ Technological changes
Complexities of problems is stated as the most important reason for
the growth of consultancy services in the study. Out of 200 respondents 141.
Mean Score
2.875
3.455
1.95
1.72
(70.5 per cent) consider it as the most important. 30 respondents (15 per cent) --
consider sophistication in human life as the most important reason, 18 ,
Rank
I1
i
111
IV
respondents (9 per cent) consider increasing opportunities as the most important
reason, while 11 firms (5.5 per cent) say that environmental/ technological
changes as the most important reason contributing to the growth of consultancy
services.
The second important reason is sophistication in human life. 135
respondents (67.5 per cent) consider it as the second important reason for the
growth of consultancy services.
124 respondents (62 per cent) consider increasing opportunities in
education, employment, business or profession as the third important reason
for the growth of consultancy services.

Environmental/technological changes is considered as the fourth
important factor by 118 respondents (59 per cent).
4.11 Extent of Competition in Consultancy Services
Competition in consultancy services leads to better quality of service
and wider choice to clients. Table TI3 shows the opinion of respondents
regarding the nature and extent of competition in consultancy services.
Table T13
Extent of Competition in Consultancy Services
Source : Research Data
All the respondents agree that there is competition in the field of
consultancy services. 42.5 per cent of the respondents state that there is severe
competition, 35.5 per cent are of opinion that the competition is moderate and
the remaining 22 per cent state that there is only limited competition in the
field of consultancy services. It is noted that it is the increase in the number of
consultancy organisations that has resulted in severe competition. It is inferred
Percentage
42.5
35.5
22 .O
0
100
Extent of Competition
Severe competition .-
Moderate competition
Limited competition
No competition at all
Total
No. of firms
85
71
44
Nil
200

that the high degree of competition calls for high professionalism and greater
efficiency on the part of the consultants in order to survive successfully in their
field.
4.12 Acceptance of Marketing Principles by Consultancy Organisations
It is a pertinent question to be analysed in detail whether there is a
need for applying marketing principles to consultancy services. Table TI4
shows attitudes of respondents towards adopting marketing principles for their
consultancy services.
Table TI4
Attitudes of Consultancy Firms towards adopting Marketing
Source : Research Data
The table reveals that most of the consulting firms (82 per cent)
recognise the need for adopting marketing in consultancy services. It indicates
that consultancy firms are generally proactive to marketing because of the
multifarious benefits it offers to them. It is seen that marketing is now increasingly
being applied by many consultancy firms for excelling competition and better
Percentage
82
18
100
Particulars
Marketing is needed
Marketing is not needed
Total
No. of firms
164
36
200
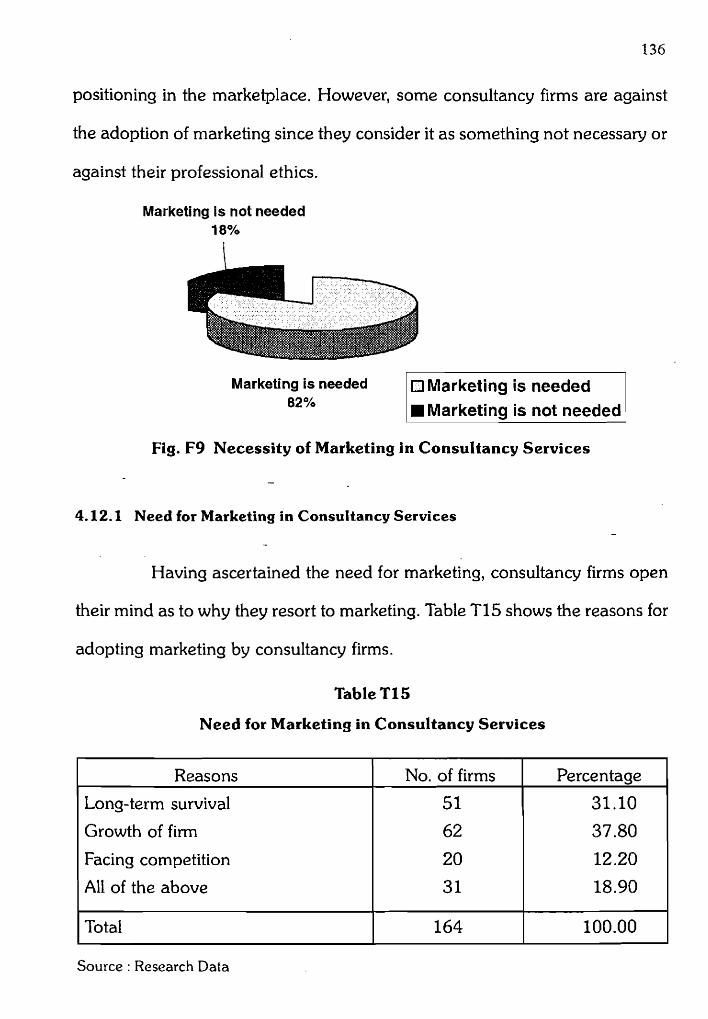
positioning in the marketplace. However, some consultancy firms are against
the adoption of marketing since they consider it as something not necessary or
against their professional ethics.
Marketing is not needed 18%
I
Marketing is needed 1 Marketing is needed I 82% 1 Marketing is not needed (
Fig. F9 Necessity of Marketing in Consultancy Services
4.12.1 Need for Marketing in Consultancy Services -
Having ascertained the need for marketing, consultancy firms open
their mind as to why they resort to marketing. Table TI5 shows the reasons for
adopting marketing by consultancy firms.
Table TI5
Need for Marketing in Consultancy Services
Source : Research Data
Reasons
Long-term survival
Growth of firm
Facing competition
All of the above
Total 164 100.00
No. of firms
51
62
20
31
Percentage
31.10
37.80
12.20
18.90

The table reveals that out of 164 respondents who consider marketing
as necessary, 62 firms state that marketing is necessary for the growth of firms,
51 firms account it for long-term survival, 20 for facing competition and 31 for
all of these reasons. It is inferred from the analysis that the consultants realise
that the consultancy firms need appropriate marketing strategies for retaining
existing clients and attracting new prospects.
All of the above 18.90% Long-term su wiva l
Facing competition 12.20%
1
Growth of firm 37.80%
Long-term survival Growth of firm
/ Facing competition /
Fig. F10 Reasons for Adopting Marketing in Consultancy Services
4.12.2 Reasons for not Recognising Marketing Function
The consultancy firms which do not support marketing state that it is
against ethics, not relevant or the firm is too small to afford a separate marketing
department. Table TI6 shows reasons for not recognising marketing by some
consultancy organisation.

Table TI6
Reasons why Marketing is not Necessary
Source : Research Data
Reasons
Marketing is against ethics
Marketing is not relevant
Firm is too small
Total
The table indicates that out of 36 respondents who consider marketing
as not necessary for consultancy service firms, 20 firms are of the opinion that
No. of firms
20
3
13
36
marketing is against ethics and hence not necessary, 13 firm.^ account it for the
smallness of the firm and the remaining 3 firms account it for the irrelevance of
marketing concept in the context of consultancy services. However, the arguments
Percentage
55.56
8.33
36.11
100
against marketing are not tenable in the context of liberaiised thinking and
professional freedom according to the opinions of the majority of consultants
who support marketing.
4.13 Classification of Activities (Departmentalisation) in Consultancy
Services
Departmentalisation is the process of grouping of operating tasks into
jobs, the combining of jobs into effective work groups and the combining of
groups into divisions called departments. Activities of a consultancy organisation

are classified on the basis of functions, products (services), areas or clients,
Table TI7 shows the classification of activities of consultancy organisations.
Table TI7
Classification of Activities of Consultancy Organisations
Source : Research Data
The table reveals that 98 firms (49 per cent) organise their activities
on the basis of functions, 80 (40 per cent) on the basis of services provided
and 22 (11 per cent) on the basis of their clients. No firm is found organising
its activities based on the geographical area of its services. It is seen that most
of the consultancy firms classify their activities on the basis of functions or
services mainly because of simplicity, flexibility, ease of co-ordination, operation
and control.
Basis of Classification
Functions
Services
Areas
Clients
Total
4.14 Number of Departments in Consultancy Organisations
Table 18 shows the number of departments in consultancy
organisations.
No. of firms
98
80
Nil
22
200
Percentage
49
40
Nil
11
100

Table T I 8
Number of Departments in Consultancy Organisations
Source : Research Data
Departments
Service Department
Marketing Department
Finance Department
Accounting Department
Personnel Department
(N = 200)
- The table indicates that 169 firms (84.5 per cent) have service
departments in their organisations. Only 56 firms (28 per cent) have separate
No. of firms
i69
56
45
33
4
marketing departments in their organisations. 45 firms have finance
departments, 33 have accounting departments and only four firms have
personnel departments in their organisations.
Percentage
84.5
28
22.5
16.5
2
Thus it is found that the activities of a consultancy organisation are
organised under departments each in charge of a function like service, marketing,
finance, accounting and personnel. A large consultancy organisation has more
departments depending upon the importance of these functions in the
organisation. In a small consultancy organisation all these functions are
discharged by a single department, most probably by the service department.

Servlce deparment Marketing Flname department Accounting Personnel department department department
- DEPARTMENT
Fig. F11 Departments in Consul tancy Organisat-ions
4.15 Delegation of Authority in Consultancy Organisations
In consultancy firms it is found necessay to delegate adequate authority
to lower levels so that the persons responsible for delivering the services can
effectively interact with the clients. At the same time the consultant retains
some key functions so as to ensure quality of service and better client satisfaction.
Only a decentralised consultancy firm can meet customer expectations effectively.
It is revealed in the study that all the consultancy organisations practise
delegation of authority to lower levels for better operational efficiency. There is

good extent of decentralisation of activities in almost all the firms and staff at
lower levels are fully motivated to deliver the clients best of their services.
4.16 Organisation Structure in Consultancy Services '
Organisation structure is primarily concerned with the allocation of
tasks among members of the organisation. According to the different practices
of allocation of authority and responsibility among persons, several types of
organisation structure have been evolved. These are the departmental and
line organisation, line and staff organisation, functional organisation and
committee organisation. Table T I 9 shows the organisation structure of
consultancy oiganisations.
Table TI9
Organisation Structure of Consultancy Firms
Source : Research Data
32 per cent of the respondents state that the organisation structure is
not clearly defined. These are either proprietary concerns or consultancy
Percentage
40 5.5
22.5 Nil 32
100
Nature of Organisation Structure
Departmental and line organisation Line and staff organisation Functional organisation Committee organisation Not clearly defined
Total
No. of firms
80 11 45 Nil 64
200

organisations with few number of members. 40 per cent of the consultancy
organisations follow the departmental and line organisation. 22.5 per cent of
the firms follow the functional form of organisation structure while 5.5 per cent
follow the line and staff form. It is revealed in the study that no firm follows the
committee form of organisation structure. Thus it is inferred from the analysis
that consultancy organisations, generally being organised on a small scale with
limited area of operation, follow a simple form of organisation structure with
clear cut line of authority and responsibility.
4.17 Organisation Chart in Consul tancy Organisations
Organisation chart is a diagrammatic representation of the network
of relations between the various positions in an organisation. Table T20 shows -
the classification of consultancy organisations on the basis of organisation charts.
Table T20
Classification of Consultancy firms on the basis of Organisation Charts
Source : Research Data
Particulars
Firms having organisation charts
Firms not having organisation charts
Total
The table indicates that 52 per cent of the consultancy organisations
have organisation charts and the remaining do not have any organisation charts.
No. of firms
104
96
200
Percentage
52
48
100
It is known from the study that in small consultancy organisations like that of
architects or project consultants, the consultant himself is the chief executive or
organisational head. The authority descends to the lower levels through systematic
assignment of functions to each person in the organisation. In large consultancy
firms, the consultant acts as a departmental head supervising the specific
functions of his department. He may also act as a 'Staff' with advisory roles in
certain organisations. In software consultancy, the consultants are employed as
'Staff' functionaries to develop specific software for serving the needs of clients.
4.18 Manpower Requirements and Training in Consultancy
-- Organisations
~onsultants are well qualified professionals in the area of their
services. Some of them are also members of professional bodies like Council
of Architects, Institute of Chartered Accountants, Institute of Cost Accountants
etc. Consultants may practice independently or may join any consultancy firm
as employees or partners.
4.18.1 Procedure for Selection of Consultants
From interviews and discussions with respondents it is pointed out
that most of the consulting firms have been recruiting consultants through
direct interview method. A few of them especially the software consulting

firms use the campus interview method for selection of consultants. Consultants
are appointed taking into consideration their qualifications, work experience,
motivations, aspirations, ability to communicate and leadership qualities.
4.18.2 Training of Consultants
It is found in the study that consultants are first appointed at assistant
or junior levels in many consultancy organisations. They are given adequate
training at this level. The respondents state that the methods of training include
on the job training, attending seminars, workshops and oral presentations. In
large consultancy firms, consultants appointed are given opportunities to grow
from the level of Assistant Consultants to a Senior-Consultant and goes on to
become a Service Head or a Regional Head. 1t is also revealed in the study -
that some consultancy firms offer very elaborate career design programmes to
those who have proven their worth at the entry level.
4.18.3 Manpower Planning in Consultancy Services
Planning of future requirements of consultants is very essential for
efficient operation and facing competition in the long run. However, this aspect
is totally ignored and little or no planning is done to meet future requirements
of consultants by most of the consultancy firms. It is revealed by some
respondents that the firm hires a person when a consultant quits or the need
arises. Such practices often lead to poor choice of consultants.
It is revealed in the study that there has been no difficulty in getting
qualified consultants by these firms. Consultants are suitably rewarded and
career development prospects are also bright in most of the consultancy firms.
It is also reported that labour turnover is very low in the field of consultancy
services.
It is necessary to give a certain degree of autonomy and discretion to
consultants while taking up client problems. Professional freedom and '
independence are required for delivering better quality services. The study
reveals that most of the consultancy organisations give necessary authority
and freedom to consultants to take up independent assignments and offer -
expert advice or solutions to clients' needs or problems. -
4.19 Guiding Principles and Code of Conduct for Consultants
The opinion of consultants regarding application of code of conduct
for consultancy services is presented in Table T21.
Table T21
Code of Conduct Applicable to Consultancy Services
Source : Research Data
Particulars
Consultancy firms are subject to specific code of conduct
Consultancy firms are not subject to specific code of conduct
Total
No, of firms
136
64
200
Percentage
68
32
100

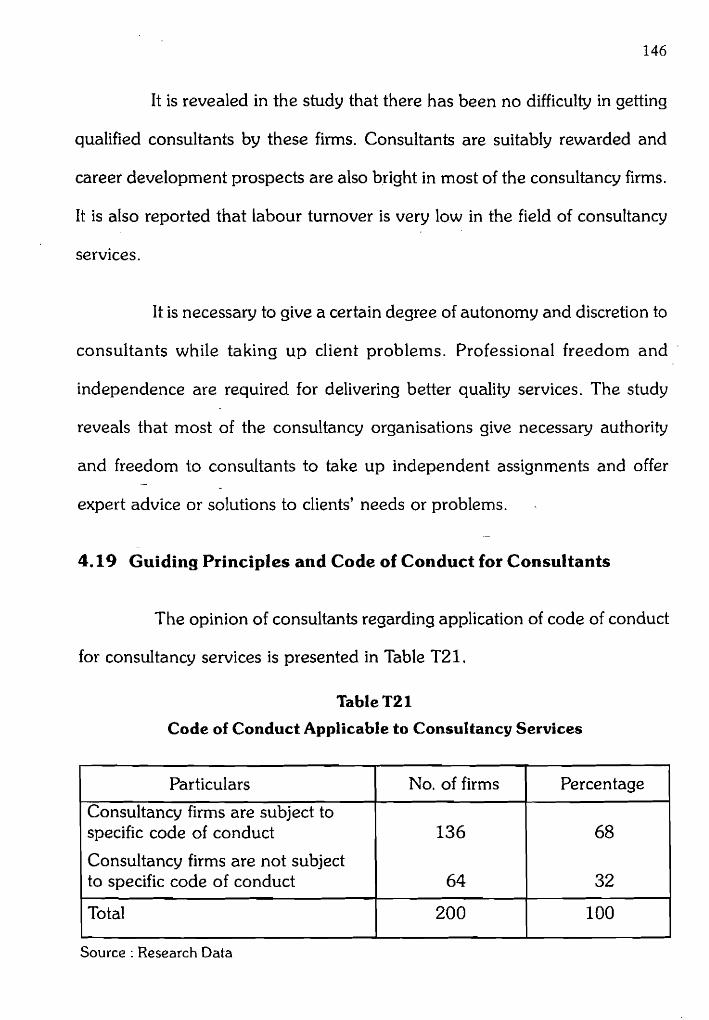
136 respondents (68 per cent) in the study state that consultants are
subject to specific code of conduct in their services, while the remaining 64
firms (32 per cent) state in the negative. It is revealed that there is no uniform
code of conduct or universally accepted guidelines applicable to all consultants.
These are governed mostly by conventions and the Rules of professional bodies
to which they are associated. Some of these are codified and found in the
respective Acts like the Chartered Accountants Act, 1949, The Companies
Act, 1956, T h e Securities and Exchange Board of India Act, 1992 etc.
Consultancy firms are not subject to specific code of
conduct
conduct 68%
Consultancy firms are subject to specific code of conduct Consultancy firms are not subject to s~ecific code of conduct
Fig. F12 Code of Conduct for Consultants
Consultants are unanimous in their opinion regarding service quality
and client satisfaction. They state that a consultant must be competent,
trustworthy, of good integrity and caring for clients. He must maintain secrecy

regarding operations of client and adhere to the time schedule agreed upon.
Some of the comments of consultants interviewed in this respect are:
- 'the services of the consultant must be result-oriented.'
- 'the consultant shall render the best services possible according
to the expectations of his clients.'
- 'he must give the best value for the fees paid.'
4.20 Liability of Consultants to Clients
Consultants are expected to give expert advice or solutions to clients' -
problems. They shall not be negligent in their duties and responsibilities to
their clients. Consultants have only advisory roles and they may not often
engage in the implementation of the recommendations. Therefore, whether
the consultants have any personal liability towards the clients for deficiency of
services is yet to be settled. Some of the recent judgements of the consumer
courts in the country point to the fact that service providers are liable for
deficiency of services. Therefore, it is beyond doubt that consultants are liable
for proved misconduct or deficiency in their services.
The opinion of consultants in this respect is, however, not unanimous
as shown in Table T22.

Table T22
Classification of Respondents on the basis of Liability of Consultants for Deficiency of Services
Source : Research Data
The table reveals that 80.5 per cent of the respondents favour the
view that consultants are personally liable to clients for the deficiency of services.
The remaining -19.5 per cent state-that the consultants are not liable.
Percentage
80.5
19.5
100.0
Particulars
Consultant is liable
Consultant is not liable
Total
The nature of liability, as stated by the respondents who support the
view, includes damages for loss arising to the clients, refund of fees or loss of
clients. Penalties, disciplinary actions or even removal of membership from
professional bodies are also stated as the consequences of dishonest acts by
consultants.
No, of firms
161
39
200
Upon an indepth analysis of the organisation of consultancy services
it can be concluded that the ability of a consultancy organisation to respond to
the changing requirements of a liberalised economic environment and increasing
expectations of clients depends on its internal strength. The organisation design
must be well-structured to meet these challenges. It must be simple, proactive
to changes and based on accepted principles with complete delimination on

authorities and responsibilities. The object of the organisation design in
consultancy services must be better client service, faster decision-making and
improvement in productivity and profitability.
It is found in the analysis that many consultancy organisations lack
the internal strengths and vibrant organisation structures. Though there is an
increasing awareness among consultancy organisations regarding the role of
marketing many of them are found reluctant in applying marketing in their
organisations. It is not the number of consultants or service personnel but the
qualitative skills and professionalism that determine the efficiency of the
organisation. But not much attention is given to strengthen the skills of -
consultants..and service personnel in the organisations as revealed in the study.